
Ductile Fracture Prediction of X80 Pipeline Steel Using Void Growth Model

Abstract
:1. Introduction
2. Theories of VGM and Plasticity
2.1. Void Growth Model
2.2. Theory of Plasticity
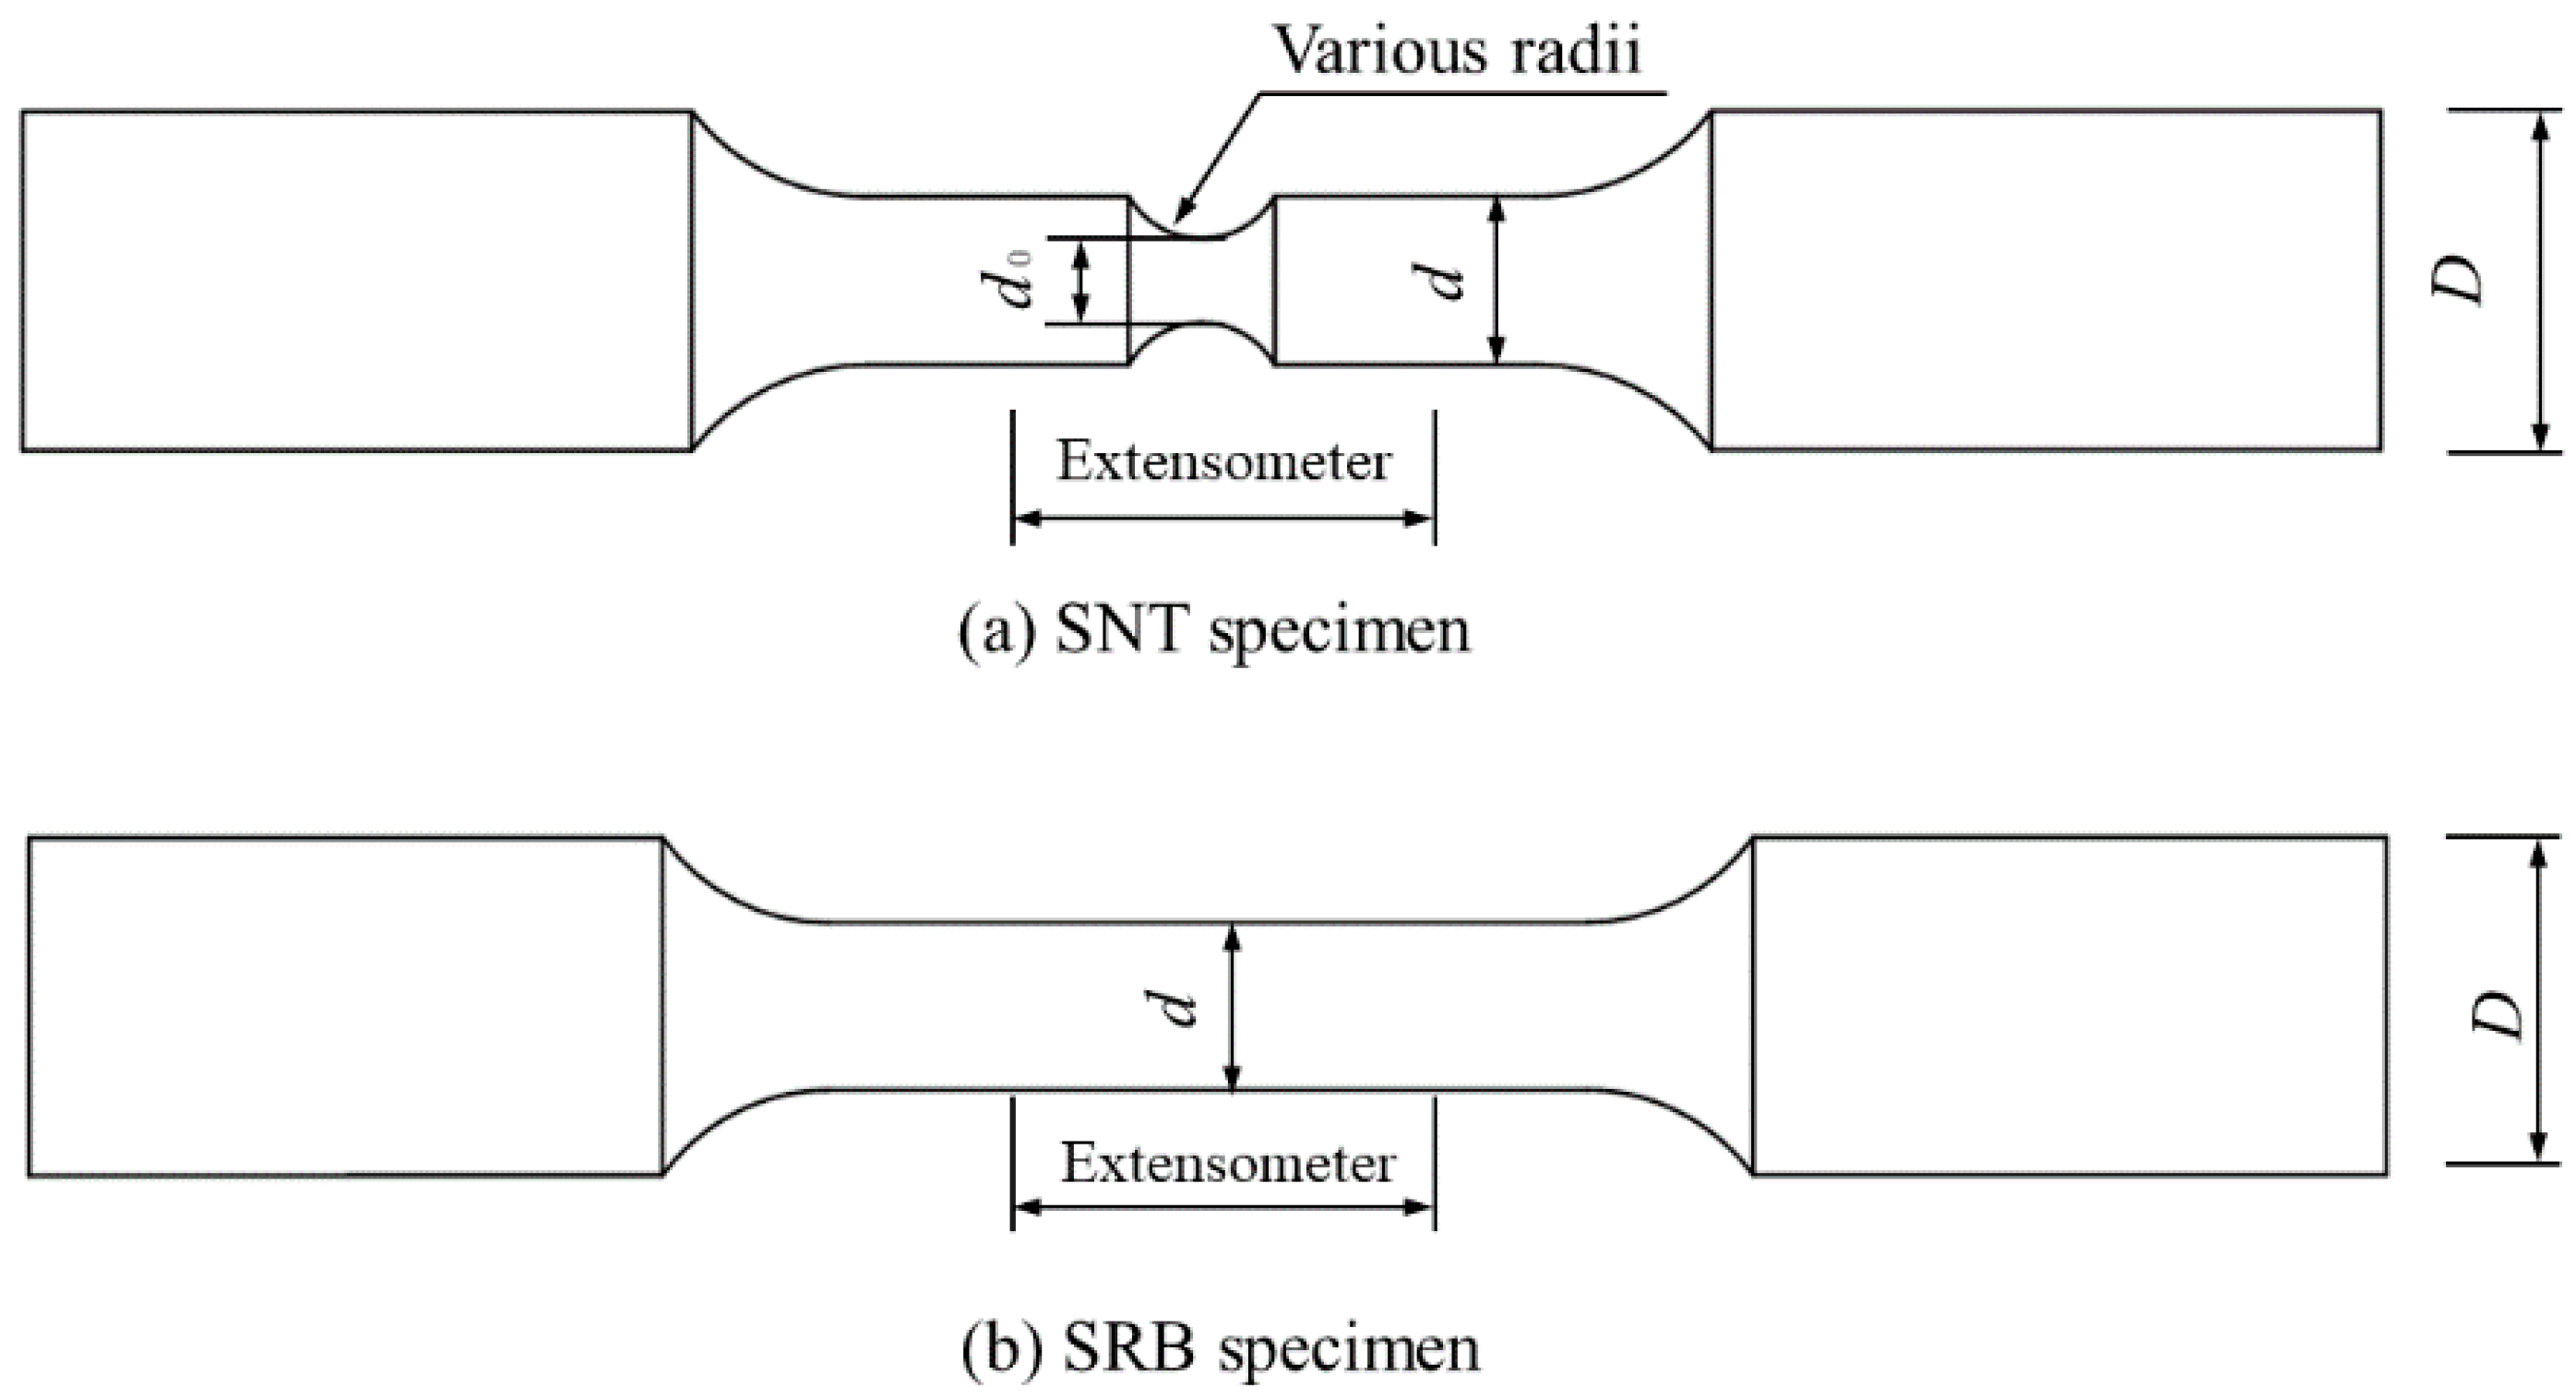
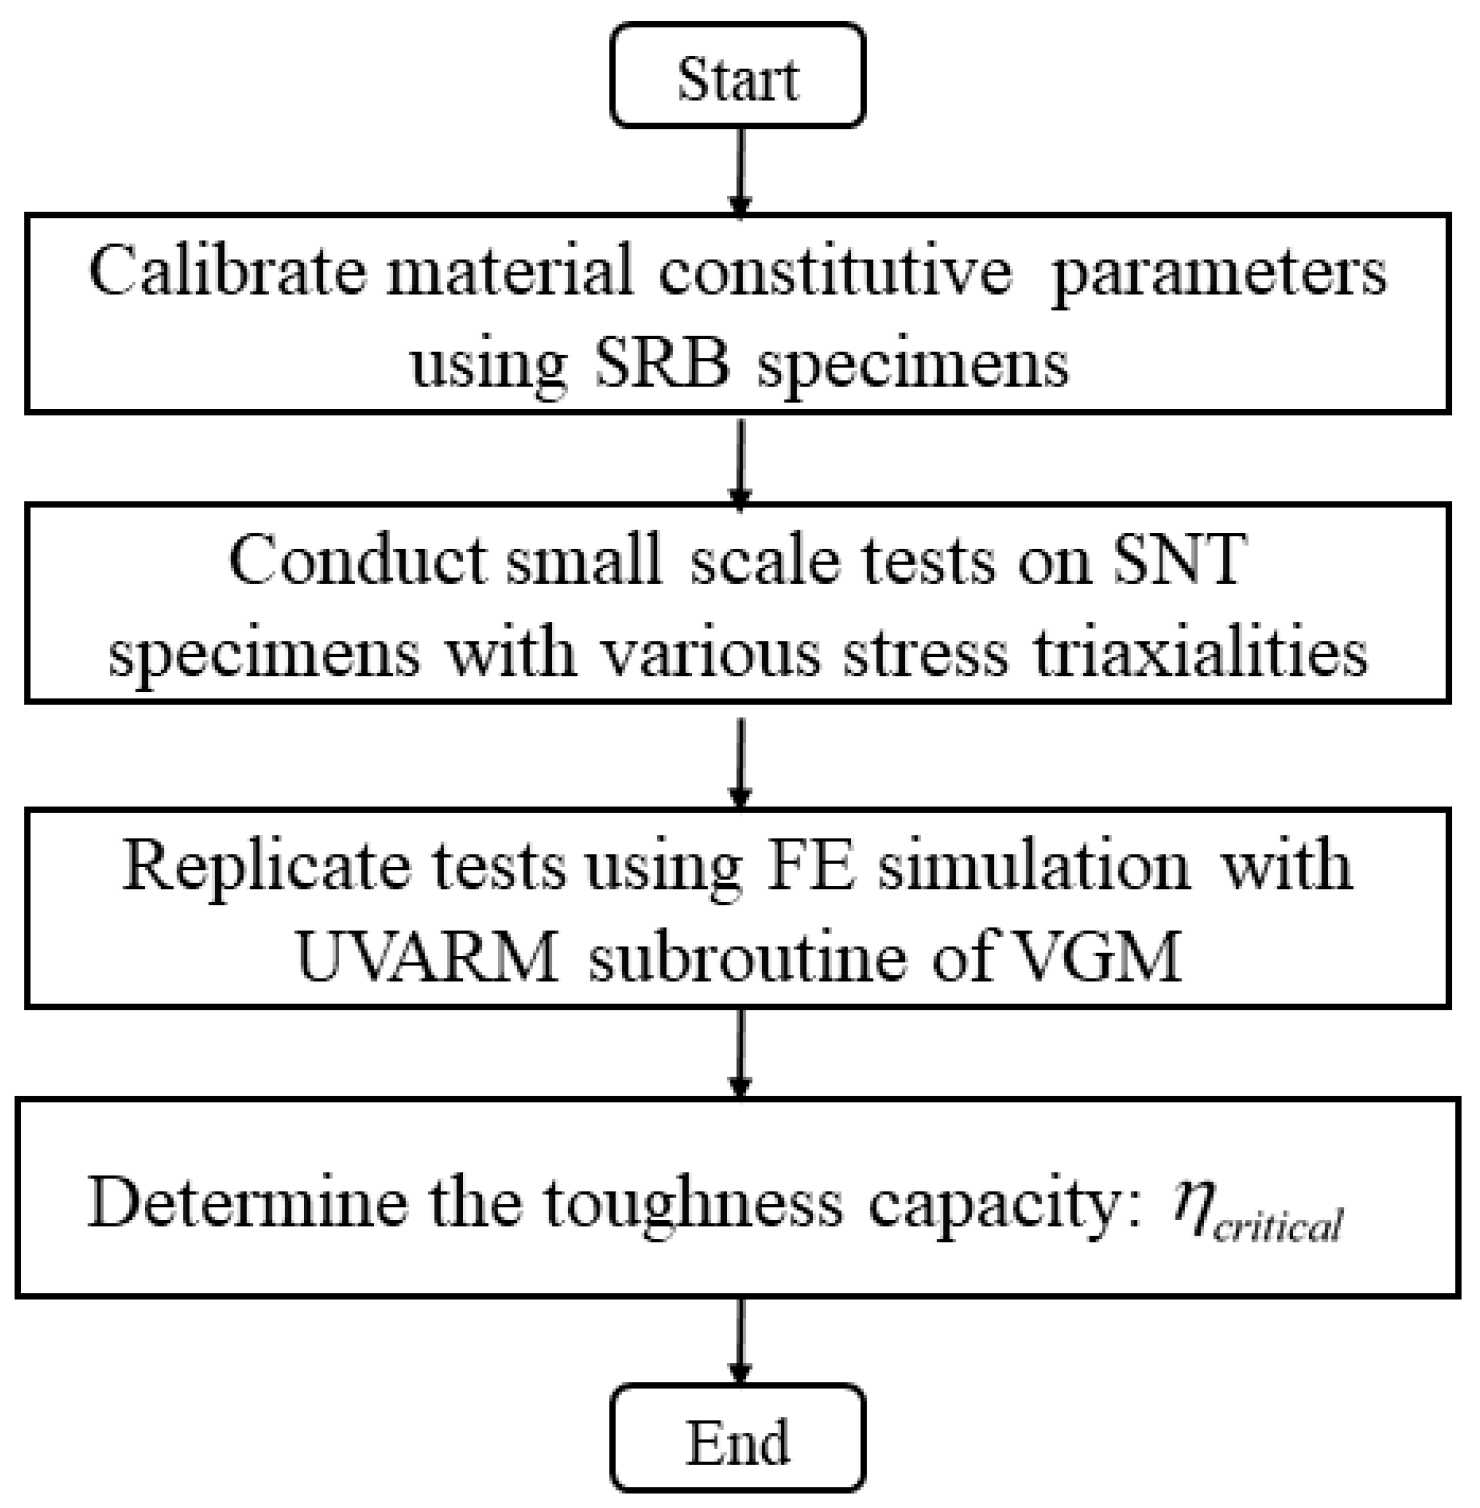
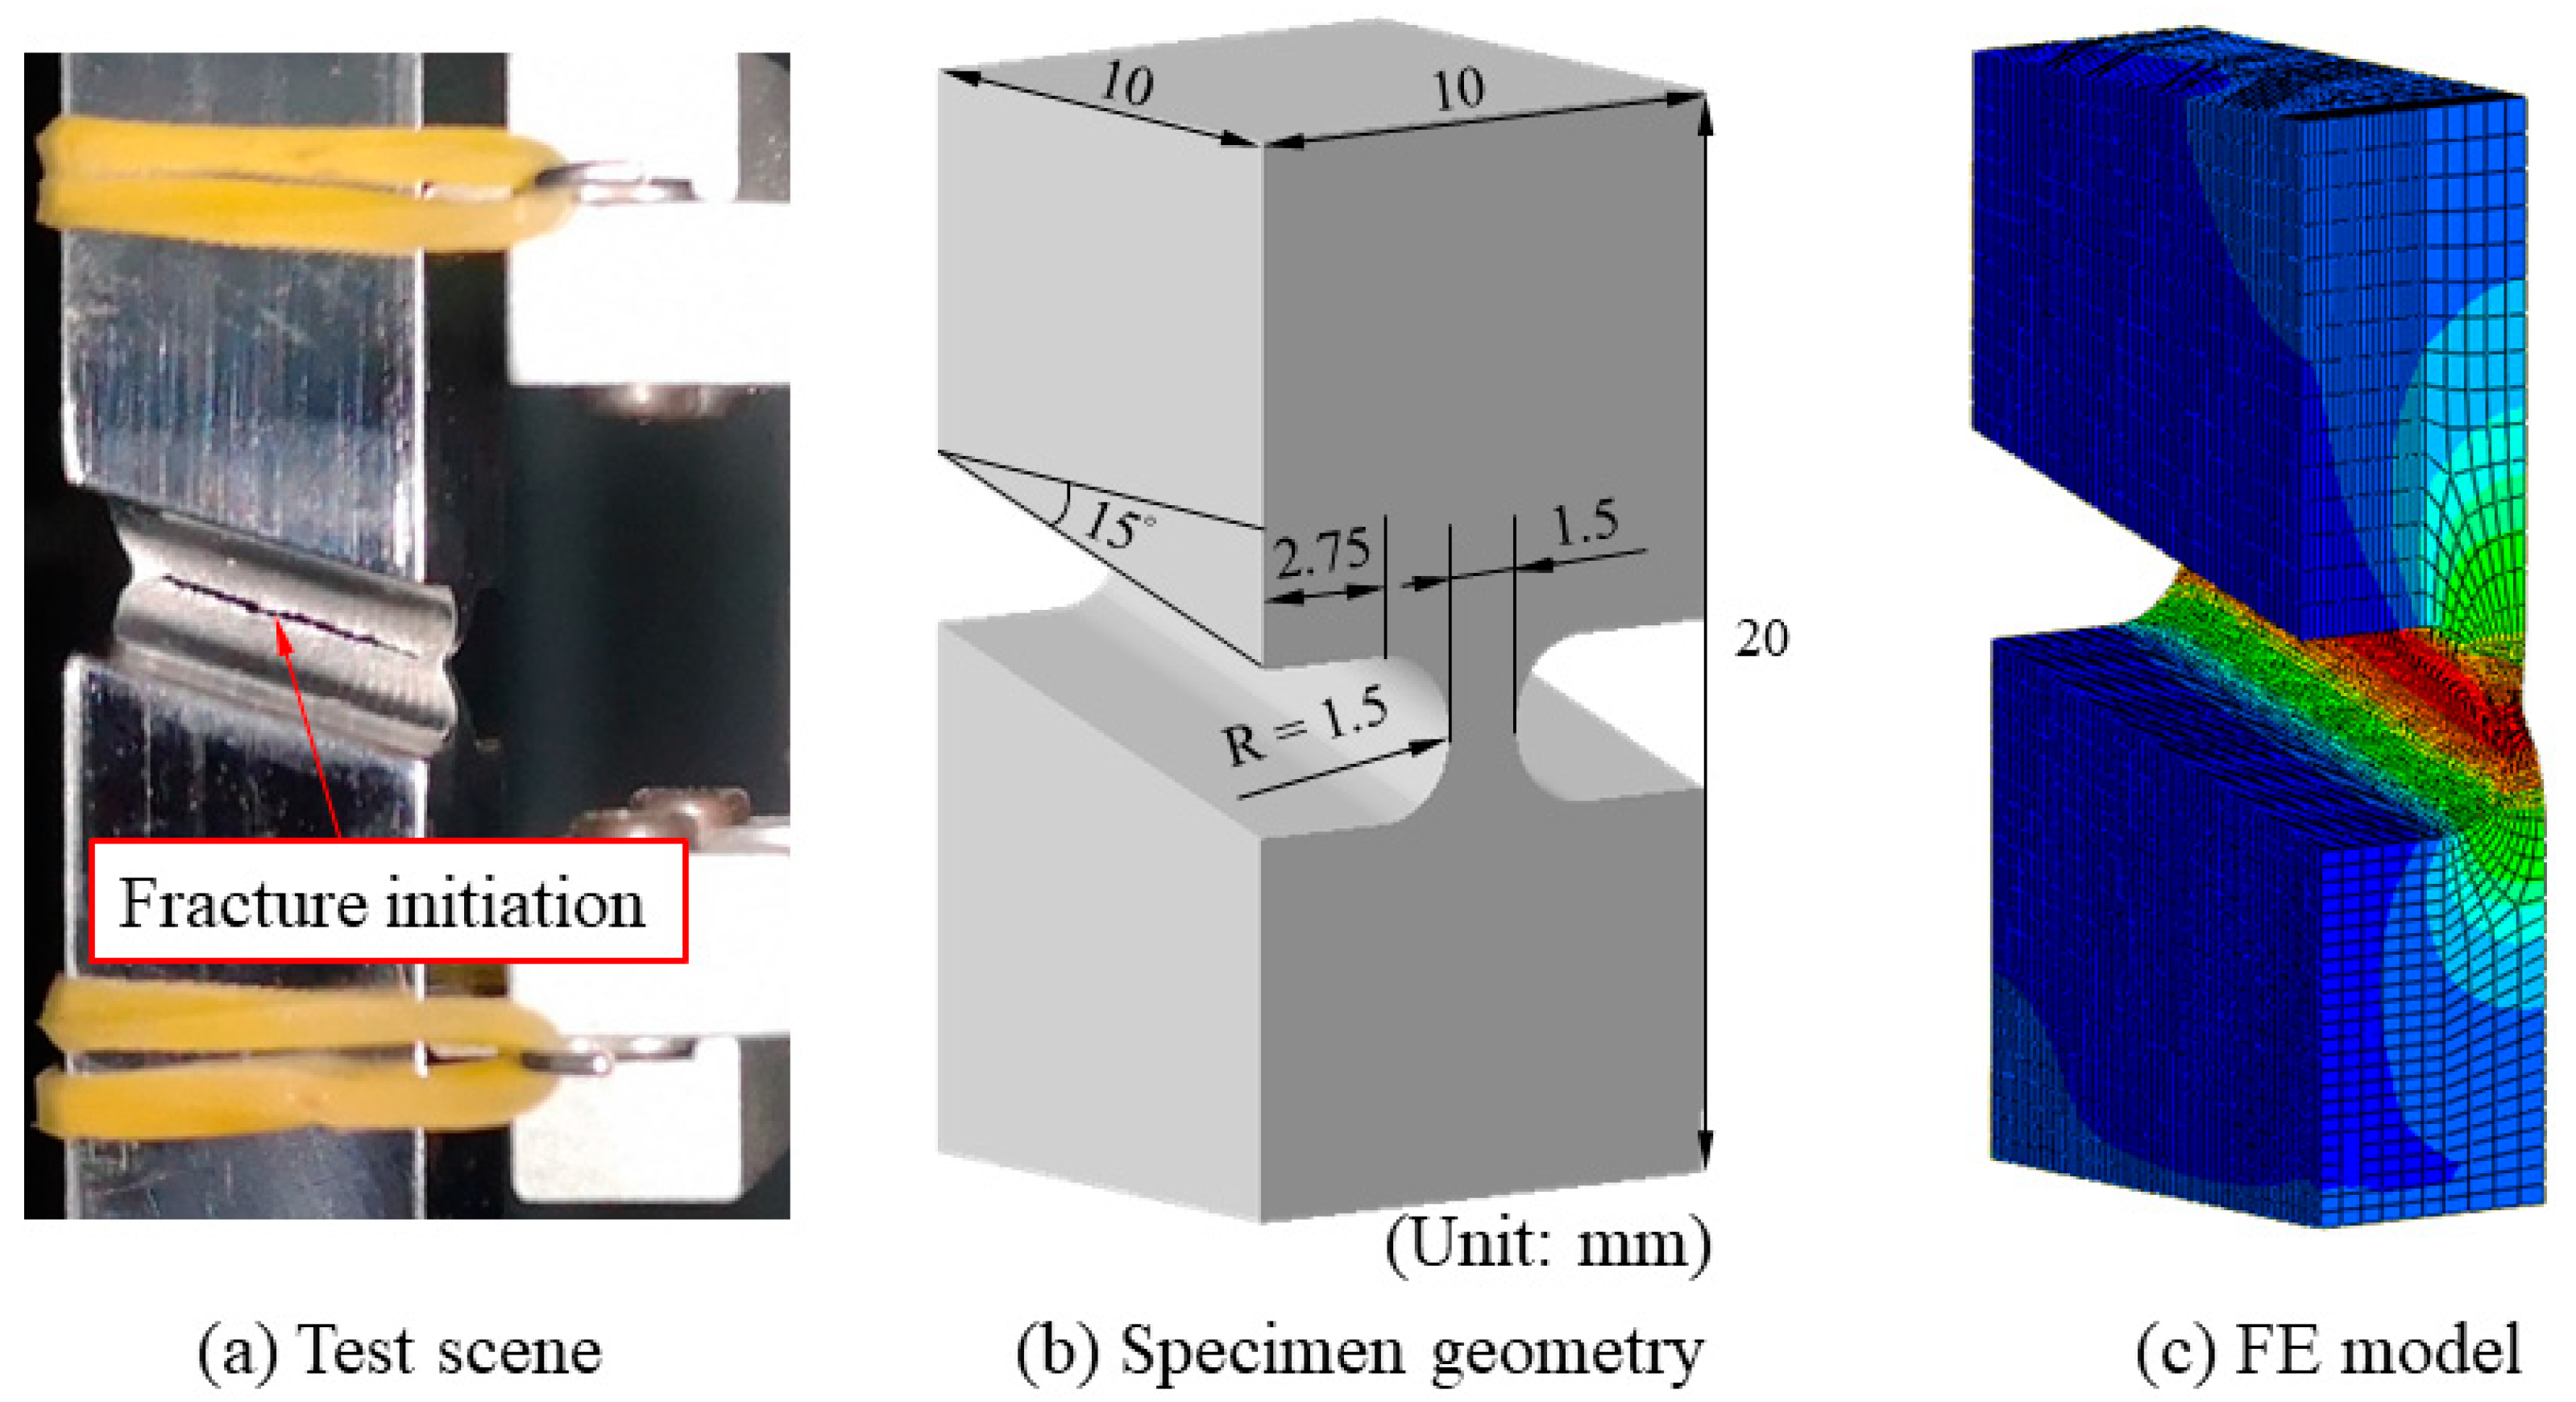
3. Calibration of VGM for X80 Pipeline Steel
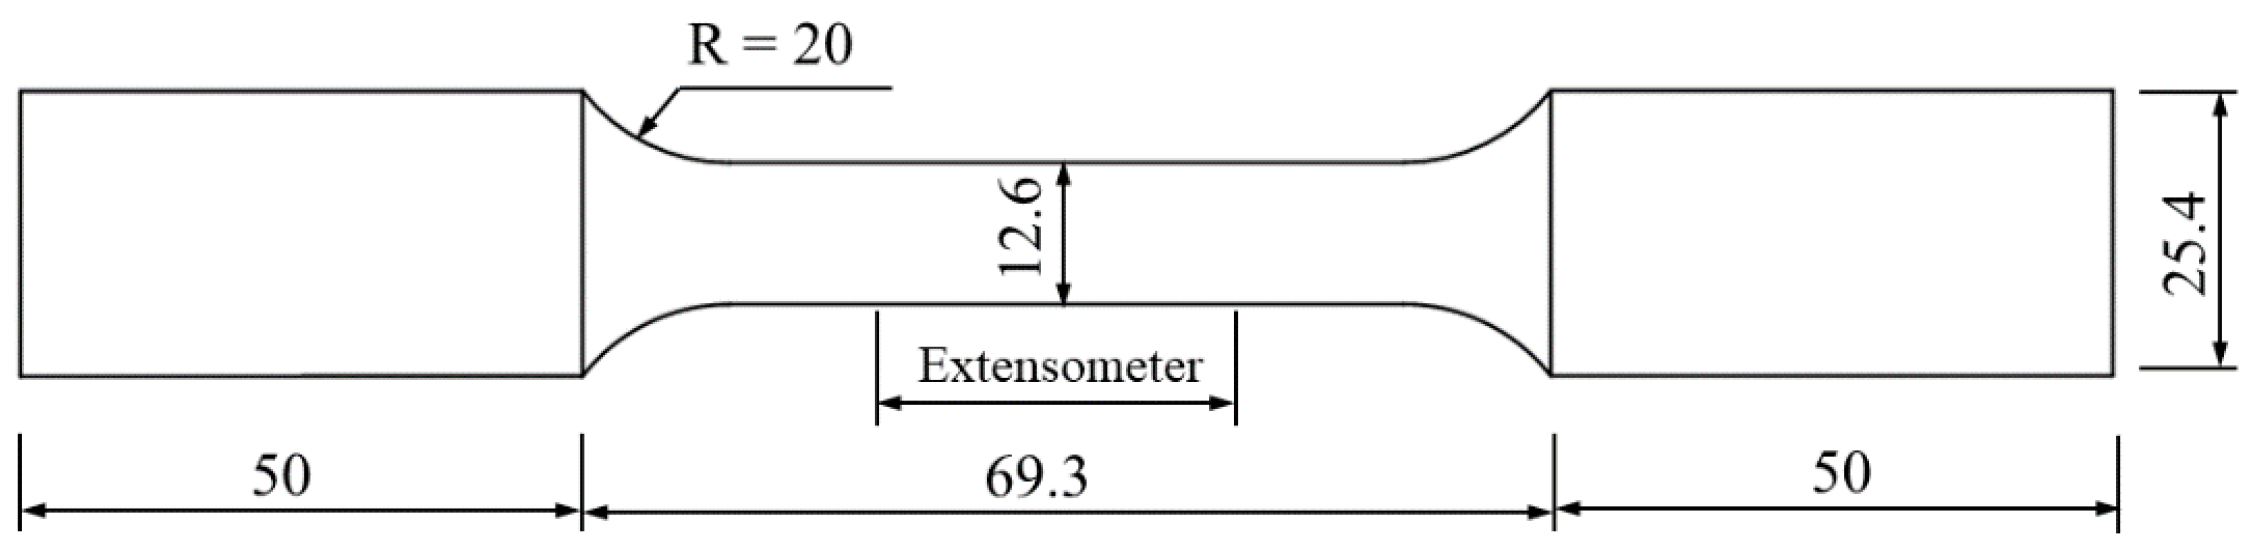
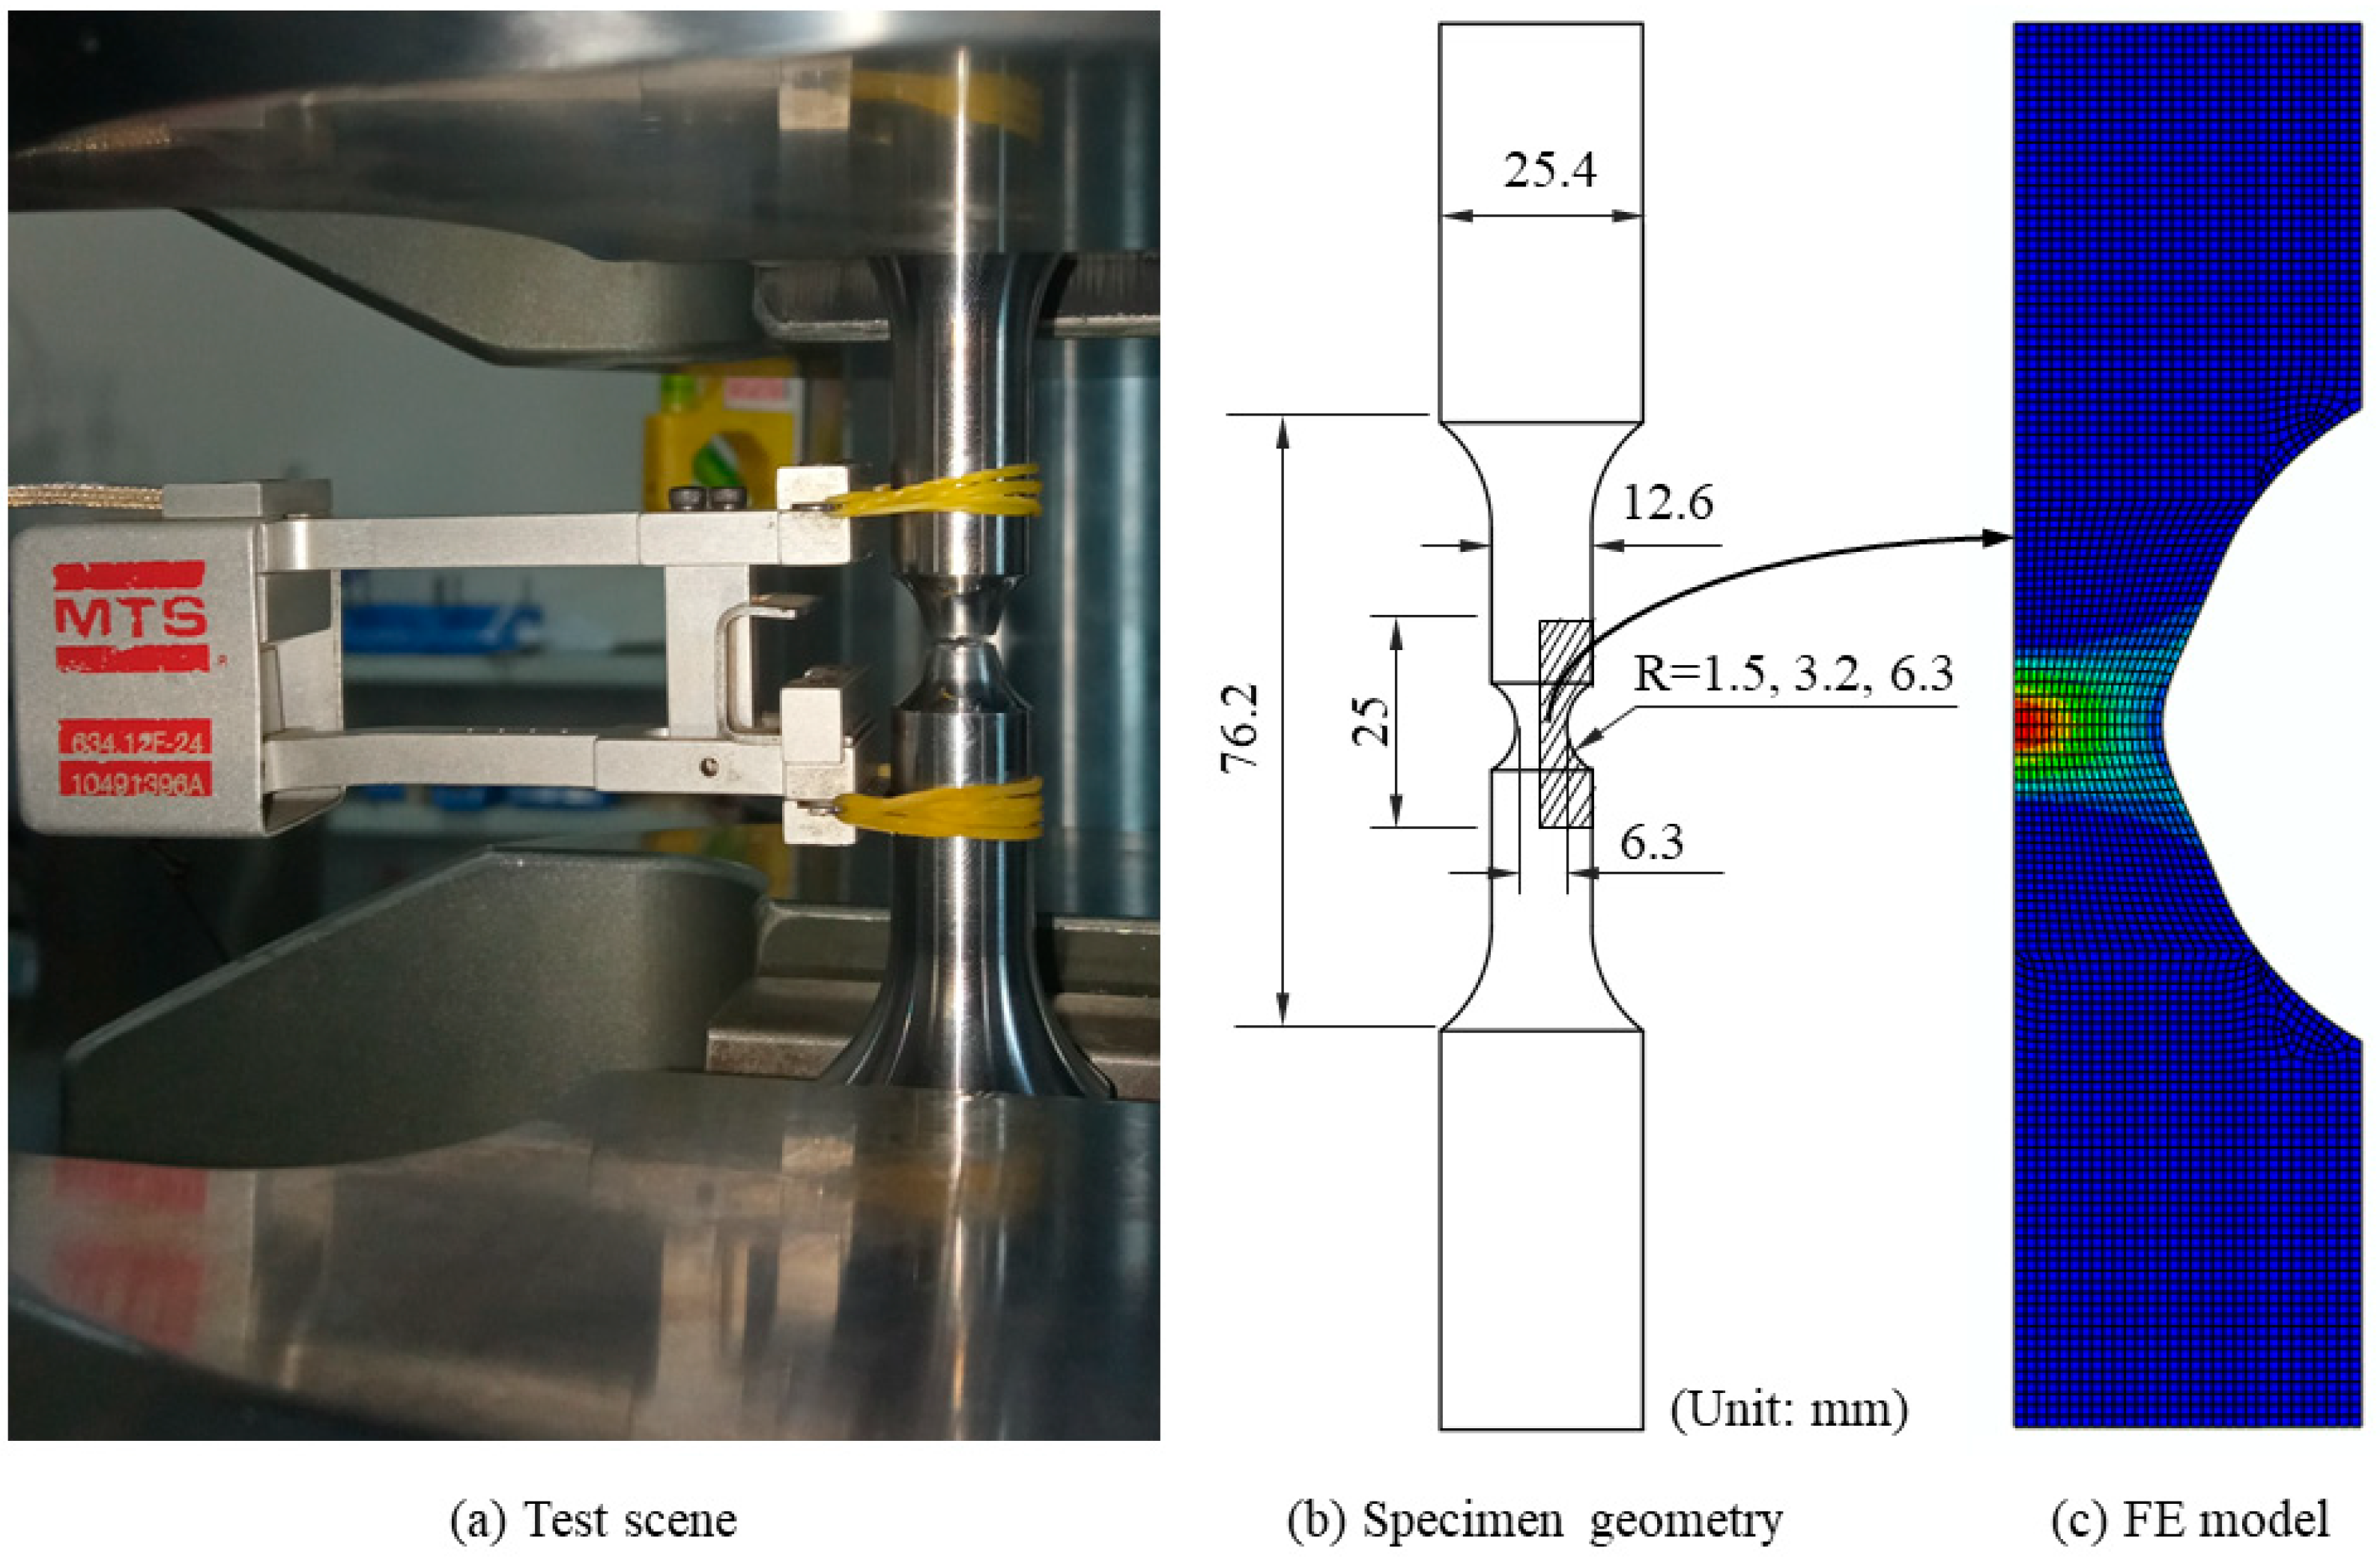
3.1. Calibration of the Material Constitutive Model
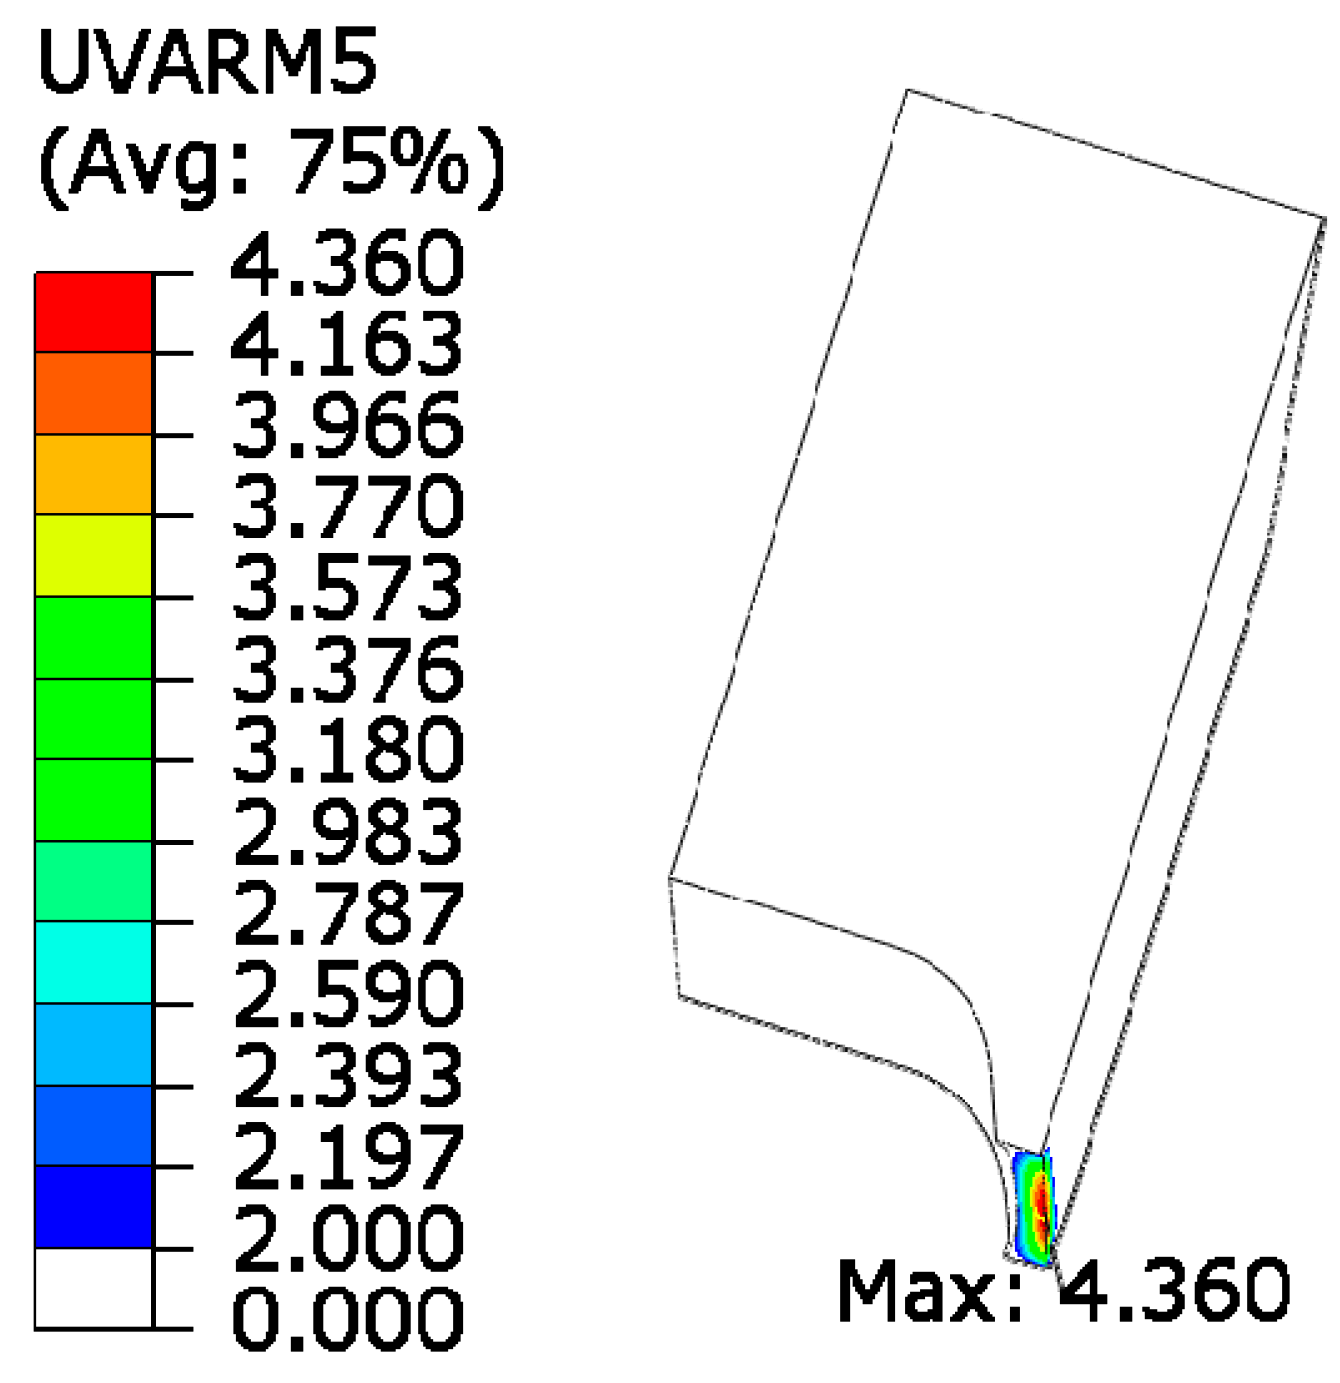
3.2. Calibration of VGM
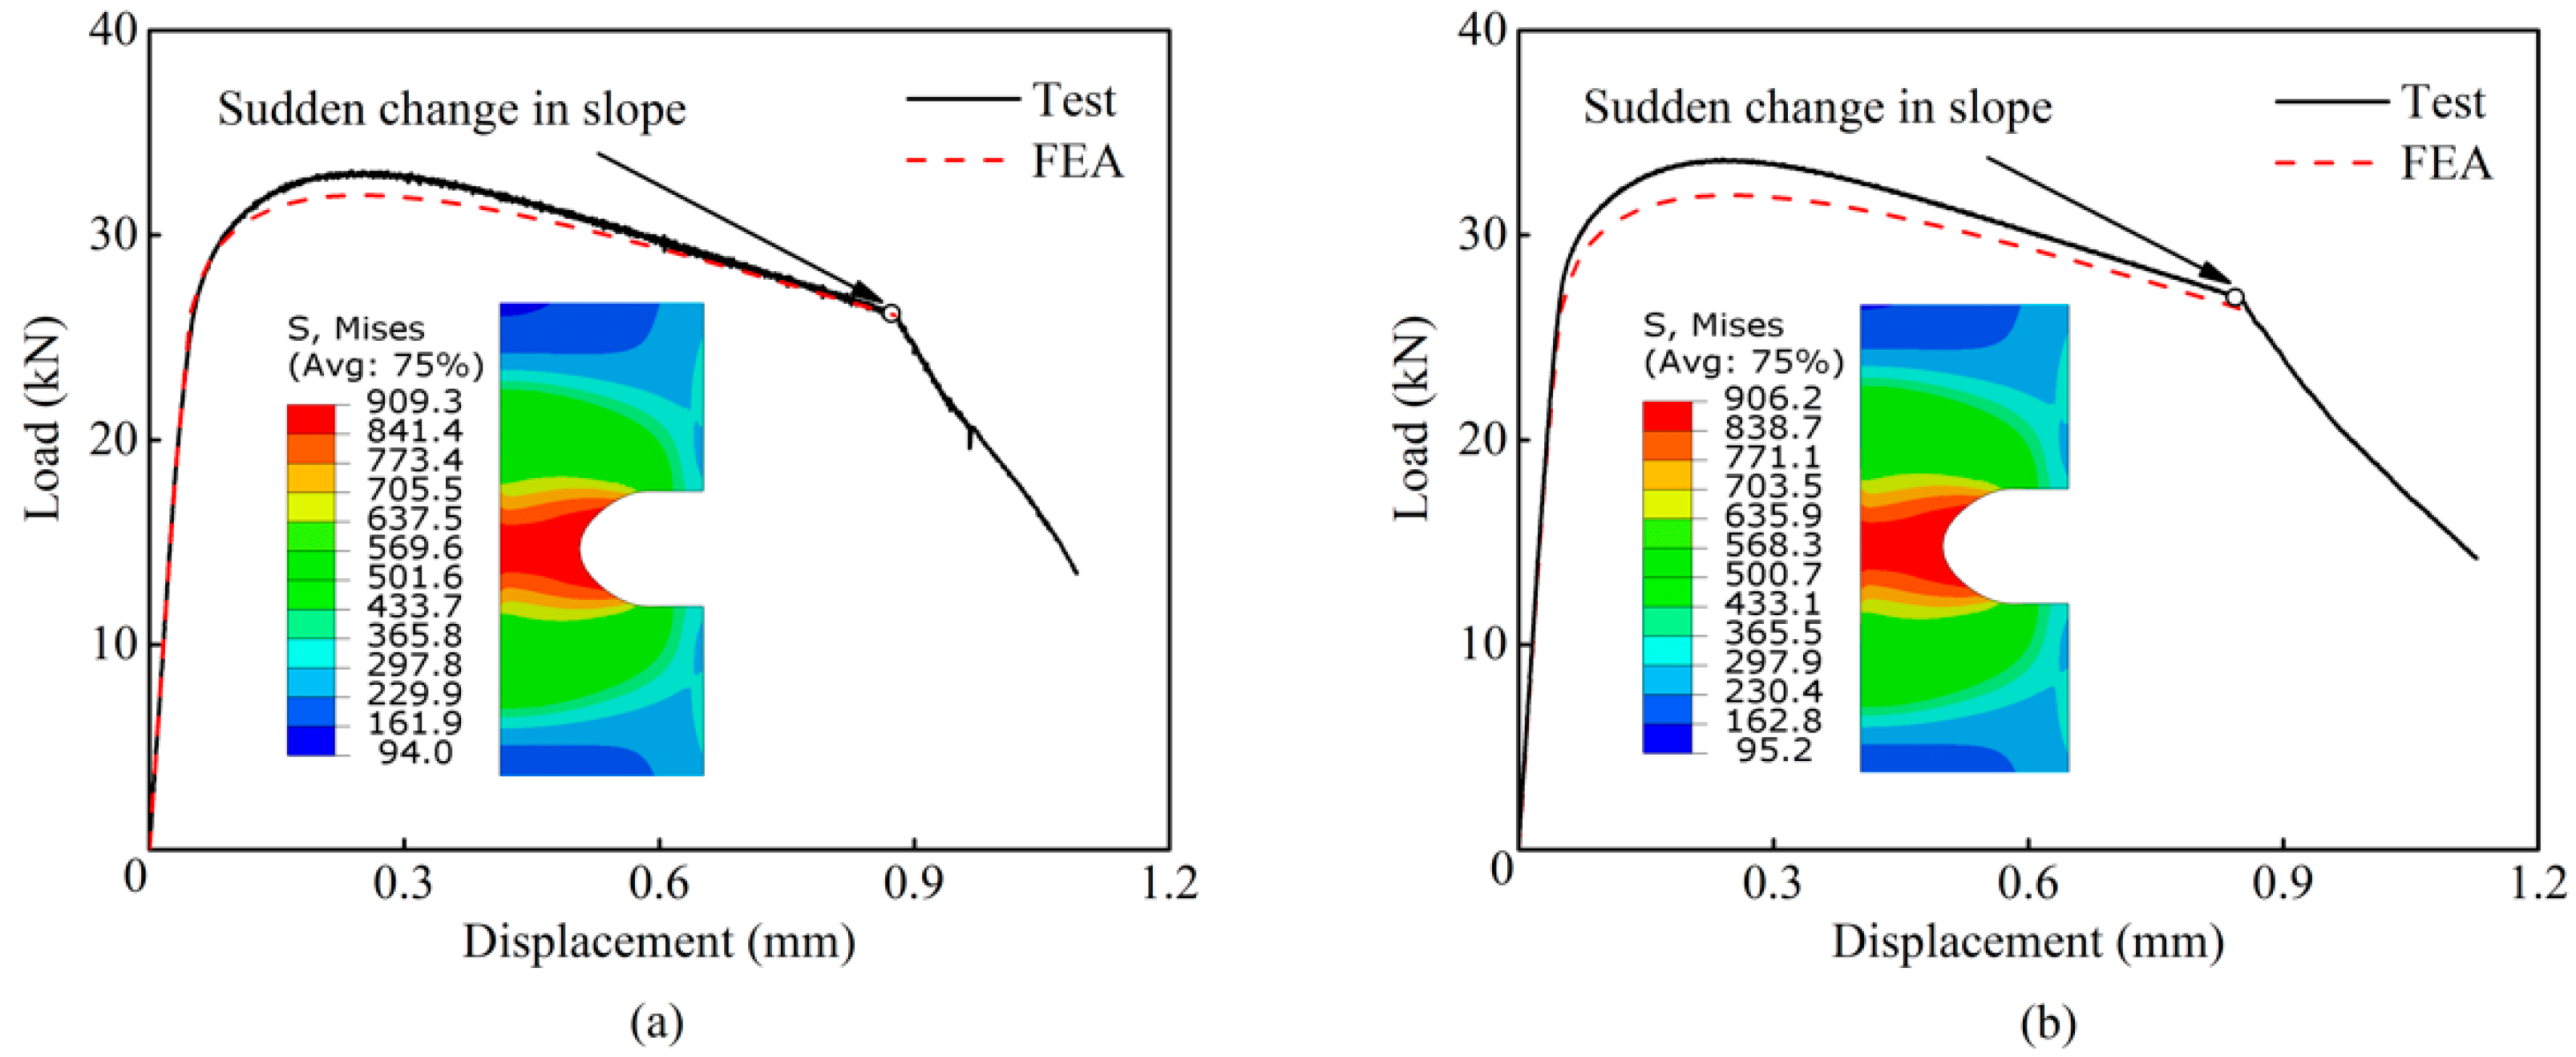
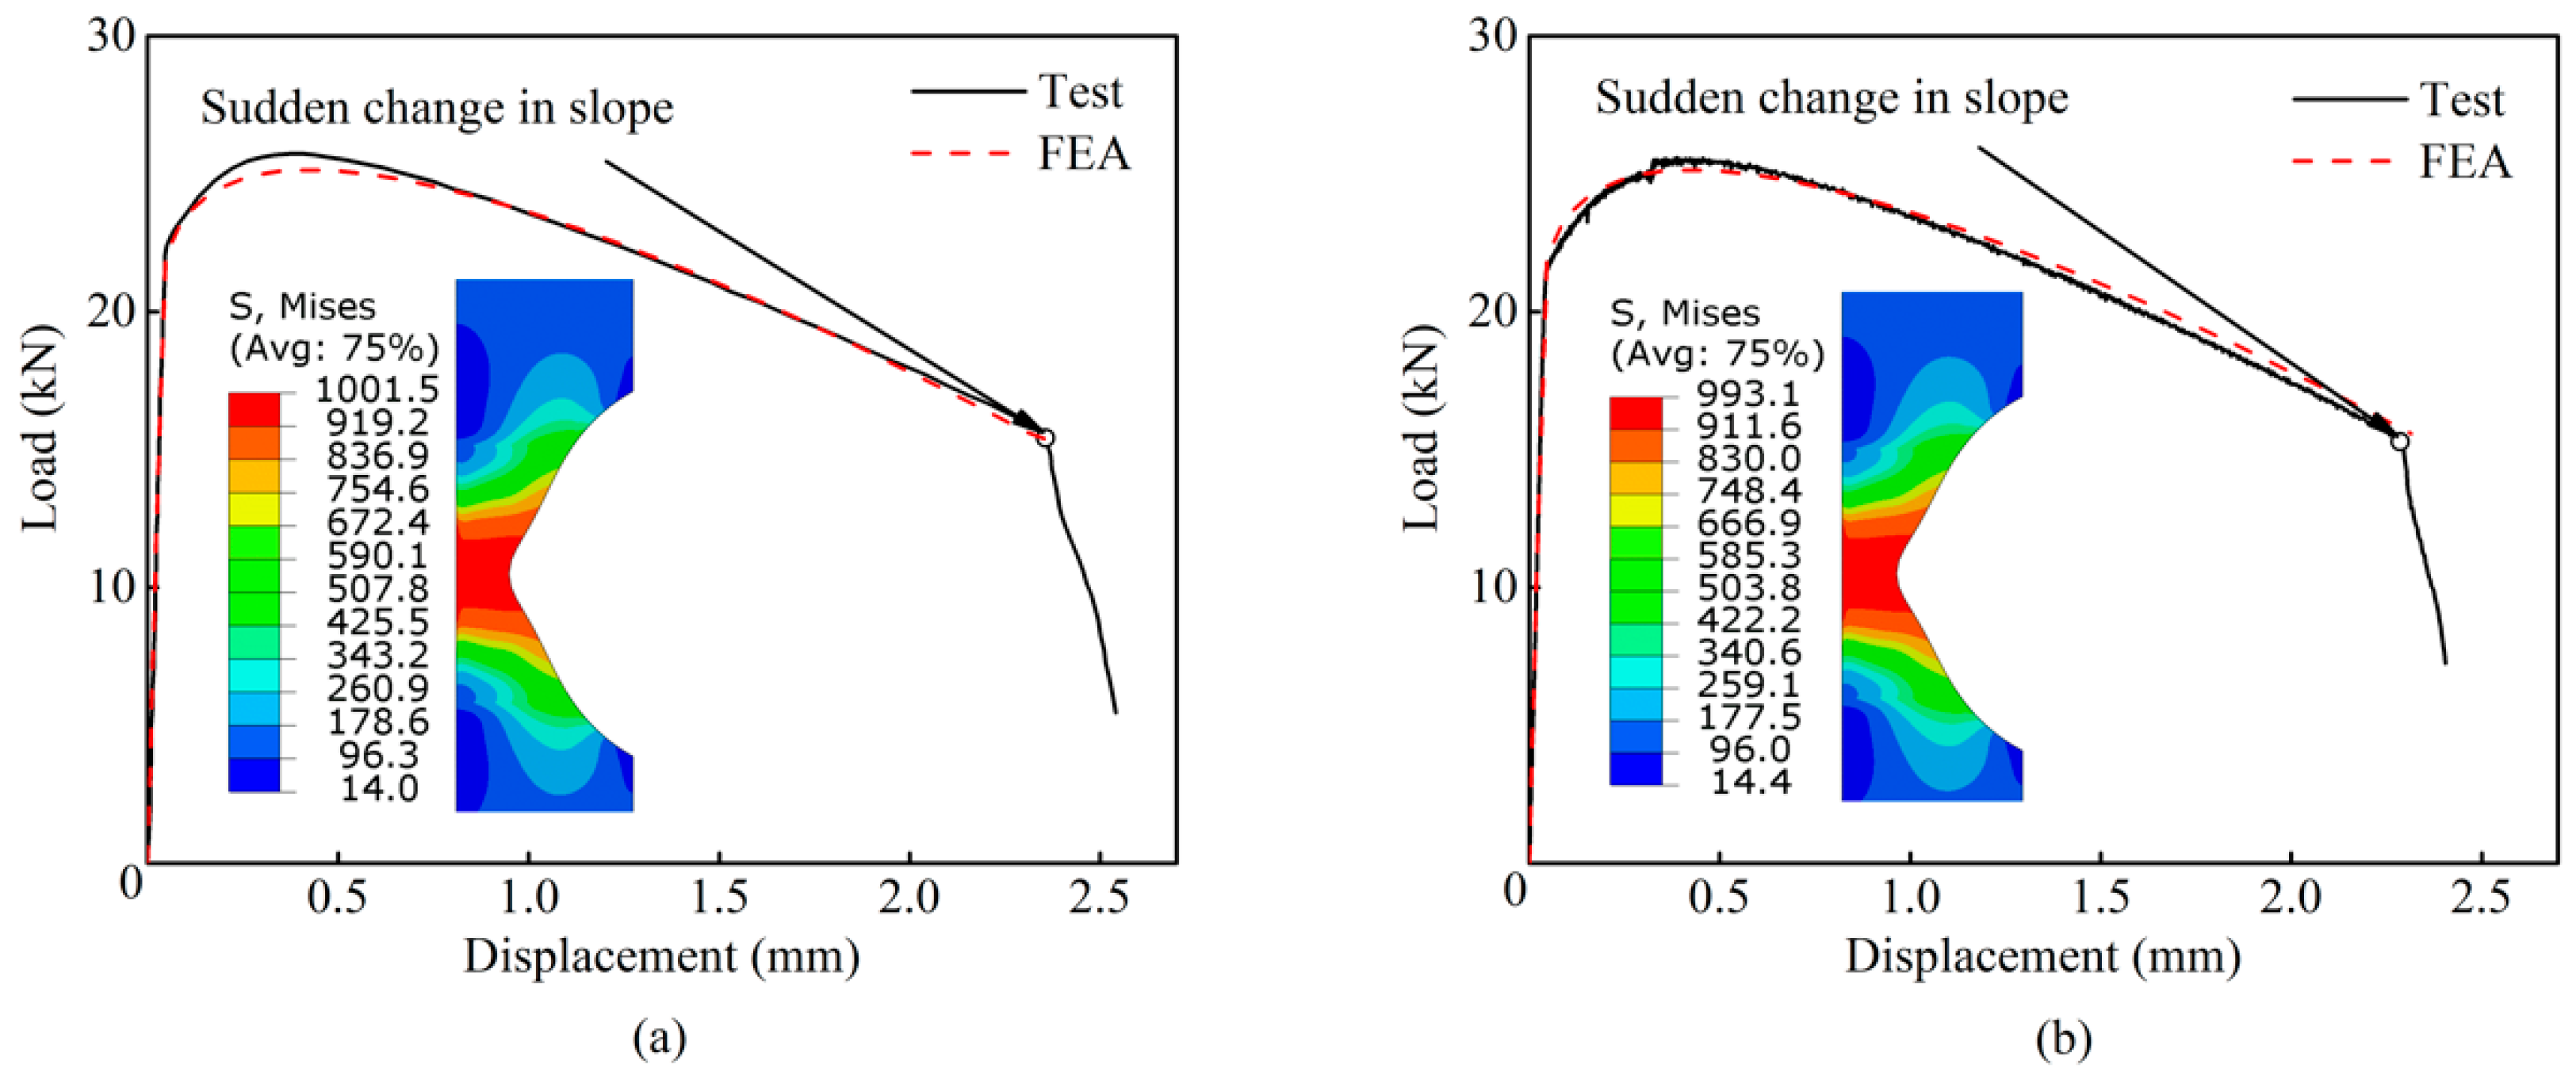
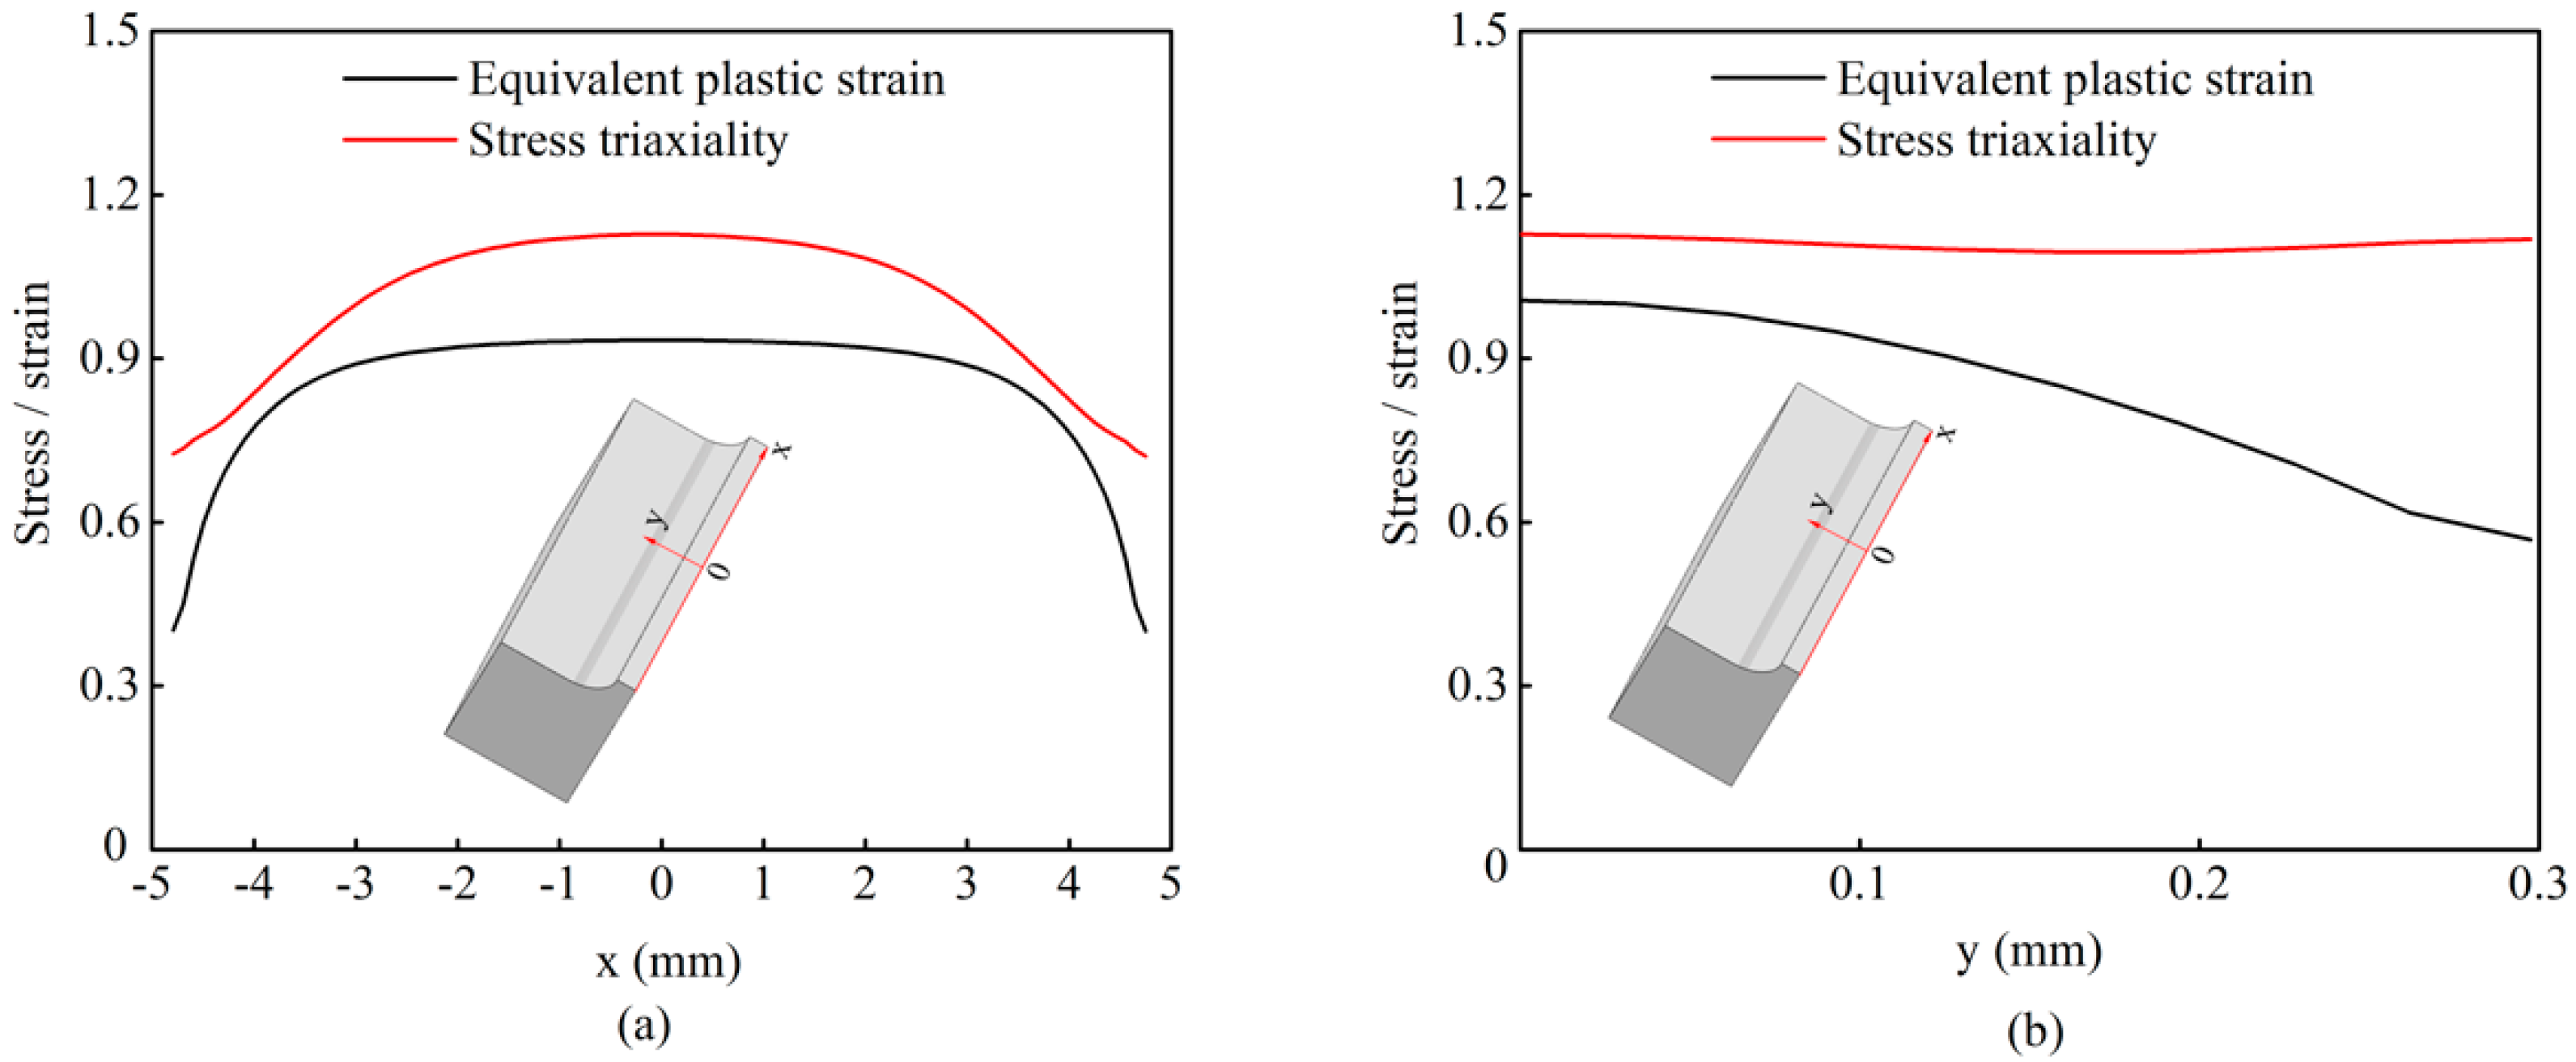
4. Verification of Calibrated VGM and Fracture Behaviors of X80 Pipeline Steel
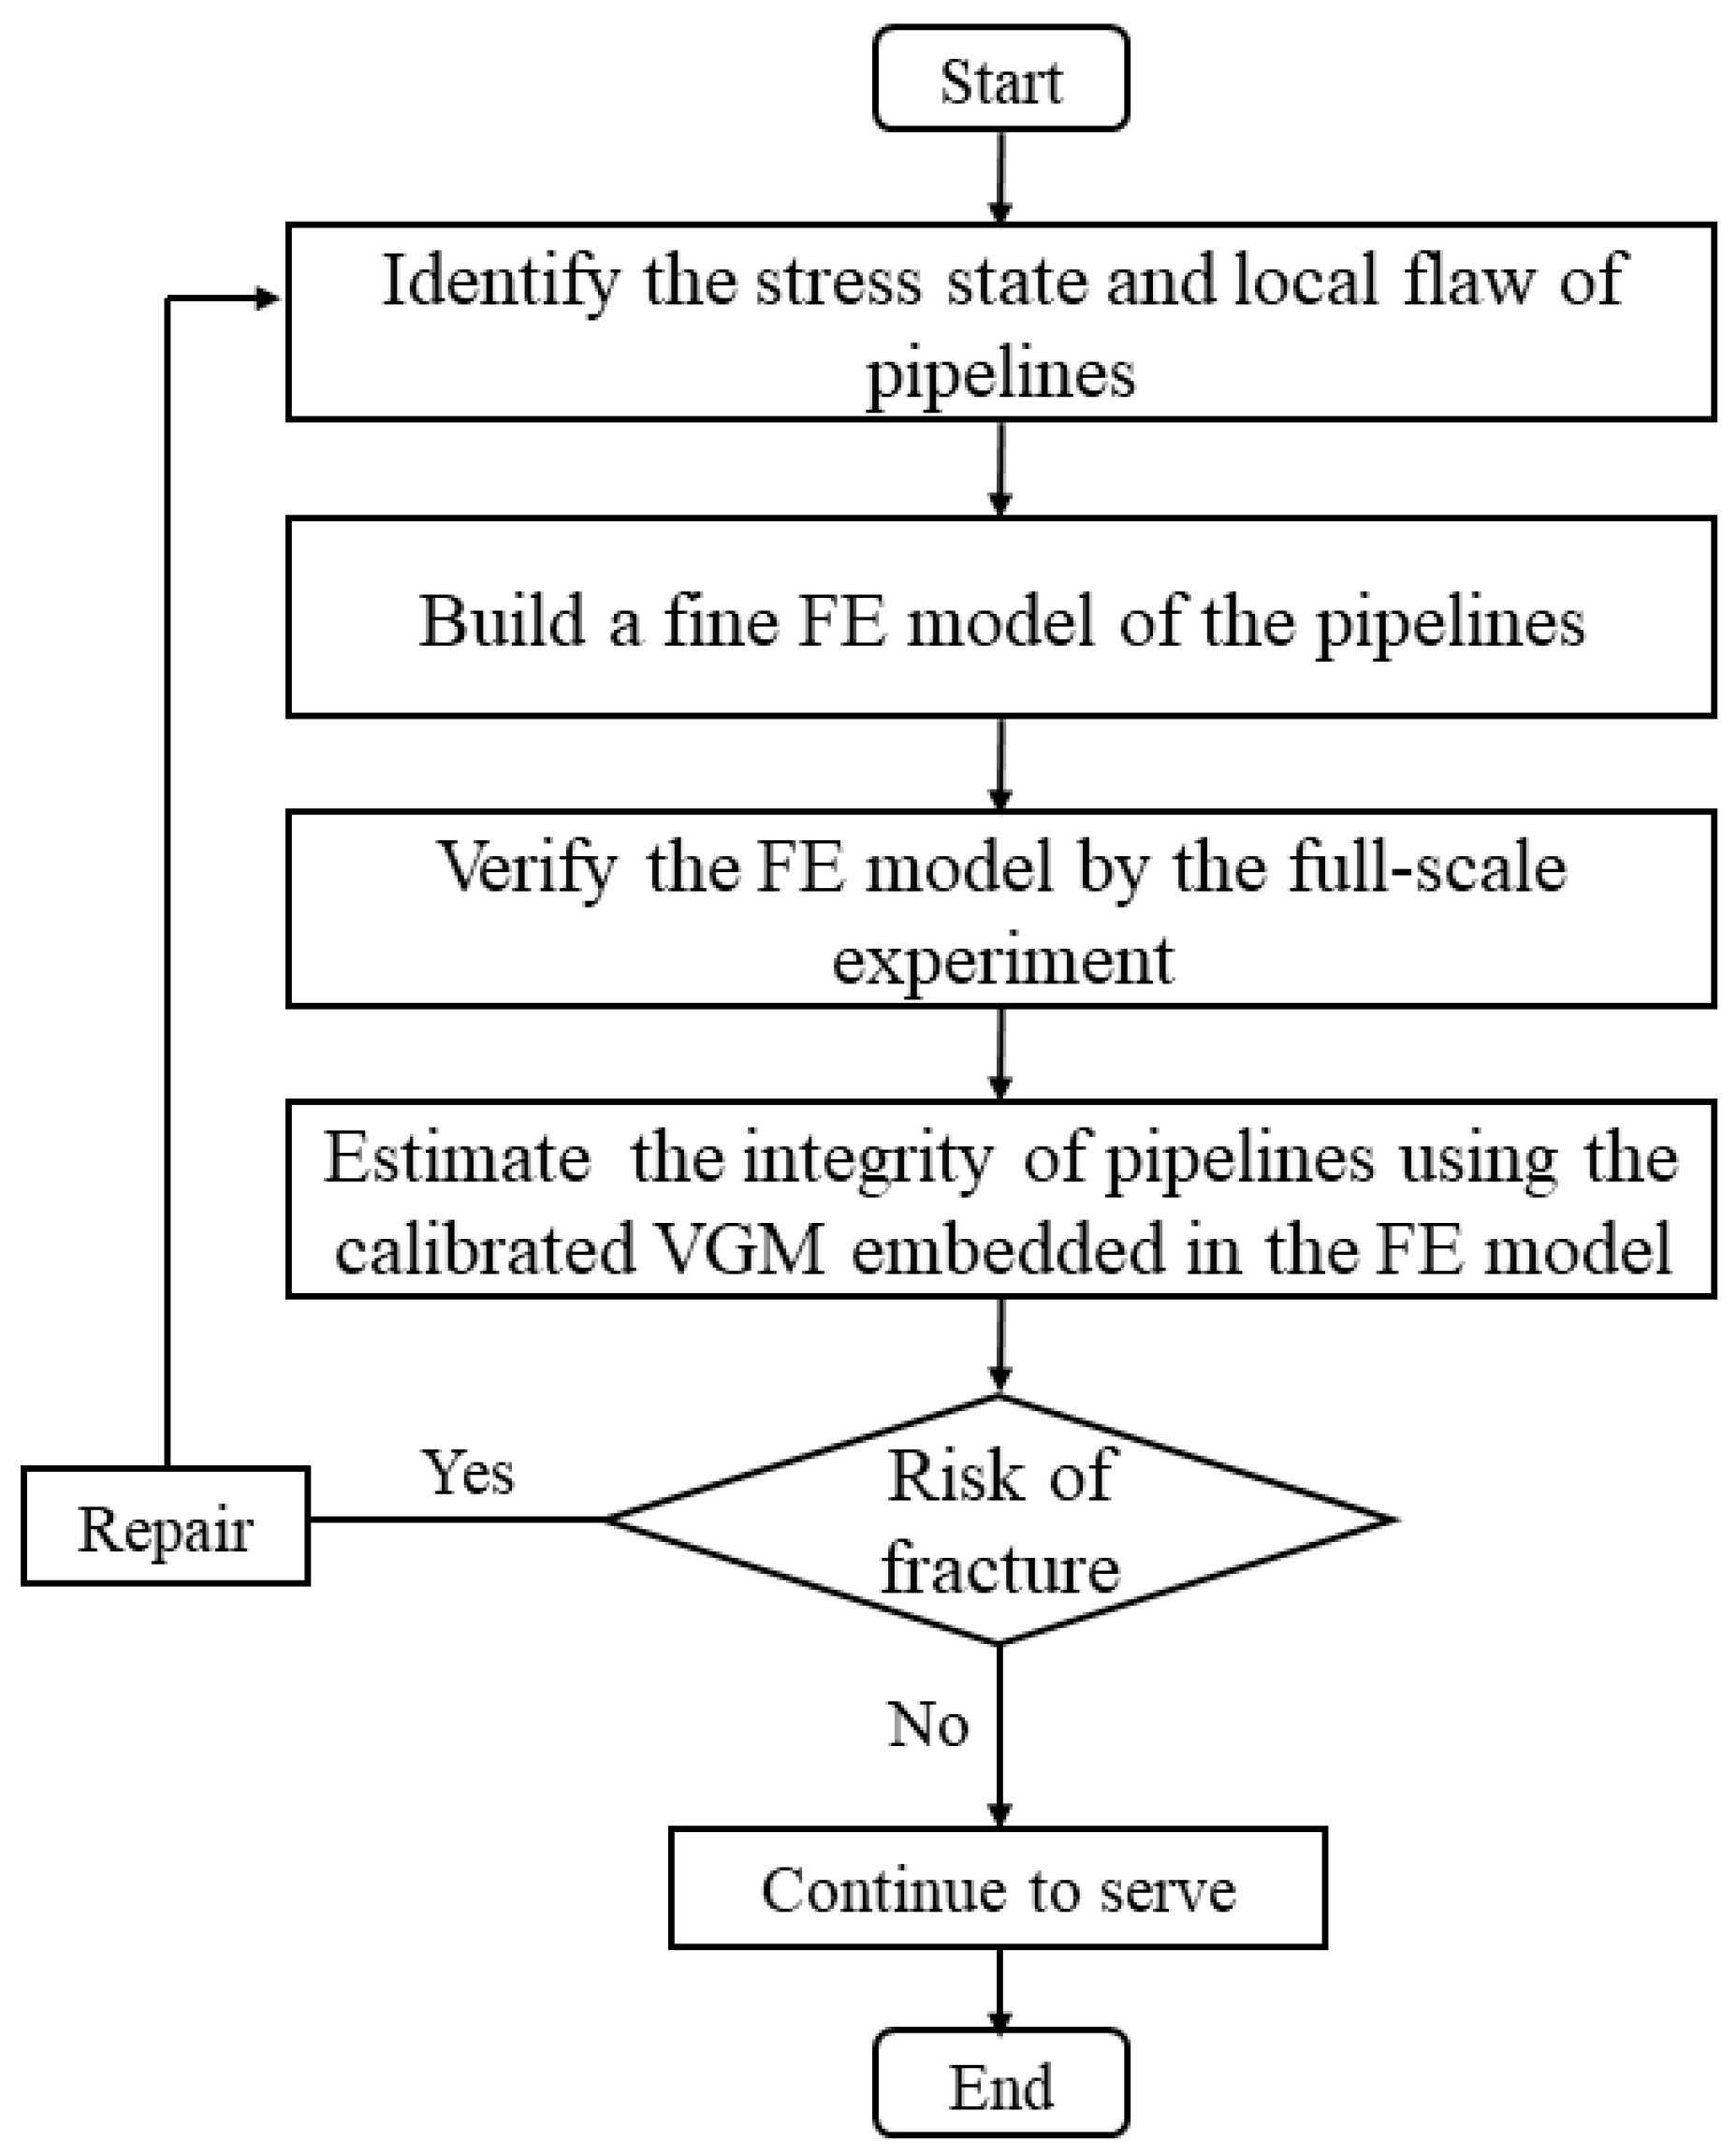
5. Application and Limitation of the VGM Model in Estimating Real Pipelines
6. Conclusions
- (1)
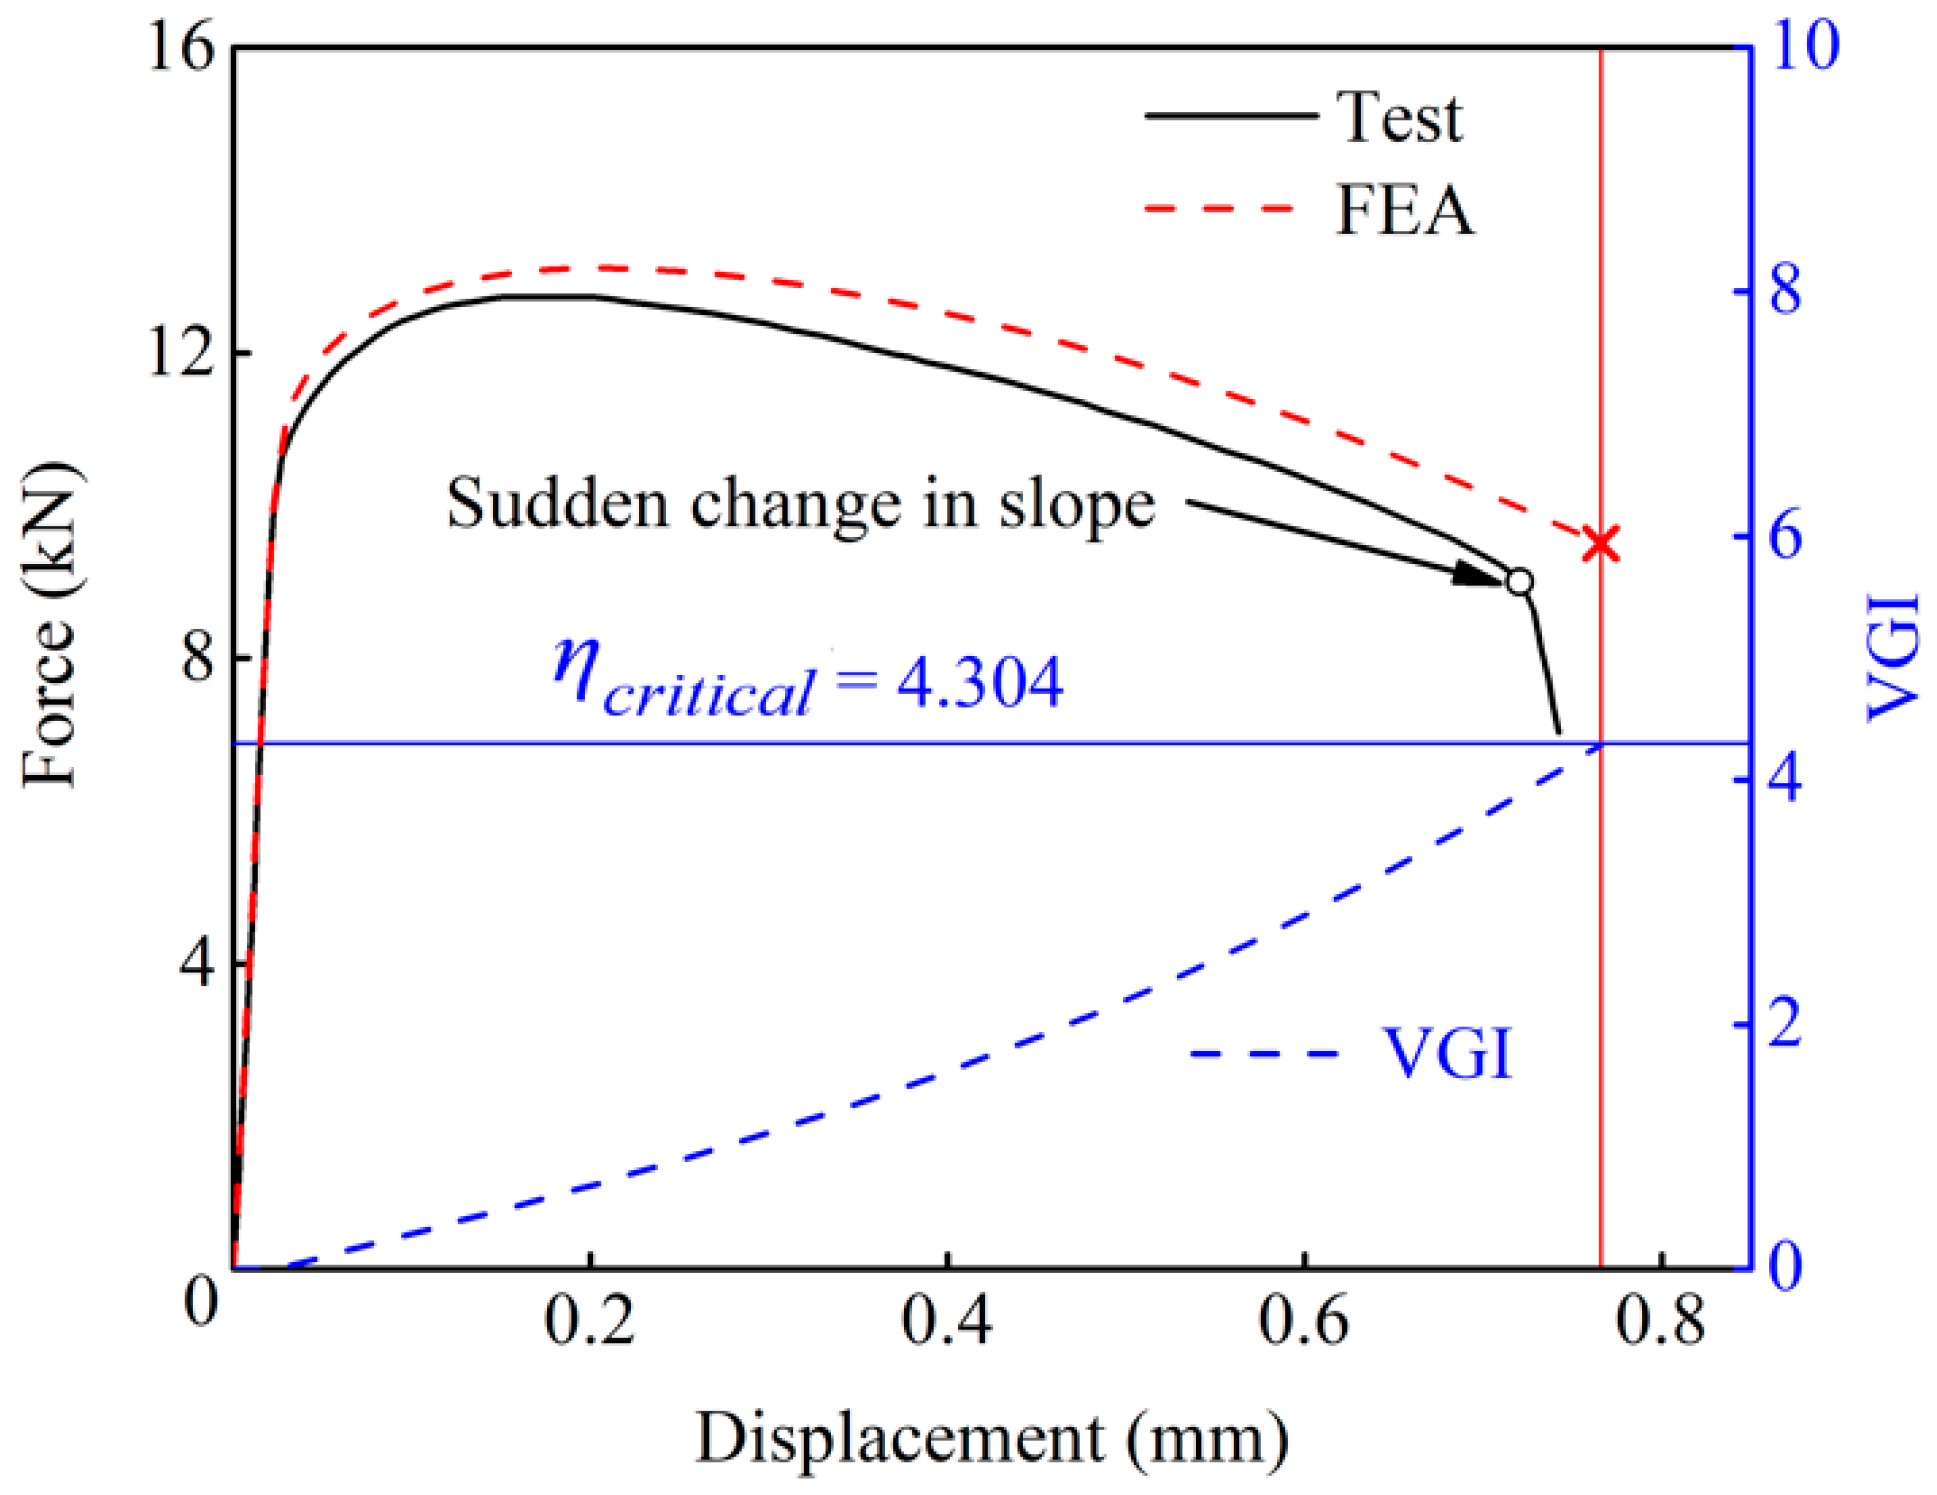
- The material parameter in the VGM was calibrated by tests and corresponding FEA. The parameter in the VGM is determined as 4.304. Moreover, the Swift hardening law parameters of X80 pipeline steel are determined as: = 967 MPa, = 0.0127, and = 0.116.
- (2)
- The calibrated material parameter in the VGM was verified by the test on a shear-tension specimen subjected to monotonic tension. The VGM gave accurate predictions of fracture initiation of the test specimen.
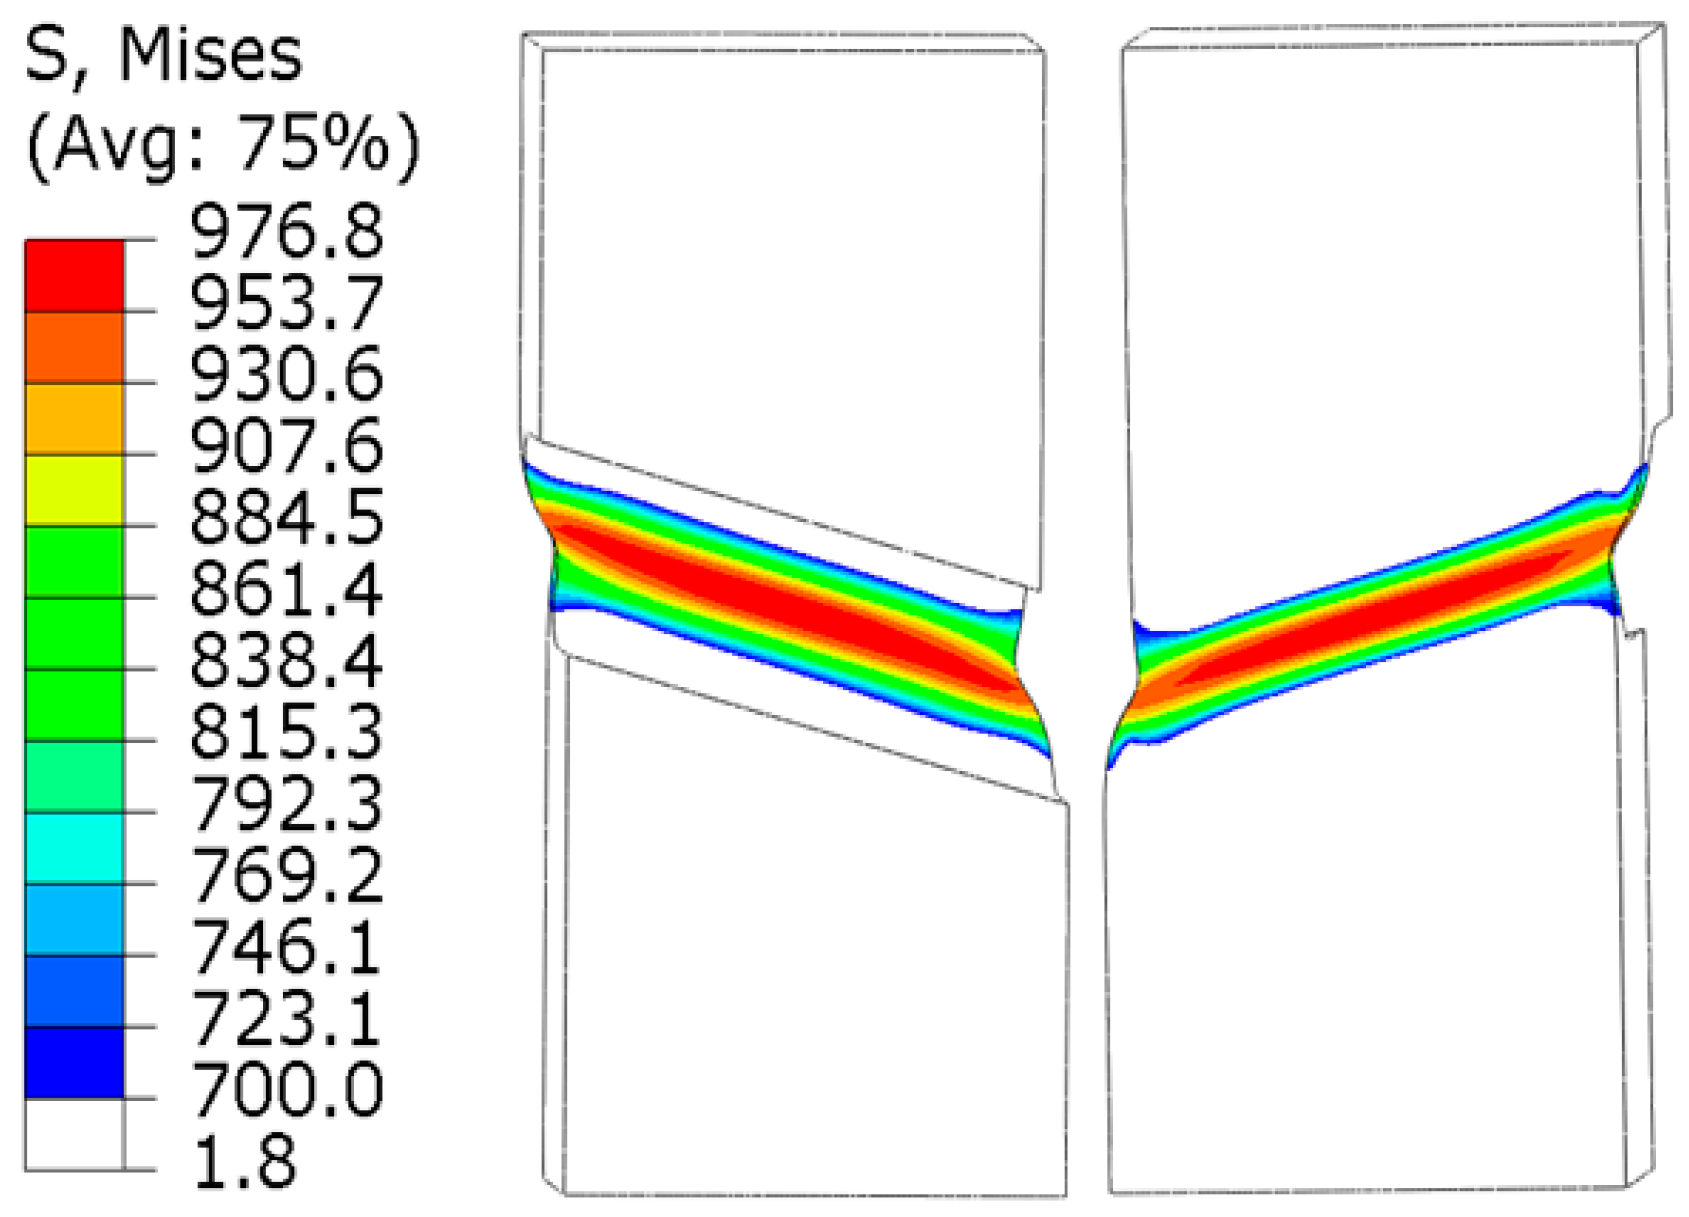
- (3)
- The fracture of the shear-tension specimen initiates at the center of the groove and propagates to the edge of the section. The initiation of fracture is identical to the testing observation.
Author Contributions
Funding
Data Availability Statement
Conflicts of Interest
References
- Ren, Y.; Venugopal, V.; Shi, W. Dynamic analysis of a multi-column TLP floating offshore wind turbine with tendon failure scenarios. Ocean Eng. 2022, 245, 110472. [Google Scholar] [CrossRef]
- Zhang, L.; Shi, W.; Karimirad, M.; Michailides, C.; Jiang, Z. Second-order hydrodynamic effects on the response of three semisubmersible floating offshore wind turbines. Ocean Eng. 2020, 207, 107371. [Google Scholar] [CrossRef]
- Wang, Y.; Shi, W.; Michailides, C.; Wan, L.; Kim, H.; Li, X. WEC shape effect on the motion response and power performance of a combined wind-wave energy converter. Ocean Eng. 2022, 250, 11103. [Google Scholar] [CrossRef]
- Qiu, T.; Wang, L.; Lu, Y.; Zhang, M.; Qin, W.; Wang, S.; Wang, L. Potential assessment of photovoltaic power generation in China. Renew. Sustain. Energy Rev. 2021, 154, 111900. [Google Scholar] [CrossRef]
- Han, P.; Cheng, P.; Yuan, S.; Bai, Y. Characterization of ductile fracture criterion for API X80 pipeline steel based on a phenomenological approach. Thin-Walled Struct. 2021, 164, 107254. [Google Scholar] [CrossRef]
- Gräf, M.K.; Hillenbrand, H.G.; Heckmann, C.J.; Niederhoff, K.A. High-strength large-diameter pipe for long-distance high pressure gas pipelines. In Proceedings of the Thirteenth International Offshore and Polar Engineering Conference, Honolulu, HI, USA, 25–30 May 2003. [Google Scholar]
- Peng, Z.; Zhao, H.; Li, X. New ductile fracture model for fracture prediction ranging from negative to high stress triaxiality. Int. J. Plast. 2021, 145, 103057. [Google Scholar] [CrossRef]
- Anderson, T. Fracture Mechanics: Fundamentals and Applications, 4th ed.; Taylor & Francis Group, LLC: Boca Raton, FL, USA, 2017. [Google Scholar]
- Zhao, H.; Lie, S. Determination of dimensionless stress intensity factor of plate-to-plate butt welds between axially aligned members of different thickness. Eng. Fract. Mech. 2017, 172, 90–105. [Google Scholar] [CrossRef]
- Zhao, H.; Lie, S.; Vipin, S. New weld toe magnification factors for semi-elliptical cracks in plate-to-plate butt-welded joints. Fatigue Fract. Eng. Mater. Struct. 2017, 40, 207–220. [Google Scholar]
- Zhao, H.; Lie, S.; Zhang, Y. Elastic-plastic fracture analyses for misaligned clad pipeline containing a canoe shape surface crack subjected to large plastic deformation. Ocean Eng. 2017, 146, 87–100. [Google Scholar] [CrossRef]
- Zhao, H.; Lie, S.; Zhang, Y. Fatigue assessment of cracked pipes with weld misalignment by using stress intensity factors. Int. J. Fatigue 2018, 116, 192–209. [Google Scholar] [CrossRef]
- Lie, S.; Zhao, H. Fracture analysis of load-carrying cruciform fillet welded joints with multiple cracks. Eng. Fract. Mech. 2018, 193, 32–46. [Google Scholar] [CrossRef]
- Zhao, H.; Lie, S.; Zhang, Y. Fracture assessment of mismatched girth welds in oval-shaped clad pipes subjected to bending moment. Int. J. Press. Vessel. Pip. 2018, 160, 1–13. [Google Scholar] [CrossRef]
- Zhao, H.; Li, X.; Lie, S. Strain-based fracture assessment for an interface crack in clad pipes under complicated loading conditions. Ocean Eng. 2020, 198, 106992. [Google Scholar] [CrossRef]
- Zhao, H.; Lie, S.; Zhang, Y. Strain-based J-estimation scheme for fracture assessment of misaligned clad pipelines with an interface crack. Mar. Struct. 2018, 61, 238–255. [Google Scholar] [CrossRef]
- Zhao, H.; Lie, S.; Zhang, Y. Stress intensity factors for semi-elliptical surface cracks in plate-to-plate butt welds with parallel misalignment of same thickness. Mar. Struct. 2017, 53, 148–163. [Google Scholar] [CrossRef]
- Sun, M.; Zhao, H.; Li, X.; Liu, J.; Xu, Z. A new evaluation method for burst pressure of pipeline with colonies of circumferentially aligned defects. Ocean Eng. 2021, 222, 108628. [Google Scholar] [CrossRef]
- Sun, M.; Zhao, H.; Li, X.; Liu, J.; Xu, Z. New evaluation method of failure pressure of steel pipeline with irregular-shaped defect. Appl. Ocean Res. 2021, 110, 102601. [Google Scholar] [CrossRef]
- Brünig, M.; Gerke, S.; Koirala, S. Biaxial experiments and numerical analysis on stress-state-dependent damage and failure behavior of the anisotropic aluminum alloy EN AW-2017A. Metals 2021, 11, 1214. [Google Scholar] [CrossRef]
- Algarni, M.; Bai, Y.; Zwawi, M.; Ghazali, S. Damage evolution due to extremely low-cycle fatigue for inconel 718 alloy. Metals 2019, 9, 1109. [Google Scholar] [CrossRef] [Green Version]
- Peng, J.; Wang, Y.; Dai, Q.; Liu, X.; Zhang, Z. Effect of stress triaxiality on plastic damage evolution and failure mode for 316l notched specimen. Metals 2019, 9, 1067. [Google Scholar] [CrossRef] [Green Version]
- Zhu, Y.; Huang, S.; Sajid, H. Micro-mechanisms and modeling of ductile fracture initiation in structural steel after exposure to elevated temperatures. Metals 2021, 11, 767. [Google Scholar] [CrossRef]
- Hutsaylyuk, V.; Maruschak, P.; Konovalenko, I.; Panin, S.; Bishchak, R.; Chausov, M. Mechanical properties of gas main steels after long-term operation and peculiarities of their fracture surface morphology. Materials 2019, 12, 491. [Google Scholar] [CrossRef] [PubMed] [Green Version]
- Gurson, A. Continuum theory of ductile rupture by void nucleation and growth: Part 1—Yield criteria and flow rules for porous ductile media. J. Eng. Mater. Technol. 1977, 99, 2–15. [Google Scholar] [CrossRef]
- Tvergaard, V.; Needleman, A. Analysis of the cup-cone fracture in a round tensile bar. Acta Met. 1984, 32, 157–169. [Google Scholar] [CrossRef]
- Tvergaard, V. Influence of voids on shear band instabilities under plane strain conditions. Int. J. Fract. 1981, 17, 389–407. [Google Scholar] [CrossRef]
- Lemaitre, J. A Continuous damage mechanics model for ductile fracture. J. Eng. Mater. Technol. 1985, 107, 83–89. [Google Scholar] [CrossRef]
- Brünig, M.; Gerke, S.; Schmidt, M. Damage and failure at negative stress triaxialities: Experiments, modeling and numerical simulations. Int. J. Plast. 2018, 102, 70–82. [Google Scholar] [CrossRef]
- Khan, A.; Liu, H. A new approach for ductile fracture prediction on Al 2024-T351 alloy. Int. J. Plast. 2012, 35, 1–12. [Google Scholar] [CrossRef]
- Johnson, G.; Cook, W. Fracture characteristics of three metals subjected to various strains, strain rates, temperatures and pressures. Eng. Fract. Mech. 1985, 1, 31–48. [Google Scholar] [CrossRef]
- Kanvinde, A.; Deierlein, G. The void growth model and the stress modified critical strain model to predict ductile fracture in structural steels. J. Struct. Eng. 2006, 132, 1907–1918. [Google Scholar] [CrossRef]
- Wierzbicki, T.; Bao, Y.; Lee, Y.-W.; Bai, Y. Calibration and evaluation of seven fracture models. Int. J. Mech. Sci. 2005, 47, 719–743. [Google Scholar] [CrossRef]
- Lou, Y.; Chen, L.; Clausmeyer, T.; Tekkaya, A.E.; Yoon, J.W. Modeling of ductile fracture from shear to balanced biaxial tension for sheet metals. Int. J. Solids Struct. 2017, 112, 169–184. [Google Scholar] [CrossRef]
- Lou, Y.; Yoon, J.; Huh, H. Modeling of shear ductile fracture considering a changeable cut-off value for stress triaxiality. Int. J. Plast. 2014, 54, 56–80. [Google Scholar] [CrossRef]
- Lou, Y.; Huh, H.; Lim, S.; Pack, K. New ductile fracture criterion for prediction of fracture forming limit diagrams of sheet metals. Int. J. Solids Struct. 2012, 49, 3605–3615. [Google Scholar] [CrossRef] [Green Version]
- Wen, H.; Mahmoud, H. New model for ductile fracture of metal alloys. I: Monotonic loading. J. Eng. Mech. 2016, 2, 4015088. [Google Scholar] [CrossRef]
- Hu, Q.; Zhang, F.; Li, X.; Chen, J. Overview on the prediction models for sheet metal forming failure: Necking and ductile fracture. Acta Mech. Solida Sin. 2018, 31, 259–289. [Google Scholar] [CrossRef]
- Mu, L.; Zang, Y.; Wang, Y.; Li, X.L.; Stemler, P.M.A. Phenomenological uncoupled ductile fracture model considering different void deformation modes for sheet metal forming. Int. J. Mech. Sci. 2018, 141, 408–423. [Google Scholar] [CrossRef]
- Zhu, Y.; Engelhardt, M. Prediction of ductile fracture for metal alloys using a shear modified void growth model. Eng. Fract. Mech. 2018, 190, 491–513. [Google Scholar] [CrossRef]
- Quach, H.; Kim, J.-J.; Nguyen, D.-T.; Kim, Y.-S. Uncoupled ductile fracture criterion considering secondary void band behaviors for failure prediction in sheet metal forming. Int. J. Mech. Sci. 2020, 169, 105297. [Google Scholar] [CrossRef]
- Bai, Y.; Wierzbicki, T. Application of extended Mohr-Coulomb criterion to ductile fracture. Int. J. Fract. 2010, 161, 1. [Google Scholar] [CrossRef]
- Mohr, D.; Marcadet, S. Micromechanically-motivated phenomenological Hosford-Coulomb model for predicting ductile fracture initiation at low stress triaxialities. Int. J. Solids Struct. 2015, 67–68, 40–55. [Google Scholar] [CrossRef]
- Wang, P.; Qu, S. Analysis of ductile fracture by extended unified strength theory. Int. J. Plast. 2018, 104, 196–213. [Google Scholar] [CrossRef]
- Dotta, F.; Ruggieri, C. Structural integrity assessments of high pressure pipelines with axial flaws using a micromechanics model. Int. J. Press. Vessel. Pip. 2004, 81, 761–770. [Google Scholar] [CrossRef]
- Oh, C.-K.; Kim, Y.-J.; Baek, J.-H.; Kim, Y.-P.; Kim, W. A phenomenological model of ductile fracture for API X65 steel. Int. J. Mech. Sci. 2007, 49, 1399–1412. [Google Scholar] [CrossRef]
- Kofiani, K.; Nonn, A.; Wierzbicki, T. New calibration method for high and low triaxiality and validation on SENT specimens of API X70. Int. J. Press. Vessel. Pip. 2013, 111–112, 187–201. [Google Scholar] [CrossRef]
- Paredes, M.; Wierzbicki, T.; Zelenak, P. Prediction of crack initiation and propagation in X70 pipeline steels. Eng. Fract. Mech. 2016, 168, 92–111. [Google Scholar] [CrossRef]
- Testa, G.; Bonora, N.; Gentile, D.; Carlucci, A.; Madi, Y. Ductile fracture assessment of X65 steel using damage mechanics. Procedia Struct. Integr. 2017, 3, 508–516. [Google Scholar] [CrossRef]
- Rice, J.; Tracey, D. On the ductile enlargement of voids in triaxial stress fields. J. Mech. Phys. Solids 1969, 3, 201–217. [Google Scholar] [CrossRef] [Green Version]
- Yu, M. Advances in strength theories for materials under complex stress state in the 20th Century. Appl. Mech. Rev. 2002, 3, 169–218. [Google Scholar] [CrossRef]
- Bai, Y.; Wierzbicki, T. A new model of metal plasticity and fracture with pressure and Lode dependence. Int. J. Plast. 2008, 24, 1071–1096. [Google Scholar] [CrossRef]
- Swift, H. Plastic instability under plane stress. J. Mech. Phys. Solids 1952, 1, 1–18. [Google Scholar] [CrossRef]
- Tu, S.; Ren, X.; He, J.; Zhang, Z. Stress-strain curves of metallic materials and post-necking strain hardening characterization: A review. Fatigue Fract. Eng. Mater. Struct. 2019, 43, 3–19. [Google Scholar] [CrossRef] [Green Version]
- Sung, J.; Kim, J.; Wagoner, R. A plastic constitutive equation incorporating strain, strain-rate, and temperature. Int. J. Plast. 2010, 26, 1746–1771. [Google Scholar] [CrossRef]
- Luo, J.; Zhang, Y.; Li, L.; Zhu, L.; Wu, G. Fatigue failure analysis of dented pipeline and simulation calculation. Eng. Fail. Anal. 2020, 113, 104572. [Google Scholar] [CrossRef]
- Gao, J.; Peng, Z.; Li, X.; Zhou, J.; Zhou, W. Bending capacity of corroded pipeline subjected to internal pressure and axial loadings. In Proceedings of the ASME 2018 37th International Conference on Ocean, Offshore and Arctic Engineering, Madrid, Spain, 17–22 June 2018; Volume 3. [Google Scholar]
- Tee, K.; Wordu, A. Burst strength analysis of pressurized steel pipelines with corrosion and gouge defects. Eng. Fail. Anal. 2020, 108, 104347. [Google Scholar] [CrossRef]


| Specimen No. | RAR (%) | ||||||
|---|---|---|---|---|---|---|---|
| SRB-1 | 600 | 201,769 | 684 | 75% | 967 | 0.0127 | 0.116 |
| SRB-2 | 622 | 204,894 | 696 | 74% |
| Load and Displacement at the Fracture | Specimens | |||||
|---|---|---|---|---|---|---|
| R = 1.5 mm | R = 3.2 mm | R = 6.3 mm | ||||
| M1 | M2 | M3 | M4 | M5 | M6 | |
| (kN) | 33.7 | 33.1 | 27.9 | 29.6 | 25.7 | 25.6 |
| (mm) | 0.856 | 0.883 | 1.673 | 1.596 | 2.351 | 2.315 |
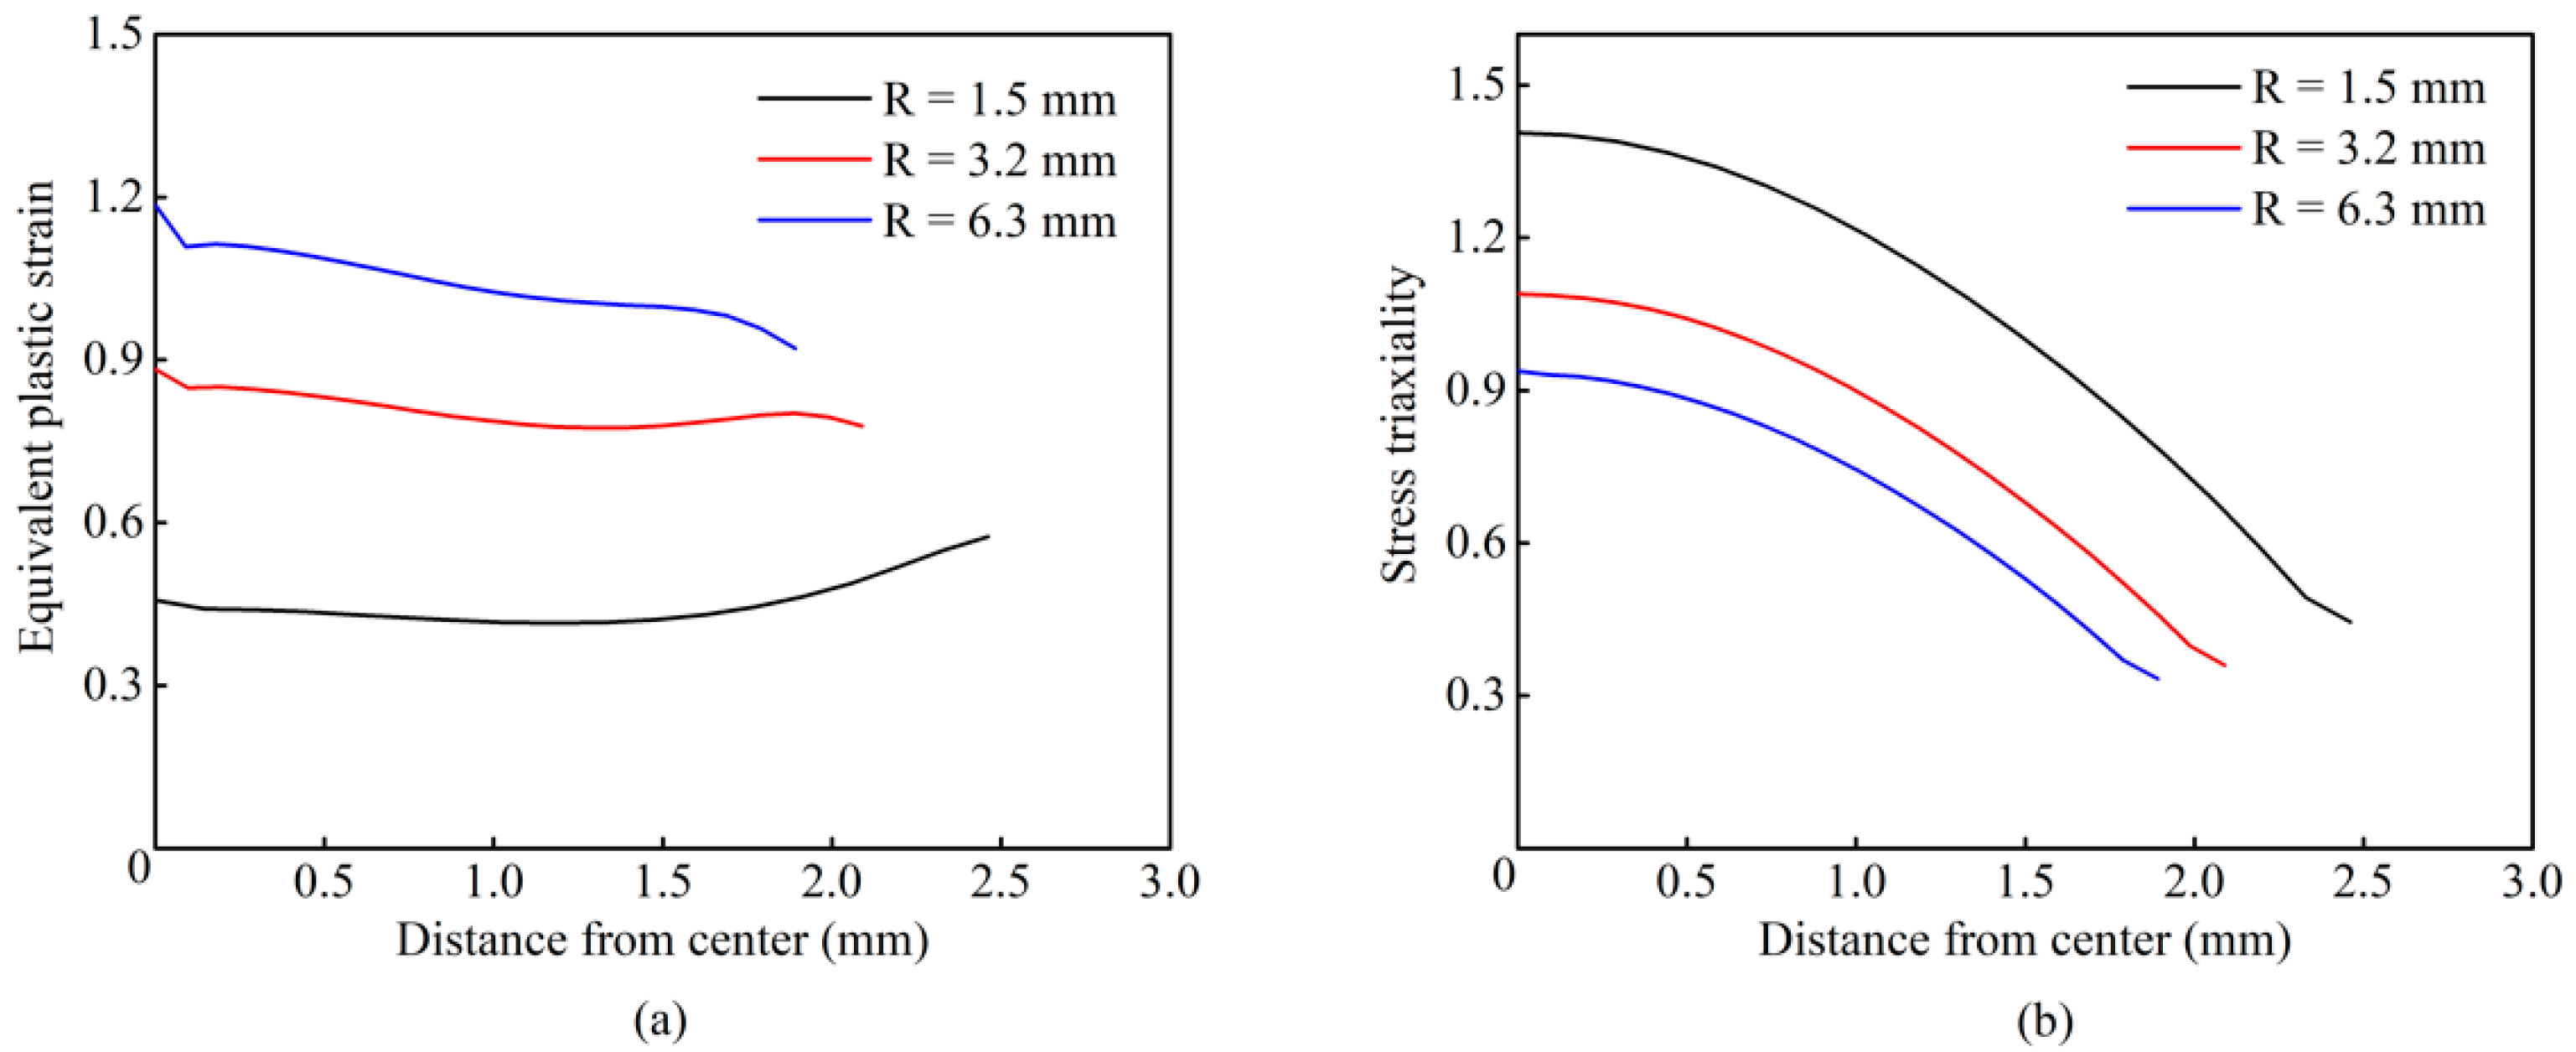
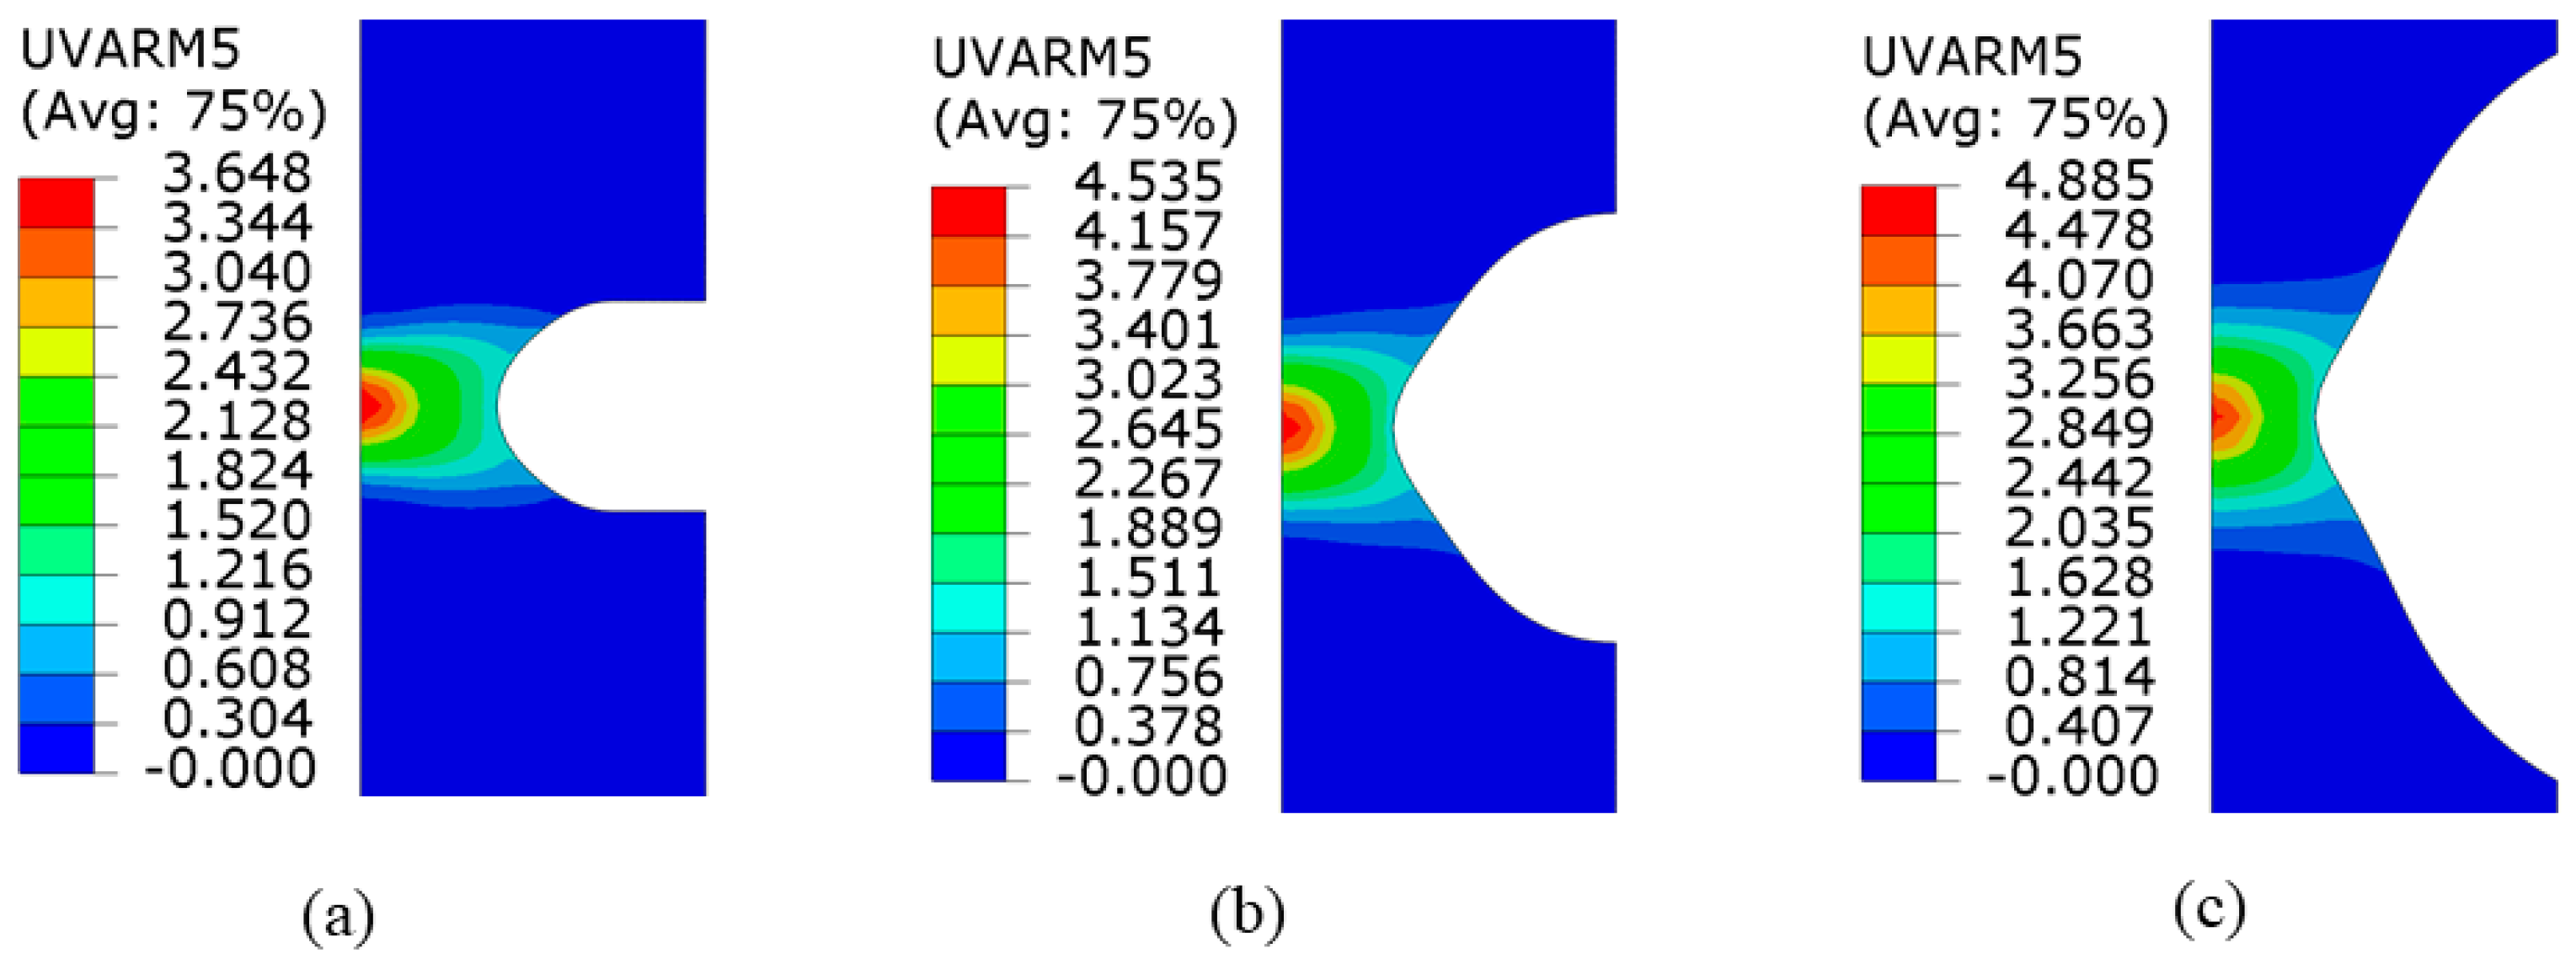
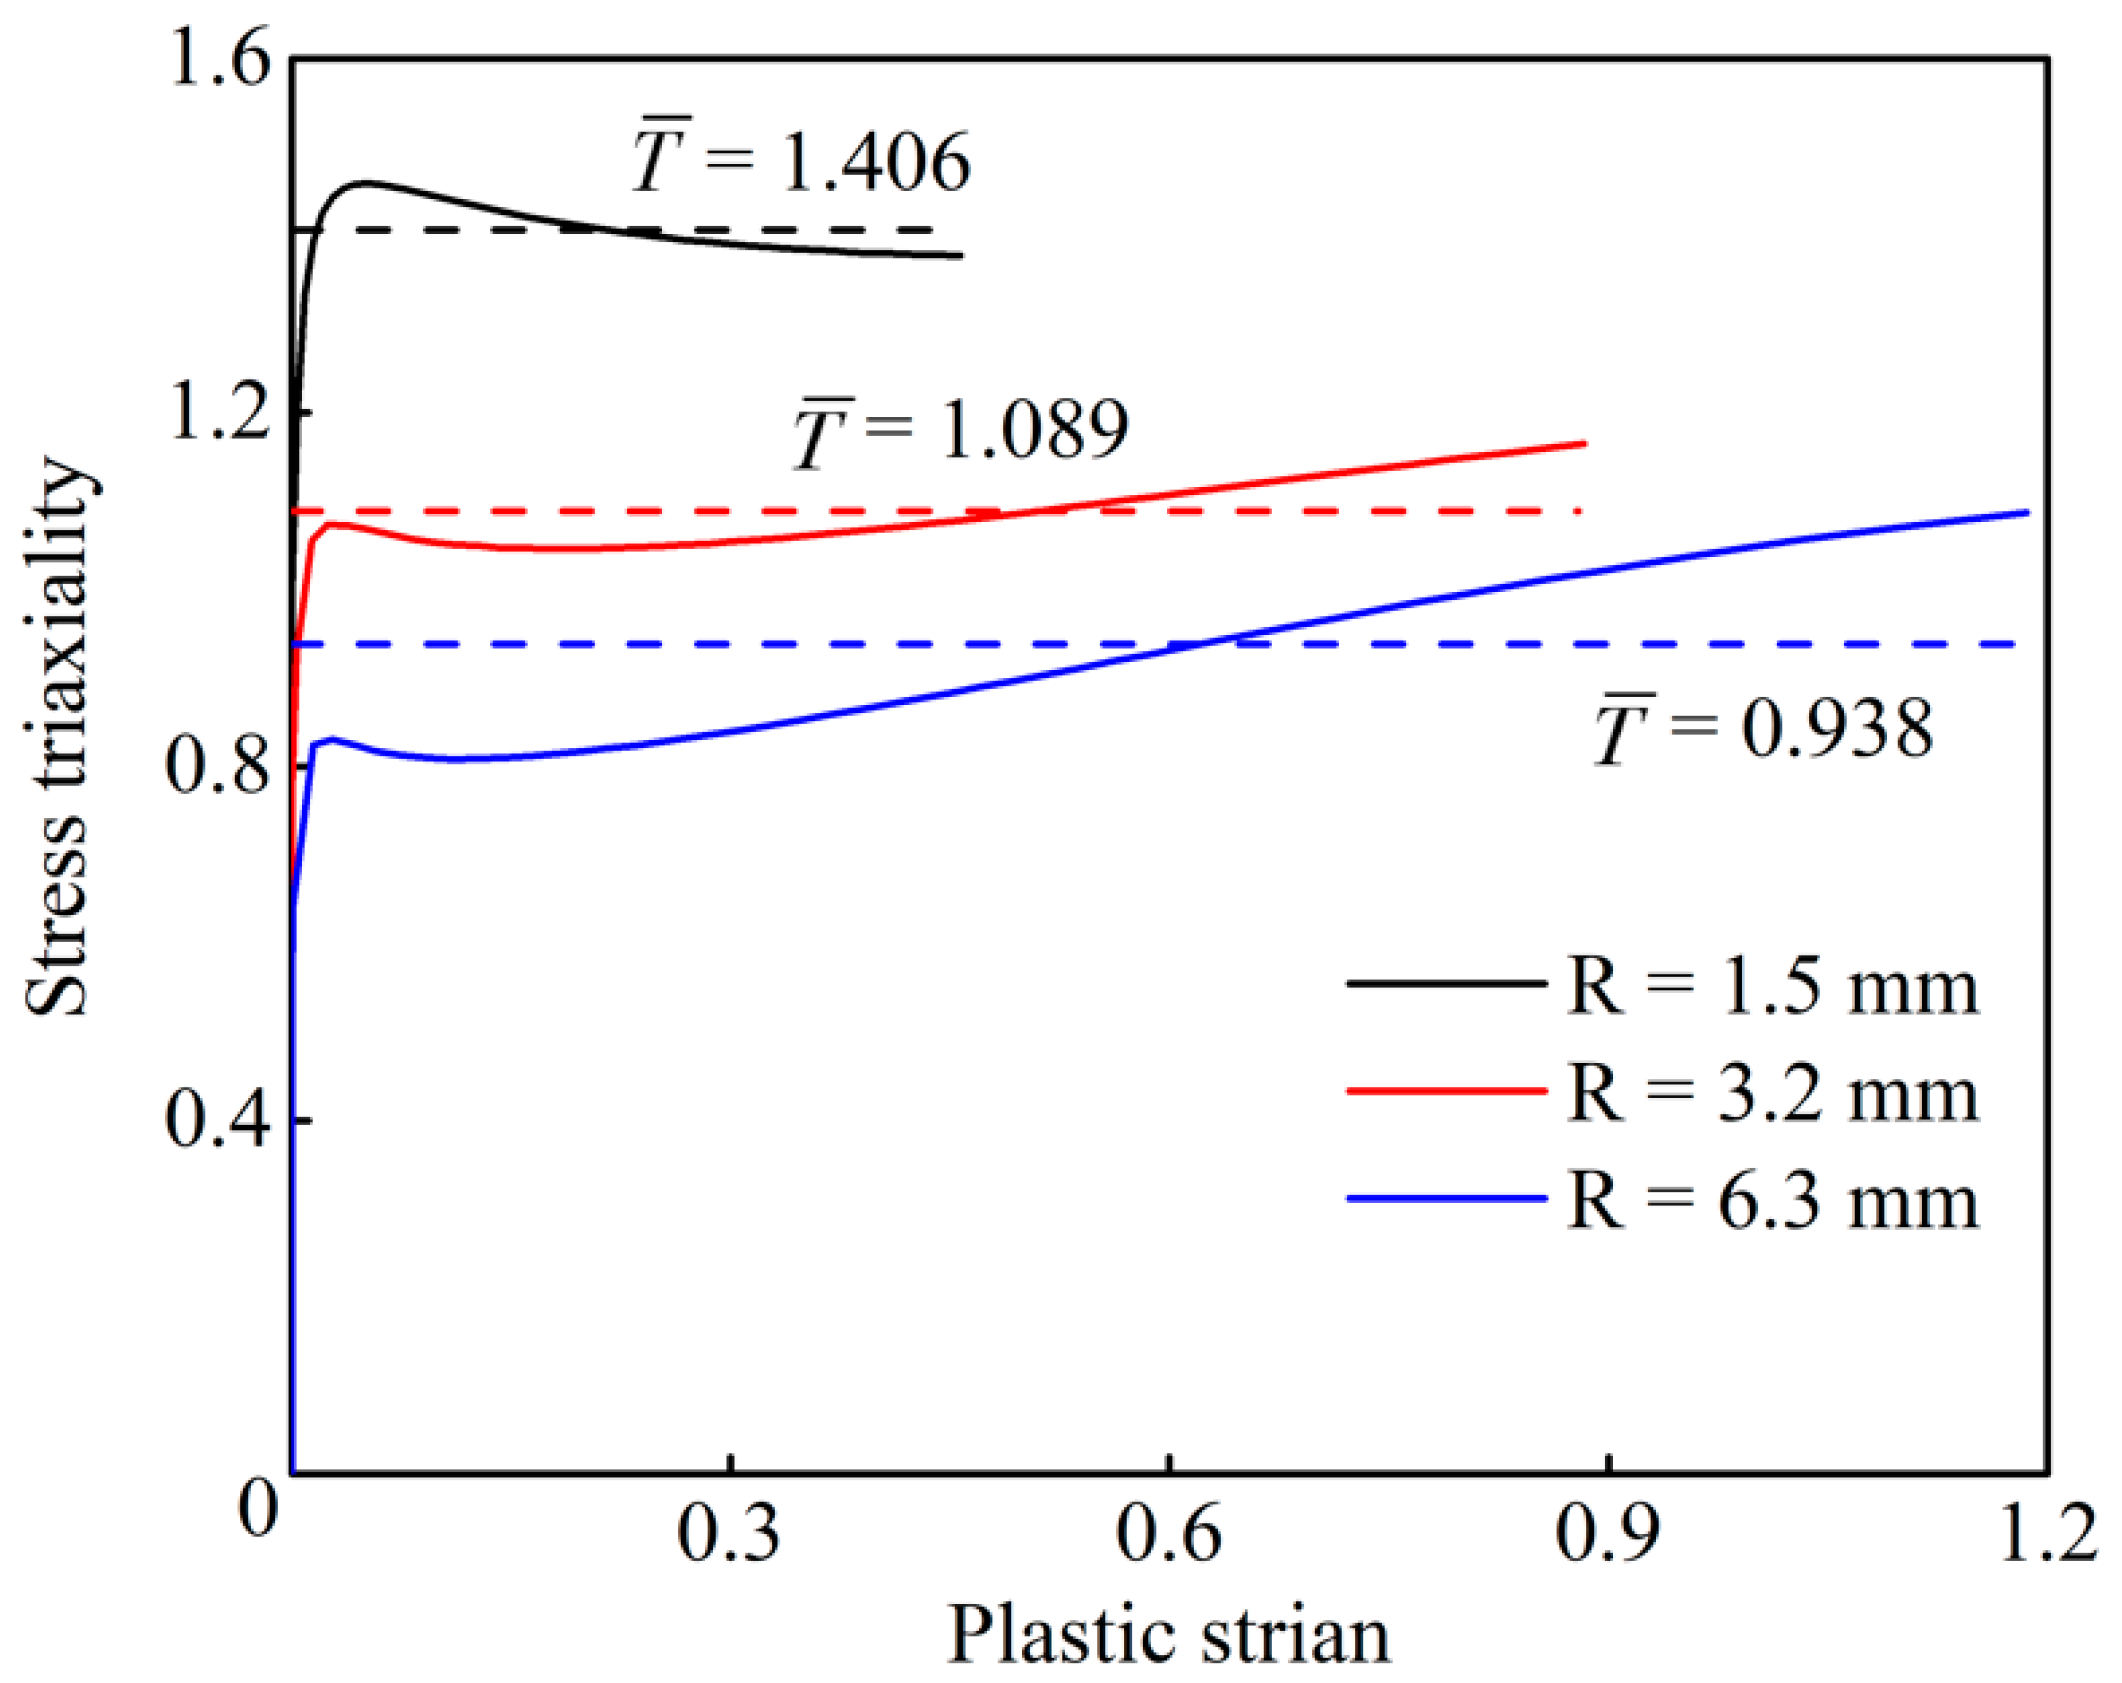
| Specimen No. | |||
|---|---|---|---|
| M1 | 1.406 | 0.442 | 3.648 |
| M2 | 1.406 | 0.457 | 3.768 |
| M3 | 1.089 | 0.883 | 4.535 |
| M4 | 1.089 | 0.838 | 4.276 |
| M5 | 0.938 | 1.186 | 4.885 |
| M6 | 0.933 | 1.153 | 4.714 |
| The average value | 4.304 | ||
Publisher’s Note: MDPI stays neutral with regard to jurisdictional claims in published maps and institutional affiliations. |
© 2022 by the authors. Licensee MDPI, Basel, Switzerland. This article is an open access article distributed under the terms and conditions of the Creative Commons Attribution (CC BY) license (https://creativecommons.org/licenses/by/4.0/).
Share and Cite
Feng, C.; Peng, Z.; Li, X.; Bao, S.; Jiang, X. Ductile Fracture Prediction of X80 Pipeline Steel Using Void Growth Model. Metals 2022, 12, 923. https://doi.org/10.3390/met12060923
Feng C, Peng Z, Li X, Bao S, Jiang X. Ductile Fracture Prediction of X80 Pipeline Steel Using Void Growth Model. Metals. 2022; 12(6):923. https://doi.org/10.3390/met12060923
Chicago/Turabian StyleFeng, Chunjian, Zengli Peng, Xin Li, Shiliu Bao, and Ximin Jiang. 2022. "Ductile Fracture Prediction of X80 Pipeline Steel Using Void Growth Model" Metals 12, no. 6: 923. https://doi.org/10.3390/met12060923
APA StyleFeng, C., Peng, Z., Li, X., Bao, S., & Jiang, X. (2022). Ductile Fracture Prediction of X80 Pipeline Steel Using Void Growth Model. Metals, 12(6), 923. https://doi.org/10.3390/met12060923