Abstract
Titanium-copper (Ti-Cu) alloy is an advanced antibacterial material with excellent mechanical properties, thermodynamic stability, corrosion resistance and biocompatibility. Sandblasting and acid-etching was applied to the Ti-3Cu alloy to construct a rough surface with Ti2Cu phase on the surface in order to improve the antibacterial properties and the osseointegration. The phase constitutes and the physical properties were characterized by X-ray diffraction (XRD), scanning electron microscopy (SEM) and confocal laser scanning microscope (CLSM), and the surface chemical properties were analyzed by X-ray photoelectron spectroscopy (XPS) and electrochemical testing. The antibacterial property was assessed by the plate-count method and the cell compatibility was evaluated by the CCK-8 test in order to reveal the effect of surface characteristics on the antibacterial ability and bioactivity. The results demonstrated a rough and lamellar surface structure with many submicron Ti2Cu particles on the surface of Ti-3Cu, which could enhance the antibacterial ability and promote the cell proliferation and the initial adhesion of osteoblasts. However, the surface treatment also reduced the corrosion resistance and accelerated the Cu ion release.
1. Introduction
Biomedical material is an important branch of materials science as well as an advanced field with rapid development [1,2]. Antibacterial titanium alloys have excellent corrosion resistance, biocompatibility, high specific strength and antimicrobial properties, so they have a good development prospect [3,4,5]. However, antibacterial titanium alloys are still a bioinert material without cellular activity. An ideal biomedical material should possess good bioactivity, thus, it is necessary to improve the surface biological activity of antibacterial titanium [6].
Previous studies have shown that there were many ways to improve osteoconduction such as calcium phosphate ceramics coating, chemical or physical treatment and topography regulation [2]. Numerous surface modifications have been reported to enhance their bio-functions, including growth factors, enzymes, extracellular matrix, etc. Hydroxyapatite (HA) has been widely applied as a bioactive implant coating owing to its excellent bioactivity [7]. However, some deficiencies, e.g., high costs, short-term stability and high dosage requirements, significantly limited its clinical applications. Another way to improve biocompatibility was to get a rough surface, which improved the bonding strength between bone and the implant. Sandblasting large-grit acid-etching (SLA) was one of the most prevalent surface modification methods. Experiments had shown that sandblasting could increase the shear strength of bone and implant by up to five times. After SLA treatment, a multi-hierarchical structure was established on the surface, meanwhile, the roughness increased significantly [8]. Studies affirmed that SLA treated samples possessed excellent biocompatibility, which promoted the proliferation and differentiation of osteoblasts near the implant, thus producing more chemical media and growth factors [9]. Nedir et al. reported that SLA treated surface was more conducive to the adhesion of osteoblasts compared with the acid-etched one [10,11]. Kaluderovic et al. performed sandblasting acid etching on the surface of titanium and titanium alloys, and the results of in vitro experiments showed that Ti-SLA and TiZr-SLA had better osteogenic differentiation ability, significantly promoted the formation of bone nodules and cell mineralization, and accelerated the process of bone integration [12]. De Tullio et al. implanted sandblasted and acid-etched titanium implants in sheep, and the results showed that the sandblasted and acid-etched titanium implants had higher binding strength with bone in a shorter healing time than mechanical titanium implants [13].
However, it is necessary to reduce the bacterial infection while improving the surface activity of implants. Shirai et al. first reported the antibacterial ability of the Ti-Cu alloy, displaying that 2wt% Cu addition provided the titanium with certain antibacterial properties [14]. Yang and his team developed Ti-xCu and Ti-6Al-4V-xCu antibacterial titanium alloy series, indicating that the antibacterial properties were improved as the Cu content increased [15,16,17,18]. As for the antibacterial mechanism of Ti-Cu alloy, it was believed that the close contact with Ti2Cu precipitates played a key role and the Cu ion release benefited the antibacterial properties to some extent [1,19,20].
Based on the above considerations, sandblasting was used in this research to produce a rough surface and acid-etching was applied to make more Ti2Cu particles appear on the surface in order to improve the surface biocompatibility and enhance the antibacterial performance simultaneously. The primary results demonstrated that Ti-3Cu treated with sandblasting and acid etching could reach 99.9% antibacterial rate and accelerated the growth and differentiation of MC3T3-E1 cells.
2. Experimental
2.1. Preparation of Samples
Ti-3Cu samples were sliced from a Ti-3Cu bar and heat treated at 900 °C/5 h (KSL-1200X, Hefei Kojing Material Technology Co., LTD, Hefei, China), sand blasted (LZBP-VI, Wuhan Golden Light Medical Technology Co. LTD, Wuhan, China) first at 6.0 MPa by 120 mesh Al2O3 particle to produce their rough surface, and then aged at 600 °C/24 h and acid etched by a mixture acid of HCl:H2SO4:H2O = 1:1:20, named Ti-3Cu-M sample. Meanwhile, Ti-3Cu samples were heat treated at 900 °C/5 h and 600 °C/24 h for comparison, named Ti-3Cu.
2.2. Surface Characteristics
Phase identification was conducted on a D/MAX-RB Rigaku X-ray diffraction with Cu Kα radiation (Shimazu-Kratos Analytical, Manchester, UK). Surface microstructure was observed on a JSM6360LV scanning electron microscope (SEM) (ULTRA PLUS, Zeiss group, Oberkochen, Germany) with an energy dispersive X-ray spectrometer (EDS). The chemical states of Ti and Cu elements were investigated by X-ray photoelectron spectroscopy (XPS, Thermo Scientific Escalab 250Xi, Shimazu-Kratos Analytical, Manchester, UK). The surface roughness (Ra) was assayed by a confocal laser scanning microscope (CLSM, OLS4100, OLYMPUS, Tokyo, Japan) and the hydrophilicity was examined with a contact angle goniometer (SL200KS, Shanghai, China) with distilled water. Three samples were measured to get the mean value and standard deviation.
2.3. Biocorrosion Property
The biocorrosion properties were tested on a Versa STAT V3-400 electrochemical workstation(Ametek Group, DE, USA) in PBS solution at 37 °C. In a standard three-electrode configuration, saturated calomel was used as a reference electrode, platinum as a counterelectrode and the sample as a working electrode. According to ISO standard 10271: in 2001 [21], the potentiodynamic polarization curve (Tafel) was tested at a scanning rate of 0.5 mV/s in the range of −0.15 V to 0.75 V. To ensure the reliability, at least three parallel samples were measured.
2.4. Antibacterial Properties
The antibacterial activity of Ti-3Cu, Ti-3Cu-M samples and the negative control sample (cp-Ti) was assessed by the plate count method. The samples were washed with acetone and ethanol for 10 min before the experiment and sterilized with an alcohol lamp. Gram-positive (S. aureus, ATCC 6538) bacteria were used in the test. During the test, 100 µL of a bacterial suspension with 105 CFU/mL was dropped on the sample surface and incubated under a humidity of 90% at 37 °C for 24 h. After the incubation, the sample was washed with 2 mL 0.9% NaCl saline to make sure that all adhered bacteria were removed from the surface, and 100 μL of the washing solution was spread on a solid agar plate and cultured for 24 h to count the colony forming units (CFUs). The antibacterial rate (AR) was determined by the following formula:
where, CFUsample and CFUcontrol are the colony forming units on the sample and the negative control sample, respectively.
AR = (CFUcontrol − CFUsample)/CFUcontrol × 100%
For SEM morphology observation, the samples with adhered bacteria were immersed in 2.5% glutaraldehyde over 2 h and dehydrated with gradient alcohol (30%, 50%, 70%, 90% and 100%) for 10 min each, and then vacuum dried and treated by gold plasma sputtering finally. The morphology of the bacteria was observed on SEM.
For live/dead fluorescent staining, the sample with bacteria was rinsed twice with 0.9% NaCl saline and stained in darkness for 15 min with LIVE/DEAD® BacLightTM Bacterial Activity Kit (L7007, Invitrogen, Walthanm, MA, USA). Then the excess dye was washed out with 0.9% NaCl saline, and the sample was observed under a fluorescence microscope (BX53, Olympus, Tokio, Japan) with 480/500 nm as the excitation/emission wavelength of green fluorescence and 490/635 nm as the excitation/emission wavelength of red fluorescence.
2.5. Cell Compatibility
MC3T3-E1 cells (Shanghai Institutes of Biological Science, Shanghai, China) with a cell suspension of 2 × 10⁴ cells/mL were seeded onto the sample surface and co-cultured in 5% CO2 humidified atmosphere for 1, 3 and 5 days, respectively. A total of 50 μL Cell Counting Kit-8 (CCK-8) assay was added to each well and incubated at 37 °C for 3 h to assess the cell viability. Then, 100 μL of the culture medium was transferred to a 96-well plate and the optical density (OD) value was determined on a reader (Imar) at a wavelength of 450 nm.
For cytoskeleton observation, the cells were rinsed with PBS twice, fixed with 4% paraformaldehyde, permeabilized with 0.2% Triton X-100 (Sigma, Shanghai, China), stained with phalloidin fluorescein isothiocyanate (Beyotime, Shanghai, China) for 60 min, and then stained with 40,6-diamidino-2-phenylindole (DAPI, Beyotime, Shanghai, China) for 5 min. The sample was observed on a fluorescence microscope with 488 nm/520 nm and 358 nm/461 nm being the excitation/emission wavelengths for green and blue fluorescence, respectively.
2.6. Statistical Analysis
The data were repeated at least 3 times and the results are shown as mean ± stand deviation (SD). A value of p < 0.05 was considered to be significant statistically.
3. Results
3.1. Phase Constitution and Surface Characterization
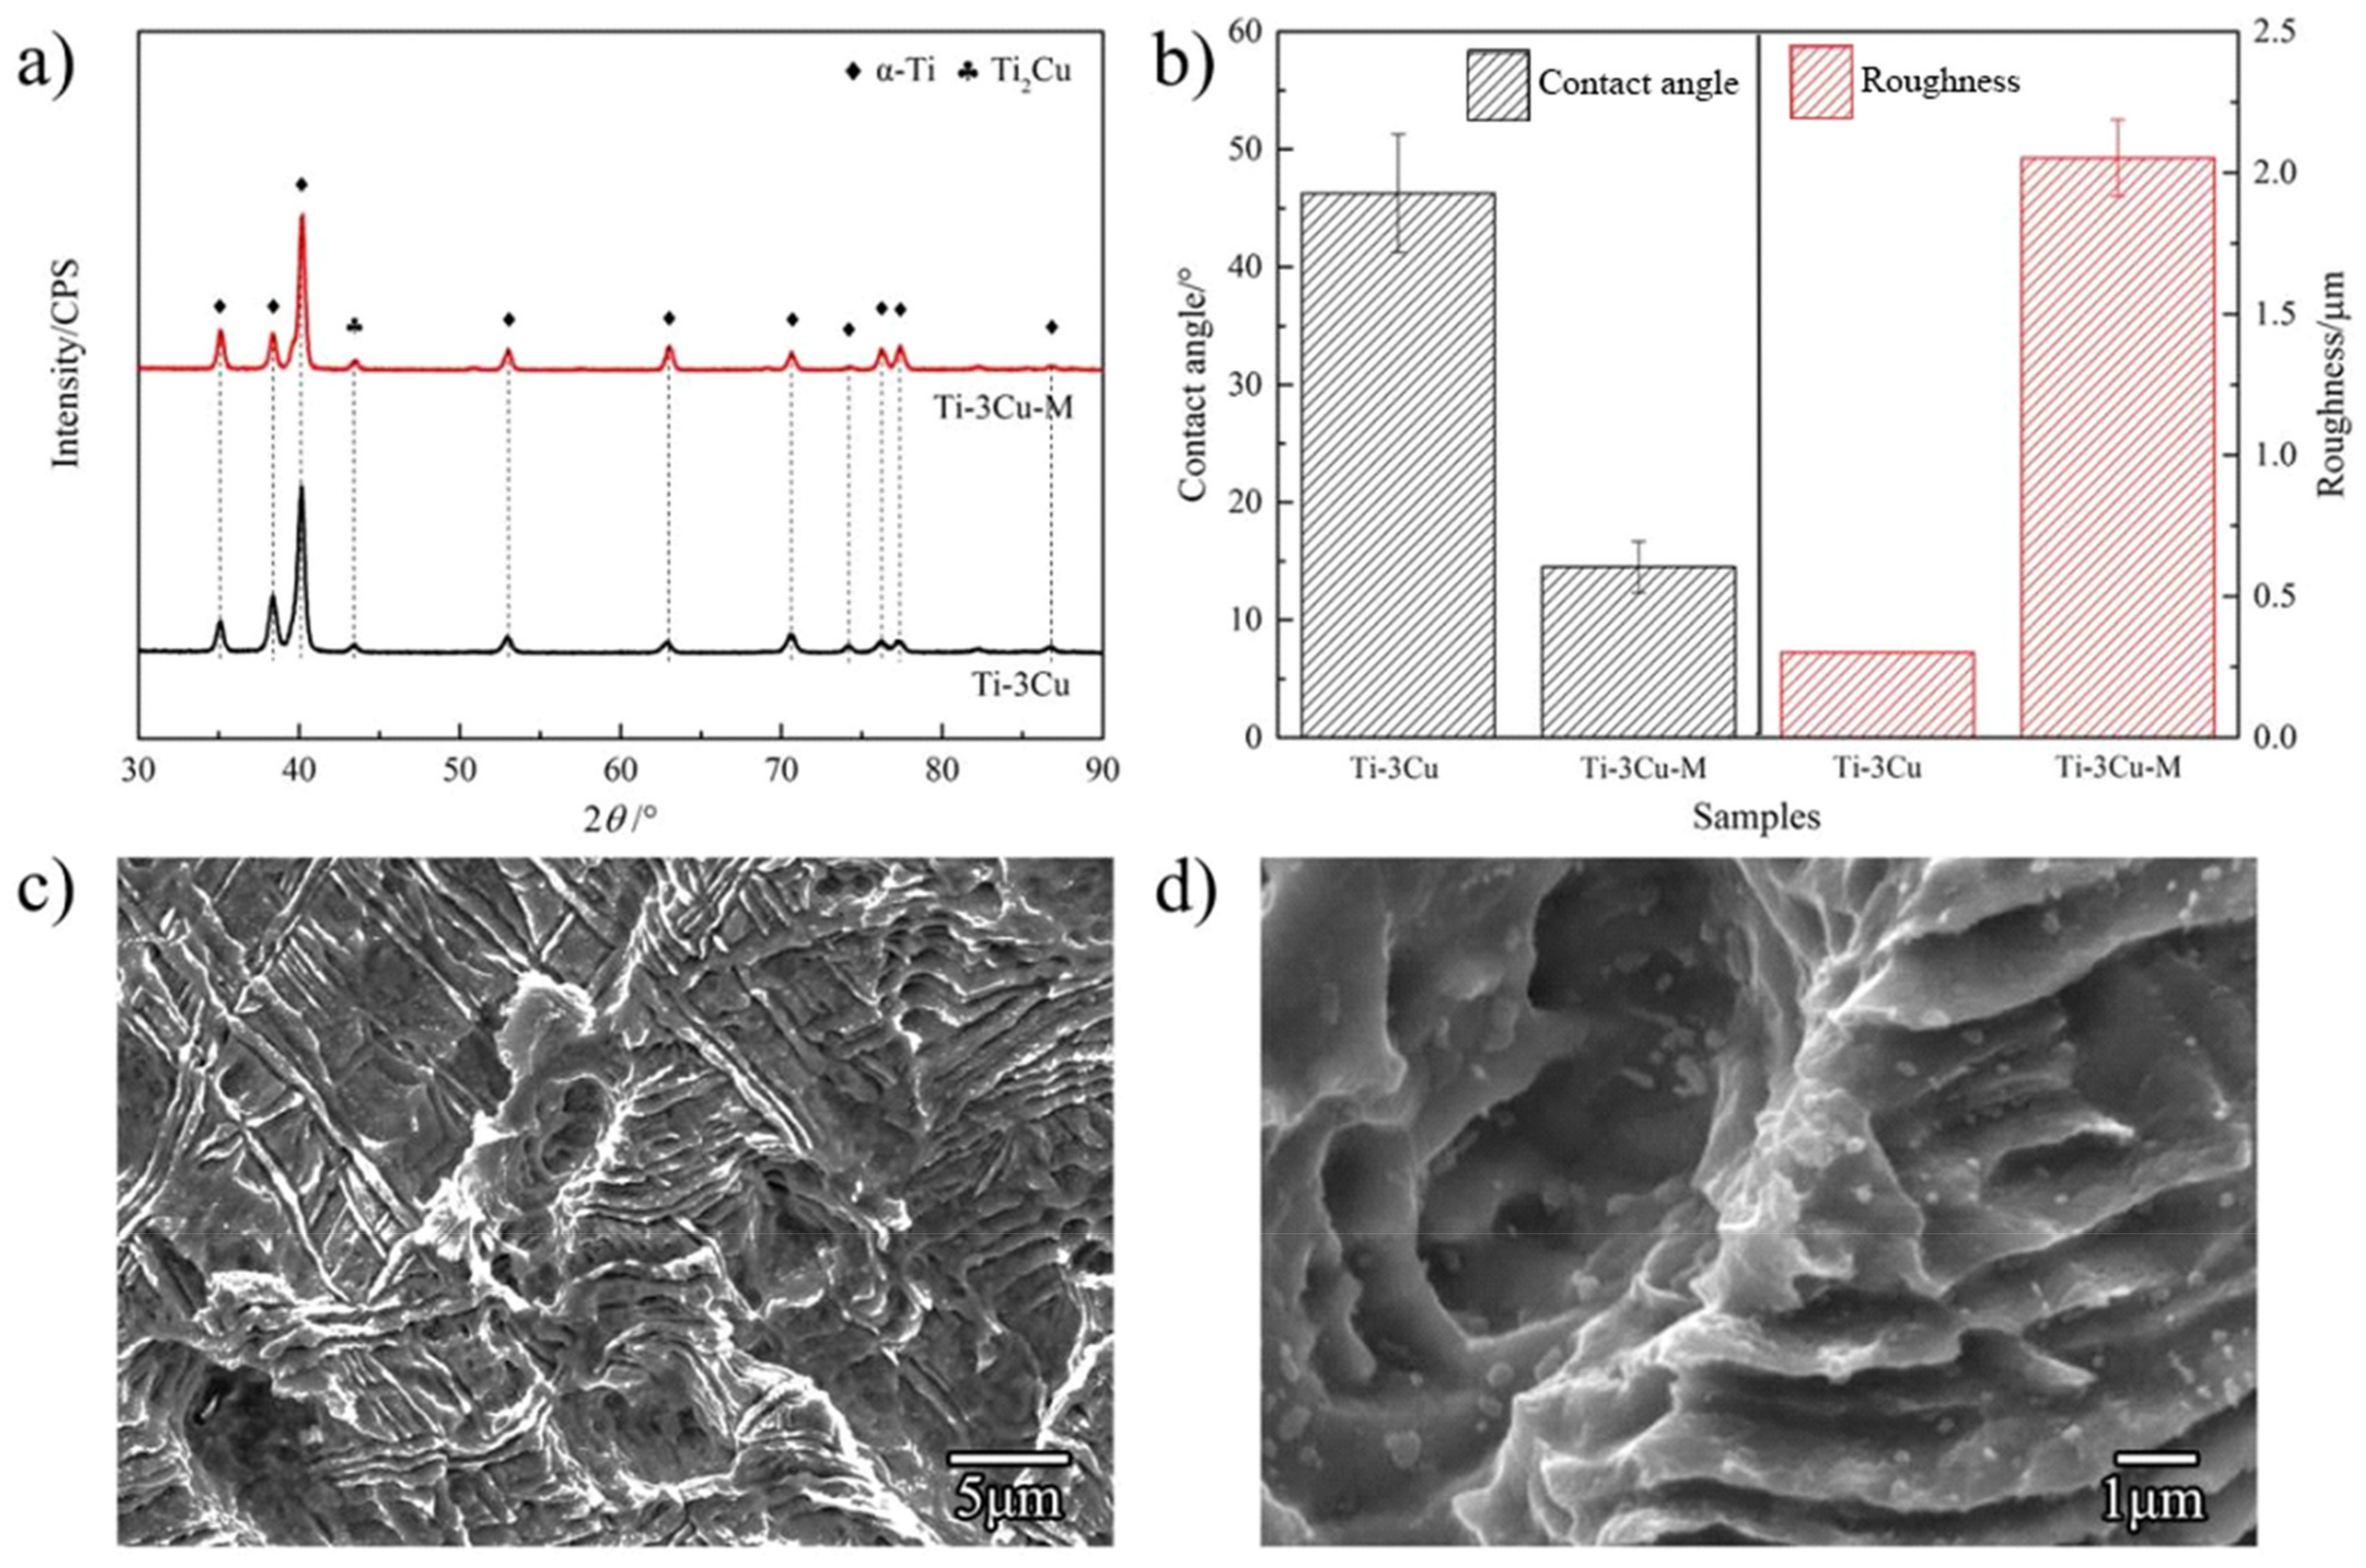
Figure 1a shows the phase identification results of Ti-3Cu and Ti-3Cu-M samples. α-Ti phase and Ti2Cu phase were detected in Ti-3Cu and Ti-3Cu-M samples. After the surface treatment, a rough and lamellar surface structure with white particles was formed on the surface, shown in Figure 1c,d. Figure 1b shows the water contact angle and the roughness of the samples. The water contact angle of Ti-3Cu and Ti-3Cu-M is 46.3 ± 5.0° and 14.5 ± 2.2°, respectively, suggesting that the surface treatment significantly improved the hydrophilicity of the Ti-Cu sample. The roughness of Ti-3Cu and Ti-3Cu-M is 0.3 μm and 2.0 μm, respectively, indicating that the surface treatment significantly increased the surface roughness.

Figure 1.
Physical properties of the Ti-3Cu sample and Ti-3Cu-M sample. (a) XRD pattern of Ti-3Cu and Ti-3Cu-M samples, (b) the water contact angle and the roughness, (c) low magnification and (d) high magnification surface morphology of the Ti-3Cu-M sample.
3.2. Chemical Properties
Figure 2a–c shows XPS spectra of the Ti-3Cu-M sample. The diffraction peaks of Ti, O and Cu were detected, indicating that the surface mainly composed of Ti, O and Cu elements. Figure 2b shows the high-resolution Ti 2p spectra of the Ti-3Cu-M sample. There were three peaks of Ti at the positions of 464.5 eV, 458.6 eV and 454.2 eV, respectively. After fitting, the first two peaks were the peaks of Ti4+, representing Ti 2p1/2 and Ti 2p3/2 respectively, and the third peak was the peak Ti0, indicating that part of Ti on the sample surface was oxidized to TiO2 after the surface modification. Figure 2c shows the high-resolution Cu 2p spectra on the Ti-3Cu-M sample surface. There were two peaks of Cu 2p1/2 and Cu 2p3/2 at 952.6eV and 932.6eV, respectively. After fitting, these two peaks were confirmed as the peak of Cu0. This indicates that no Cu oxide was formed on the surface after the surface modification.
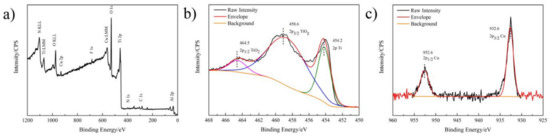
Figure 2.
Surface Chemical properties of Ti-3Cu-M samples. (a) XPS full spectra, (b) high-resolution spectra of Ti 2p, (c) high-resolution spectra of Cu 2p.
Figure 3a,b shows the OCP and Tafel curves of Ti-3Cu and Ti-3Cu-M samples in 0.9% NaCl. The self-corrosion potential (Ecorr) and the self-corrosion current density (icorr) were obtained by extrapolation from Figure 3a,b, as listed in Table 1. Compared with the Ti-3Cu sample, the surface modification moved Tafel curve toward a more negative potential direction and high current density direction. Ecorr and icorr in Table 1 clearly displays that the modified samples exhibited a more negative Ecorr, about −0.404V in comparison with -0.217V of Ti-3Cu and a higher icorr, about 4.38 × 10⁻⁷A/cm2 in comparison with 5.44 × 10⁻⁸A /cm2 of Ti-3Cu, suggesting that the surface modification apparently accelerated the corrosion.
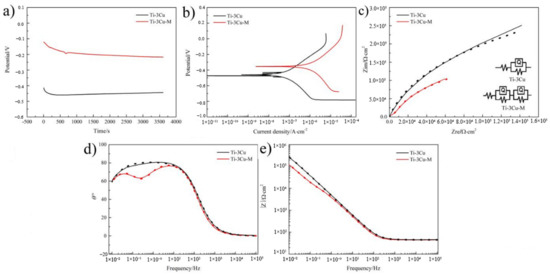
Figure 3.
Electrochemical biocorrosion properties of the Ti-3Cu sample and Ti-3Cu-M samples. (a) Open-circuit potential curves, (b) Tafel curves, (c) Nyqiust diagrams, the insert shows the Equivalent circuit, (d,e) Bode phase plots.

Table 1.
Electrochemical data of Ti-Cu samples obtained from OCP and Tafel curves.
Figure 3c shows Nyquist curves of the Ti-3Cu and Ti-3Cu-M samples. The diameter of the semicircle is considered as the polarization resistance of the passivative film. Figure 3d shows Bode and Bode-phase plots obtained in the 0.9%NaCl solution. In the high frequency region, the impedance coefficient |Z| tended to be a constant value independent of frequency in the range of 105 to 10 Hz, which indicates that the impedance was mainly determined by the solution resistance (resistance zone). In the low and medium frequency region, the curves showed a linear portion of the slope approaching, which is generally the characteristic response to the capacitive behavior of the passivated film. The inserted in Figure 3c shows the simple equivalent circuit models, where Rs is the solution resistance, Rp and Rb are the inner dense layer and the outer rough layer resistance, respectively, and Qb and Qp are the constant phase angle elements, respectively. Table 2 lists calculated electrochemical data. The corrosion resistance of Ti-3Cu-M was lower than that of the Ti-3Cu matrix, suggesting that the surface modification reduced the corrosion resistance of the Ti-3Cu sample.
Table 2.
Electrochemical data of Ti-Cu samples obtained from EIS.
Figure 4 shows the Cu ion accumulated release concentration of Ti-3Cu-M with the immersion time. The Cu ion release concentration increased with the extension of immersion. For example, the concentration was about 0.120 mg/L at the first day and 0.25 mg/L at the 22nd day. On the other hand, Cu ion was released continuously and slowly for the modified sample.
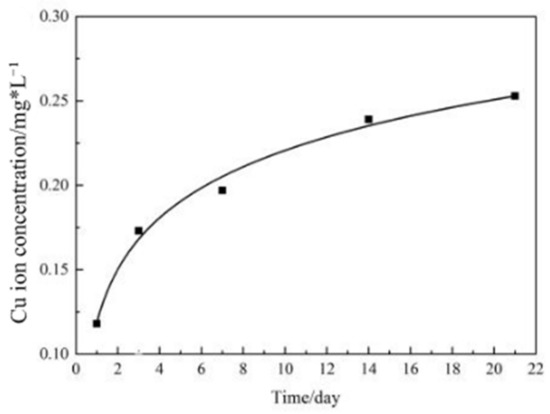
Figure 4.
Cu ion accumulative concentration with immersion time of the Ti-3Cu-M sample.
3.3. Antibacterial Property
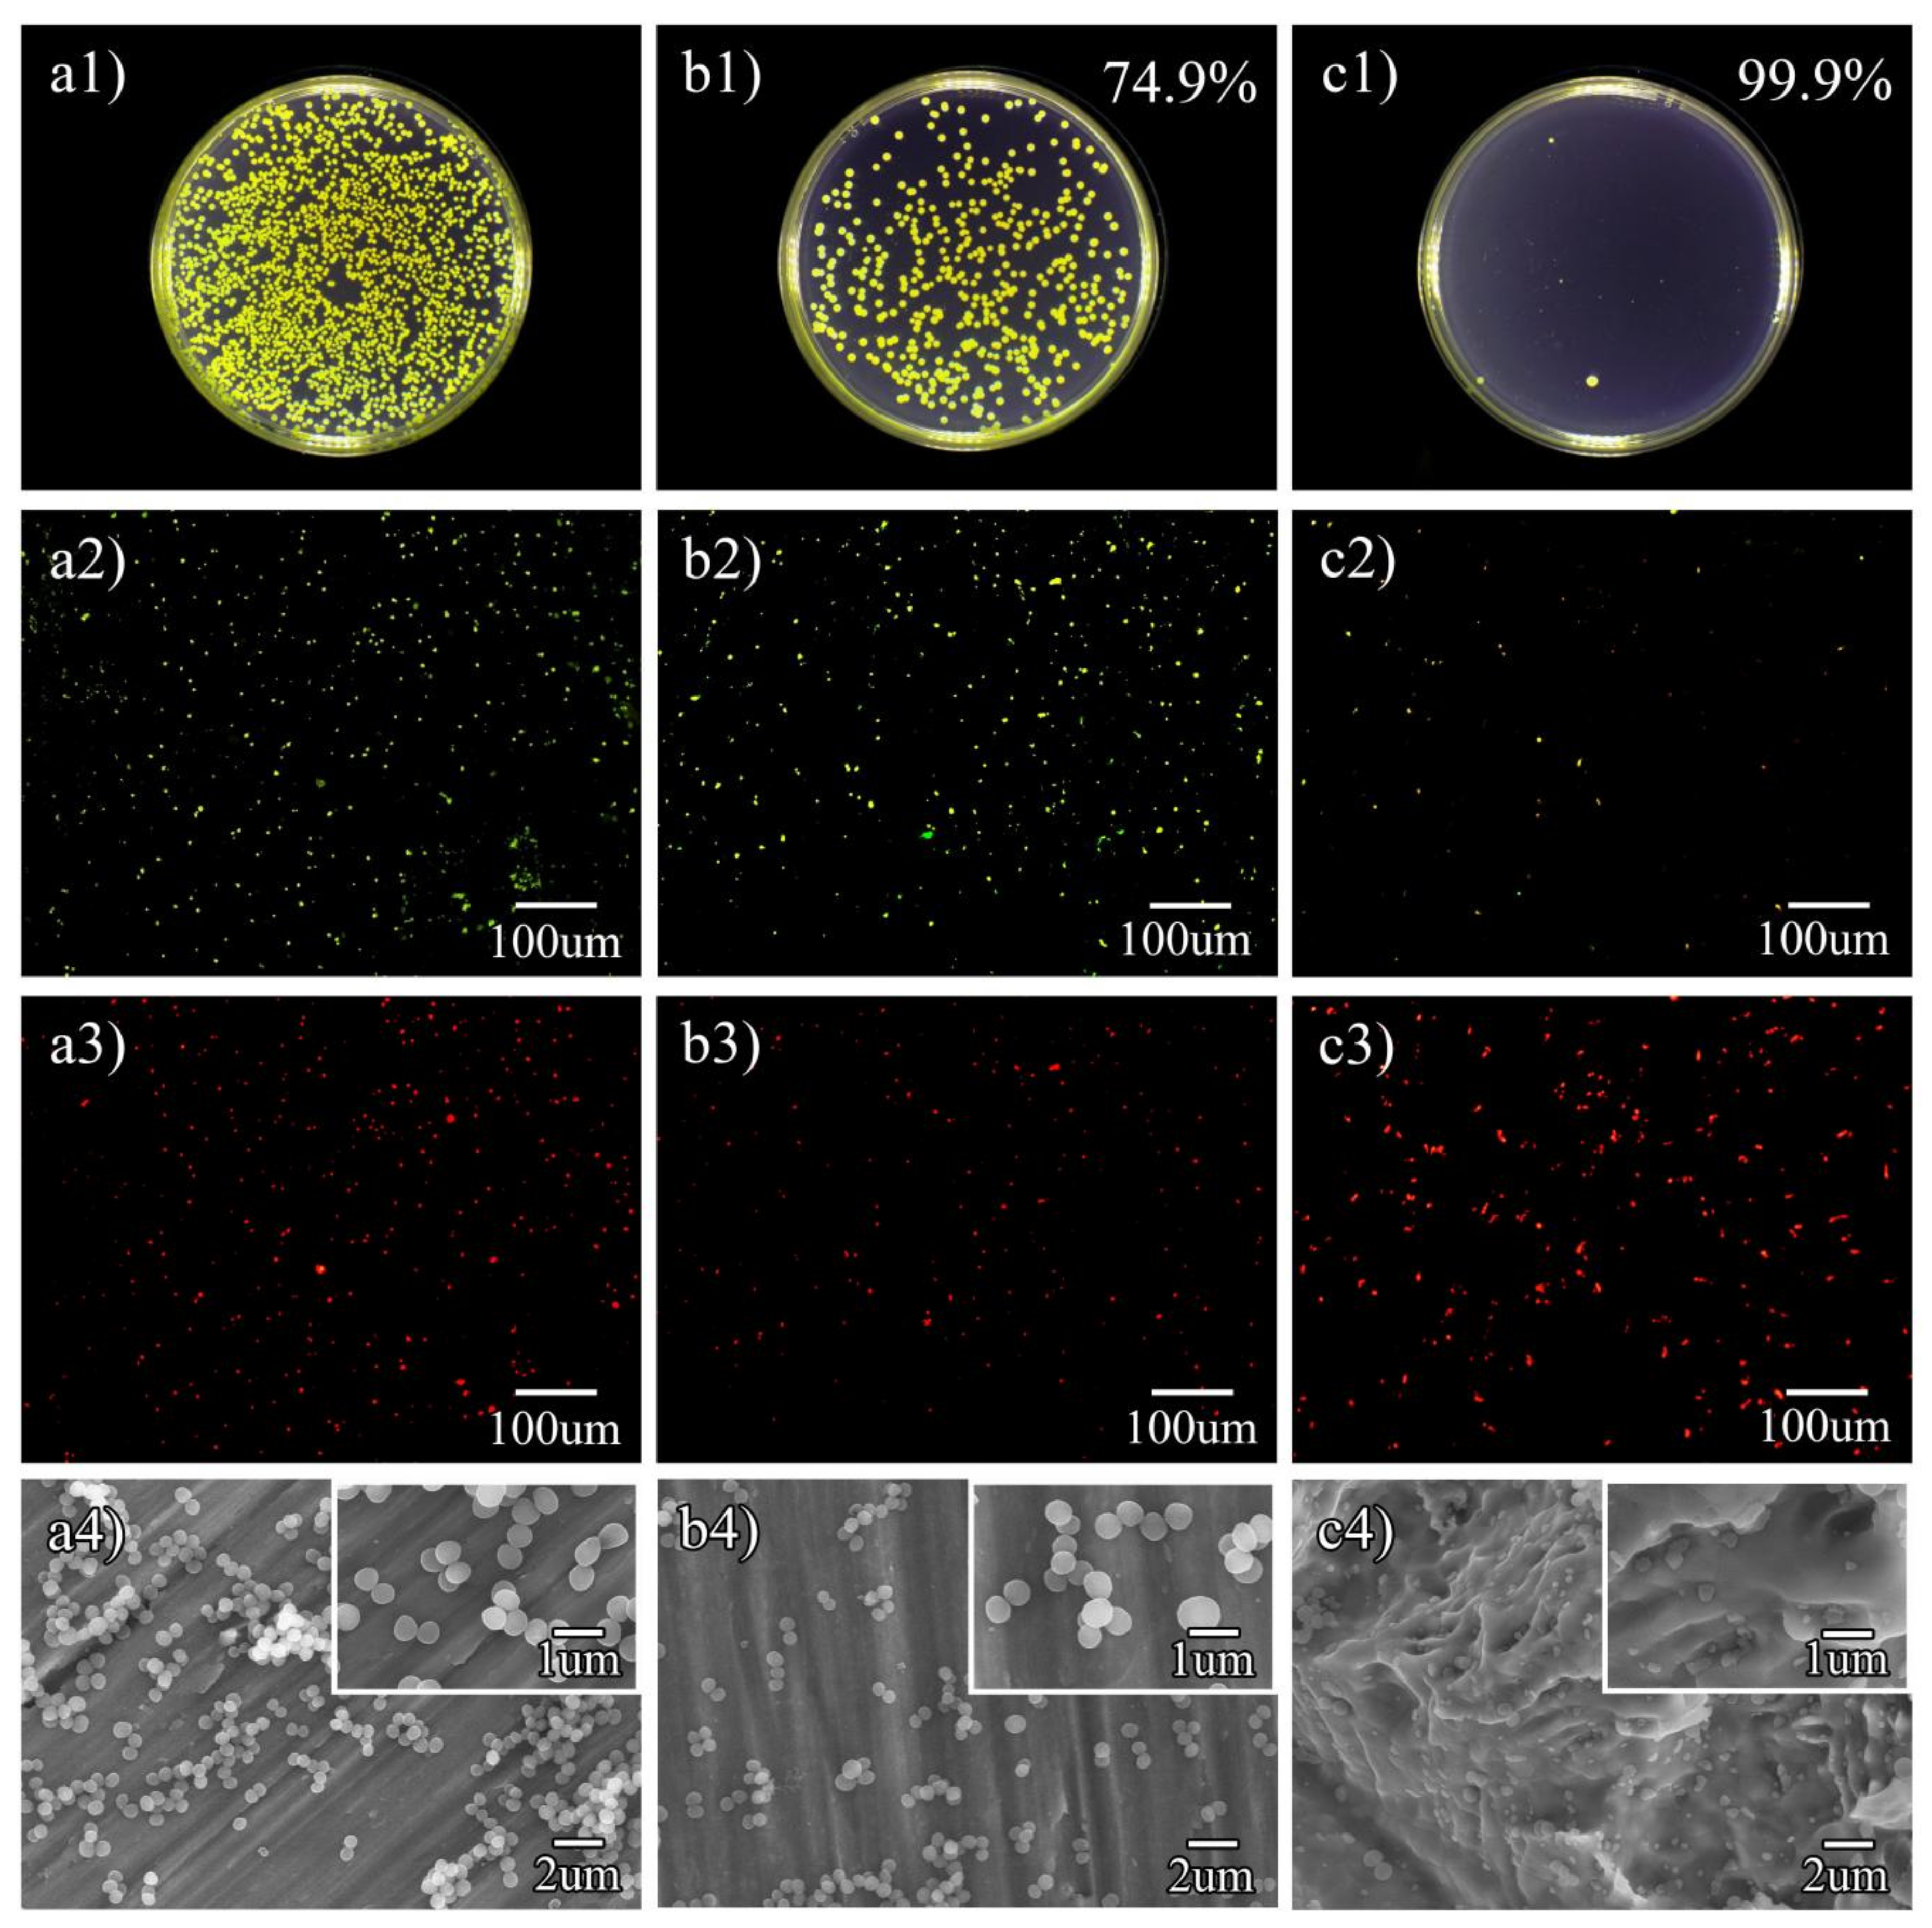
Figure 5(a1–a3) shows the S.aureus colonies on cp-Ti, Ti-3Cu and Ti-3Cu-M, respectively. As shown in Figure 5(b1), the colonies on the surface of Ti-3Cu were less than that on cp-Ti, indicating that Ti-3Cu had a very good antibacterial property (antibacterial rate 74.9%). There was almost no colony on the surface of Ti-3Cu-M samples, as shown in Figure 5(c1), demonstrating that the surface modification treatment significantly improved the antibacterial property of the Ti-3Cu alloy (antibacterial rate 99.9%).

Figure 5.
Typical bacteria colony, Live/dead staining and SEM morphology on different samples. (a1–a4) cp-Ti, (b1–b4) Ti-3Cu, (c1–c4) Ti-3Cu-M. (a1,b1,c1) Typical bacteria colony, the insert number shows the calculated antibacterial rate, (a2,b2,c2) Live staining, (a3,b3,c3) Dead staining, (a4,b4,c4) SEM morphology of bacteria, the insert shows the high magnification morphology.
The live/dead staining images of S. aureus co-cultured on the samples for 24 h are shown in Figure 5(a2–c2,a3–c3). There were a large amount of live bacteria (green fluorescence) and a few dead bacteria (red fluorescence) on the surface of cp-Ti, as shown in Figure 5(a2,a3). There were fewer live bacteria but lots of dead bacteria on the surface of Ti-3Cu samples as shown in Figure 5(b2,b3), confirming the improved antibacterial property of Ti-3Cu. Only several live bacteria and a large amount of dead bacteria were found on the surface of Ti-3Cu-M samples, as shown in Figure 5(c2,c3), demonstrating the strong antibacterial property of the Ti-3Cu-M sample.
The morphology of S. aureus on the samples’ surfaces after 24 h incubation are shown in Figure 5(a4–c4). From Figure 5(a4), there were a great quantity of bacteria on the surface of cp-Ti and the bacteria accumulated and some of them stacked together. At a high magnification, the bacteria were in a spherical shape, the cell walls were intact and some of them were in the state of dichotomy, revealing the good health condition of the bacteria. On the surface of Ti-3Cu, as shown in Figure 5(b4), fewer bacteria were observed. However, no obvious change in bacterial morphology was found. On the surface of the Ti-3Cu-M sample, Figure 5(c4), nearly no bacteria was found on the surface. At a high magnification, the bacteria atrophied and deformed, the membrane was dissolved and cytoplasm leakage was observed, which all certificated the strong antibacterial properties of the Ti-3Cu-M samples.
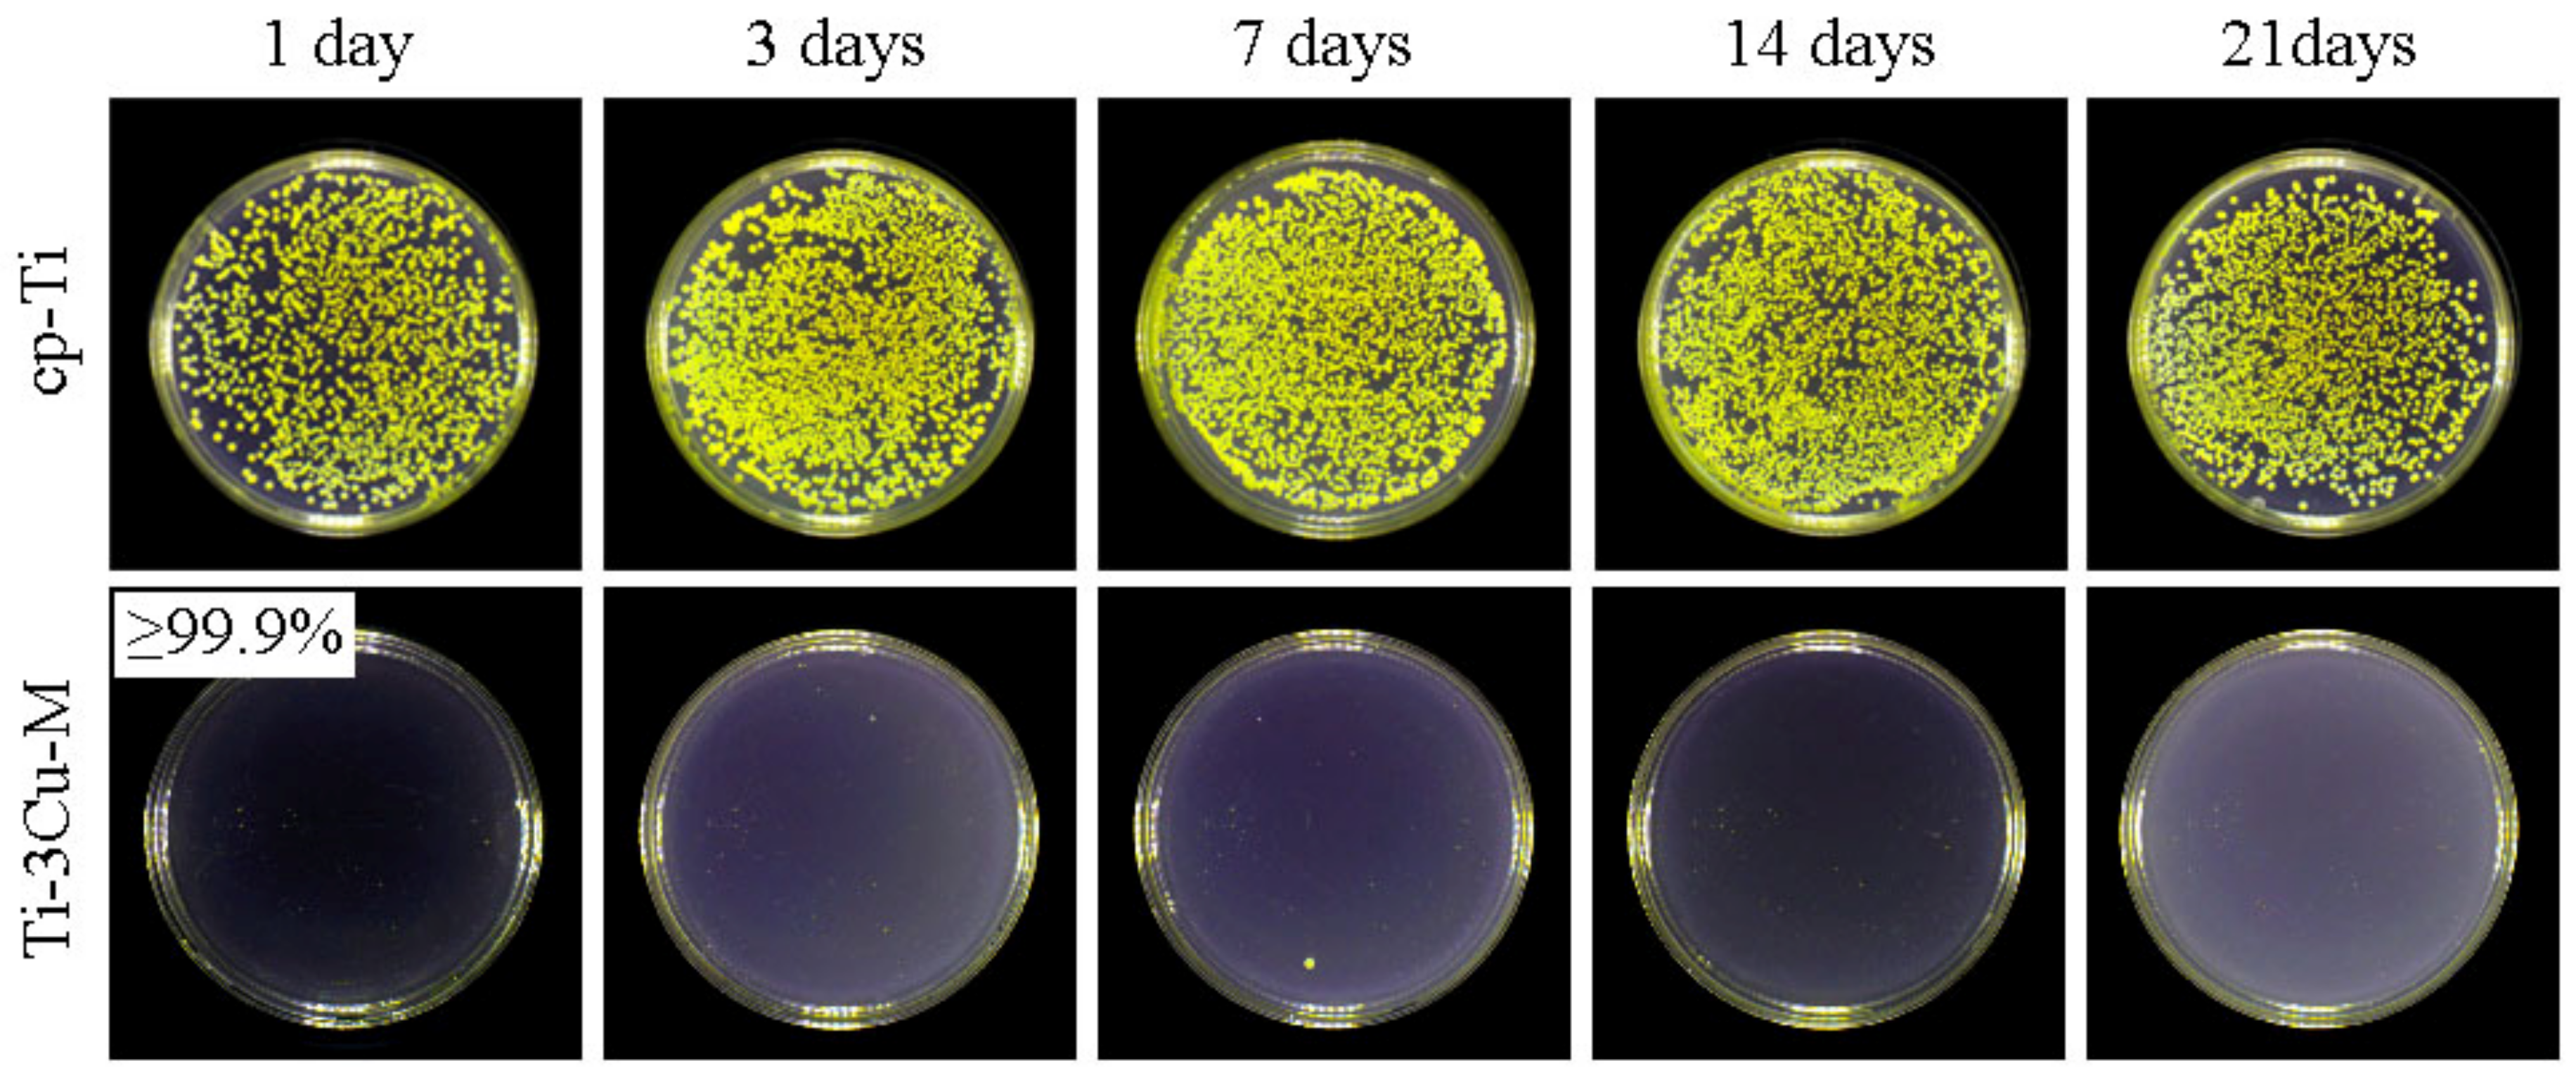
Figure 6 shows the S. aureus colonies on Ti-3Cu-M samples which have been immersed in 0.9%NaCl solution for different durations. There were almost no colonies on the surfaces of Ti-3Cu-M samples and the antibacterial rates were more than 99.0% even after 21 days immersion, demonstrating the strong long-term antibacterial property of the Ti-3Cu-M sample.
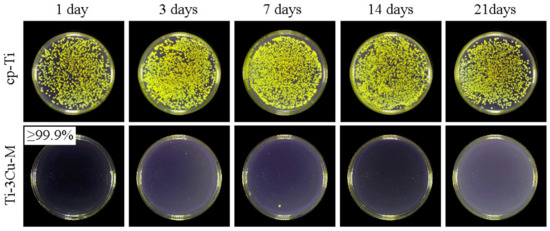
Figure 6.
Bacteria colonies on Ti-3Cu-M samples after long-term immersion.
3.4. Cell Biocompatibility
Figure 7a shows the OD values of MC3T3-E1 cells co-incubated on the samples for different duration. From Figure 7a, the OD values of all groups increased with the extension of culture time, indicating the good growth condition of MC3T3 cells on samples. On the first day, the OD value on Ti-3Cu-M was significantly higher than that on cp-Ti sample while there was no significant difference between cp-Ti and Ti-3Cu sample. On the third day, the OD value on Ti-3Cu-M was still higher than the values on the other two samples but there was no significant difference among different samples. A similar situation was also found on the seventh day. The calculated relative growth rates (RGR) of cells in Figure 7b also show that the cell viability on the Ti-3Cu and Ti-3Cu-M samples was higher than 100%. All these results demonstrate that both the Ti-3Cu and Ti-3Cu-M sample exhibited no cell toxicity (Grade 0 in comparison with cp-Ti) to MC3T3 cell line and the surface modification could promote the early proliferation of MC3T3 cells to some extent.
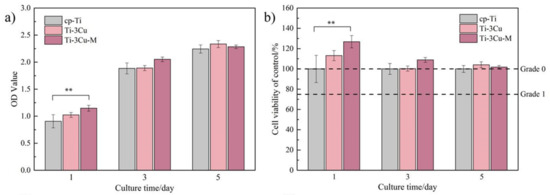
Figure 7.
Survival rates of MC3T3-E1 incubated on Ti-3Cu and Ti-3Cu-M samples for 1 day, 3 days and 5 days (** p < 0.05). (a) the OD value and (b) the survival rates of cells cultured for different time.
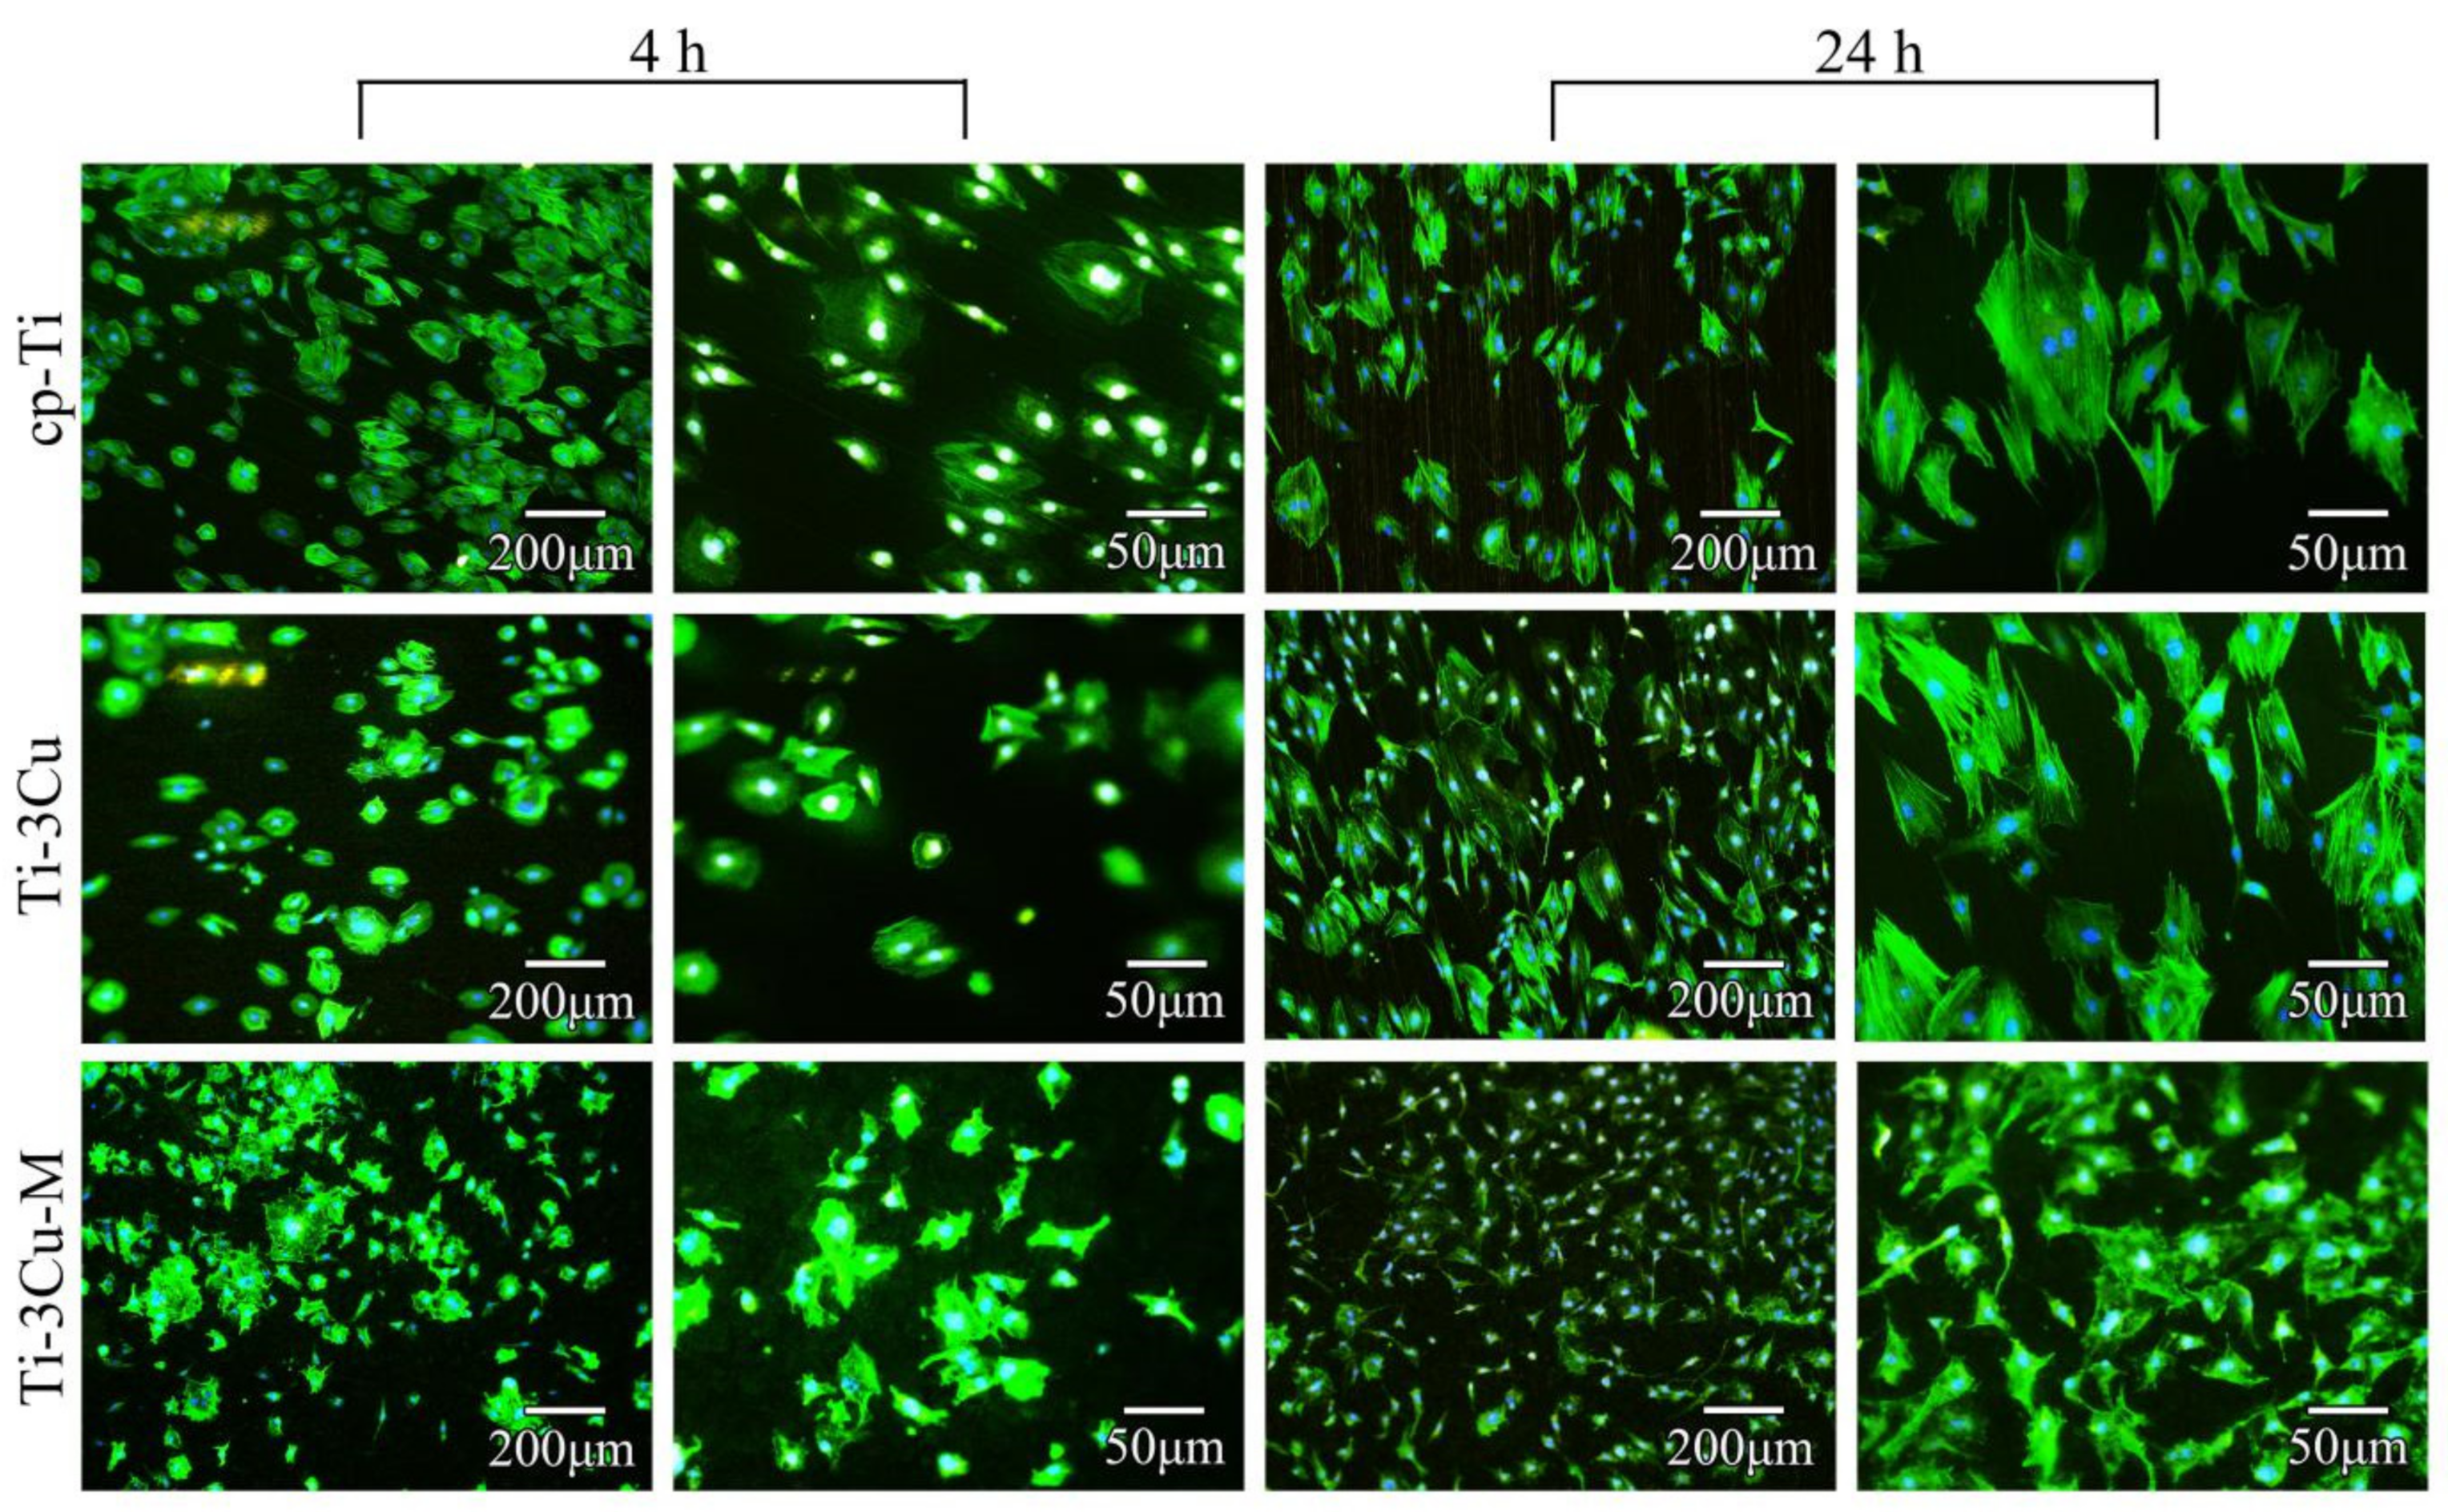
The cell staining morphology after 4 h and 24 h incubation on the surface of cp-Ti, Ti-3Cu and Ti-3Cu-M is shown in Figure 8. After 4 h incubation, there was no significant difference in the spreading cells number among all tested samples. At a high magnification, the cell morphology on cp-Ti and Ti-3Cu was polygonal in shape, while the cells on the surface of Ti-3Cu-M spread over larger area with the extension of filamentous pseudopods. After 24 h incubation, much more cells were observed on the surfaces of all samples. At a high magnification, the cell morphology on cp-Ti and Ti-3Cu was spindle in shape with uniform spreading area and clear actin fibers. On the surface of Ti-3Cu-M, the cells spread well with a large amount of filamentous pseudopods but without clear actin fibers. In general, Ti-3Cu-M samples were not considered to be cytotoxic from the point of cell cytoskeleton.
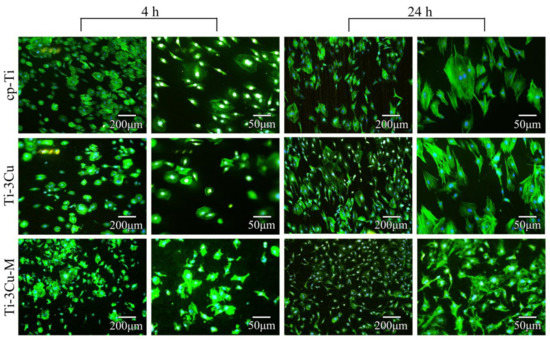
Figure 8.
Cytoskeleton staining of MC3T3 on cp-Ti, the i-3Cu sample and Ti-3Cu-M samples.
4. Discussion
4.1. Surface Morphology
XRD results indicated that Ti2Cu phase was formed in the Ti-3Cu matrix sample during the preparation, but no other phase was detected in Ti-3Cu-M. XPS results showed that TiO2 was also formed on the surface of Ti-3Cu-M but no copper oxide was detected after the surface modification. It can be seen from SEM surface morphology in Figure 1c and d that there were many white particles with a diameter of 0.2–0.5 μm on the rough surface of the Ti-3Cu-M sample after the treatment. Combined with the composition analysis, it can be determined that the white particles should be Ti2Cu phase. After the sandblasting treatment, the surface presented rough and flake-like structure, and the acid etching treatment produced the pores between the lamellar and a large number of Ti2Cu particles on the surface.
4.2. Hydrophilicity and Roughness
During the sandblasting process, the hard Al2O3 particles hit the surface fast. As a result, a rough surface with many flake-like structures and holes were clearly observed on the Ti-3Cu-M sample, as shown in Figure 1c. The mixture acid of HCl:H2SO4:H2O = 1:1:20 etched the titanium matrix and made many Ti2Cu particles appear on the surface, as shown in Figure 1d. The water contact angle and the roughness results in Figure 1b showed that the Ti-3Cu-M sample exhibited a rougher surface with lower water contact angle than the Ti-3Cu sample, displaying that the surface modification produced a rough and hydrophilic surface with many submicron Ti2Cu particles on the surface.
In vivo studies on SLA dental implants have shown that the rough surface could enhance the interface bonding strength between bone tissue and implant [8,22]. Lots of research has demonstrated that the high hydrophilicity would promote the proliferation and differentiation of osteoblasts near the implant, thus producing more chemical media and growth factors [9,23].
4.3. Corrosion Property
The corrosion resistance to body fluids of a candidate titanium alloy should be very good for the potential clinical application. According to the Tafel curve and related data, the self-corrosion current density of the Ti-3Cu-M sample was about an order of magnitude higher than that of the Ti-3Cu matrix. EIS data also indicated that the corrosion resistance of the Ti-3Cu-M sample was about one half lower than that of the Ti-3Cu matrix, which strongly suggested that the surface modification significantly reduced the corrosion resistance.
The surface morphology in Figure 1d clearly shows that a large amount of Ti2Cu particles presented on the surface after the treatment due to the etching function. Ti2Cu is the Cu-rich phase and has a different corrosion potential to the titanium matrix, and will form galvanic corrosion coupled with the titanium matrix, which accelerates the surface corrosion.
The surface morphology in Figure 1c also indicates that a rough surface was formed after the surface modification. Thus, the specific surface area of the Ti-3Cu-M sample greatly increased in comparison with Ti-Cu and the contact area during the electrochemical test also greatly increased, which would result in the increasing of the corrosion current density. If we calculate the real surface area of Ti-3Cu-M by using confocal laser microscopy, the developed area ratio of the sample can be obtained, as shown in Table 1, the re-calculated corrosion density would be 4.8 × 10⁻⁸A/cm2, which is at the same level to that of the Ti-3Cu matrix. This result confirmed that the increasing of the corrosion current density of Ti-3Cu-M was mainly caused by the increasing specific surface area.
The previous study [24] showed that the Cu ion dissolution concentration of Ti-3Cu alloy on the first, the third and the seventh days was 0.012 mg/L, 0.027 mg/L and 0.040 mg/L, respectively. Our experimental results showed that the Cu ion concentration of Ti-3Cu-M on the first, the third and the seventh days was 0.120 mg/L, 0.175 mg/L and 0.190 mg/L, displaying that the Cu ion dissolution concentration of Ti-3Cu-M was one order of magnitude higher than that of Ti-3Cu. Therefore, it can be concluded that the increase of relative surface area caused by the surface treatment reduced the corrosion resistance and accelerated the release of the Cu ion.
4.4. Antibacterial Properties
According to previous research, there are two main antibacterial mechanisms of Cu containing antibacterial titanium alloy [25,26]: the sterilization function of free Cu ions released from titanium alloy and the micro-area potential difference (MAPD) antibacterial mechanism. Luethen [27] proved that Cu ion effectively sterilized when the concentration was within (0.3–1.75) ppm. In this experiment, the release concentration of Cu ion from Ti-3Cu-M after 24 days immersion was lower than 0.10 ppm, which was lower than the crucial concentration of (0.3–1.75ppm). However, the antibacterial rate of Ti-3Cu-M was as high as 99.9%, indicating that Cu ion was not the main antibacterial factor.
According to the MAPD mechanism, the MAPD between the second phases and the matrix of titanium alloys accelerated the electrons transfer from titanium to bacteria when the bacteria contacted with material surfaces, which interfered with the electron transfer chain within bacteria, produced oxidative stress and strong oxidative ·OH, leading to the death of bacteria [21,28]. The surface morphology in Figure 1d has clearly shown that many submicron-scale Ti2Cu phases were exposed on the surface, which would form MAPD due to the difference in the electrode potential and contributed mainly to the strong antibacterial ability of the Ti-3Cu-M sample.
4.5. Cell Biocompatibility
Cell biocompatibility assess results have demonstrated that Ti-3Cu and Ti-3Cu-M samples had no cytotoxicity to the MC3T3 cell line, while the Ti-3Cu-M sample promoted the cell proliferation at the first 24 h, as shown in Figure 7a,b. Staining image also confirmed that some cells on the Ti-3Cu-M sample at 4 h began to have filament-like pseudofoot protrusions, showing good adhesion and spreading ability. The number and spreading area ontheTi-3Cu-M sample was larger than the value on the cp-Ti control group. However, the staining image at 24 h showed that there were more cells on the Ti-3Cu-M sample than cp-Ti and the Ti-3Cu sample, but the spread condition of individual cells, including the cell shape, the pseudopodia and the spread area was not significantly changed in comparison with cp-Ti and the Ti-3Cu sample.
Researchers [29] have suggested that microtopography can promote bone/implant bonding strength via mechanical interlocking, the behavior of osteoblasts can also be regulated. The nanotopography with various specific types had been demonstrated to favor osteogenic differentiation of mesenchymal stem cells and osteoblasts. Thus, it was expected the hybrid micro/nano-textured structure can combine the advantages from both the microtopography and nanotopography, which had been verified in some studies. For example, acid etching followed by anodization had been used to prepare a hierarchical hybrid structure on Ti substrate, and results revealed the synergistic role of the micro- and nanotopography on osteogenic activities [30]. The experimental results in Figure 8 showed that the cell volume on the surface of Ti-3Cu-M was larger at 4 h, indicating that the hybrid micro/nano-textured structure can promote cell differentiation in a short period of cell culture. When the time was extended to 24 h, Ti-3Cu-M had more cells on the surface, indicating no cytotoxicity.
Copper ion was a necessary trace element in the human body and a cofactor of several enzymes that can build bone and promote angiogenesis [31]. A previous study demonstrated that Cu2+/Cu+ could promote the differentiation and proliferation of osteoblasts. However, excessive amounts of copper can be very harmful to people’s health, causing stomach upset and diarrhea [31]. However, when the concentration of Cu ion exceeds a certain range, it will cause irreversible harm to cells and even lead to cell death [32]. Different cells had different tolerance to the Cu ion. For example, L929 fibroblasts will recover damage when Cu ion concentration reaches 46 μg/mL, but will be completely killed when Cu ion concentration reaches 100 μg/mL [33]. Furthermore, the median lethal dose for peripheral blood mononuclear cells was 18.4 mg/L [34]. When the Cu ion concentration was 0.021 mg/mL, less than 40% of URM106 cells survived. Concentrations of copper ions < 8.5 mg/L were considered safe for many cell lines [28]. In this experiment, the release concentration of Cu ions from Ti-3Cu-M after 24 days immersion was lower than 0.10 mg/L, which was lower than the crucial concentration of 8.5 mg/L. This shows that Cu ion produced by Ti-3Cu-M is harmless to the human body.
Zhou et al. changed the surface charge of PVDF-Ti (PTi) film through polarization, and induced cell adherence to material surface due to electrostatic interaction [35]. Although there was no consensus on the effect of positive and negative potential on cell adhesion and proliferation, it can be proved that both positive and negative surface potential or charge can promote cell adhesion and diffusion to a certain extent [36]. In this paper, the Ti-3Cu-M alloy had a significant effect on the proliferation of osteoblasts, but had a certain promotion effect on the initial adhesion and spread of osteoblasts. It was also thought that the MAPD, due to the presence of Ti2Cu second phase and the titanium matrix, contributed to enhanced cell attachment and diffusion.
The results showed that sandblasting acid etching could improve the hydrophilicity, roughness and antibacterial properties of Ti-3Cu, and promote cell proliferation and initial osteoblast adhesion. The corrosion resistance of the Ti-3Cu alloy decreased with the increase of relative surface area. Sandblasting acid etching treatment will affect other properties, such as hardness, tensile strength, elastic modulus, etc., but because the thickness of sandblasting acid etching is only two microns, it has little influence on other properties, but it still needs to be studied in subsequent experiments.
5. Conclusions
A rough surface with a lot of Ti2Cu particles was constructed on Ti-3Cu by a sandblasting and acid etching process. The presence of a large amount of Ti2Cu particles on the surface enhanced the antibacterial ability through the micro-area potential difference mechanism. The rough lamellar surface structure promoted cell proliferation and initial osteoblast adhesion due to the micro- and nano-topography as well as micro-area potential difference.
Author Contributions
Conceptualization, E.Z. and H.Y.; methodology, Y.X.; software, M.L.; validation, E.Z., L.W. and H.K.; formal analysis, S.C.; investigation, H.Y.; resources, Y.X.; data curation, M.L.; writing—original draft preparation, S.C.; writing—review and editing, E.Z.; visualization, H.Y.; supervision, L.W.; project administration, S.C.; funding acquisition, E.Z. All authors have read and agreed to the published version of the manuscript.
Funding
This research was funded by Joint plan of key R & D projects in Liaoning Province, grant number 2020JH2/10300157 and Shenyang Science and technology plan, grant number 20-205-4-023.
Conflicts of Interest
The authors declare no conflict of interest.
References
- Zhang, E.; Zhao, X.; Hu, J.; Wang, R.; Fu, S.; Qin, G. Antibacterial metals and alloys for potential biomedical implants. Bioact. Mater. 2021, 6, 2569–2612. [Google Scholar] [CrossRef] [PubMed]
- Fu, S.; Zhang, Y.; Qin, G.; Zhang, E. Antibacterial effect of TiAg alloy motivated by Ag-containing phases. Mater. Sci. Eng. C 2021, 128, 112266. [Google Scholar] [CrossRef] [PubMed]
- Romero-Resendiz, L.; Rossi, M.C.; Álvarez, A.; García-García, A.; Milián, L.; Tormo-Más, M.Á.; Amigó-Borrás, V. Microstructural, mechanical, electrochemical, and biological studies of an electron beam melted Ti-6Al-4V alloy. Mater. Today Commun. 2022, 31, 103337. [Google Scholar] [CrossRef]
- Fu, S.; Zhao, X.; Yang, L.; Qin, G.; Zhang, E. A novel Ti-Au alloy with strong antibacterial properties and excellent biocompatibility for biomedical application. Mater. Sci. Eng. C 2022, 112653. [Google Scholar] [CrossRef] [PubMed]
- Yang, H.-L.; Zhu, M.-Z.; Wang, J.-Y.; Ma, C.-X.; Zhou, X.-W.; Xing, H.-X.; Zhang, E.-L.; Ji, S.-X. Optimization of mechanical and antibacterial properties of Ti-3wt% Cu alloy through cold rolling and annealing. Rare Met. 2021, 41, 610–620. [Google Scholar] [CrossRef]
- Cao, S.; Zhang, Z.-M.; Zhang, J.-Q.; Wang, R.-X.; Wang, X.-Y.; Yang, L.; Chen, D.-F.; Qin, G.-W.; Zhang, E.-L. Improvement in antibacterial ability and cell cytotoxicity of Ti–Cu alloy by anodic oxidation. Rare Met. 2021, 41, 594–609. [Google Scholar] [CrossRef]
- Xie, F.; Huang, J.; Yang, H.; He, X. Ti-10Mo/Hydroxyapatite composites for orthopedic applications: Microstructure, mechanical properties and biological activity. Mater. Today Commun. 2021, 29, 102887. [Google Scholar] [CrossRef]
- Zhang, M.; Zhou, B.; Gao, J.; Hei, H.; Ma, Y.; Huang, X.; Liu, Z.; Xue, Y.; Yu, S.; Wu, Y. A scalelike micro/nano-textured structure on Ti-based implants with enhanced cytocompatibility and osteogenic activities. Surf. Coat. Technol. 2021, 422, 127497. [Google Scholar] [CrossRef]
- Fabris, D.; Lasagni, A.F.; Fredel, M.C.; Henriques, B. Direct Laser Interference Patterning of Bioceramics: A Short Review. Ceramics 2019, 2, 578–586. [Google Scholar] [CrossRef] [Green Version]
- Buser, D.; Broggini, N.; Wieland, M.; Schenk, R.K.; Denzer, A.J.; Cochran, D.L.; Hoffmann, B.; Lussi, A.; Steinemann, S.G.J.J.o.D.R. Enhanced Bone Apposition to a Chemically Modified SLA Titanium Surface. J. Dent. Res. 2004, 83, 529–533. [Google Scholar] [CrossRef]
- Nedir, R.; Bischof, M.; Szmukler-Moncler, S.; Bernard, J.P.; Samson, J. Predicting osseointegration by means of implant primary stability. Clin. Oral Implant. Res. 2004, 15, 520–528. [Google Scholar] [CrossRef] [PubMed]
- Yin, L.; Chang, Y.; You, Y.; Liu, C.; Li, J.; Lai, H.C. Biological responses of human bone mesenchymal stem cells to Ti and TiZr implant materials. Clin. Implant. Dent. Relat. Res. 2019, 21, 550–564. [Google Scholar] [CrossRef] [PubMed]
- De Tullio, I.; Berardini, M.; di Iorio, D.; Perfetti, F.; Perfetti, G. Comparative evaluation among laser-treated, machined, and sandblasted/acid-etched implant surfaces: An in vivo histologic analysis on sheep. Int. J. Implant. Dent. 2020, 6, 7. [Google Scholar] [CrossRef] [PubMed] [Green Version]
- Shirai, T.; Watanabe, K.; Matsubara, H.; Nomura, I.; Fujiwara, H.; Arai, Y.; Ikoma, K.; Terauchi, R.; Kubo, T.; Tsuchiya, H. Prevention of pin tract infection with iodine-supported titanium pins. J. Orthop. Sci. 2014, 19, 598–602. [Google Scholar] [CrossRef] [Green Version]
- Liu, J.; Li, F.; Liu, C.; Wang, H.; Ren, B.; Yang, K.; Zhang, E. Effect of Cu content on the antibacterial activity of titanium–copper sintered alloys. Mater. Sci. Eng. C 2014, 35, 392–400. [Google Scholar] [CrossRef]
- Ma, Z.; Ren, L.; Liu, R.; Yang, K.; Zhang, Y.; Liao, Z.; Liu, W.; Qi, M.; Misra, R.D.K. Effect of Heat Treatment on Cu Distribution, Antibacterial Performance and Cytotoxicity of Ti–6Al–4V–5Cu Alloy. J. Mater. Sci. Technol. 2015, 31, 723–732. [Google Scholar] [CrossRef]
- Ren, L.; Ma, Z.; Li, M.; Zhang, Y.; Liu, W.; Liao, Z.; Yang, K. Antibacterial Properties of Ti–6Al–4V–xCu Alloys. J. Mater. Sci. Technol. 2014, 30, 699–705. [Google Scholar] [CrossRef]
- Yuan, Y.; Luo, R.; Ren, J.; Zhang, L.; Jiang, Y.; He, Z. Design of a new Ti-Mo-Cu alloy with excellent mechanical and antibacterial properties as implant materials. Mater. Lett. 2022, 306, 130875. [Google Scholar] [CrossRef]
- Zhang, E.; Li, F.; Wang, H.; Liu, J.; Wang, C.; Li, M.; Yang, K. A new antibacterial titanium–copper sintered alloy: Preparation and antibacterial property. Mater. Sci. Eng. C 2013, 33, 4280–4287. [Google Scholar] [CrossRef]
- Shi, A.; Zhu, C.; Fu, S.; Wang, R.; Qin, G.; Chen, D.; Zhang, E. What controls the antibacterial activity of Ti-Ag alloy, Ag ion or Ti2Ag particles? Mater. Sci. Eng. C 2020, 109, 110548. [Google Scholar] [CrossRef]
- Lu, M.; Zhang, Z.; Zhang, J.; Wang, X.; Qin, G.; Zhang, E. Enhanced antibacterial activity of Ti-Cu alloy by selective acid etching. Surf. Coat. Technol. 2021, 421, 127478. [Google Scholar] [CrossRef]
- Wang, Z.; Mei, L.; Liu, X.; Zhou, Q. Hierarchically hybrid biocoatings on Ti implants for enhanced antibacterial activity and osteogenesis. Colloids Surf. B Biointerfaces 2021, 204, 111802. [Google Scholar] [CrossRef] [PubMed]
- Zhao, L.; Mei, S.; Chu, P.K.; Zhang, Y.; Wu, Z. The influence of hierarchical hybrid micro/nano-textured titanium surface with titania nanotubes on osteoblast functions. Biomaterials 2010, 31, 5072–5082. [Google Scholar] [CrossRef] [PubMed]
- Zhang, Z.; Zheng, G.; Li, H.; Yang, L.; Wang, X.; Qin, G.; Zhang, E. Anti-bacterium influenced corrosion effect of antibacterial Ti-3Cu alloy in Staphylococcus aureus suspension for biomedical application. Mater. Sci. Eng. C 2019, 94, 376–384. [Google Scholar] [CrossRef] [PubMed]
- Burghardt, I.; Lüthen, F.; Prinz, C.; Kreikemeyer, B.; Zietz, C.; Neumann, H.-G.; Rychly, J. A dual function of copper in designing regenerative implants. Biomaterials 2015, 44, 36–44. [Google Scholar] [CrossRef]
- Yang, J.; Qin, H.; Chai, Y.; Zhang, P.; Chen, Y.; Yang, K.; Qin, M.; Zhang, Y.; Xia, H.; Ren, L.; et al. Molecular mechanisms of osteogenesis and antibacterial activity of Cu-bearing Ti alloy in a bone defect model with infection in vivo. J. Orthop. Transl. 2021, 27, 77–89. [Google Scholar] [CrossRef]
- Mändl, S.; Rauschenbach, B. Improving the biocompatibility of medical implants with plasma immersion ion implantation. Surf. Coat. Technol. 2002, 156, 276–283. [Google Scholar] [CrossRef]
- Zhang, Y.; Cui, S.; Cao, S.; Yang, L.; Qin, G.; Zhang, E. To improve the angiogenesis of endothelial cells on Ti-Cu alloy by the synergistic effects of Cu ions release and surface nanostructure. Surf. Coat. Technol. 2022, 433, 128116. [Google Scholar] [CrossRef]
- Hasegawa, M.; Saruta, J.; Hirota, M.; Taniyama, T.; Sugita, Y.; Kubo, K.; Ishijima, M.; Ikeda, T.; Maeda, H.; Ogawa, T. A Newly Created Meso-, Micro-, and Nano-Scale Rough Titanium Surface Promotes Bone-Implant Integration. Int. J. Mol. Sci. 2020, 21, 783. [Google Scholar] [CrossRef] [Green Version]
- Huang, Q.; Elkhooly, T.A.; Liu, X.; Zhang, R.; Yang, X.; Shen, Z.; Feng, Q. Effects of hierarchical micro/nano-topographies on the morphology, proliferation and differentiation of osteoblast-like cells. Colloids Surf. B Biointerfaces 2016, 145, 37–45. [Google Scholar] [CrossRef]
- Zhang, E.; Zheng, L.; Liu, J.; Bai, B.; Liu, C. Influence of Cu content on the cell biocompatibility of Ti–Cu sintered alloys. Mater. Sci. Eng. C 2015, 46, 148–157. [Google Scholar] [CrossRef] [PubMed]
- Shi, A.; Cai, D.; Hu, J.; Zhao, X.; Qin, G.; Han, Y.; Zhang, E. Development of a low elastic modulus and antibacterial Ti-13Nb-13Zr-5Cu titanium alloy by microstructure controlling. Mater. Sci. Eng. C 2021, 126, 112116. [Google Scholar] [CrossRef] [PubMed]
- Cao, B.; Zheng, Y.; Xi, T.; Zhang, C.; Song, W.; Burugapalli, K.; Yang, H.; Ma, Y. Concentration-dependent cytotoxicity of copper ions on mouse fibroblasts in vitro: Effects of copper ion release from TCu380A vs TCu220C intra-uterine devices. Biomed. Microdevices 2012, 14, 709–720. [Google Scholar] [CrossRef]
- Singh, R.P.; Kumar, S.; Nada, R.; Prasad, R. Evaluation of copper toxicity in isolated human peripheral blood mononuclear cells and it’s attenuation by zinc: Ex vivo. Mol. Cell. Biochem. 2006, 282, 13. [Google Scholar] [CrossRef]
- Zhou, Z.; Li, W.; He, T.; Qian, L.; Tan, G.; Ning, C. Polarization of an electroactive functional film on titanium for inducing osteogenic differentiation. Sci. Rep. 2016, 6, 35512. [Google Scholar] [CrossRef] [PubMed]
- Wang, G.; Feng, H.; Jin, W.; Gao, A.; Peng, X.; Li, W.; Wu, H.; Li, Z.; Chu, P.K. Long-term antibacterial characteristics and cytocompatibility of titania nanotubes loaded with Au nanoparticles without photocatalytic effects. Appl. Surf. Sci. 2017, 414, 230–237. [Google Scholar] [CrossRef]


Publisher’s Note: MDPI stays neutral with regard to jurisdictional claims in published maps and institutional affiliations. |
© 2022 by the authors. Licensee MDPI, Basel, Switzerland. This article is an open access article distributed under the terms and conditions of the Creative Commons Attribution (CC BY) license (https://creativecommons.org/licenses/by/4.0/).