Article

Effect of Annealing Process on Microstructure and Magnetic Properties of FeSiBPCNbCu Nanocrystalline Soft Magnetic Powder Cores

1
Jiangxi Key Laboratory for Rare Earth Magnetic Materials and Devices & Institute for Rare Earth Magnetic Materials and Devices (IREMMD), Jiangxi University of Science and Technology, Ganzhou 341000, China
2
Zhejiang Province Key Laboratory of Magnetic Materials and Application Technology, CAS Key Laboratory of Magnetic Materials and Devices, Ningbo Institute of Materials Technology & Engineering, Chinese Academy of Sciences, Ningbo 315201, China
3
Faculty of Materials Metallurgy and Chemistry, Jiangxi University of Science and Technology, Ganzhou 341000, China
4
University of Chinese Academy of Sciences, Beijing 100049, China
*
Authors to whom correspondence should be addressed.
Metals 2022, 12(5), 845; https://doi.org/10.3390/met12050845
Submission received: 22 April 2022 / Revised: 10 May 2022 / Accepted: 14 May 2022 / Published: 16 May 2022

Abstract

:
In this work, the effect of the annealing process (heating rate (HR) and holding time (HT)) on microstructure and magnetic properties of FeSiBPCNbCu nanocrystalline soft magnetic powder cores (NPCs) are systematically studied. NPCs annealed under the HR of 100 K/min and HT of 30 min exhibit a finely uniform nanocrystalline structure with a concentrated grain size distribution and a small average grain size of 18.71 nm and show a modified magnetic domain structure where the domain walls move easily with the changes in the external magnetic field. The optimized microstructure leads to outstanding soft magnetic properties, including the low coercivity of 10.5 A/m (50 mT, 500 kHz), low core loss of 751 mW/cm3 (50 mT, 500 kHz), and highly effective permeability of 64.7 (100 kHz). We believe that the annealing process regulation can contribute to the industrial production of high-performance NPCs, which can meet the performance requirements of high-end electronic components such as molding chokes used in power supplies, mobile phones, and other terminal equipment.

1. Introduction

As a new type of soft magnetic material, nanocrystalline soft magnetic alloys have been widely used in the field of power electronics due to their excellent magnetic properties, since they were first reported in 1988 by Yoshizawa, Y. et al. [1,2,3,4], and nanocrystalline soft magnetic powder cores (NPCs) produced by pressing coated nanocrystalline powder have been carried out [5,6,7,8]. Compared with traditional iron, iron silicon, sendust, and iron-nickel soft magnetic powder cores (SMPCs), NPCs show better soft magnetic properties, including lower coercivity (Hc) and lower core loss (Pcv) at a high frequency due to their unique structure where nano-sized α-Fe(Si) grains are densely distributed in the residual amorphous phase, which can better meet the development trend of high frequency, miniaturization, and high energy efficiency of electronic components [9,10].
The microstructure of the NPCs is an essential factor that affects their soft magnetic properties [11]. The grain size (D) of nano-sized α-Fe(Si) grains is generally smaller than the exchange length (Lex), and its relationship with Hc (HcD6) has been fully described and illustrated according to the random anisotropy model (RAM) [4,12]. To obtain NPCs with a uniform and fine nanocrystalline structure, the heating rate (HR) and holding time (HT) during the annealing process can be adjusted to control the nucleation and growth process of nano-sized α-Fe(Si) grains. Li, Z. et al. [13] investigated the effect of ultra-rapid annealing (URA) on the microstructure and soft magnetic properties of (Fe1-x-yCoxNiy)86B14 alloys, and nanocrystalline (Fe0.8Co0.05Ni0.15)86B14 with outstanding performances with low Hc of 2 A/m was prepared by URA successfully. Jiang, L. et al. [14] adjusted the annealing process of Fe81.5Si0.5B4.5P11Cu0.5C2 alloy and found that a low HR of 10 K/min is beneficial for the alloy to achieve a fine structure where the mean grain size is 17 nm, and the Hc is about 4.8 A/m. In addition, with the extension of HT, the mean size of α-Fe(Si) grains gradually becomes larger. Meng, Y. et al. [15] found that the appropriate rapid annealing with higher temperatures and shorter HT is beneficial to the higher crystallinity and the formation of the fine α-Fe(Si) grains in Fe83Si4B10P2Cu1 ribbons and leads to good magnetic properties, including high saturation magnetization (Ms) of 1.82 T and low Hc of 6.2 A/m.
In our previous study, high-performance FeSiBPCNbCu NPCs were prepared by a traditional annealing process, while the microstructure is not ideal. The low crystallization volume fraction and large grain size have a negative impact on the magnetic properties, and there is still much room for optimization. In this work, we further investigated the effects of HR and HT on the microstructure and soft magnetic properties of FeSiBPCNbCu NPCs and summarized the evolution of the crystalline structure during the annealing process. It is found that a uniform nanocrystalline structure with fine α-Fe(Si) grains of 18.71 nm can be obtained when the HR and HT were 100 K/min and 30 min, respectively. Due to the optimized structure, the NPCs show excellent soft magnetic properties, including low Hc of 10.5 A/m (50 mT, 500 kHz), high effective permeability (μe) of 64.7 (100 kHz), and low Pcv of 751 mW/cm3 (50 mT, 500 kHz). We believe that this work can contribute to the industrial production of high-performance NPCs, which can meet the performance requirements of high-end electronic components.

2. Materials and Methods

Alloy ingots with the composition of Fe74.75Si8B10P3C2Nb1.5Cu0.75 were prepared by induction melting a mixture of industrial materials including Fe (99.6 wt. %), Si (99.9999 wt. %), Nb (99.9 wt. %), Cu (99.99 wt. %), C (99.99 wt. %), pre-alloyed FeB (99.4 wt. %), and FeP (99.4 wt. %). Amorphous precursor powder was then fabricated by gas-atomizing the remelted alloy ingots with industrial raw materials at a dynamic pressure of 8 MPa. The commercial W-6C epoxy resin (2 wt. %) was chosen as the binder and evenly mixed with the gas-atomized powder. Powder cores with an outer diameter of 20.3 mm and an inner diameter of 12.7 mm were produced by pressing the mixed powder under the pressure of 1800 Mpa. The final annealing processes were carried out by controlling HR and HT using a rapid heating tube furnace (BTF-1200C-RTP-S90B) to achieve NPCs; the annealing temperature is 783 K, while the HR and HT range from 5–500 K/min and 0–90 min, respectively.
The thermal stability of the gas-atomized powder was measured by a differential scanning calorimetry (DSC, 404C, Netzsch, Selb, Germany with a heating rate of 40 K/min. The hysteresis loop of the gas-atomized powder was measured by a vibrating sample magnetometer (VSM, Lakeshore 7410, Columbus, OH, USA) with an applied field up to 800 kA/m. The microscopic morphology of the gas-atomized powder and NPCs were observed by a scanning electron microscope (SEM, ZEISS EVO 18, ZEISS, Oberkohen, Germany) with an X-ray energy spectrometer (EDS). The structure of the gas-atomized powder and NPCs were identified by an X-ray diffractometer (XRD, D8 DISCOVER, Bruker, Karlsruhe, Germany) with Cu-Kα radiation and a transmission electron microscopy (TEM, JEM2100, JOEL, Tokyo, Japan). Specimens of NPCs for TEM were processed by a focused ion beam/scanning electron microscope (FIB/SEM, Carl Zeiss Auriga, ZEISS, Oberkohen, Germany). The dynamic magnetic domains of the NPCs were observed by a Lorentz transmission electron microscope (JEM-2100F, JOEL, Tokyo, Japan). The μe of NPCs were measured by an impedance analyzer (Agilent 4294A, Palo Alto, CA, USA) from 1 kHz to 10 MHz. The Pcv and Hc of NPCs were measured by an alternating current (AC) B-H loop analyzer (SY-8218, IWATSU, Tokyo, Japan).

3. Results and Discussion

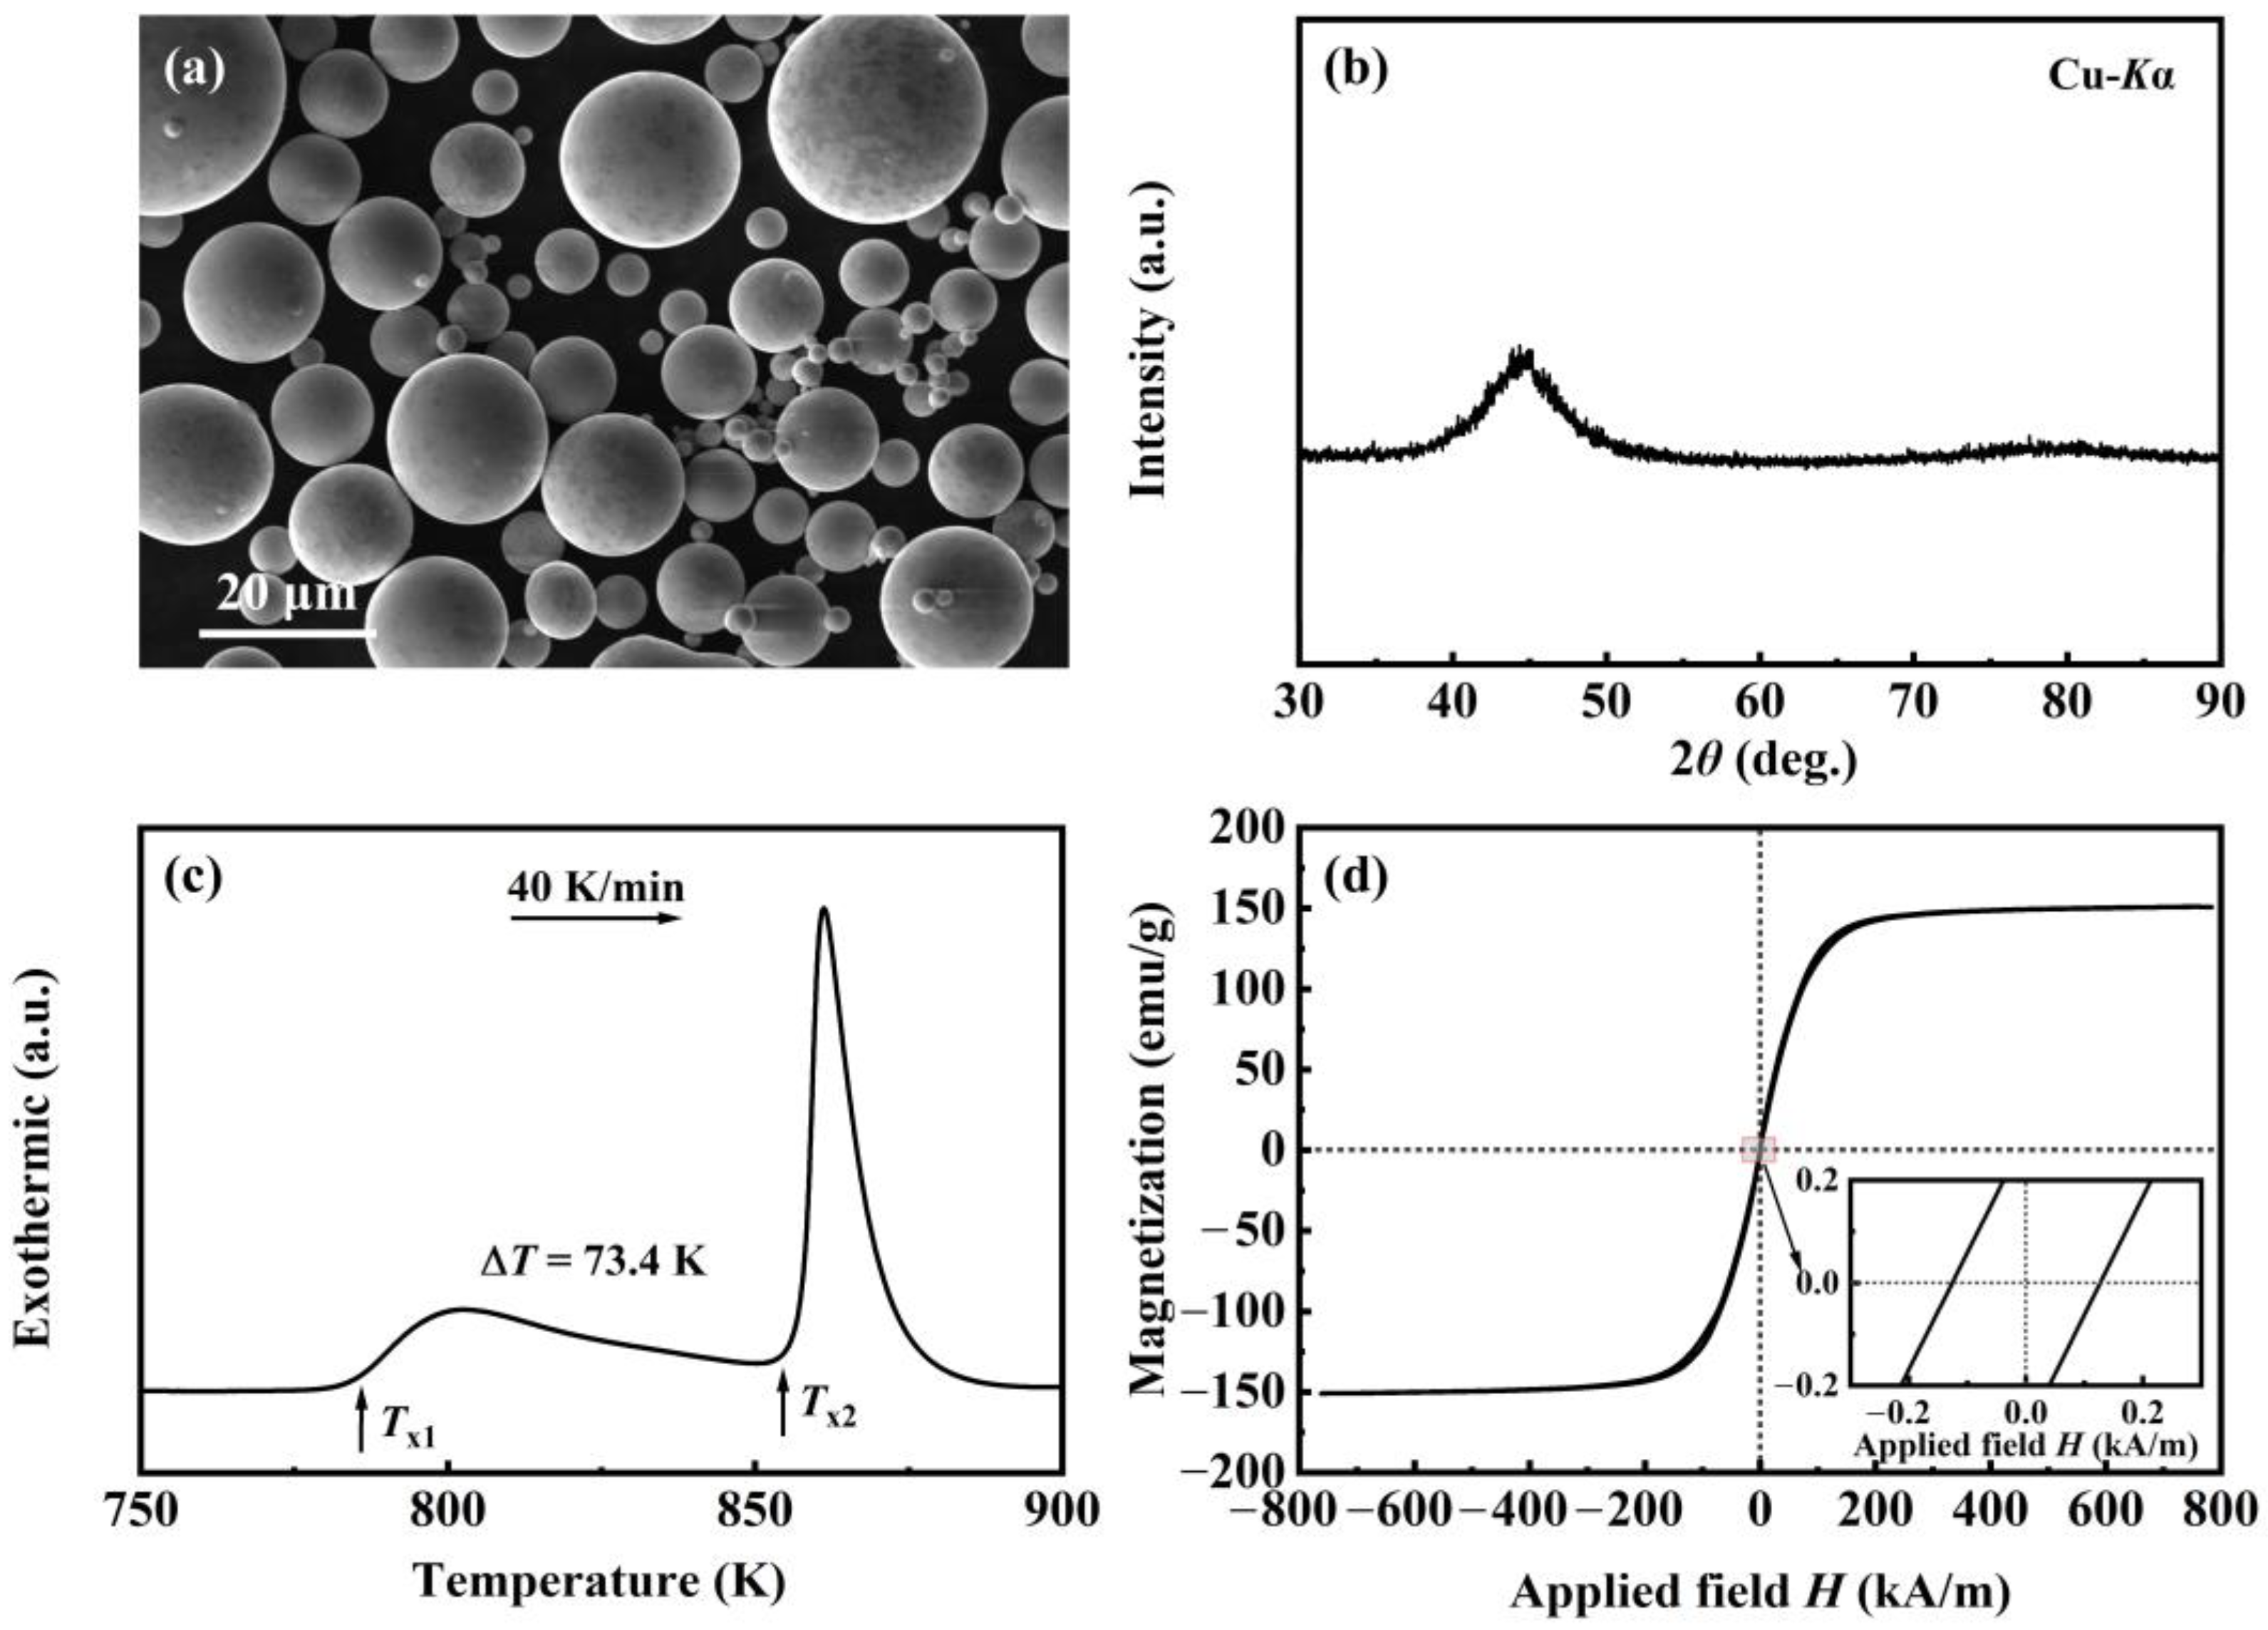
3.1. Characterization of Fe74.75Si8B10P3C2Nb1.5Cu0.75 Powder and NPCs Coating Behavior

The SEM image of gas-atomized Fe74.75Si8B10P3C2Nb1.5Cu0.75 powder with no heat treatment is shown in Figure 1a. The powder fabricated by gas atomization shows excellent surface morphology, including smooth surface, high sphericity, and uniform shape, which is conducive to uniform coating and the minimization of Pcv [16,17,18].
The XRD pattern of gas-atomized Fe74.75Si8B10P3C2Nb1.5Cu0.75 powder is shown in Figure 1b, only a broad peak at around 2θ = 45° can be observed in the pattern, indicating that the gas-atomized powder has a fully amorphous structure. Figure 1c shows the DSC curve of the powder. There are two endothermic peaks with the starting temperatures accruing at 784 K and 857.4 K, which are defined as the first crystallization temperature (Tx1) of the α-Fe(Si) phase and the second crystallization temperature (Tx2) of the non-soft magnetic Fe-B phases, respectively [19]. The ΔTT = Tx2Tx1) of the amorphous powder is considered a parameter of the thermal stability of the remaining amorphous state above Tx1, and the value is 73.4 K. The hysteresis loop of the powder is shown in Figure 1d. The powder shows a high saturation magnetization (Ms) of 150.9 emu/g, 13.6% higher than that of the commercial 1K107 powder (~133 emu/g) [3], which is beneficial for the miniaturization of electronic devices. In addition, the powder exhibits a low Hc of 0.1265 kA/m, which is propitious to the loss reduction of devices during operation and can improve the utilization rate of energy.
Figure 2a shows the cross-section morphology of a selected powder inside the Fe74.75Si8B10P3C2Nb1.5Cu0.75 NPCs when the HR and HT were 100 K/min and 30 min, respectively. The dividing line between the powder and epoxy resin can be observed clearly, confirming that the powder can still be uniformly coated by the epoxy resin after the annealing process, which can significantly increase the resistivity of NPCs and reduce the eddy current loss (Pe). Figure 2b shows the enlarged image of the selected area from Figure 2a, and a path in the enlarged image was selected to perform a line scan of the element distribution. The corresponding main elements distribution lines are shown in Figure 2c. It can be seen that the elements are evenly distributed inside the powder, when the scanning position reaches the boundary between the powder and epoxy resin, the signal intensities of Fe and Si drop sharply, while the signal intensities of C and O rise accordingly, which are the constituent elements of epoxy resin, proving that epoxy resin has an effective isolation effect on the magnetic powders.

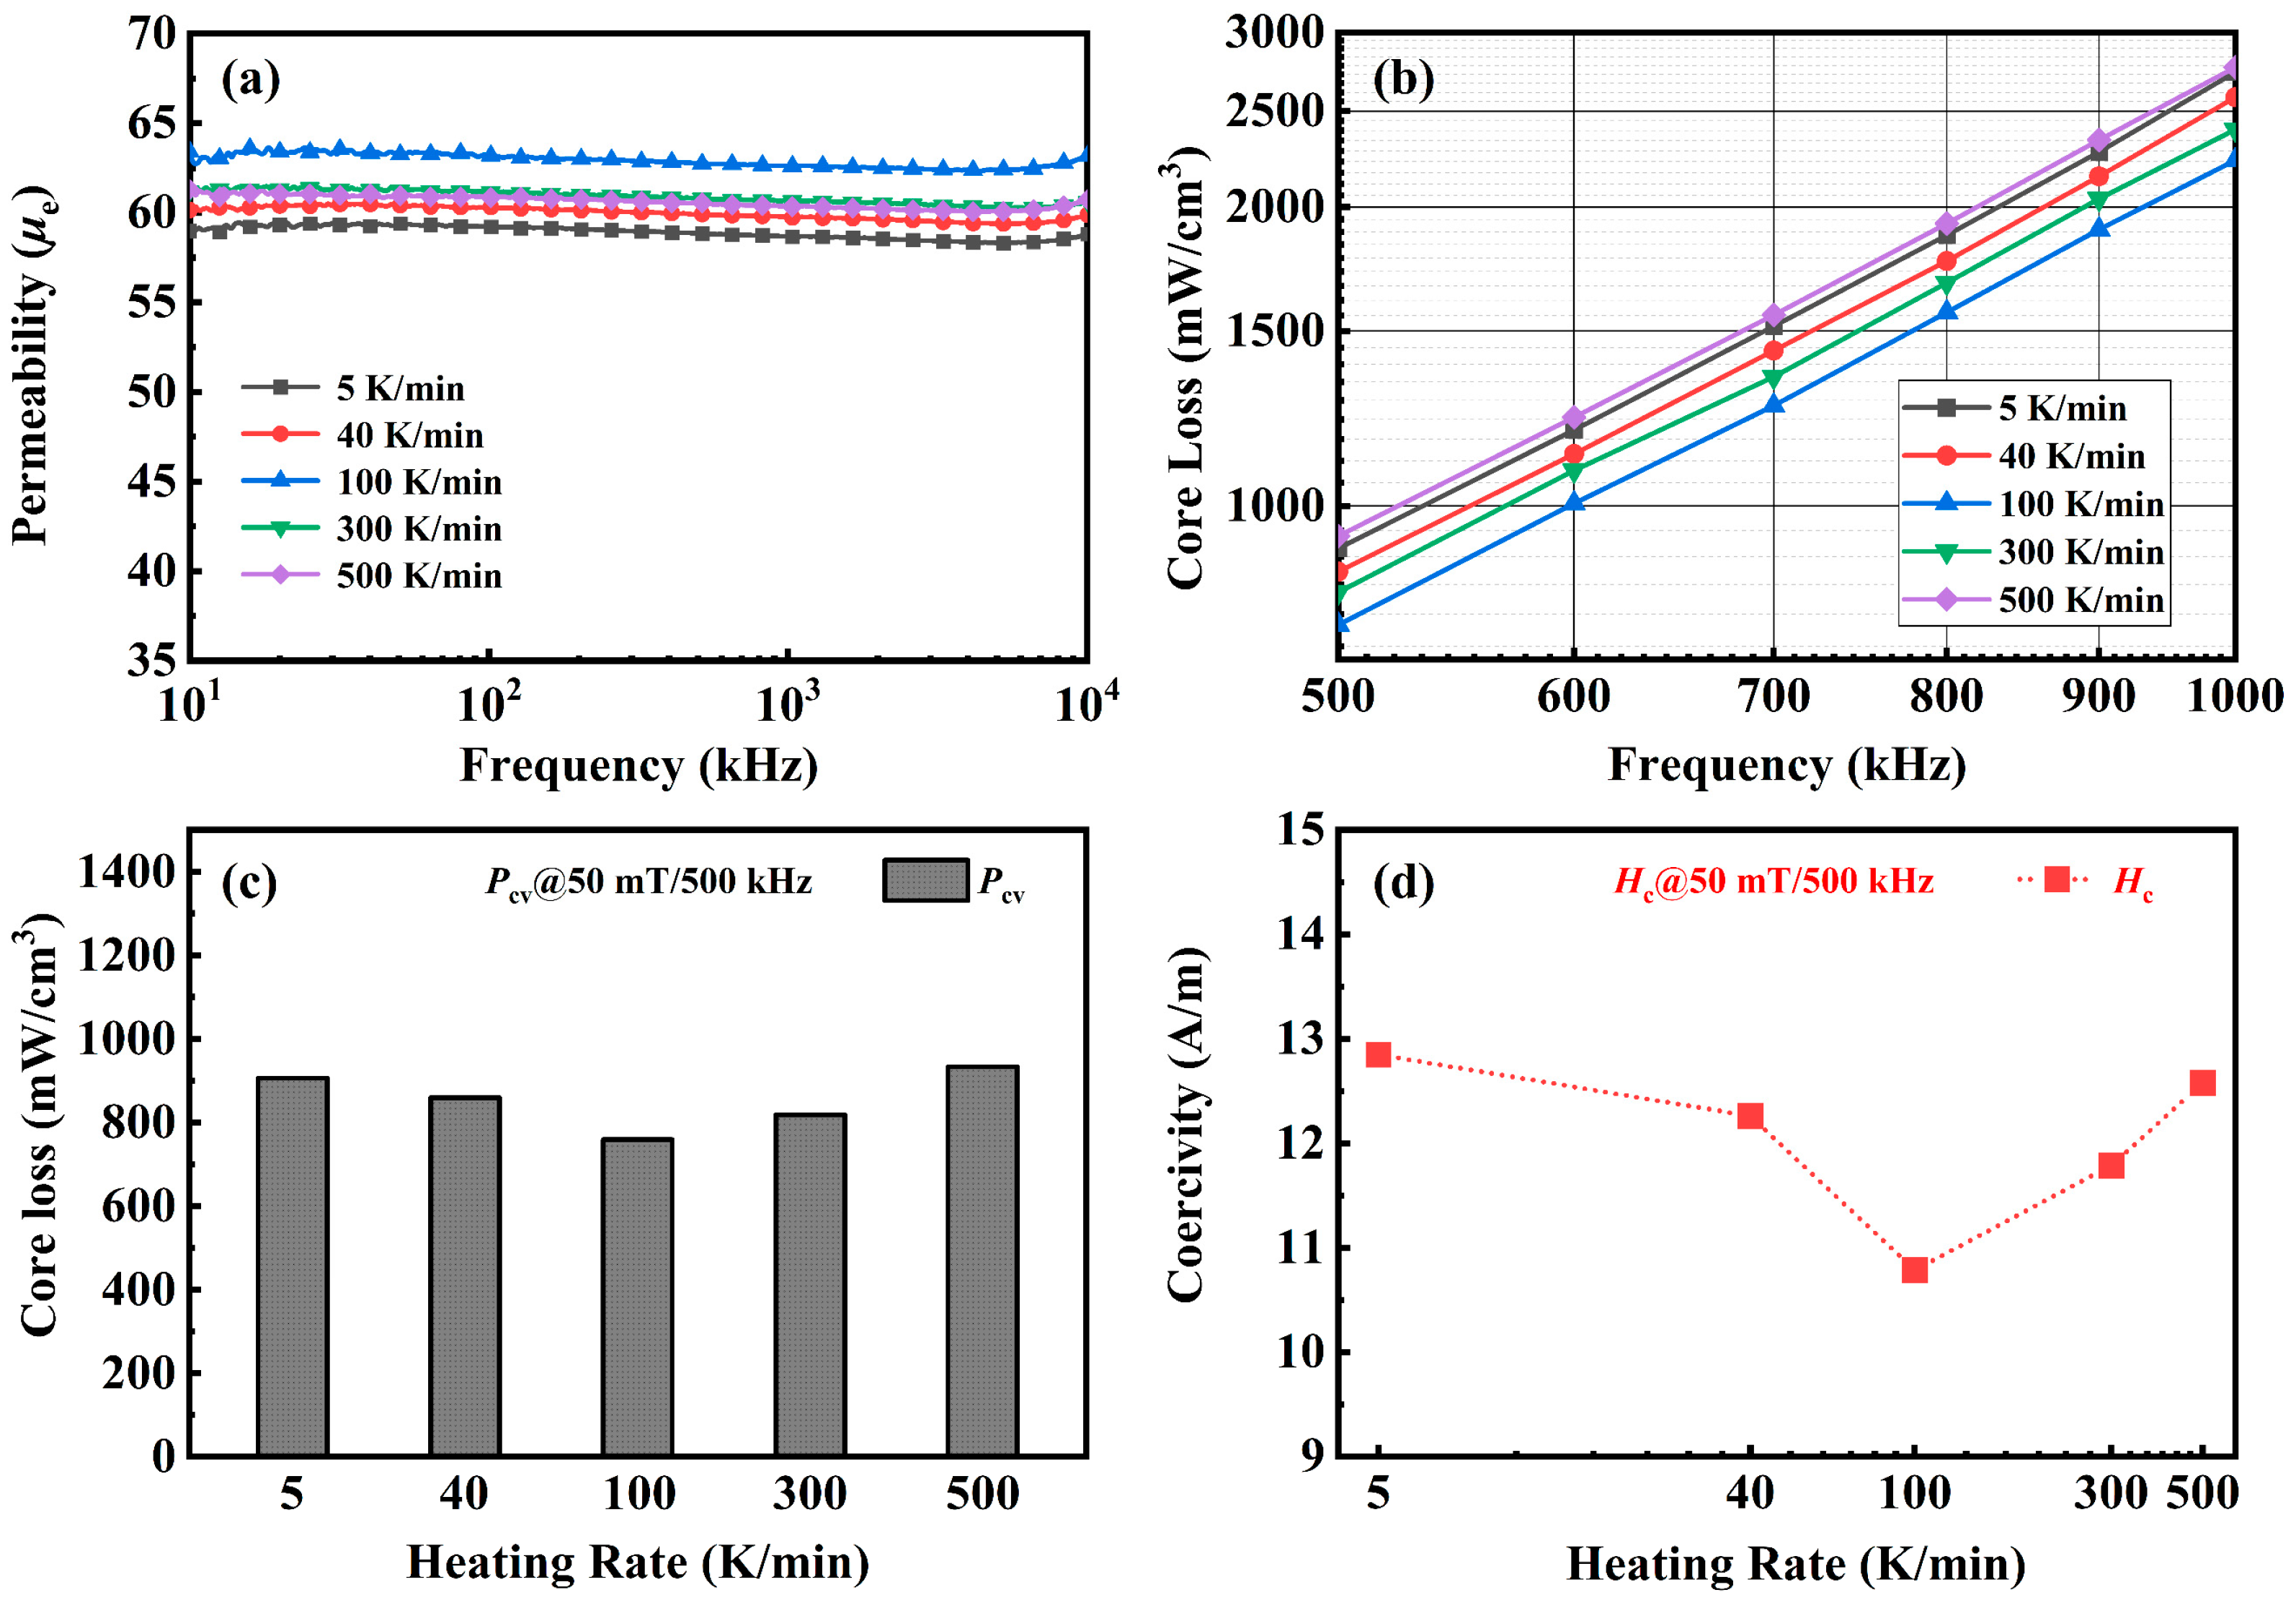
3.2. Magnetic Properties and Microstructures of Fe74.75Si8B10P3C2Nb1.5Cu0.75 NPCs Annealed at Different HR

Annealing processes with different HR (5, 40, 100, 300, and 500 K/min) and the same HT of 60 min were applied for the fabrication of Fe74.75Si8B10P3C2Nb1.5Cu0.75 NPCs. Figure 3a shows the μe of the NPCs annealed at different HR. The μe all show good high-frequency stability, the values are basically unchanged even under the high frequency of 10 MHz, which is beneficial for the stable operation of the devices at a high frequency. The NPCs annealed at the HR of 5 K/min show a low μe of 59.2 (100 kHz); as the HR gradually rises to 100 K/min, the μe gradually increases to the maximum value, which is 63.2. When the HR continues to rise, the μe shows a downward trend. As the HR further rises to 500 K/min, the μe gradually decreases from the maximum value of 63.2 to 60.9.
The dependence of Pcv on frequency is shown in Figure 3b, and the applied field is 50 mT. The Pcv rises with the increase in frequency for all NPCs, and the NPCs annealed at the HR of 100 K/min show the lowest Pcv at all frequencies. The comparison of Pcv tested at the frequency of 500 kHz is shown in Figure 3c. When the HR increases from 5 to 100 K/min, Pcv gradually decreases from 906 mW/cm3 to the minimum value, which is 759 mW/cm3. As HR continues to rise to 500 K/min, the Pcv deteriorates to 933 mW/cm3. Figure 3d shows the corresponding Hc change curve, which is similar to Pcv. The Hc of the NPCs decreases from 12.9 to 10.8 A/m as the HR rises from 5 to 100 K/min and then increases to 12.6 A/m when the HR further comes to 500 K/min, indicating that Hc is the crucial factor affecting Pcv.
The crystallization behaviors of NPCs annealed at different HR were investigated to further explore the root causes of the changes in soft magnetic properties. The bright-field TEM images of Fe74.75Si8B10P3C2Nb1.5Cu0.75 NPCs annealed at different HR (40, 100, and 500 K/min) are shown in Figure 4a–c, whereas the inset presents the selected area electron diffraction (SAED) patterns. All the NPCs show a unique microstructure where nano-sized grains disperse randomly in the residual amorphous phase, and the grains are defined as the α-Fe(Si) phase by the analysis of the SAED patterns. The high-resolution TEM images are shown in Figure 4d–f. The nano-sized grains of three samples all show noticeable lattice fringes, whose distances are consistent with the interplanar spacing of the (110) plane of the α-Fe(Si) phase. Figure 4g shows the grain size distribution of NPCs annealed at different HR, which are curved in the histograms and fitted by a normal distribution function with average grain sizes (Davg) of 25.17, 20.94, and 23.01 nm, respectively.
The grain density of α-Fe(Si) grains in NPCs annealed at the HR of 100 K/min is much higher than that of HR = 40 and 500 K/min (Figure 4a–c). In addition, the NPCs annealed at the HR of 100 K/min show a minimum Davg compared with others, and the grains are concentrated between 15 and 25 nm with a fraction of 55%, while the fraction between 10 and 30 nm is 88%, indicating a concentrated grains size distribution. For NPCs annealed at the HR of 40 and 500 K/min, α-Fe(Si) nanocrystals show a less concentrated grain size distribution with more large grains. Therefore, unlike the traditional theory that high HR is beneficial for forming a finely uniform nanocrystalline structure [20,21], a moderate HR is better for this alloy composition to obtain α-Fe(Si) grains with high grain density and a relatively small grain size.
A finely uniform nanocrystalline structure with a high grain density of α-Fe(Si) grains is beneficial for magnetic softness. According to the single-phase theoretical model by Herzer [12], the exchange coupling between grains shows the easy magnetization direction arranged in parallel when the grains are down on the nanometer scale, and it is no longer the magnetocrystalline anisotropy constant (K) of a single grain that affects the magnetization but the average magnetocrystalline anisotropy (K1) [22]. When the grain size is smaller than the ferromagnetic exchange coupling length (Lex), which is about 35 nm, K1 decreases with the decrease of the grain size. The relationship between K1 and grain size can be concluded by Equation (1):
K 1 = K 4 D avg 6 A 3
where Davg is the average grain size, and A denotes the exchange stiffness. Hc and μe are followed by Equations (2) and (3), respectively:
H c K 1 4 D avg 6 J s A 3
μ e J s A 3 μ 0 K 1 4 D avg 6
where Js is the saturation magnetization, and μ0 is the vacuum permeability constant. Therefore, the Hc of the nanocrystalline soft magnetic alloy is proportional to D avg 6 , and μe is inversely proportional to D avg 6 . The refinement of the grains is beneficial to the improvement of the soft magnetic properties, including the decrease of Hc and the increase of μe. It can be seen from Figure 3d and Figure 4g that Hc and Davg both reach the lowest value when HR is 100 K/min, namely 10.8 A/m and 20.94 nm, respectively, which is consistent with the above conclusion; therefore, the Pcv of NPCs reaches to the minimum, since Hc is the crucial factor affecting Pcv. In addition, the increase of μe shown in Figure 3a is also attributed to the refinement of grain size. In this regard, we concluded that, in this alloy system, a moderate heating rate can make it obtain a finely uniform nanocrystalline structure, thereby optimizing soft magnetic properties.

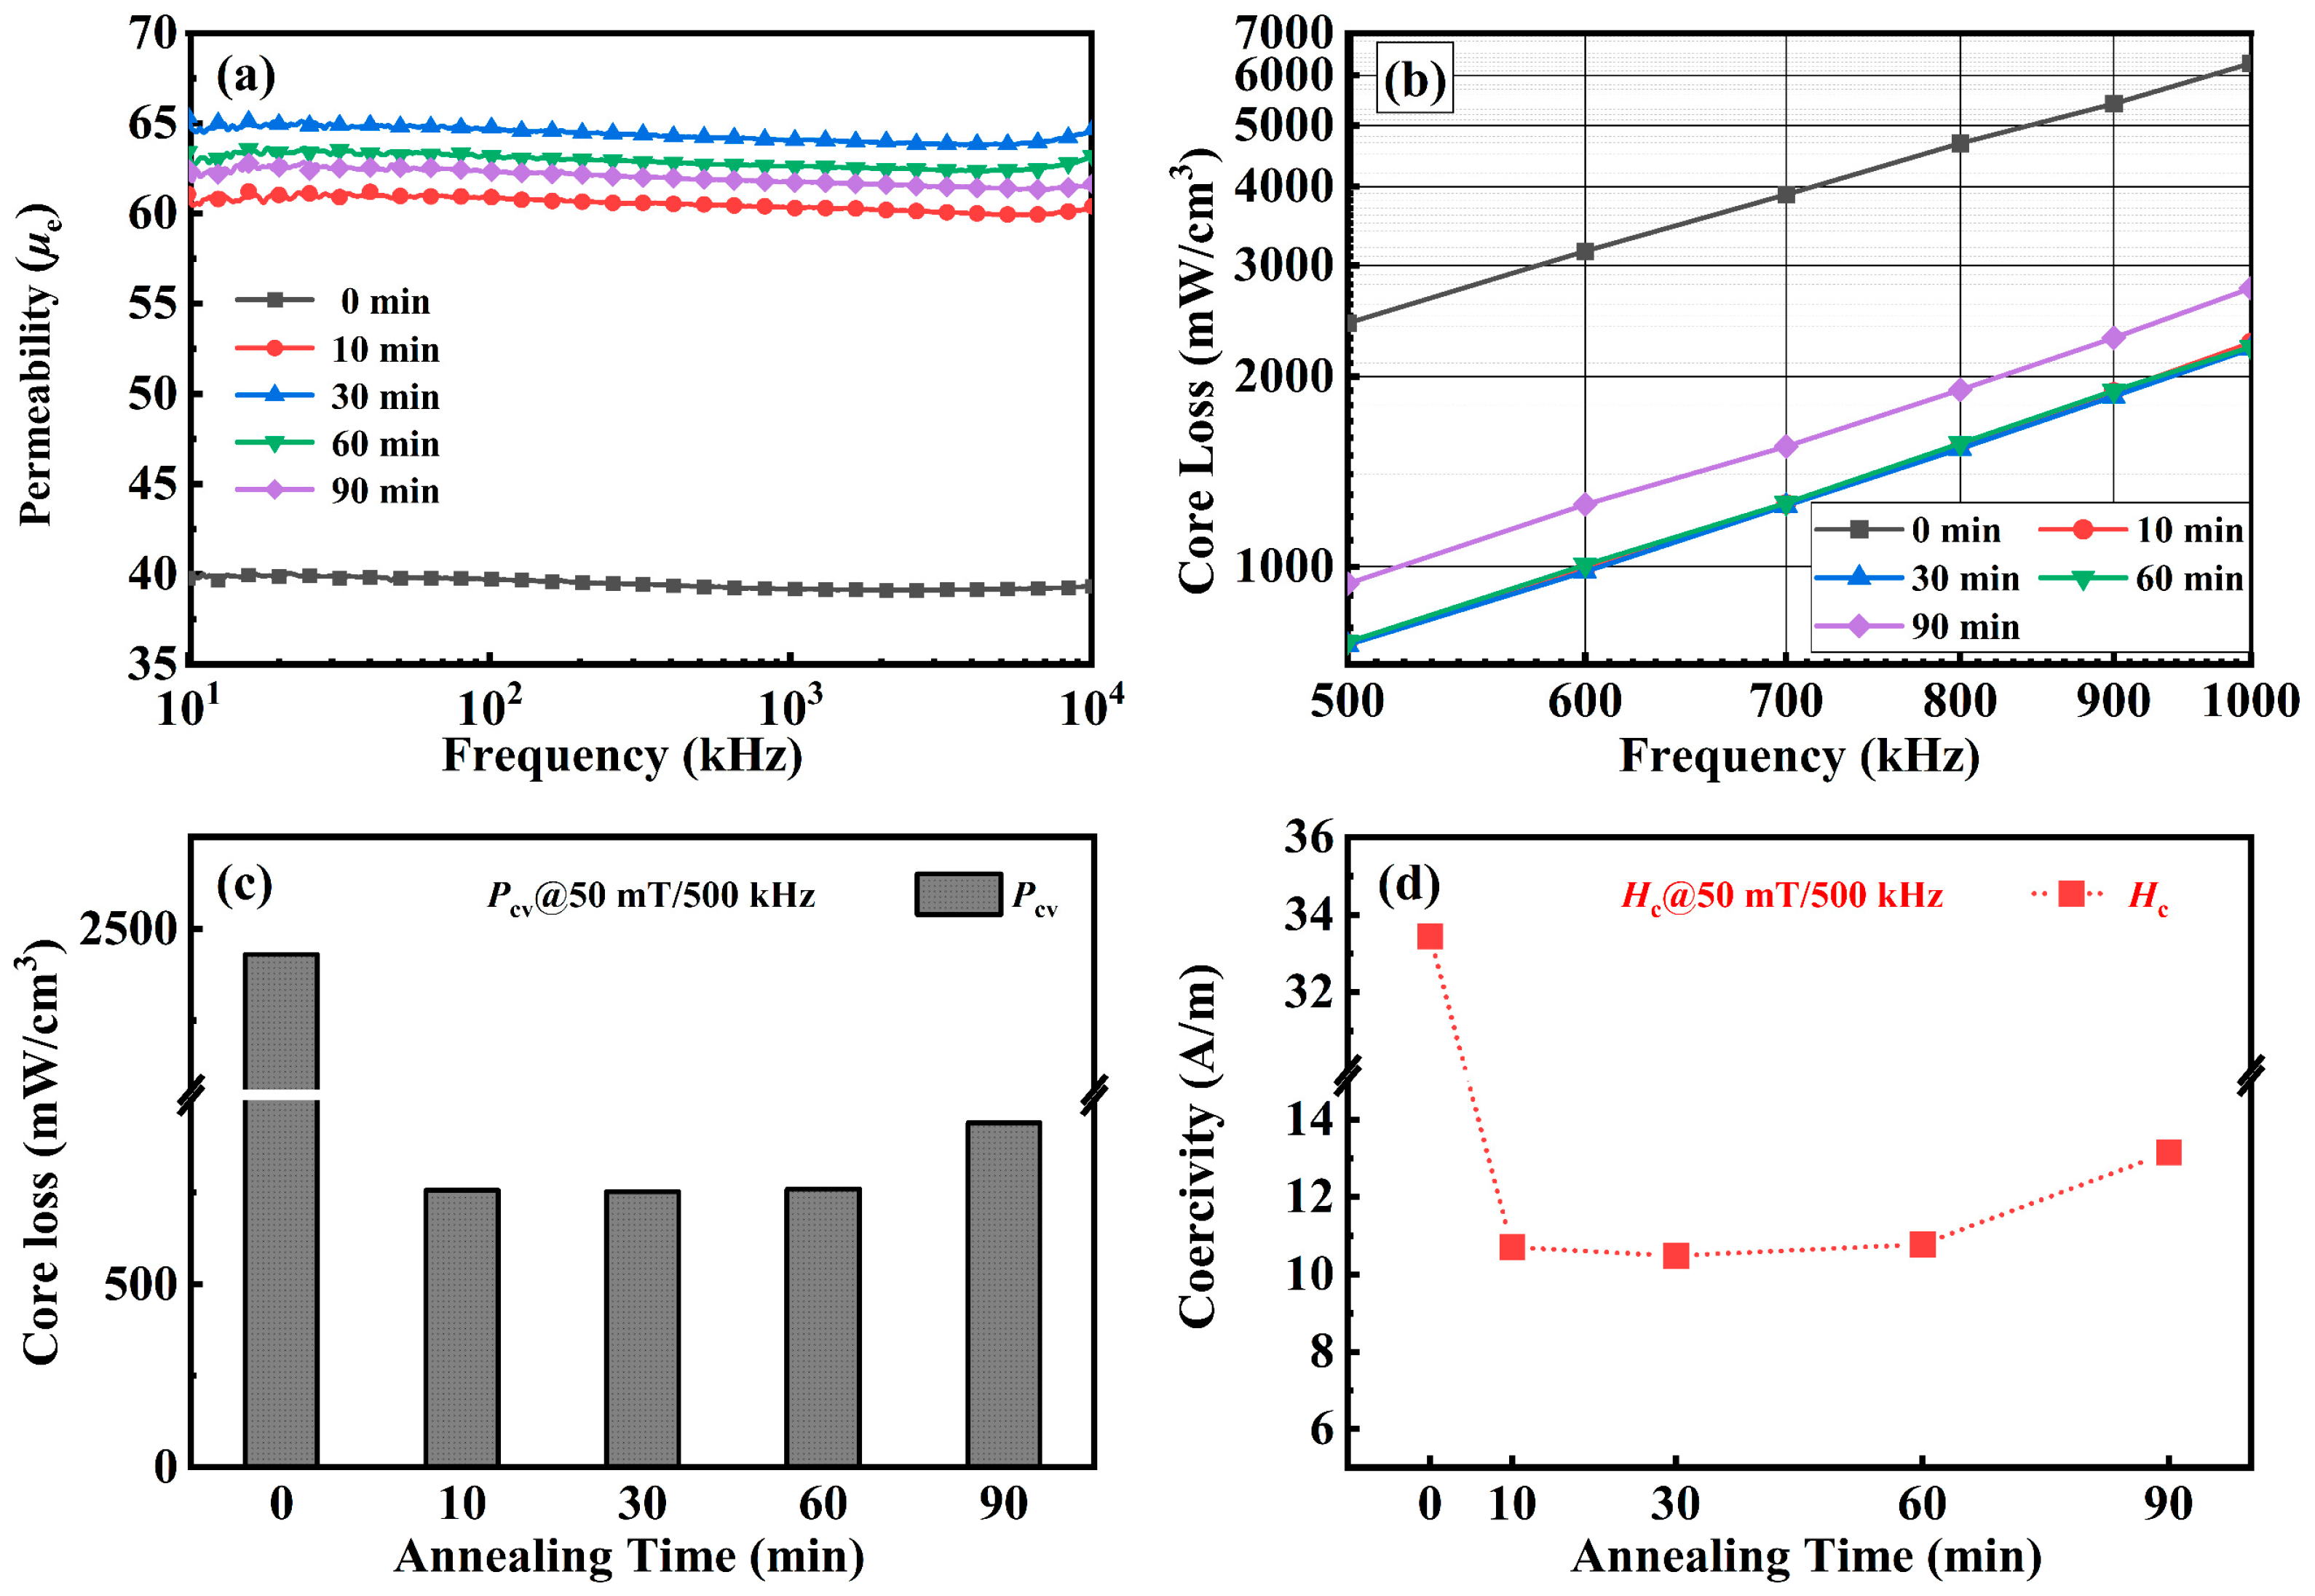
3.3. Magnetic Properties and Microstructures of Fe74.75Si8B10P3C2Nb1.5Cu0.75 NPCs Annealed for Different HT

The HT for NPCs was subsequently adjusted to further optimize the structure and performance; annealing processes with different HT (0, 10, 30, and 90 min) and the optimized HR of 100 K/min were applied for Fe74.75Si8B10P3C2Nb1.5Cu0.75 NPCs. The μe of the NPCs annealed for different HT is shown in Figure 5a. The NPCs show a low μe of 39.7 at the frequency of 100 kHz when HT is 0 min, and as HT is extended from 0 to 10 min, μe rises sharply from 39.7 to 60.9, and then, the amplitude of the increase tends to be flat, and the μe of NPCs reaches the maximum value of 64.7 with an HT of 30 min. As HT further reaches 90 min, the μe gradually decreases from the maximum to 62.3.
The dependence of Pcv on the frequency for NPCs is shown in Figure 5b, and the applied field is 50 mT. NPCs annealed for the HT of 10, 30, and 60 min all show extremely low Pcv, which are very close. The comparison of Pcv tested at 500 kHz is shown in Figure 5c. The NPCs annealed for 0 min show a high Pcv of 2429 mW/cm3. As HT extends from 0 min to 10 min, Pcv decreases sharply from 2429 to 756 mW/cm3. When HT comes to 30 min, Pcv reaches the minimum value of 751 mW/cm3. When HT further extends to 90 min, Pcv gradually increases from 751 to 939 mW/cm3. The Hc change curve is shown in Figure 5d, which has the same trend as Pcv. The Hc of NPCs decreases from 33.5 A/m to 10.5 A/m as HT rises from 0 to 30 min and then increases to 13.2 A/m when HT further comes to 90 min. The Pcv and Hc both reach the lowest value when the HT is 30 min, indicating that Hc is the key factor affecting Pcv, which is consistent with the above conclusion.
The crystallization behaviors of NPCs annealed for different HT were further analyzed by TEM. Figure 6a,b show the bright-field TEM images and SAED patterns of Fe74.75Si8B10P3C2Nb1.5Cu0.75 NPCs annealed for different HT (10 and 30 min). The NPCs annealed for 10 min mainly show an amorphous structure where only a few crystal grains can be observed, and no obvious diffraction spots can be seen from the SAED pattern. NPCs annealed for 30 min show a unique microstructure where nano-sized grains are densely distributed in the amorphous matrix, and the crystalline phase of these nano-sized grains can be defined as the α-Fe(Si) phase by the analysis of the SAED patterns. The grain size distribution of the NPCs annealed for 30 min is shown in Figure 6c, which is curved in a histogram and fitted by a normal distribution function with Davg of 18.71 nm.
The differences in the crystallization structures of Fe74.75Si8B10P3C2Nb1.5Cu0.75 NPCs annealed for different HT are mainly controlled by the growth of α-Fe(Si) grains. The XRD patterns of NPCs annealed for different HT (10 min, 30 min, and 60 min) are shown in Figure 7. Only a broad peak at around 2θ = 45° can be observed in the pattern for the NPCs annealed for 10 min, indicating that the structure is still mainly amorphous, which is consistent with the TEM image and SAED pattern (Figure 6a). It is reasonable to speculate that the interiors of NPCs are completely amorphous when annealed for 0 min. NPCs annealed for 30 and 60 min both exhibit three peaks corresponding to the α-Fe(Si) phase, according to the standard PDF card (PDF#35-0519@PDF2-2004), and the intensity increases gradually with the rise of HT, indicating the growth of α-Fe(Si) grains, which is consistent with the trend of the particle size variation shown in Figure 4g and Figure 6c.
The amorphous matrix in Fe-based nanocrystalline alloy has a large positive magnetostriction coefficient (λs), which leads to a high Hc. Thus, NPCs annealed for 0 min show a large Hc of 33.5 A/m and Pcv of 2429 mW/cm3 due to the completely amorphous structure. The precipitation of α-Fe(Si) grains, which show negative λs, can effectively neutralize the positive λs of the amorphous matrix and leads to the decrease of Hc. However, Hc also has a great relationship with the grain size, which is shown in Equation (2); the excessively grown grains would cause a sharp rise in Hc, thereby deteriorating the soft magnetic properties of NPCs. The optimization effect of α-Fe(Si) grain precipitation on λs and the deterioration effect on Hc reach equilibrium when HT is 30 min, making the Hc of NPCs reach the minimum value of 10.5 A/m (Figure 5d). Therefore, the Pcv of NPCs reaches the minimum, since Hc is the crucial factor affecting Pcv. The μe of NPCs also reaches the maximum value of 64.7 (Figure 5a) due to the optimized nanocrystalline structure.

3.4. Magnetic Domain Motion Behavior of Fe74.75Si8B10P3C2Nb1.5Cu0.75 NPCs

The magnetic properties of the NPCs are strongly related to the magnetic domain structure. Hc represents the strength of the reverse magnetic field that needs to be applied after NPCs are magnetized to saturation and then completely demagnetized (magnetization M = 0) [23], which is closely related to the motion behavior of the magnetic domains [24,25,26,27]. Therefore, revealing the relationship between magnetism and the microstructure is crucial for controlling magnetic behavior in NPCs.
The Lorentz transmission electron microscope (LTEM) was applied to observe the magnetic domain structure. In order to explore the effect of the microstructure on the movement of the magnetic domain walls, NPCs with an HR of 40 K/min, HT of 60 min and HR of 100 K/min, HT of 30 min are selected for comparison, which has the largest and smallest average grain sizes, respectively. The in focus, overfocused, and under-focused LTEM images are shown in Figure 8a–c and Figure 8d–e, respectively. The overfocused sample is superimposed with black lines (indicating insufficient electrons) and white lines (indicating excess electrons), directly showing the magnetic domain boundaries in the sample. As the sample is in the under-focused position, the fringe contrast observed at this time is just the opposite of that of the overfocused. As indicated by the red circles in Figure 8b,c, a few light spots can be observed inside the NPCs annealed with the HR of 40 K/min and HT of 60 min, where the domain walls show finer branches and further increase the complexity of the magnetic domain structure. Meanwhile, the NPCs annealed under the HR of 100 K/min and HT of 30 min show a simpler magnetic domain structure; the magnetic domain walls are clearer without obvious branches.
The external magnetic field applied to the NPCs would lead to the rotation of magnetic moments and displacement of domain walls [28,29,30]; the dynamic processes of the magnetic domain movement for NPCs annealed under different conditions (HR = 40 K/min, HT = 60 min and HR = 100 K/min, HT = 30 min) are shown in Figure 9a,b and Figure 9c,d, respectively. By observing the magnetic domain wall perpendicular to the direction of the external field, It can be seen that the magnetic domain wall of NPCs annealed under the HR of 40 K/min and HT of 60 min starts to move when the applied field is 83 Oe, and the moving distance is about 0.24 μm, while the magnetic domain wall of NPCs annealed under the HR of 100 K/min and HT of 30 min starts to move when the applied field is 25 Oe, and the moving distance is about 0.75 μm.
After the optimizing procedure, the movement of the magnetic domain walls of NPCs becomes easier and shows a longer moving distance even in a smaller external field, indicating a sharp drop of Hc. During the magnetization of NPCs, these branches observed on the domain walls of NPCs annealed under the HR of 40 K/min and HT of 60 min severely hinder the progress of magnetization, resulting in a larger Hc [31]. After the optimization of heat treatment processes, no obvious branches can be observed; thus, the movement of the magnetic domain walls becomes easier.
The dynamic processes of the magnetic domain movement of NPCs strongly reveal the relationship between magnetism and microstructure: A nanocrystalline structure with a less-concentrated grain size distribution and large grain size leads to a complex magnetic domain structure, which deteriorates the magnetic properties, while a finely uniform nanocrystalline structure leads to a simple and clear magnetic domain structure with no pinning points that significantly reduce the Hc and Pcv of NPCs.

3.5. Nanocrystallization Processes of Fe74.75Si8B10P3C2Nb1.5Cu0.75 NPCs

The probable schematics of nanocrystallization processes in Fe74.75Si8B10P3C2Nb1.5Cu0.75 NPCs are reasonably assumed in Figure 10. The NPCs show a disordered amorphous structure before annealing. When the annealing temperature gradually increases, the Fe element in the NPCs exhibits a concentration difference due to the Cu clusters [32,33], and the enriched Fe element precipitates and grows in the form of α-Fe(Si) grains.
HR is a decisive factor affecting the crystallization structure during the crystallization process. When NPCs are crystallized at a low HR, although a high-density α-Fe(Si) core can be formed, a part of the grains are absorbed during the nucleation and growth process due to its slow HR, resulting in the discrete grain size distribution and relatively large grain sizes (Figure 4g). When NPCs are crystallized at a high HR, the amorphous matrix fails to form a uniform and dense nucleation. Subsequent grain growth also unfolds based on this, eventually leading to an uneven crystalline structure. The moderate HR can avoid the mutual engulfment of grains and the less dense nucleation, and finally, form a fine and uniform nanocrystalline structure with a relatively small grain size.
HT further regulates the growth of grains. The NPCs basically maintain the amorphous structure, and only a few α-Fe(Si) grains can be precipitated in the amorphous matrix when the HT is too short, which leads to a low crystallization volume fraction. However, although a high crystallization volume fraction can be obtained when the HT is long, it would cause the excessive growth of α-Fe(Si) grains, resulting in an increase of Hc and a decrease of μe. A moderate HR is beneficial to obtain an optimal nanocrystalline structure and optimize the performance of the NPCs to prepare electronic components with an excellent performance suitable for high-frequency fields.

4. Conclusions

In this work, the effects of HR and HT on the microstructure, crystallization behavior, and soft magnetic properties of Fe74.75Si8B10P3C2Nb1.5Cu0.75 NPCs were investigated systematically. The main conclusions are as follows:
(1)
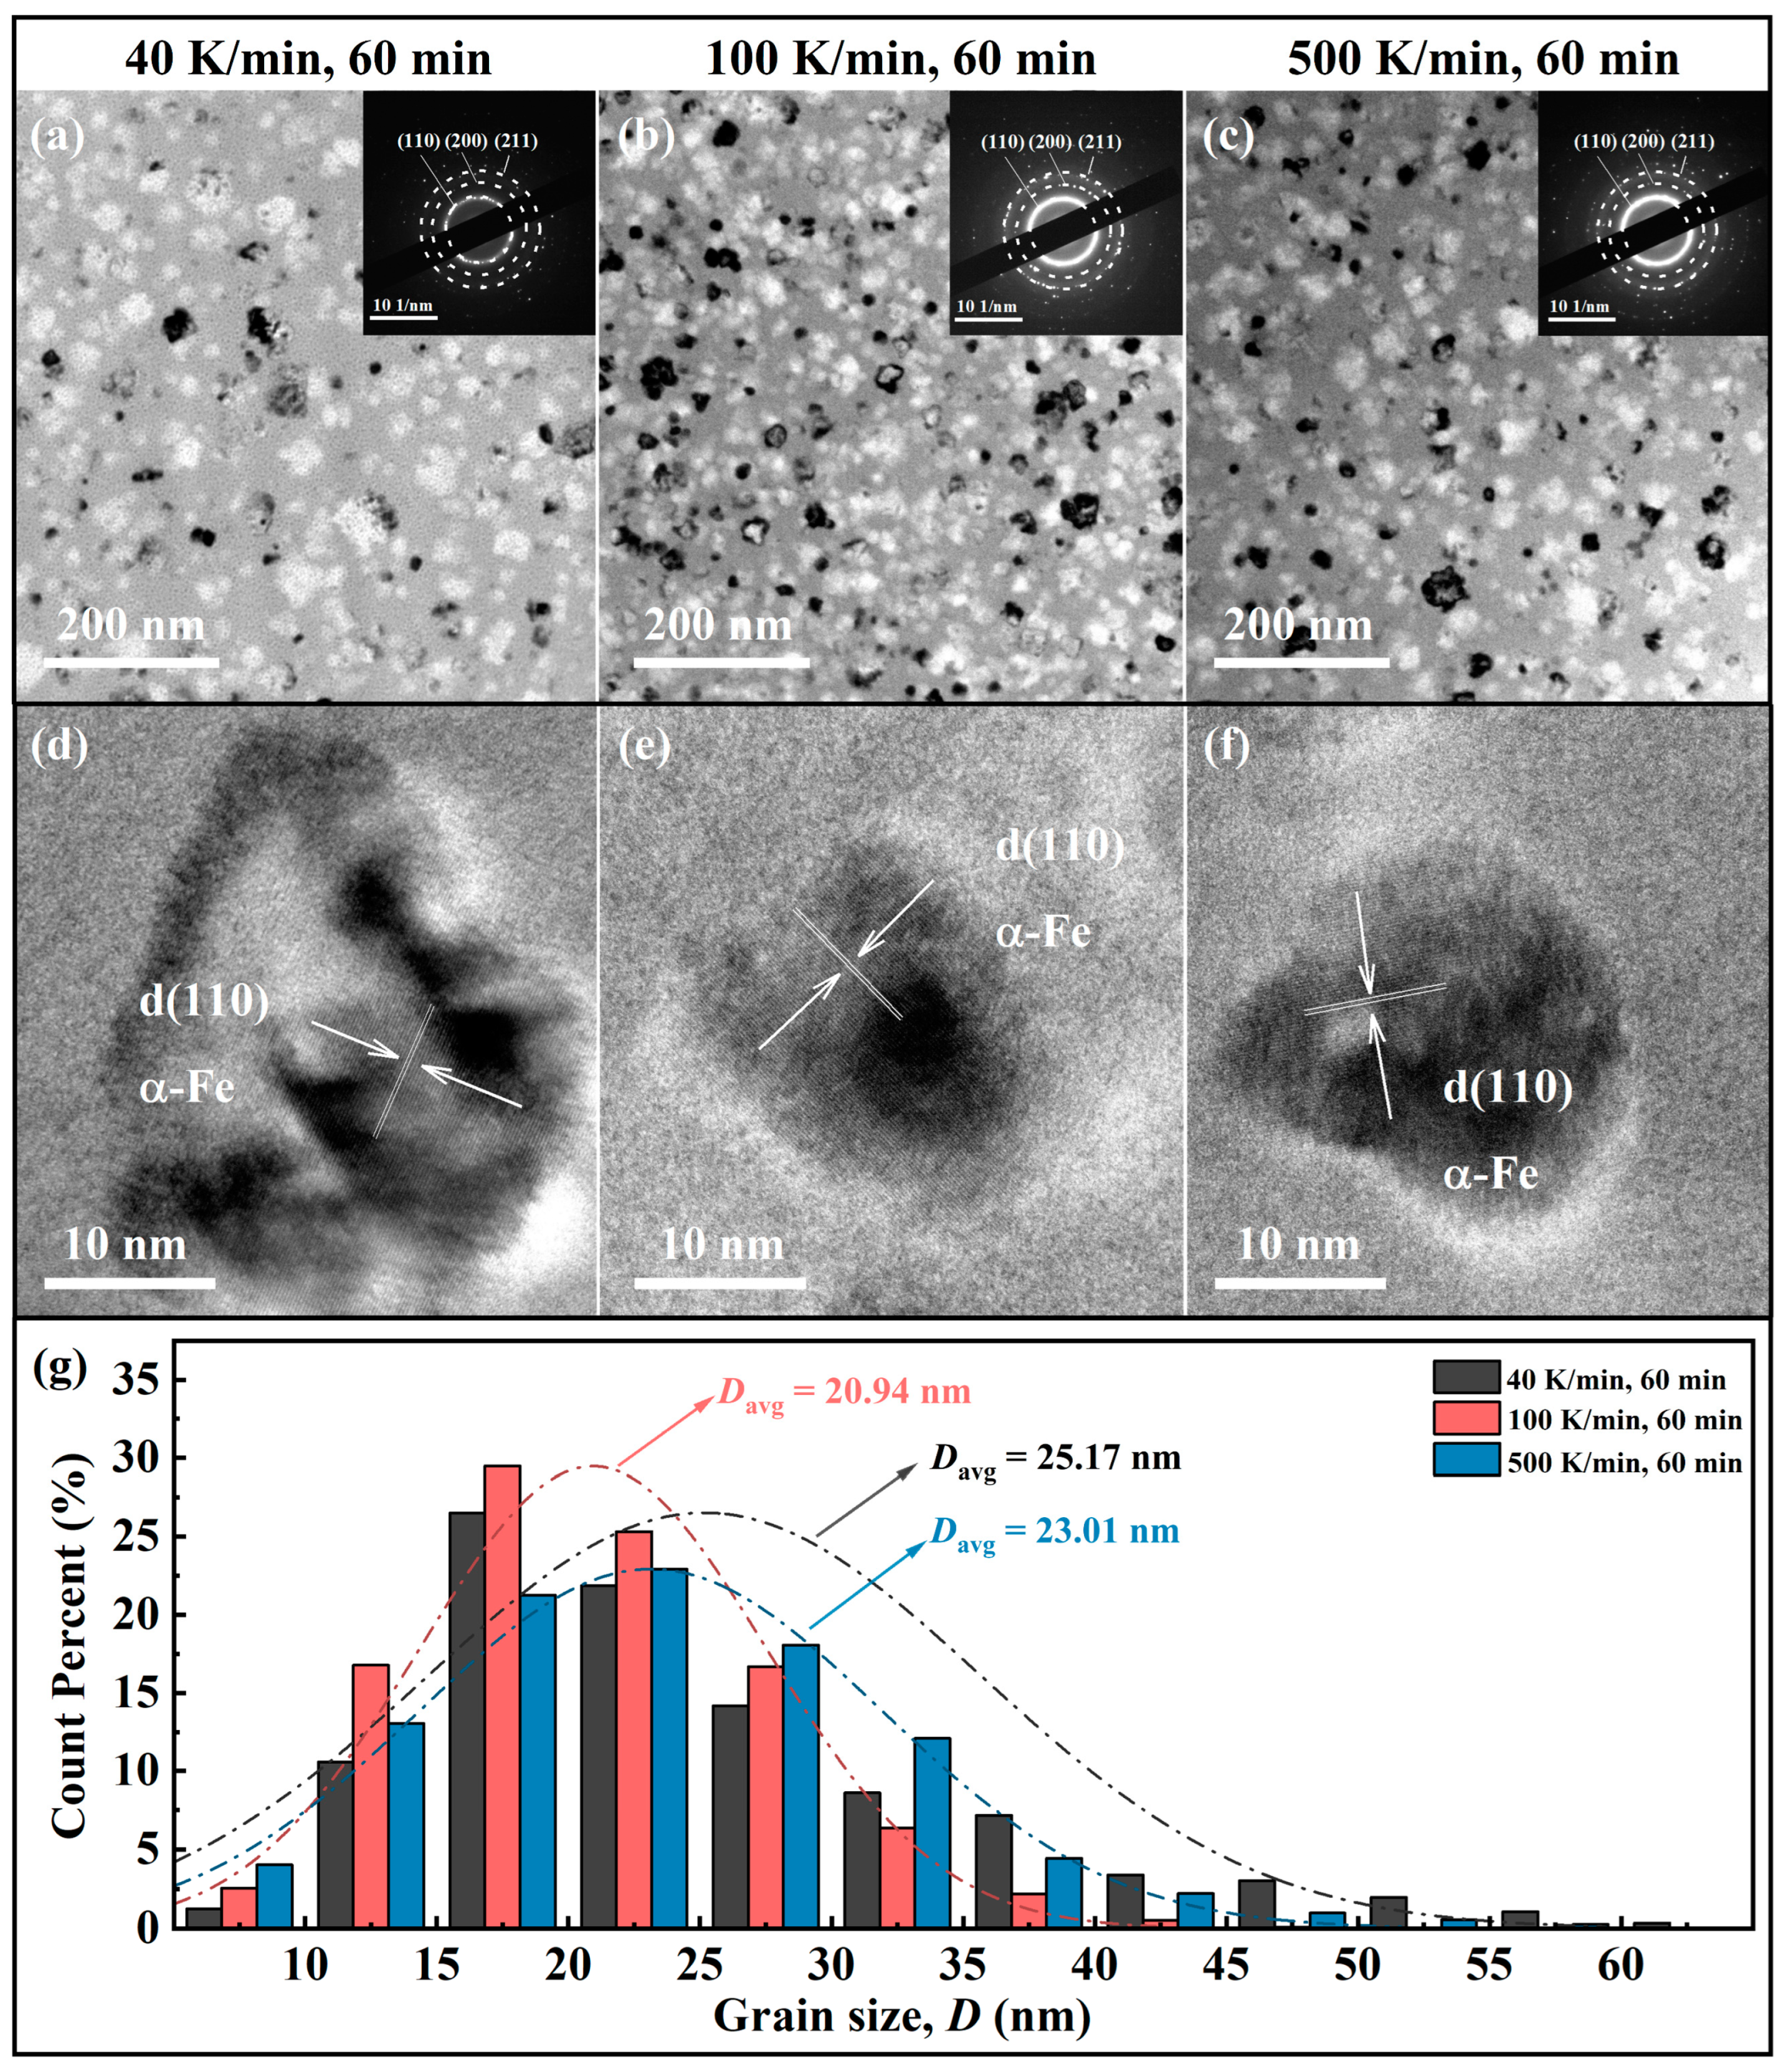
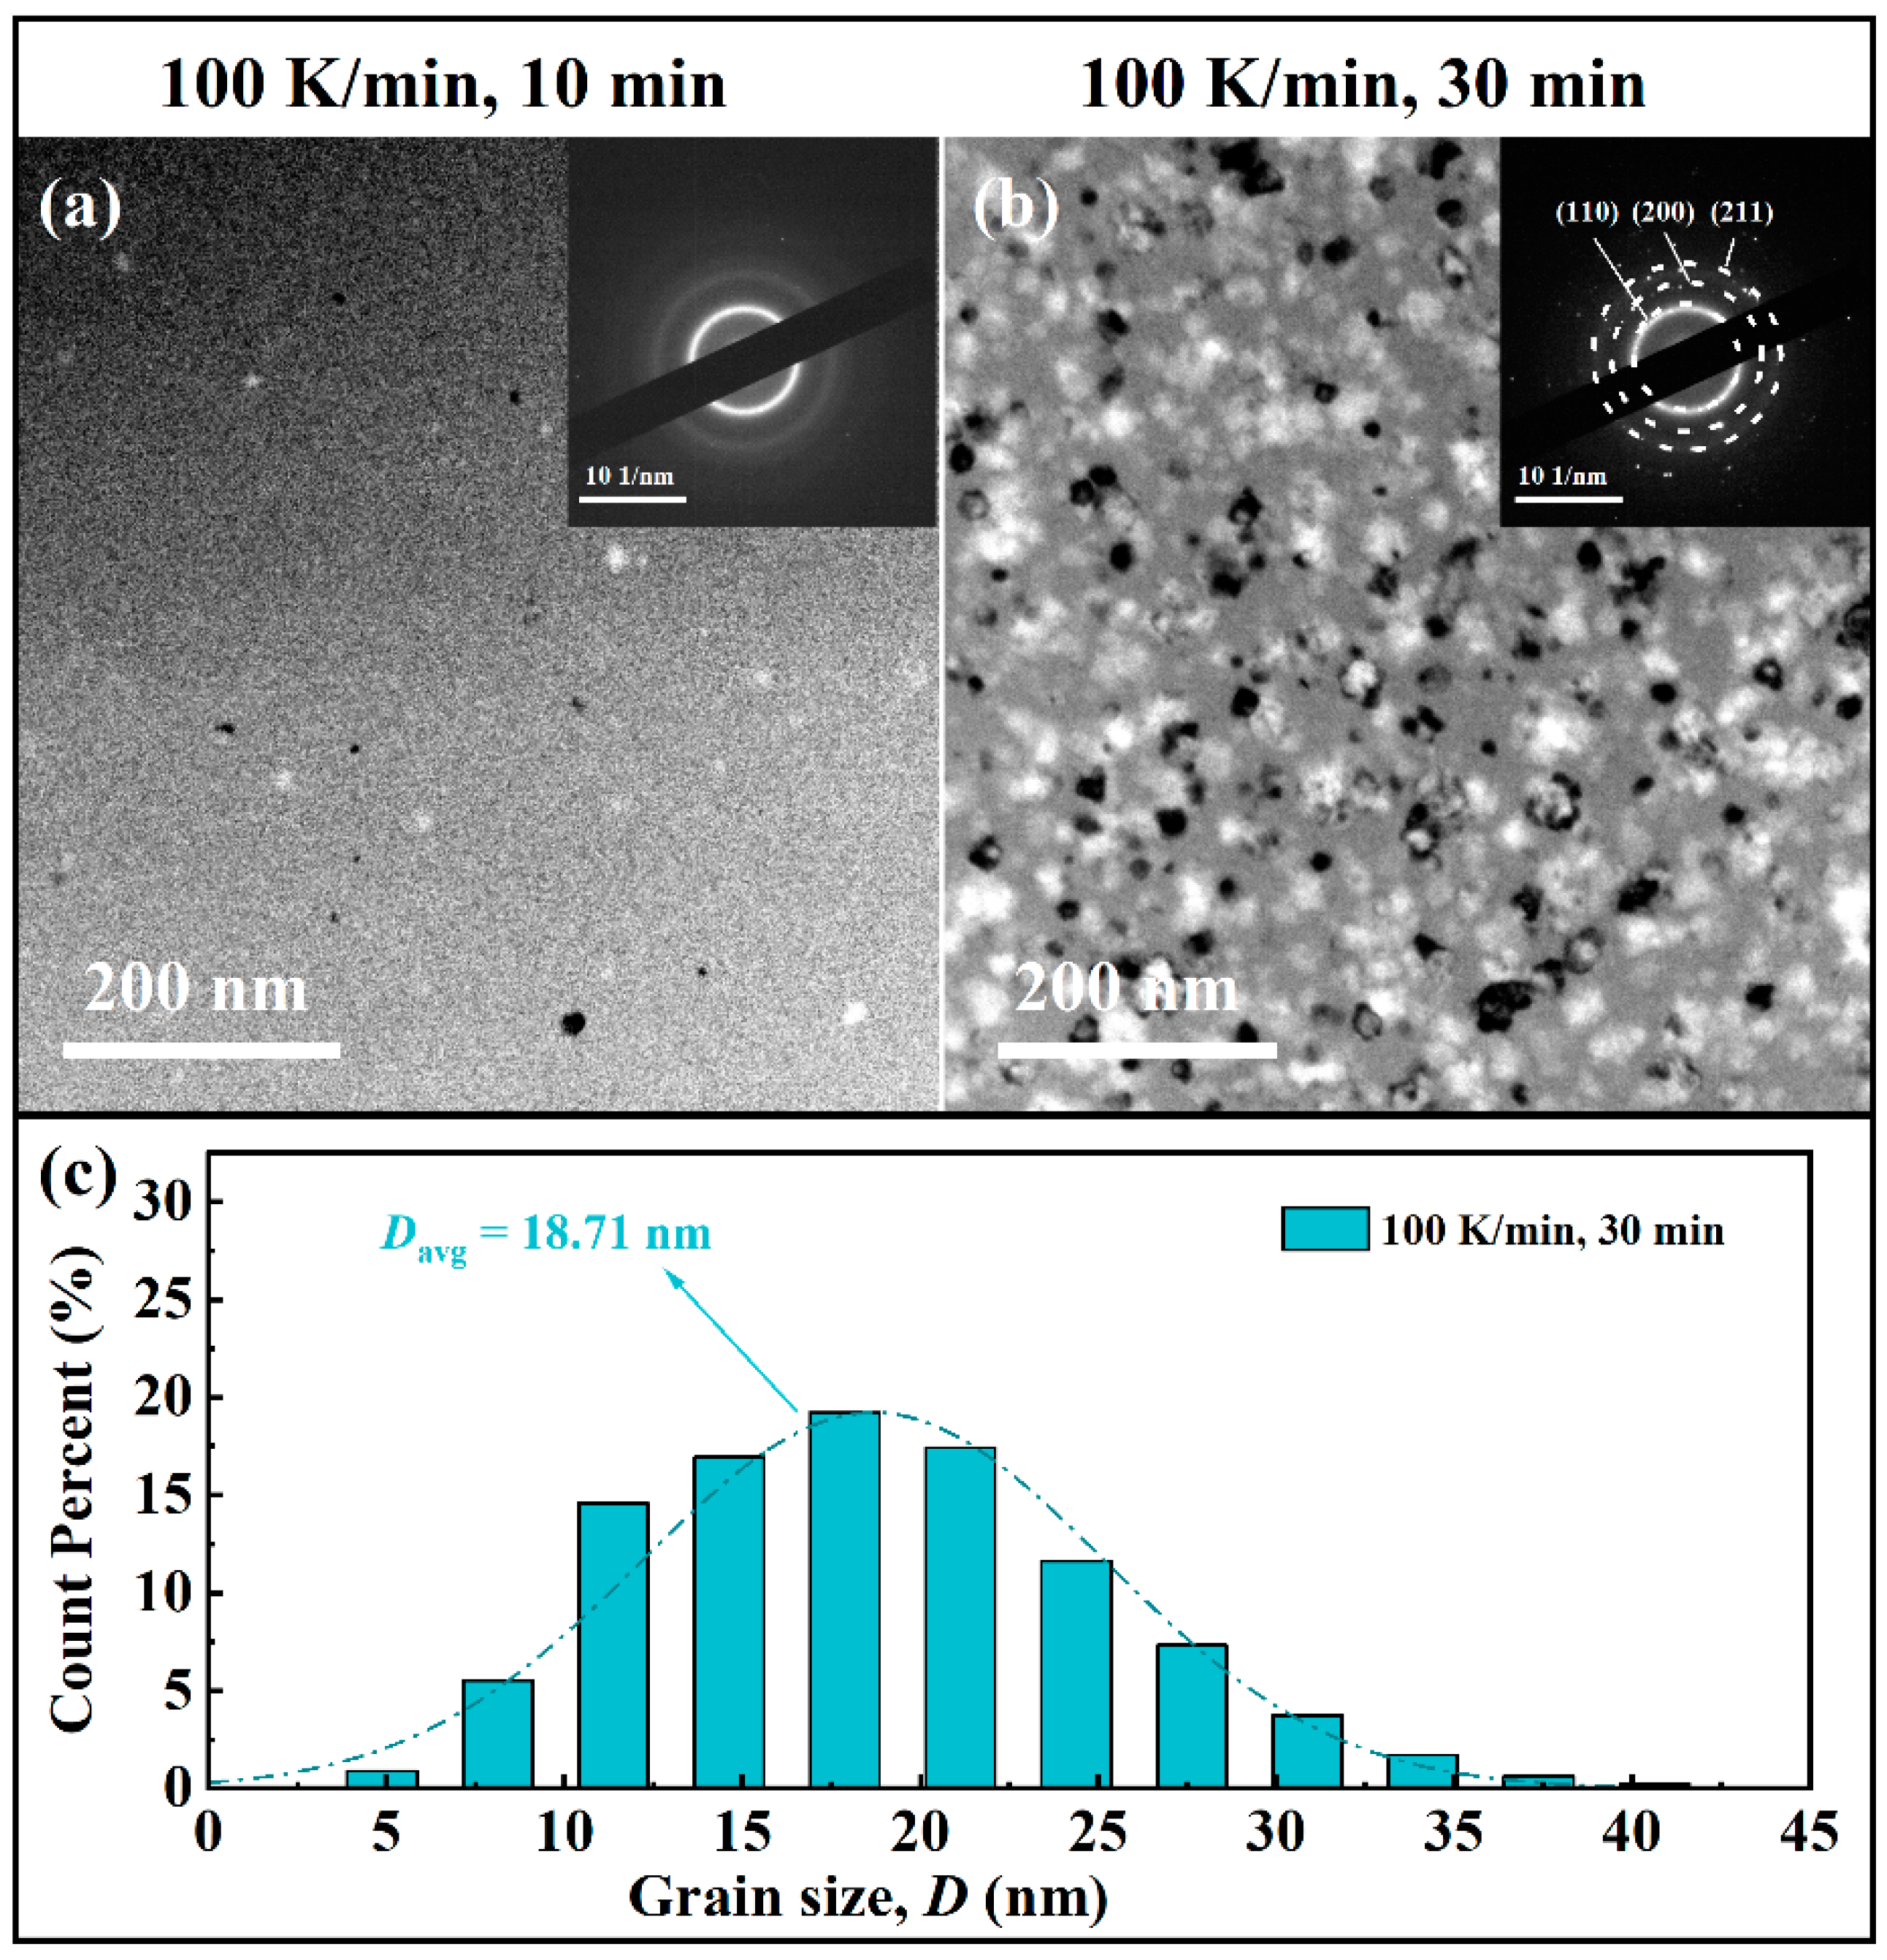
The moderate HR and HT of 100 K/min and 30 min lead to a finely uniform nanocrystalline structure, which shows a concentrated grain size distribution and a fine grain size of 18.71 nm.
(2)
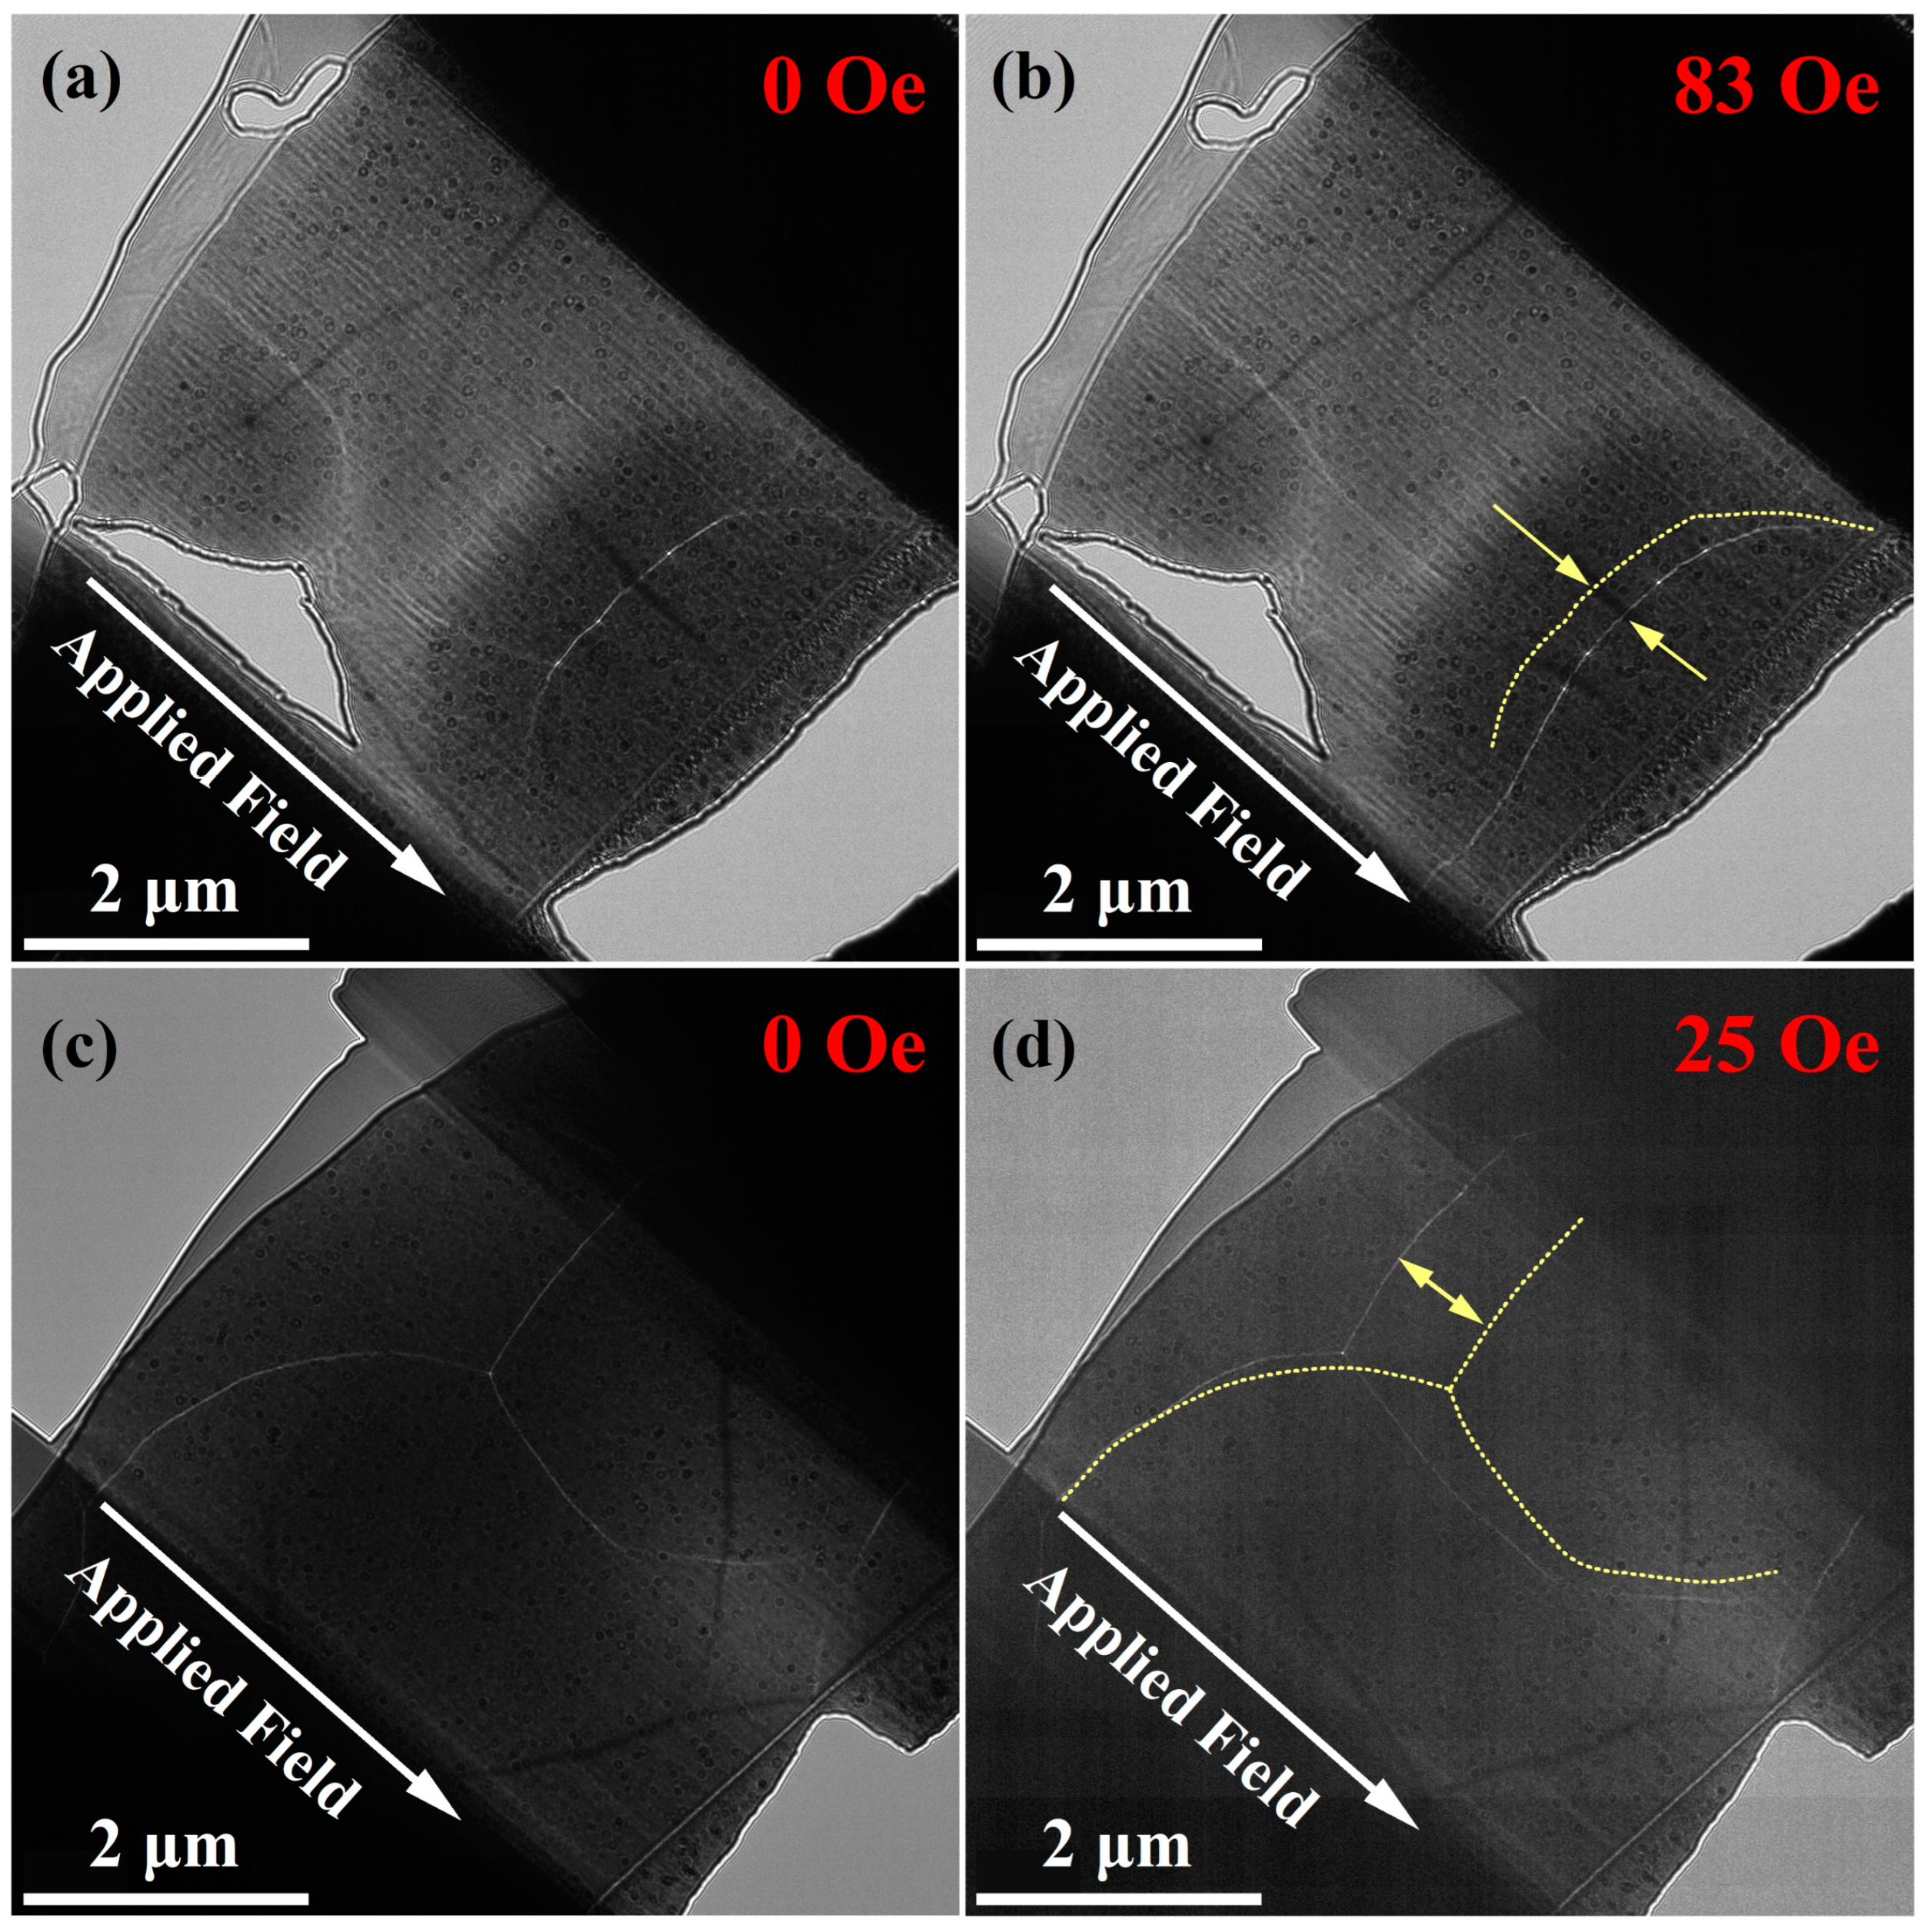
The NPCs annealed under the HR and HT of 100 K/min and 30 min show a modified magnetic domain structure, where no obvious pinning points can be observed, and the domain wall moves easier than that of the NPCs annealed under other annealing conditions, which indicates the reduction of Hc.
(3)
The NPCs annealed under the HR and HT of 100 K/min and 30 min show excellent comprehensive soft magnetic properties, including a low Hc of 10.5 A/m 7.0 (50 mT, 500 kHz), high μe of 64.7 (100 kHz), and low Pcv of 751 mW/cm3 (50 mT, 500 kHz).

Author Contributions

Conceptualization, Y.W. and Y.D.; methodology, Y.W., Y.D. and X.J.; validation, Z.L., H.L. and H.Z.; data curation, Y.W. and X.J.; writing—original draft preparation, Y.W.; writing—review and editing, Y.W., Y.D. and M.Y.; supervision, A.H. and J.L.; project administration, Y.W.; and funding acquisition, Y.D. All authors have read and agreed to the published version of the manuscript.

Funding

This research was funded by the S&T Innovation 2025 Major Special Program (Grant No. 2021Z38), Youth Innovation Promotion Association CAS (Grant No. 2021294), Science and Technology Service Network Initiative of the Chinese Academy of Sciences (Grant No. KFJ-STS-QYZD-2021-07-002), and the National Natural Science Foundation of China (Grant No. U1809216), Jiangxi Province Science and Technology Cooperation Key Project (No. 20212BDH80007), Science and Technology Major Project of Ganzhou (No. 202101064871).

Institutional Review Board Statement

Not applicable.

Informed Consent Statement

Not applicable.

Data Availability Statement

Not applicable.

Conflicts of Interest

The authors declare no conflict of interest.

References

  1. Yoshizawa, Y.; Oguma, S.; Yamauchi, K. New Fe-based soft magnetic alloys composed of ultrafine grain structure. J. Appl. Phys. 1988, 64, 6044–6046. [Google Scholar] [CrossRef]
  2. Zhang, Y.; Sharma, P.; Makino, A. Fe-Rich Fe-Si-B-P-Cu Powder Cores for High-Frequency Power Electronic Applications. IEEE Trans. Magn. 2014, 50, 1–4. [Google Scholar] [CrossRef]
  3. McHenry, M.E.; Willard, M.A.; Laughlin, D.E. Amorphous and nanocrystalline materials for applications as soft magnets. Prog. Mater. Sci. 1999, 44, 291–433. [Google Scholar] [CrossRef]
  4. Herzer, G. Modern soft magnets: Amorphous and nanocrystalline materials. Acta Mater. 2013, 61, 718–734. [Google Scholar] [CrossRef]
  5. Kim, Y.B.; Jee, K.K.; Choi, G.B. Fe-based nanocrystalline alloy powder cores with excellent high frequency magnetic properties. J. Appl. Phys. 2008, 103, 07E704. [Google Scholar] [CrossRef]
  6. Cho, E.K.; Kwon, H.T.; Cho, E.M.; Song, Y.S.; Sohn, K.Y.; Park, W.W. The control of nano-grain size and magnetic properties of Fe73Si16B7Nb3Cu1 soft magnetic powder cores. Mater. Sci. Eng. A 2007, 449–451, 368–370. [Google Scholar] [CrossRef]
  7. Kim, T.H.; Jee, K.K.; Kim, Y.B.; Byun, D.J.; Han, J.H. High-frequency magnetic properties of soft magnetic cores based on nanocrystalline alloy powder prepared by thermal oxidation. J. Magn. Magn. Mater. 2010, 322, 2423–2427. [Google Scholar] [CrossRef]
  8. Alvarez, K.L.; Baghbaderani, H.A.; Martín, J.M.; Burgos, N.; Ipatov, M.; Pavlovic, Z.; McCloskey, P.; Masood, A.; Gonzalez, J. Novel Fe-based amorphous and nanocrystalline powder cores for high-frequency power conversion. J. Magn. Magn. Mater. 2020, 501, 166457. [Google Scholar] [CrossRef]
  9. Wang, Y.; Lucia, O.; Zhang, Z.; Gao, S.; Guan, Y.; Xu, D. A Review of High Frequency Power Converters and Related Technologies. IEEE Ind. Electron. Soc. 2020, 1, 247–260. [Google Scholar] [CrossRef]
  10. de Groot, H.; Janssen, E.; Pagano, R.; Schetters, K. Design of a 1-MHz LLC Resonant Converter Based on a DSP-Driven SOI Half-Bridge Power MOS Module. IEEE Trans. Power Electron. 2007, 22, 2307–2320. [Google Scholar] [CrossRef]
  11. Pang, L.L.; Inoue, A.; Zanaeva, E.N.; Wang, F.; Bazlov, A.I.; Han, Y.; Kong, F.L.; Zhu, S.L.; Shull, R.B. Nanocrystallization, good soft magnetic properties and ultrahigh mechanical strength for Fe82-85B13-16Si1Cu1 amorphous alloys. J. Alloys Compd. 2019, 785, 25–37. [Google Scholar] [CrossRef]
  12. Herzer, G. Grain size dependence of coercivity and permeability in nanocrystalline ferromagnets. IEEE Trans. Magn. 1990, 26, 1397–1402. [Google Scholar] [CrossRef]
  13. Li, Z.; Parsons, R.; Kishimoto, H.; Shoji, T.; Kato, A.; Karel, J.; Suzuki, K. Nanocrystalline (Fe, Co, Ni)86B14 soft magnetic alloys prepared by ultra-rapid annealing. J. Alloys Compd. 2022, 902, 162544. [Google Scholar] [CrossRef]
  14. Jiang, L.; Zhang, Y.; Tong, X.; Suzuki, T.; Makino, A. Unique influence of heating rate on the magnetic softness of Fe81.5Si0.5B4.5P11Cu0.5C2 nanocrystalline alloy. J. Magn. Magn. Mater. 2019, 471, 148–152. [Google Scholar] [CrossRef]
  15. Meng, Y.; Pang, S.J.; Chang, C.T.; Bai, X.Y.; Zhang, T. Nanocrystalline Fe83Si4B10P2Cu1 ribbons with improved soft magnetic properties and bendability prepared via rapid annealing of the amorphous precursor. J. Magn. Magn. Mater. 2021, 523, 167583. [Google Scholar] [CrossRef]
  16. Yoshida, K.; Bito, M.; Kageyama, J.; Shimizu, Y.; Abe, M.; Makino, A. Unusual high Bs for Fe-based amorphous powders produced by a gas-atomization technique. AIP Adv. 2016, 6, 055933. [Google Scholar] [CrossRef] [Green Version]
  17. Yoshida, S.; Mizushima, T.; Hatanai, T.; Inoue, A. Preparation of new amorphous powder cores using Fe-based glassy alloy. IEEE Trans. Magn. 2000, 36, 3424–3429. [Google Scholar] [CrossRef]
  18. Chang, C.; Dong, Y.; Liu, M.; Guo, H.; Xiao, Q.; Zhang, Y. Low core loss combined with high permeability for Fe-based amorphous powder cores produced by gas atomization powders. J. Alloys Compd. 2018, 766, 959–963. [Google Scholar] [CrossRef]
  19. Duhaj, P.; Maťko, I.; Švec, P.; Janičkovič, D. Structural characterization of the finemet type alloys. J. Non-Cryst. Solids 1995, 193, 561–564. [Google Scholar] [CrossRef]
  20. Parsons, R.; Zang, B.; Onodera, K.; Kishimoto, H.; Kato, A.; Suzuki, K. Soft magnetic properties of rapidly-annealed nanocrystalline Fe-Nb-B-(Cu) alloys. J. Alloys Compd. 2017, 723, 408–417. [Google Scholar] [CrossRef]
  21. Ohta, M.; Yoshizawa, Y. Effect of Heating Rate on Soft Magnetic Properties in Nanocrystalline Fe80.5Cu1.5Si4B14 and Fe82Cu1Nb1Si4B12 Alloys. Appl. Phys. Express 2009, 2, 2. [Google Scholar] [CrossRef]
  22. Suzuki, K.; Herzer, G. Magnetic-field-induced anisotropies and exchange softening in Fe-rich nanocrystalline soft magnetic alloys. Scr. Mater. 2012, 67, 548–553. [Google Scholar] [CrossRef]
  23. Florio, G. Structural Features of Magnetic Materials. In Encyclopedia of Smart Materials; Olabi, A.-G., Ed.; Elsevier: Amsterdam, The Netherlands, 2022; Volume 5, pp. 1–9. [Google Scholar]
  24. Long, J.; Qin, Y.; Nuhfer, T.; De Graef, M.; Laughlin, D.E.; McHenry, M.E. Magnetic domain observations in a FeCo-based nanocrystalline alloy by Lorentz microscopy. J. Appl. Phys. 2007, 101, 09N115. [Google Scholar] [CrossRef] [Green Version]
  25. Saito, K.; Park, H.S.; Shindo, D.; Yoshizawa, Y. Magnetic domain structure in Fe78.8-xCoxCu0.6Nb2.6Si9B9 nanocrystalline alloys studied by Lorentz microscopy. J. Magn. Magn. Mater. 2006, 305, 304–309. [Google Scholar] [CrossRef]
  26. Avramovic-Cingara, G.; Zweck, J.; Giallonardo, J.D.; Palumbo, G.; Erb, U. Magnetic domain structure in nanocrystalline nickel electrodeposits. J. Appl. Phys. 2018, 123, 234301. [Google Scholar] [CrossRef]
  27. Lee, H.; Lee, A.Y.; Kim, K.I.; Jeong, H.; Hong, S.A.; Kim, M.; Lee, K.; Kim, K.T. Nano-crystallization behavior and magnetic domain evolution in commercial Fe-Si-B metallic glass. J. Alloys Compd. 2021, 857, 157565. [Google Scholar] [CrossRef]
  28. Kobayashi, K.; Urushibata, K.; Kuno, T.; Suzuki, S.; Sakuma, N.; Shoji, T.; Kato, A. Determination of domain wall energy and critical single-domain particle size based on domain structure observations of ThMn12-type magnetic particles. J. Magn. Magn. Mater. 2020, 513, 167244. [Google Scholar] [CrossRef]
  29. Zhu, X.; Tang, X.; Pei, K.; Tian, Y.; Liu, J.; Xia, W.; Zhang, J.; Liu, J.P.; Chen, R.; Yan, A. Direct observation of magnetization reversal of hot-deformed Nd-Fe-B magnet. AIP Adv. 2018, 8, 015227. [Google Scholar] [CrossRef]
  30. Thomas, L.; Moriya, R.; Rettner, C.; Parkin, S.S. Dynamics of magnetic domain walls under their own inertia. Science 2010, 330, 1810–1813. [Google Scholar] [CrossRef]
  31. Zuo, S.; Zhang, M.; Li, R.; Zhang, Y.; Peng, L.; Xiong, J.; Liu, D.; Zhao, T.; Hu, F.; Shen, B.; et al. In situ observation of magnetic vortex manipulation by external fields in amorphous CeFeB ribbon. Acta Mater. 2017, 140, 465–471. [Google Scholar] [CrossRef]
  32. Sharma, P.; Zhang, X.; Zhang, Y.; Makino, A. Competition driven nanocrystallization in high Bs and low core loss Fe-Si-B-P-Cu soft magnetic alloys. Scr. Mater. 2015, 95, 3–6. [Google Scholar] [CrossRef]
  33. Hono, K.; Ping, D.H.; Ohnuma, M.; Onodera, H. Cu clustering and Si partitioning in the early crystallization stage of an Fe73.5Si13.5B9Nb3Cu1 amorphous alloy. Acta Mater. 1999, 47, 997–1006. [Google Scholar] [CrossRef]
Figure 1. (a) SEM image, (b) XRD pattern, (c) DSC curve, and (d) hysteresis loop of gas-atomized Fe74.75Si8B10P3C2Nb1.5Cu0.75 powder.
Metals 12 00845 g001
Figure 2. (a,b) Cross-section morphology and (c) corresponding main elements distribution lines of a selected powder inside the Fe74.75Si8B10P3C2Nb1.5Cu0.75 NPCs.
Metals 12 00845 g002
Figure 3. (a) μe, (b) Pcv, (c) histogram of Pcv, and (d) Hc change curve of Fe74.75Si8B10P3C2Nb1.5Cu0.75 NPCs annealed at different HR and the same HT of 60 min.
Metals 12 00845 g003
Figure 4. (ac) TEM images and SAED patterns, (df) corresponding high-resolution TEM images, and (g) grain size distribution of Fe74.75Si8B10P3C2Nb1.5Cu0.75 NPCs annealed at different HR.
Metals 12 00845 g004
Figure 5. (a) μe, (b) Pcv, (c) histogram of Pcv, and (d) Hc change curve of Fe74.75Si8B10P3C2Nb1.5Cu0.75 NPCs annealed for different HT.
Metals 12 00845 g005
Figure 6. (a,b) TEM images and SAED patterns and (c) grain size distribution of Fe74.75Si8B10P3C2Nb1.5Cu0.75 NPCs annealed for different HT.
Metals 12 00845 g006
Figure 7. XRD patterns of Fe74.75Si8B10P3C2Nb1.5Cu0.75 NPCs annealed for different HT.
Metals 12 00845 g007
Figure 8. LTEM images of Fe74.75Si8B10P3C2Nb1.5Cu0.75 NPCs annealed under different conditions: (a,d) in focus, (b,e) overfocused, and (c,f) under-focused.
Metals 12 00845 g008
Figure 9. LTEM images for the field dependence of domain wall evolution in Fe74.75Si8B10P3C2Nb1.5Cu0.75 NPCs annealed under different conditions: (a,b) 40 K/min, 60 min; (c,d) 100 K/min, 30 min.
Metals 12 00845 g009
Figure 10. Schematic of the crystallization behavior of Fe74.75Si8B10P3C2Nb1.5Cu0.75 NPCs.
Metals 12 00845 g010
Publisher’s Note: MDPI stays neutral with regard to jurisdictional claims in published maps and institutional affiliations.

