
Numerical and Experimental Study on Hot Forming by Partition Cooling of 38MnB5Nb

 ,
, 
Abstract
:1. Introduction
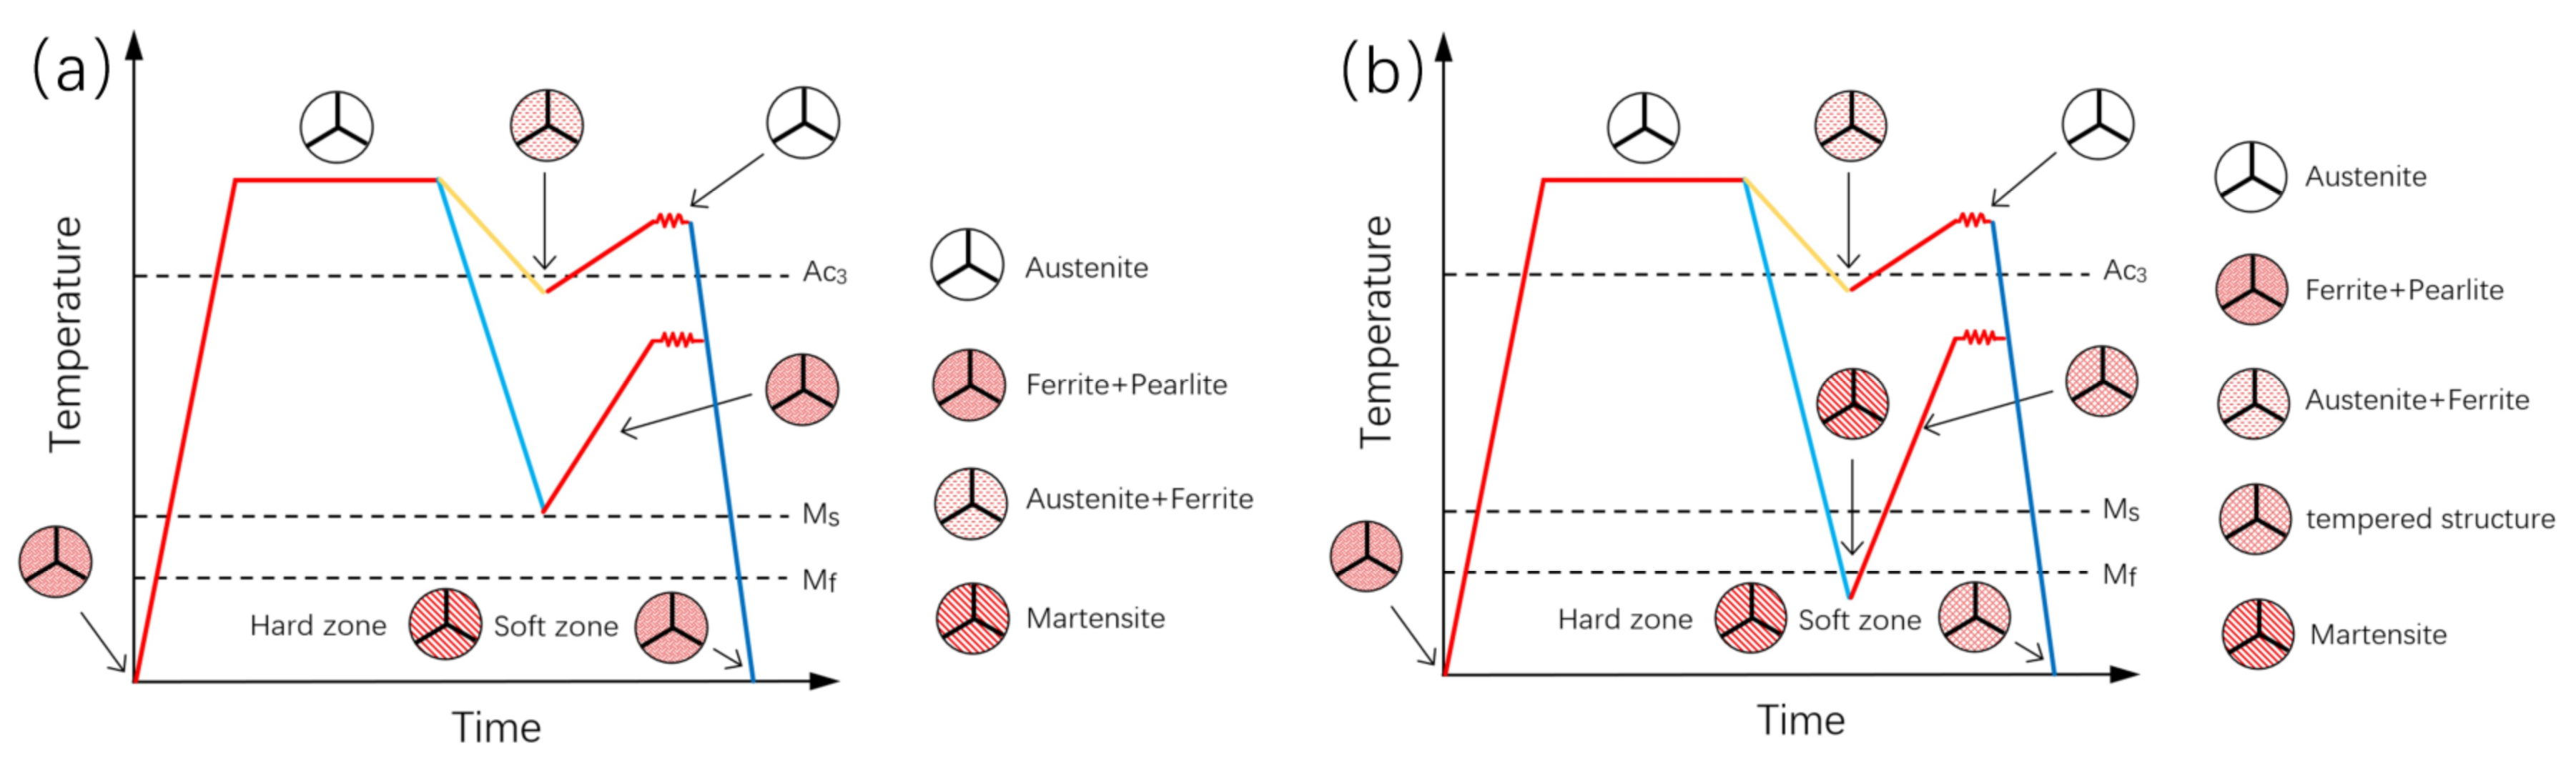
2. Tailored Properties Hot Forming
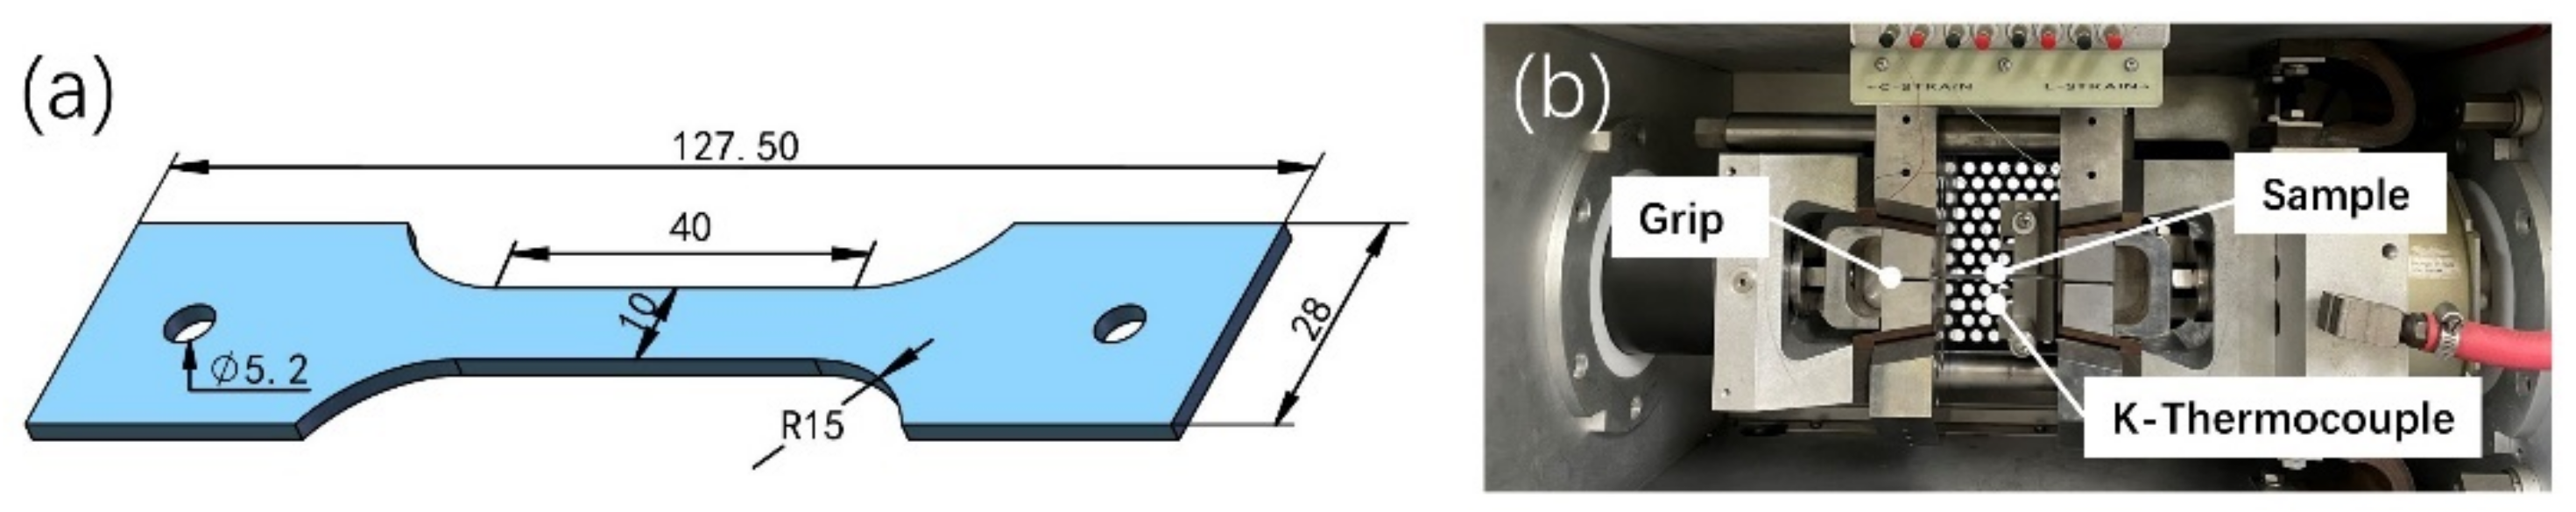
3. Material and Specimen
4. Elevated-Temperature Tension Testing
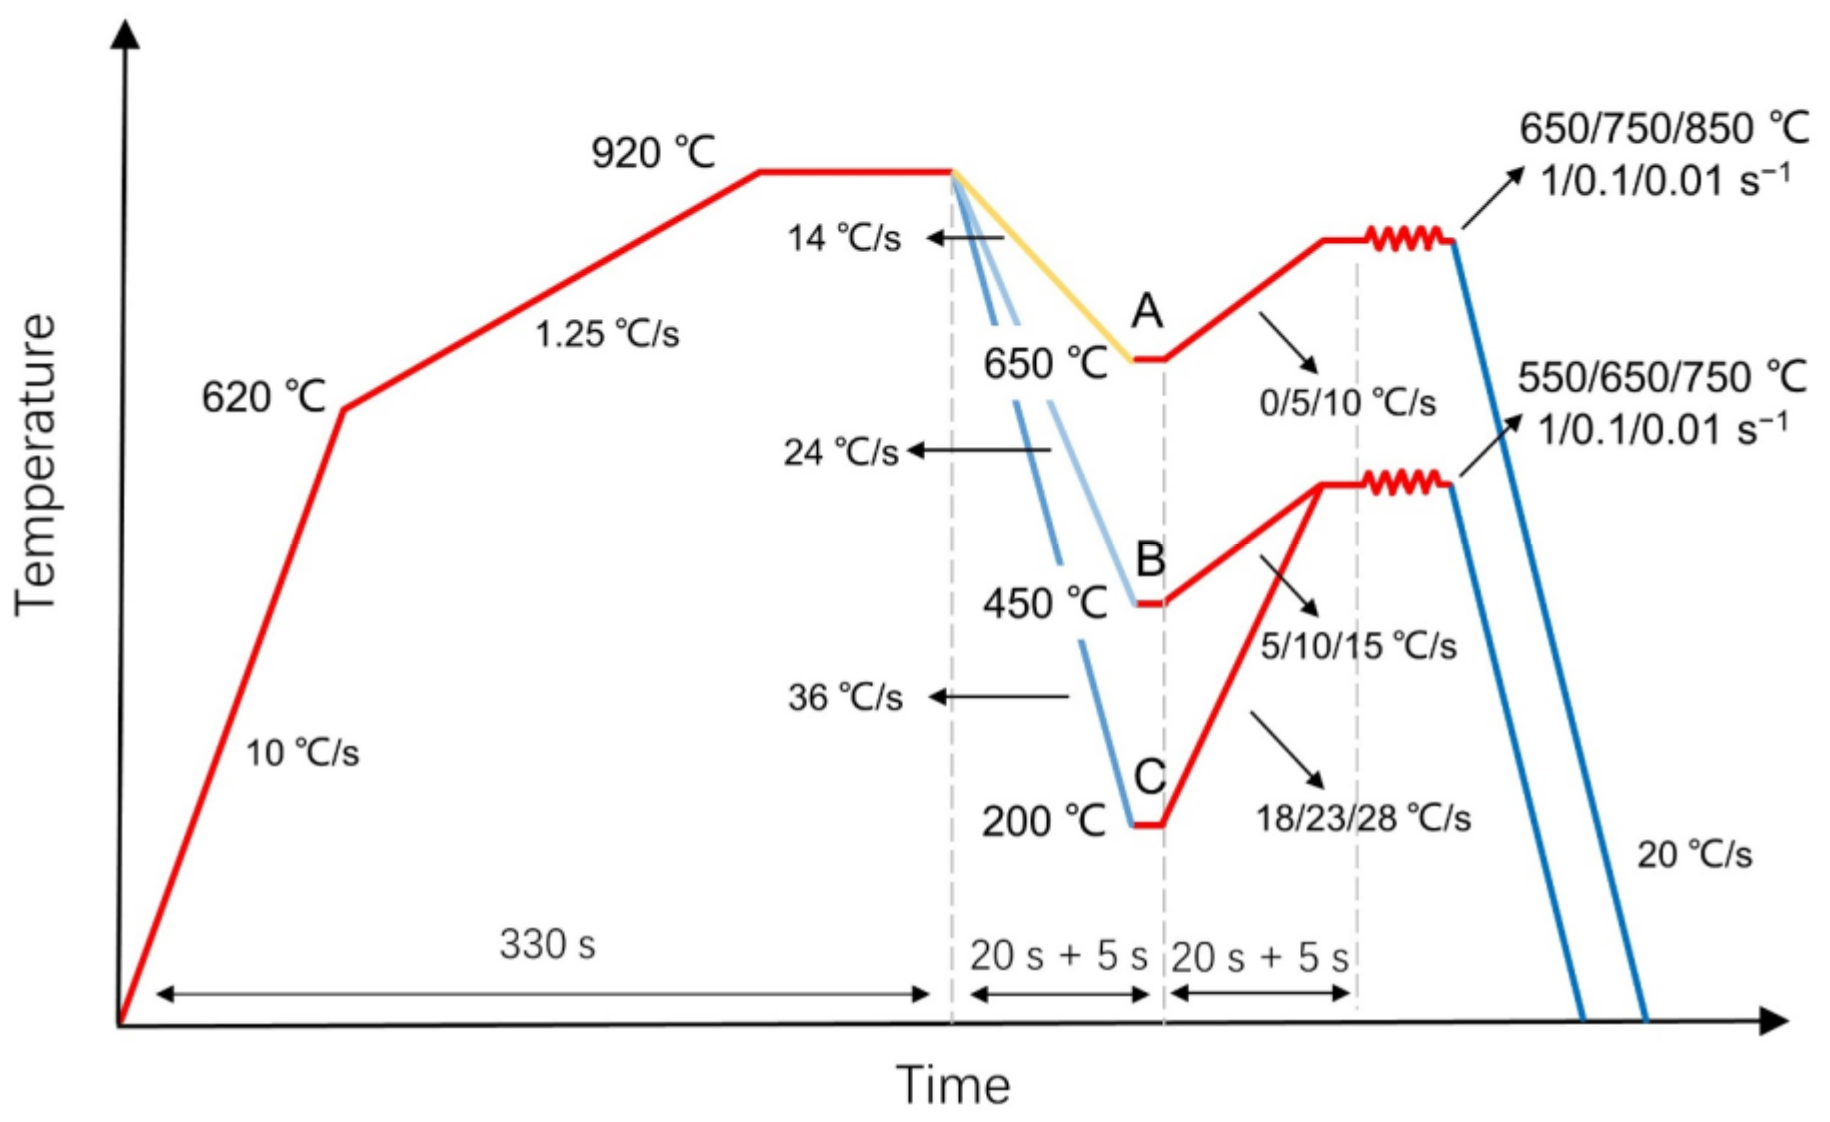
4.1. Testing Procedure
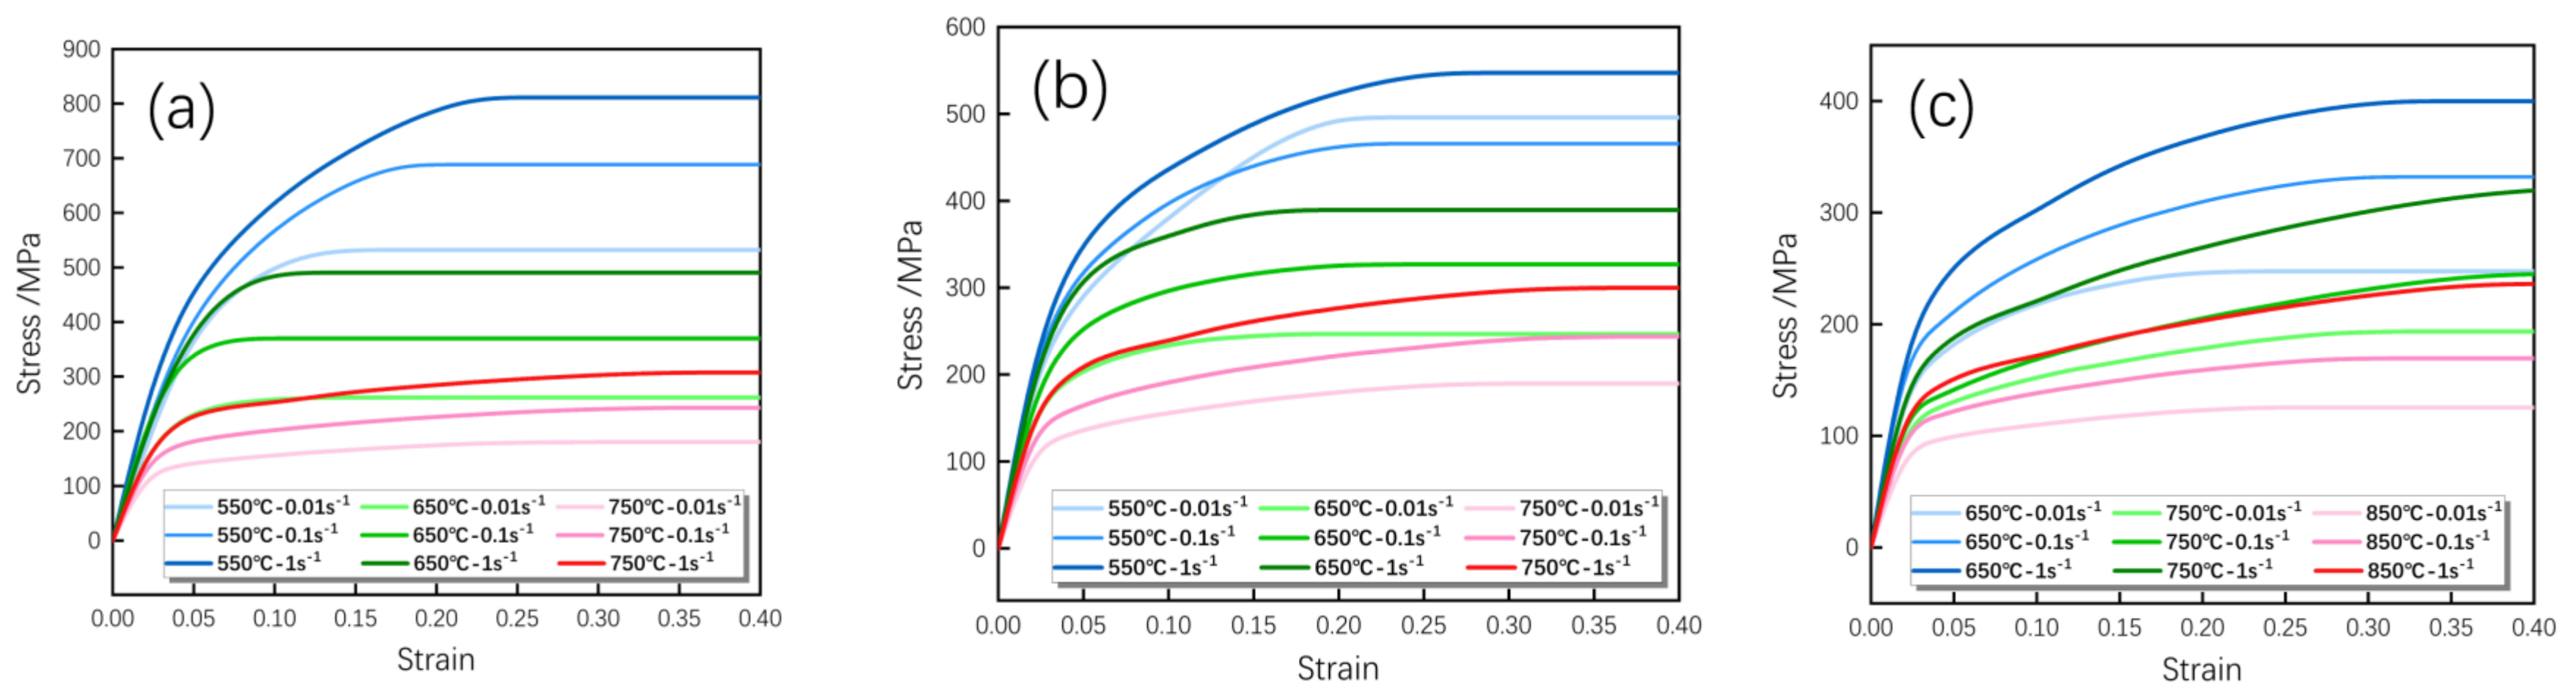
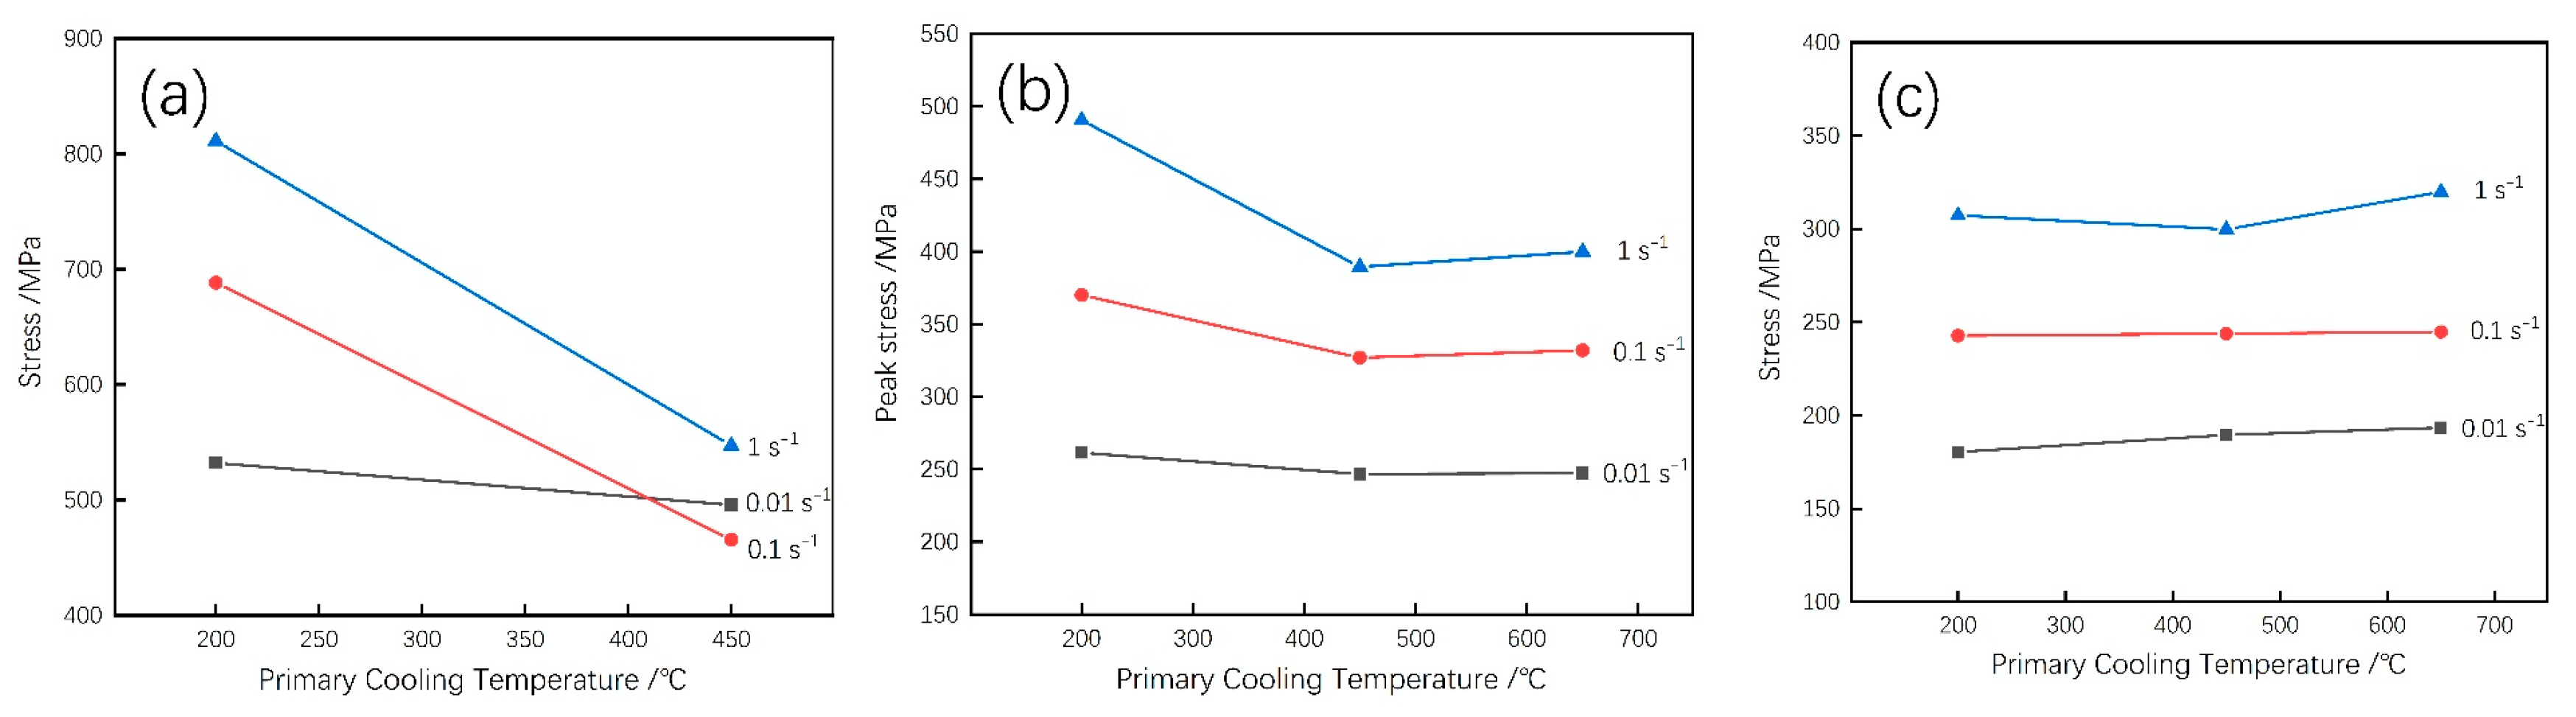
4.2. Flow Behavior
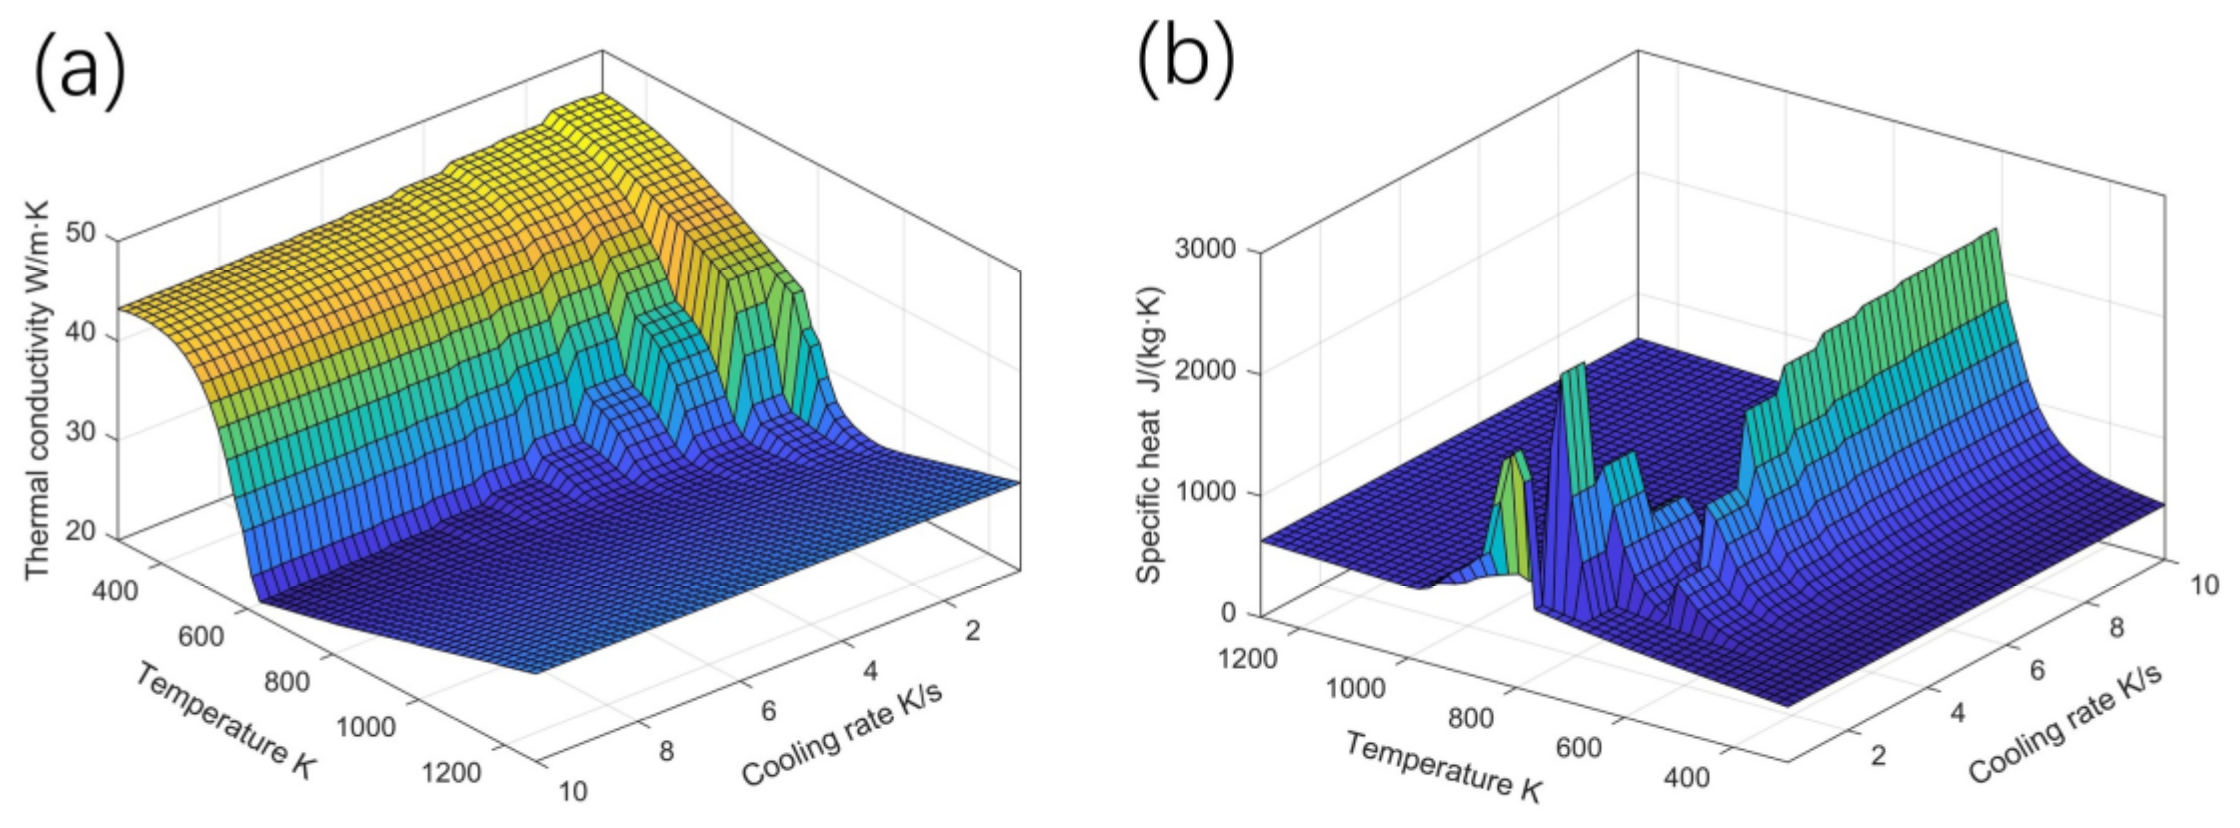
5. Primary Cooling Temperature Coupled Constitutive Model
5.1. Establishment of a Constitutive Model
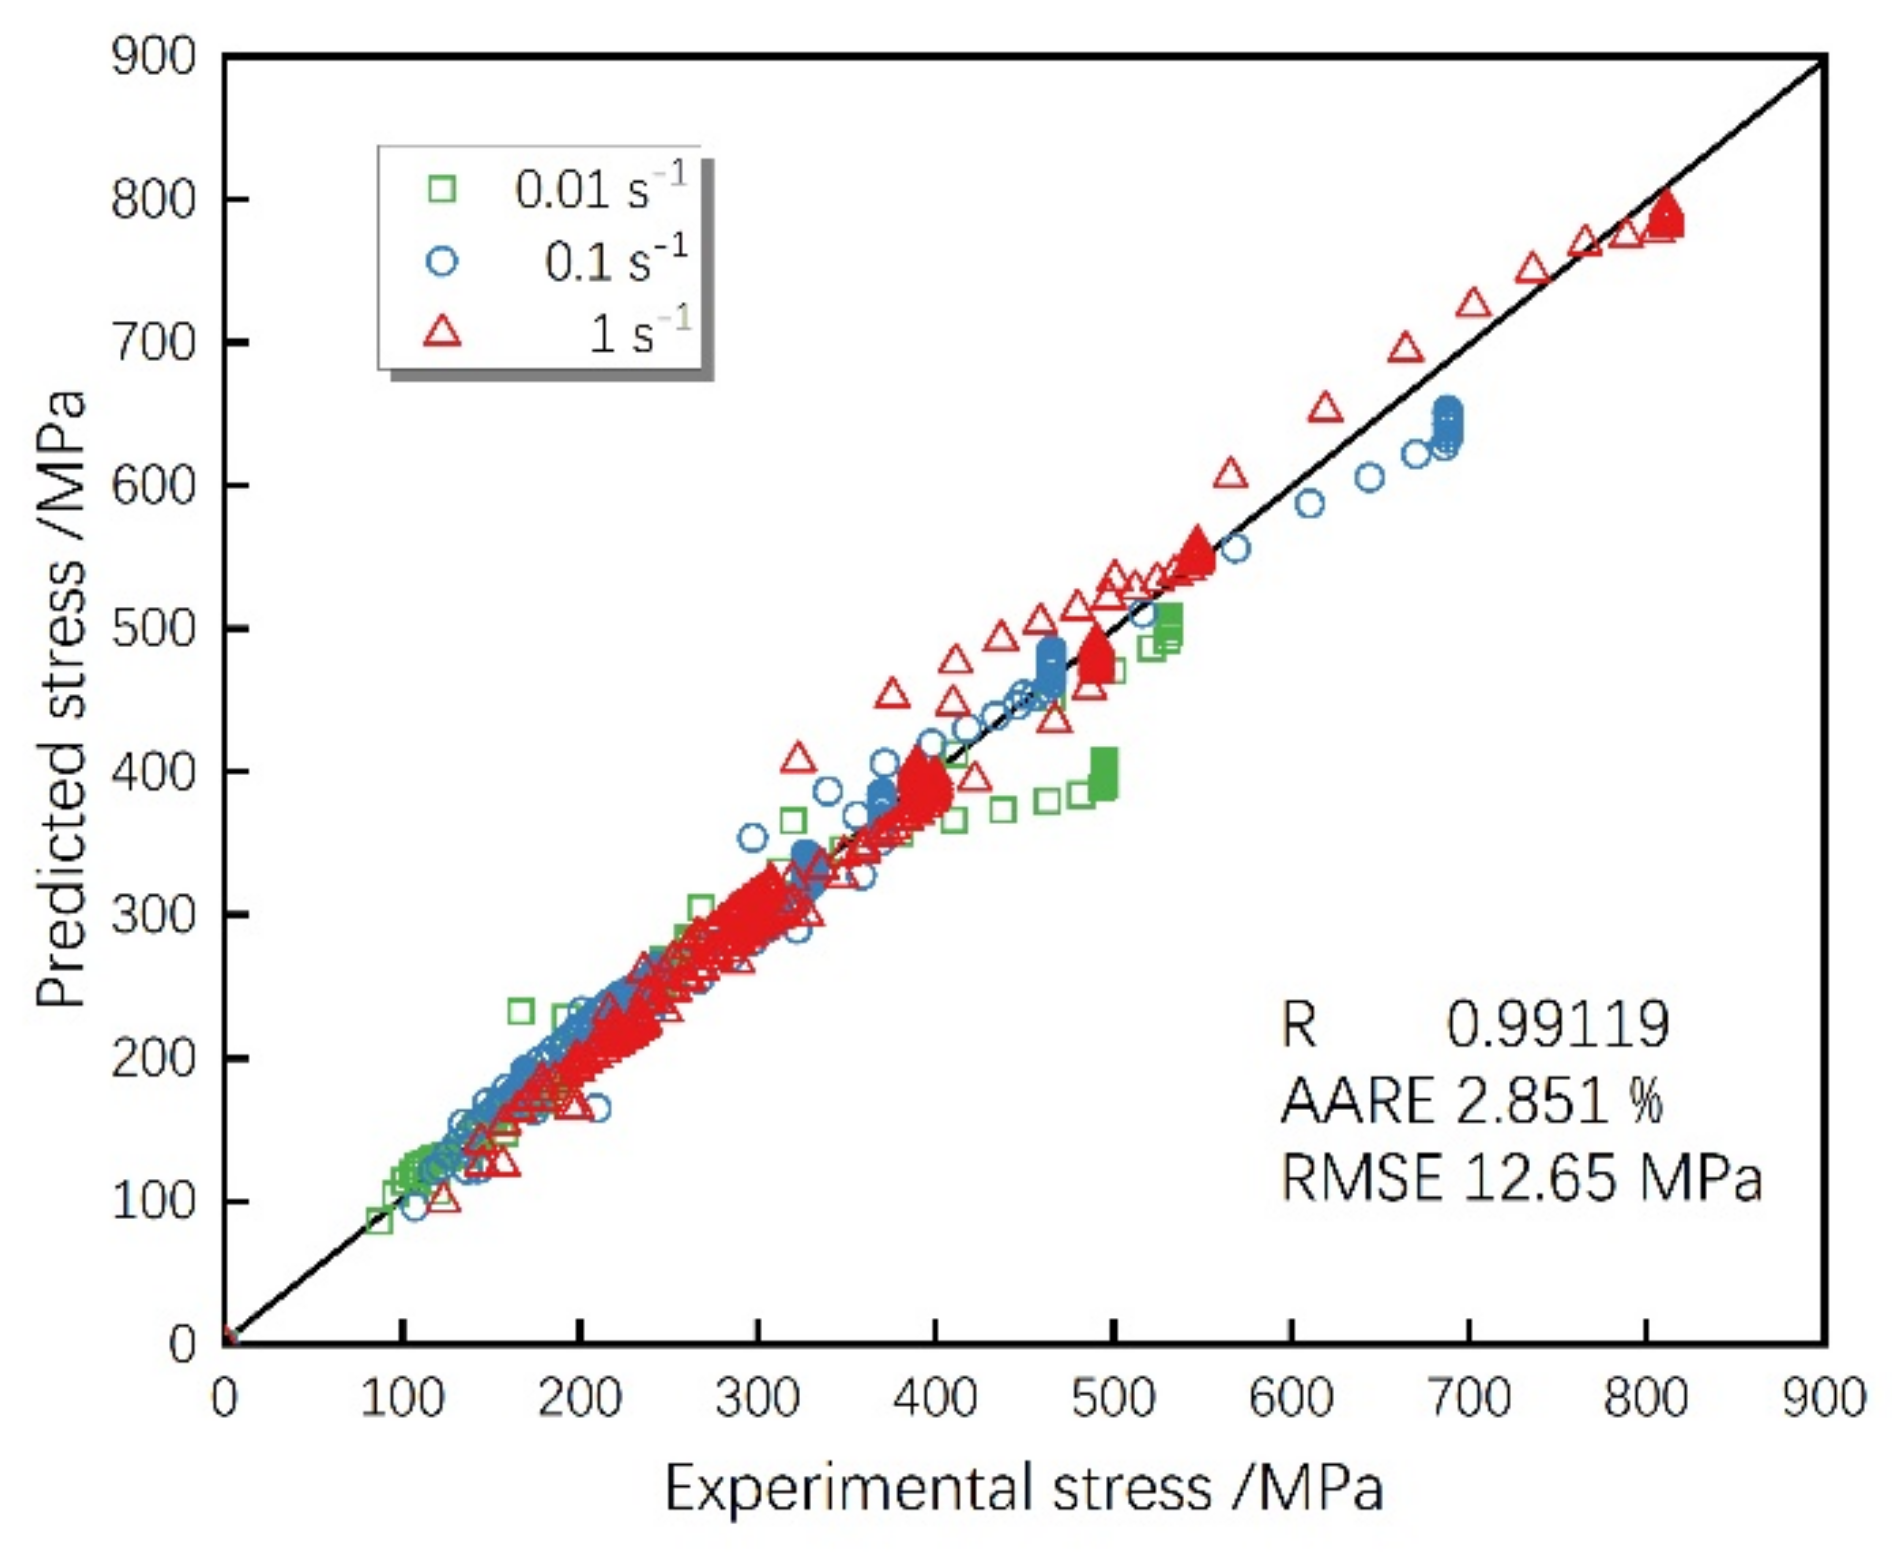
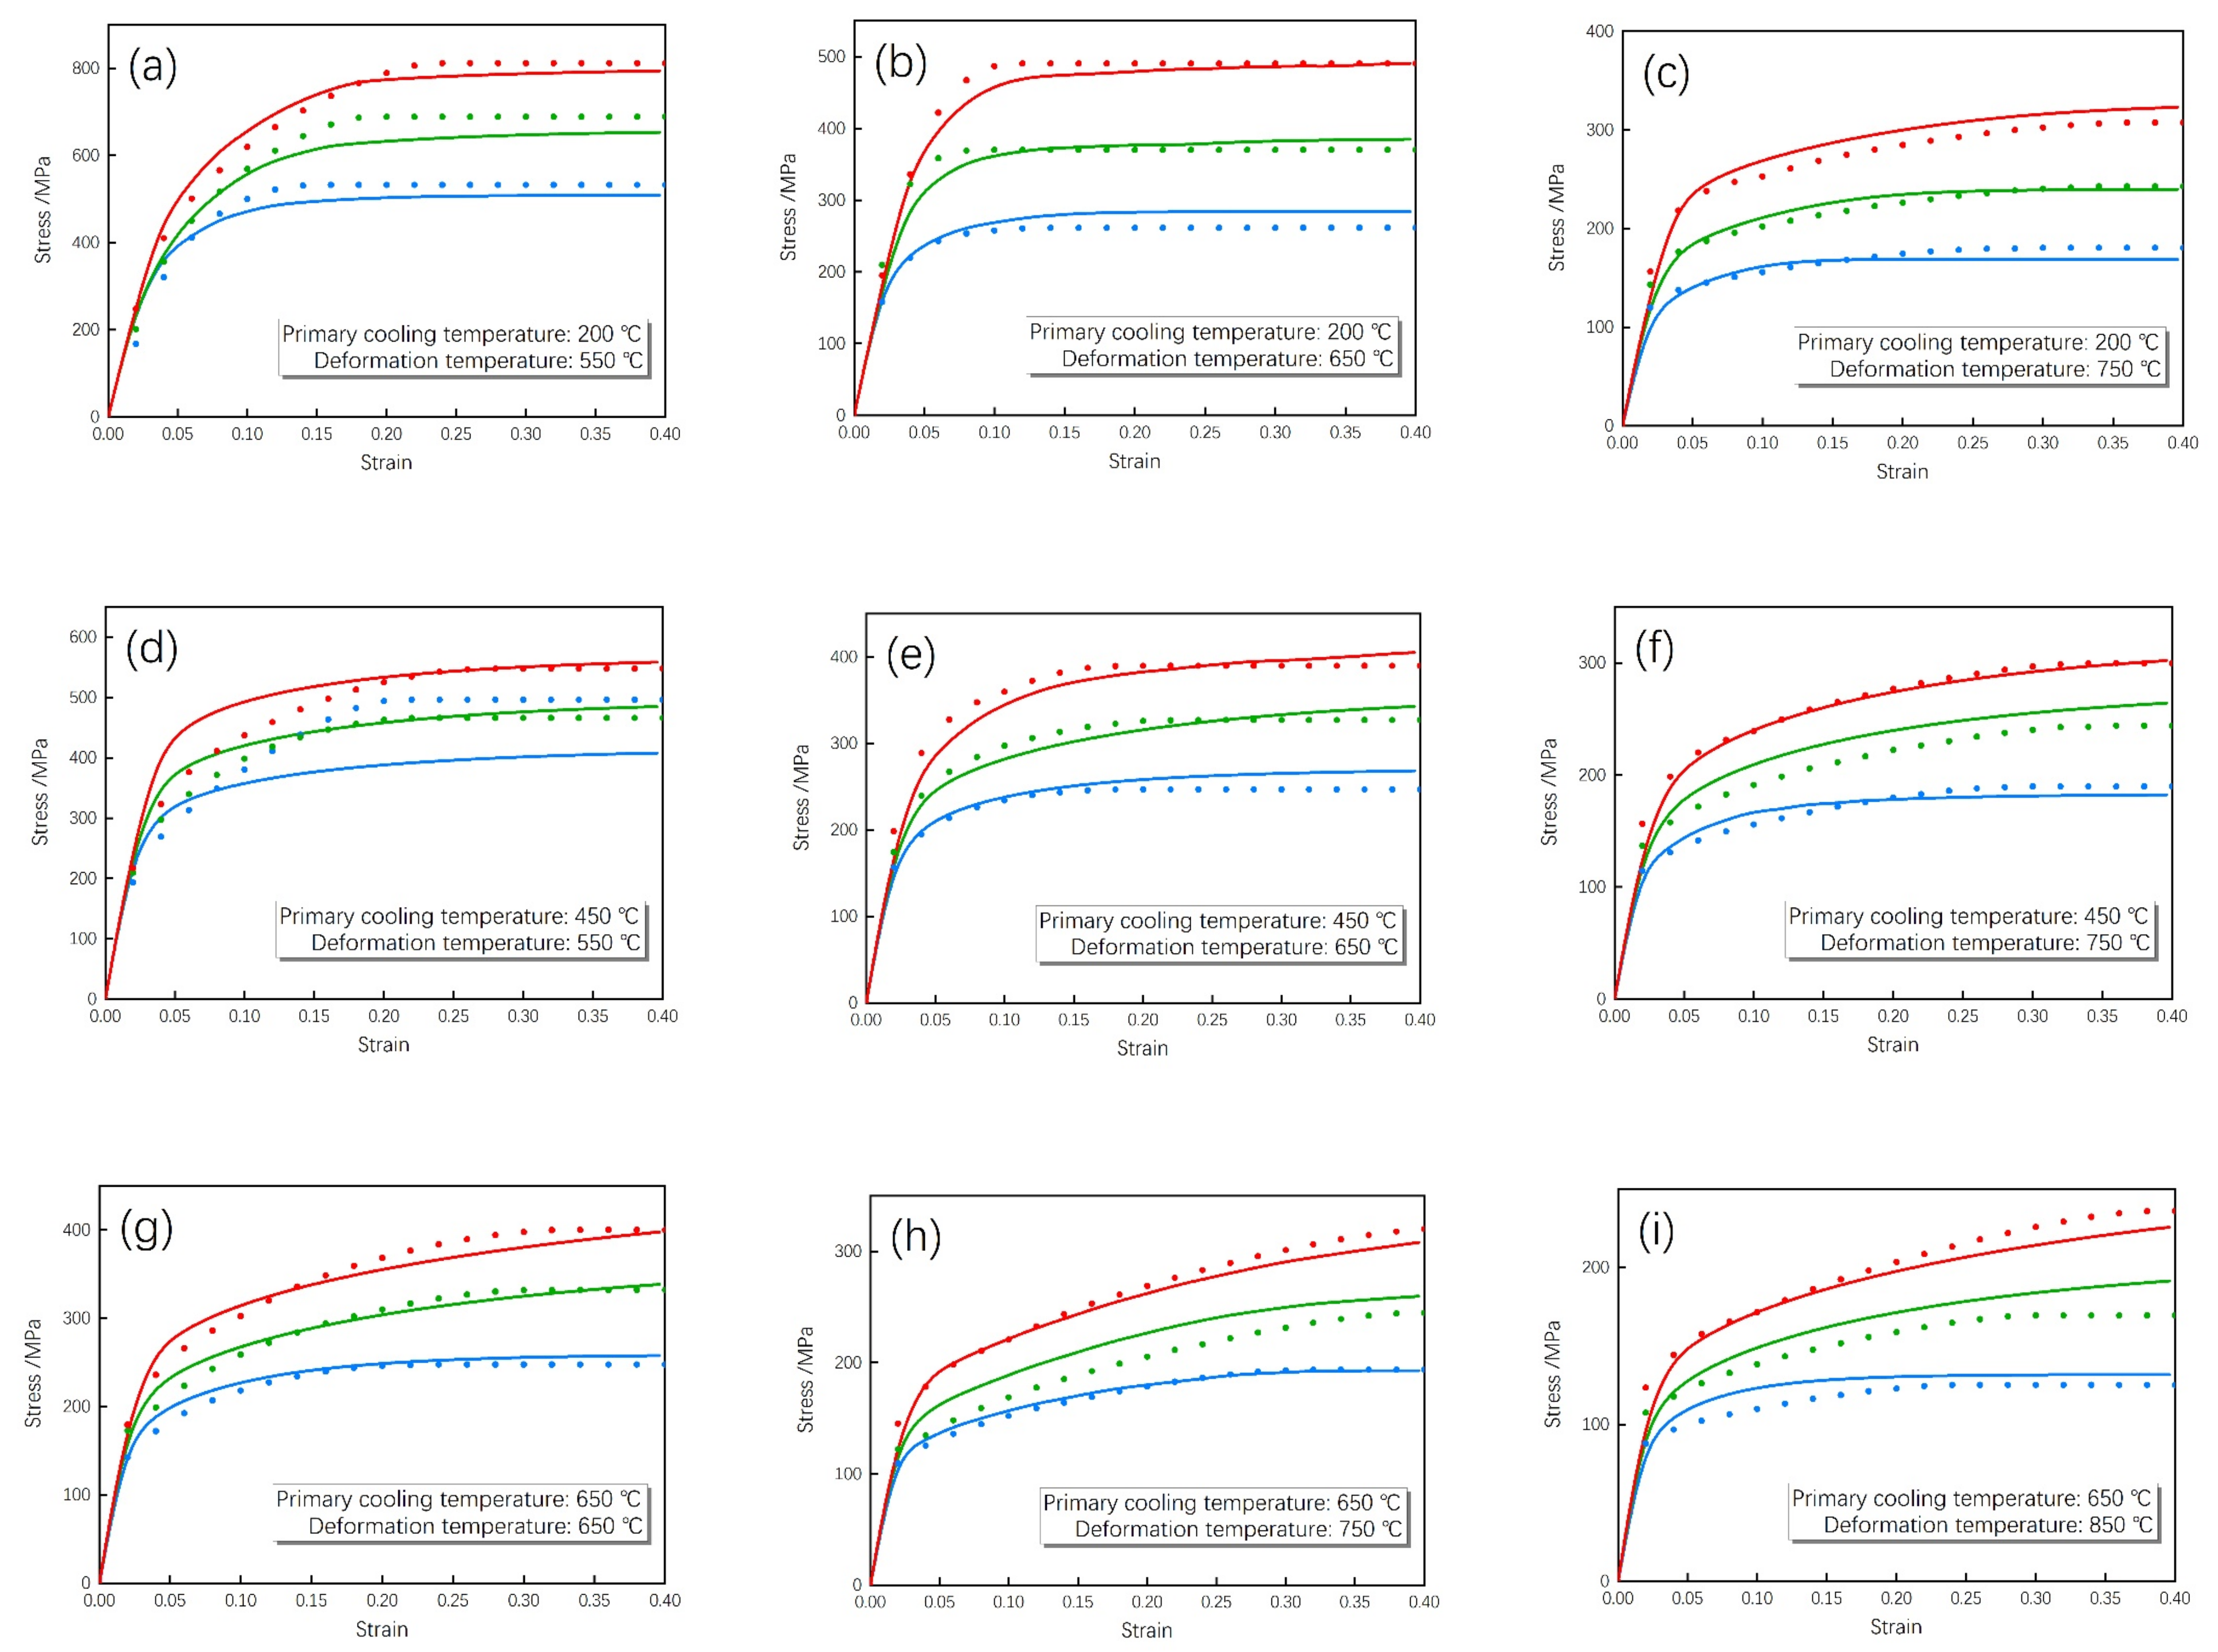
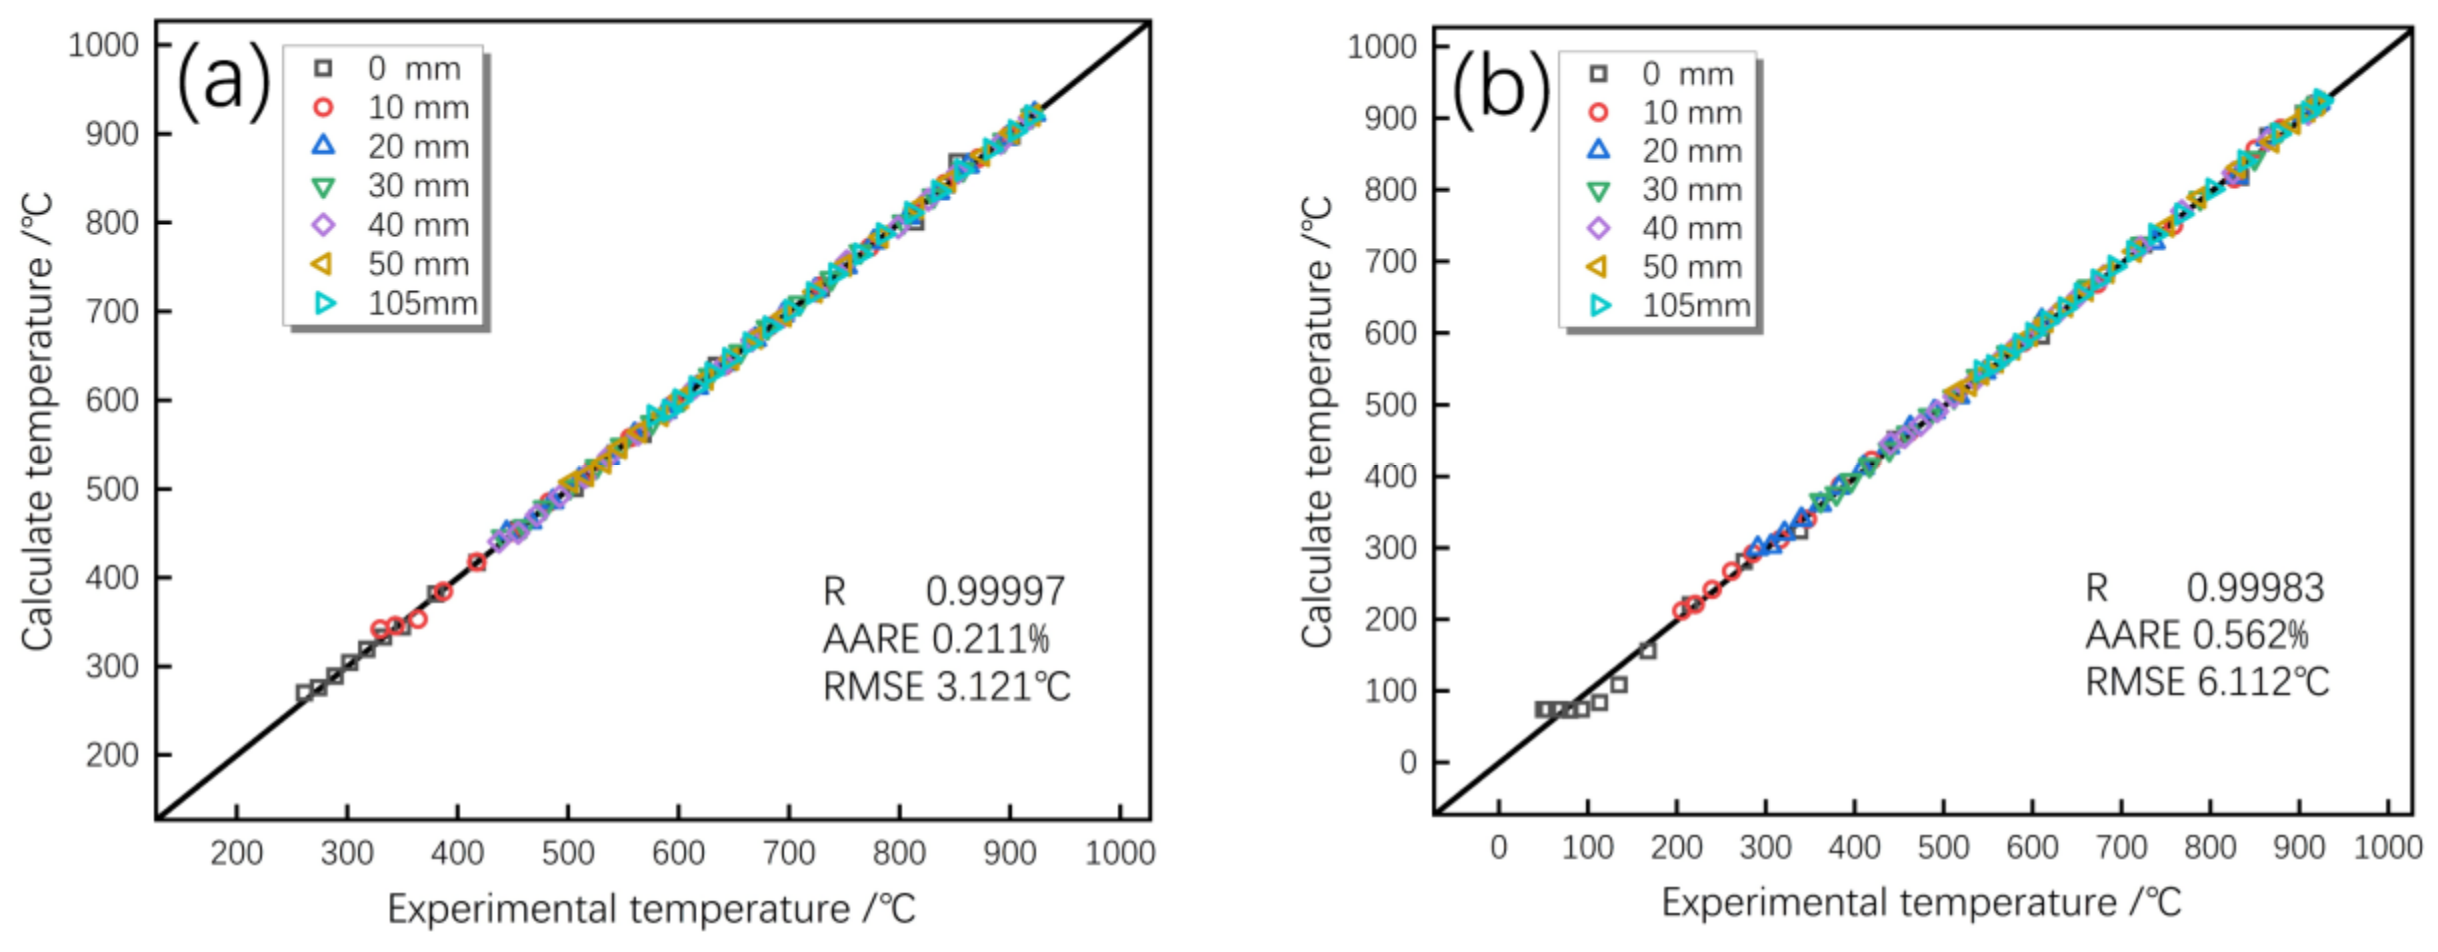
5.2. Calibration and Verification of the Constitutive Model
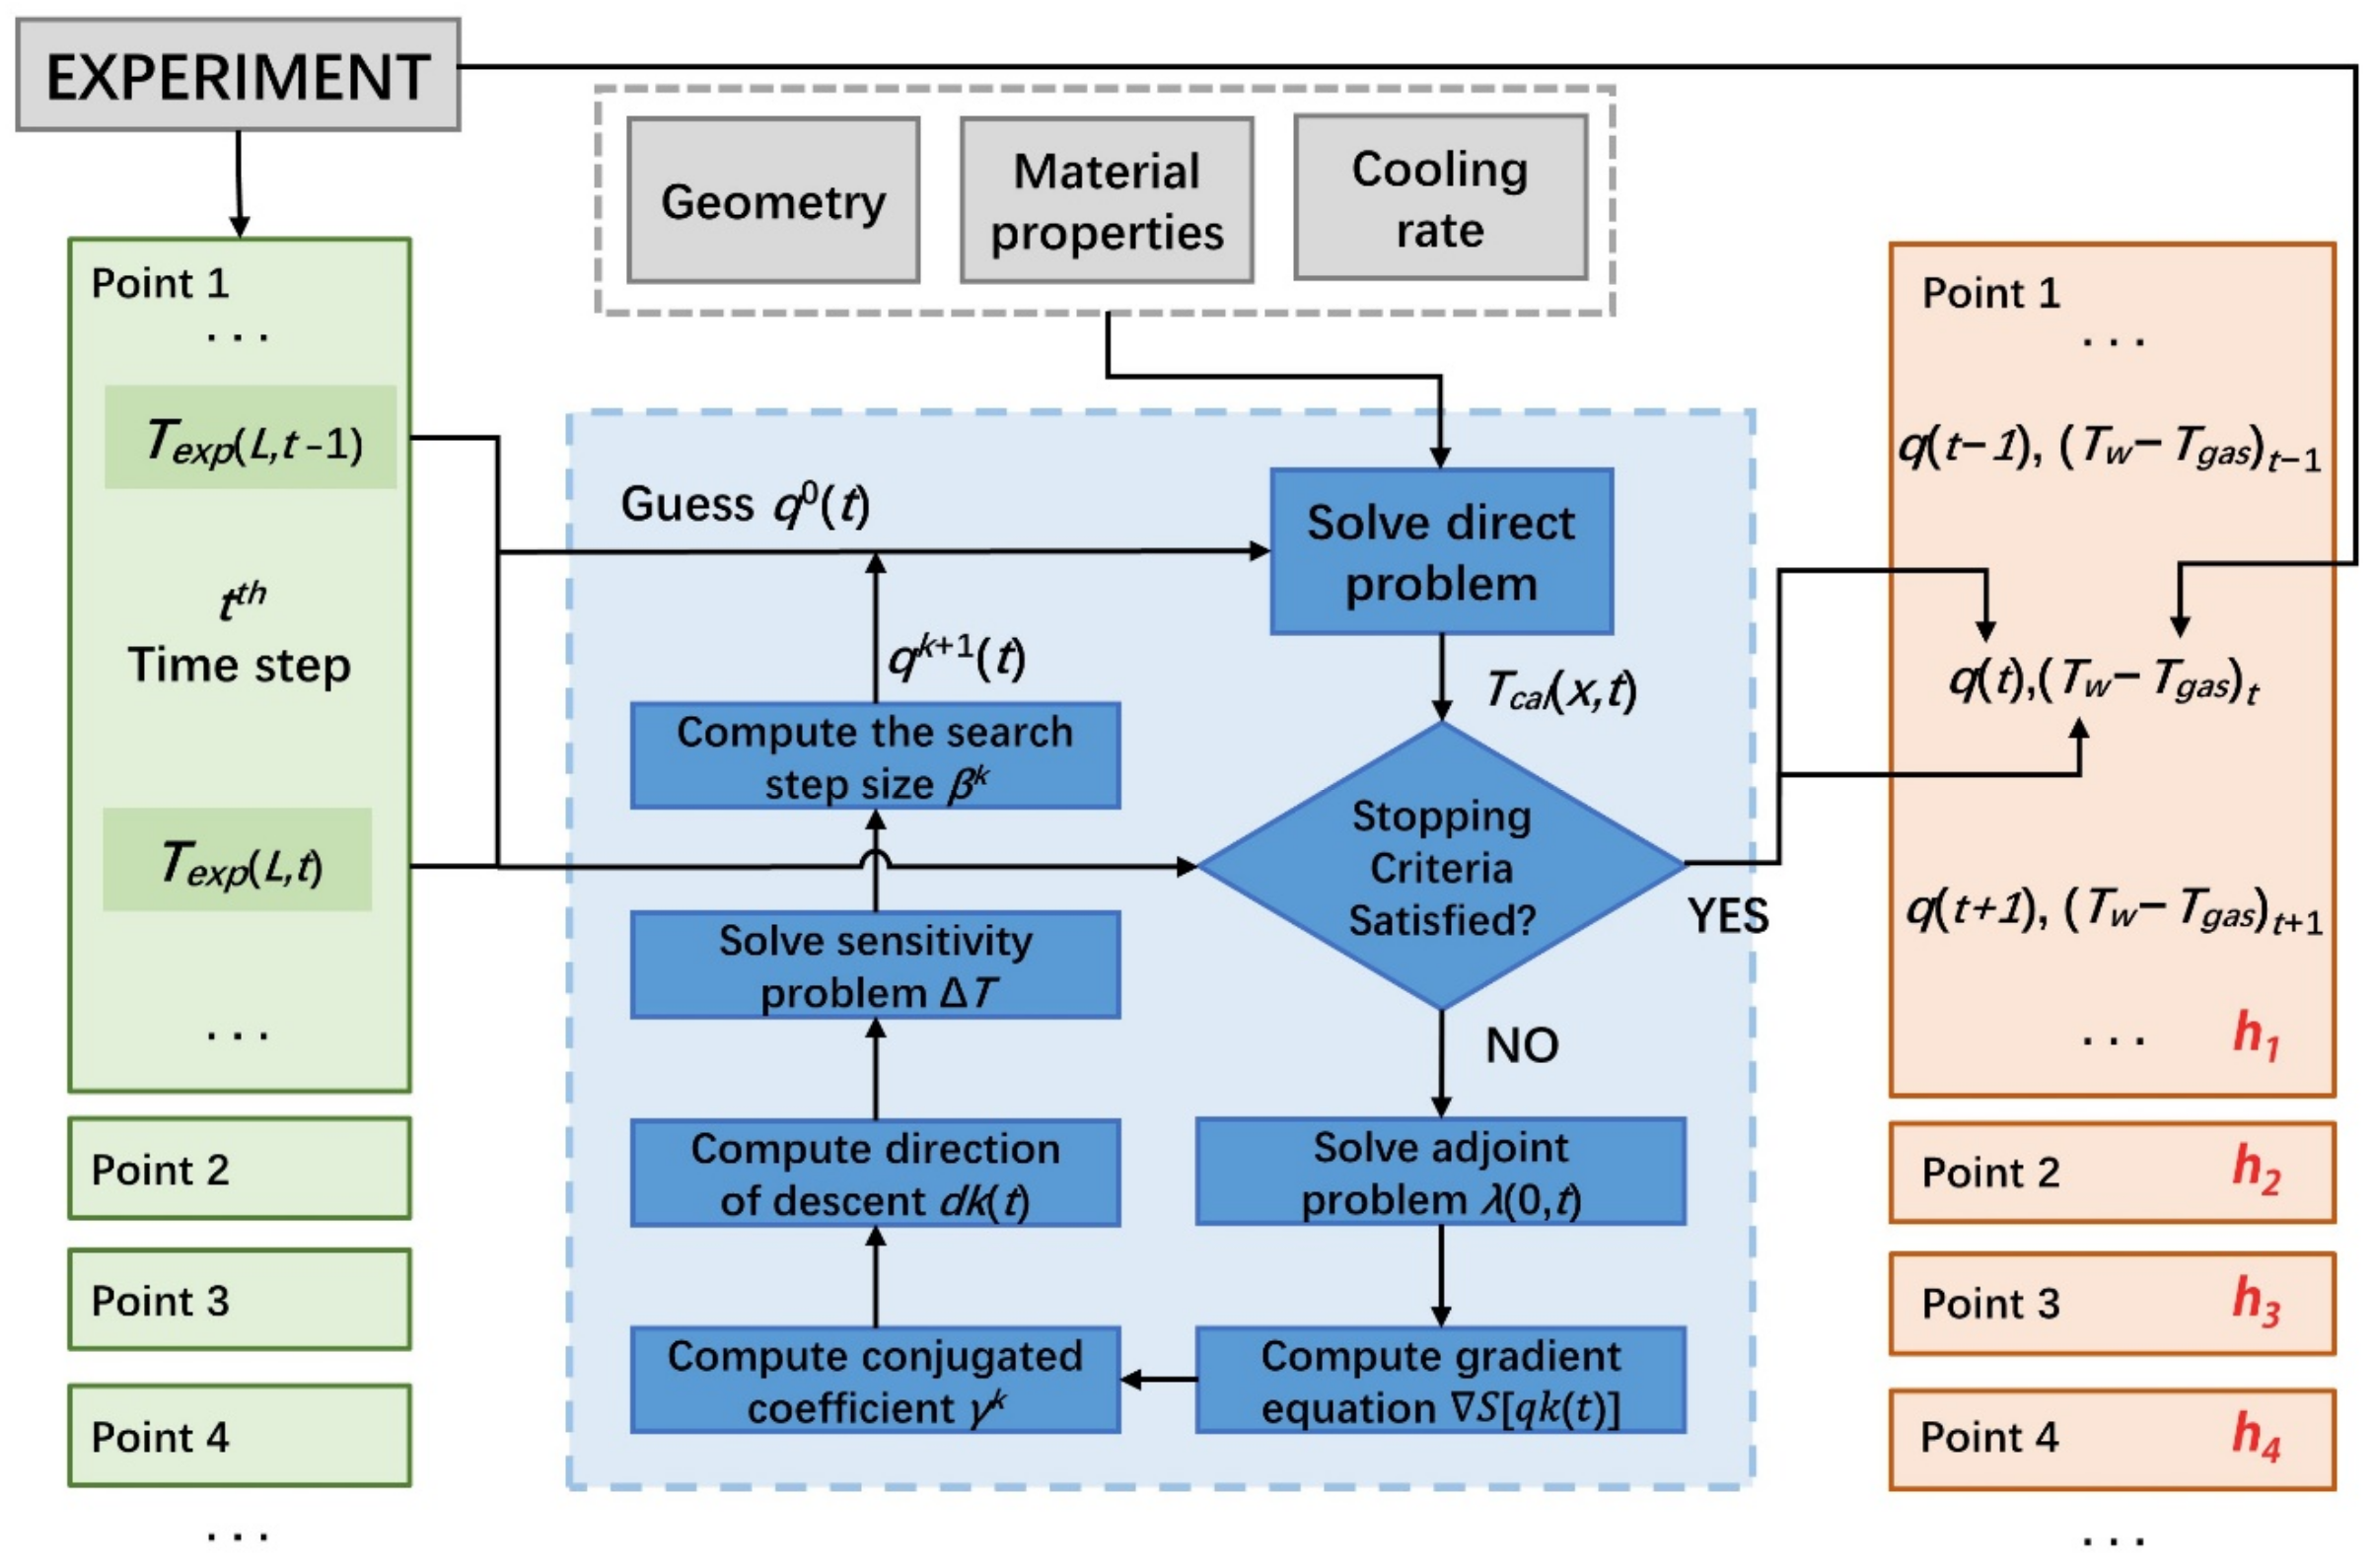
6. Interfacial Heat Transfer Coefficient
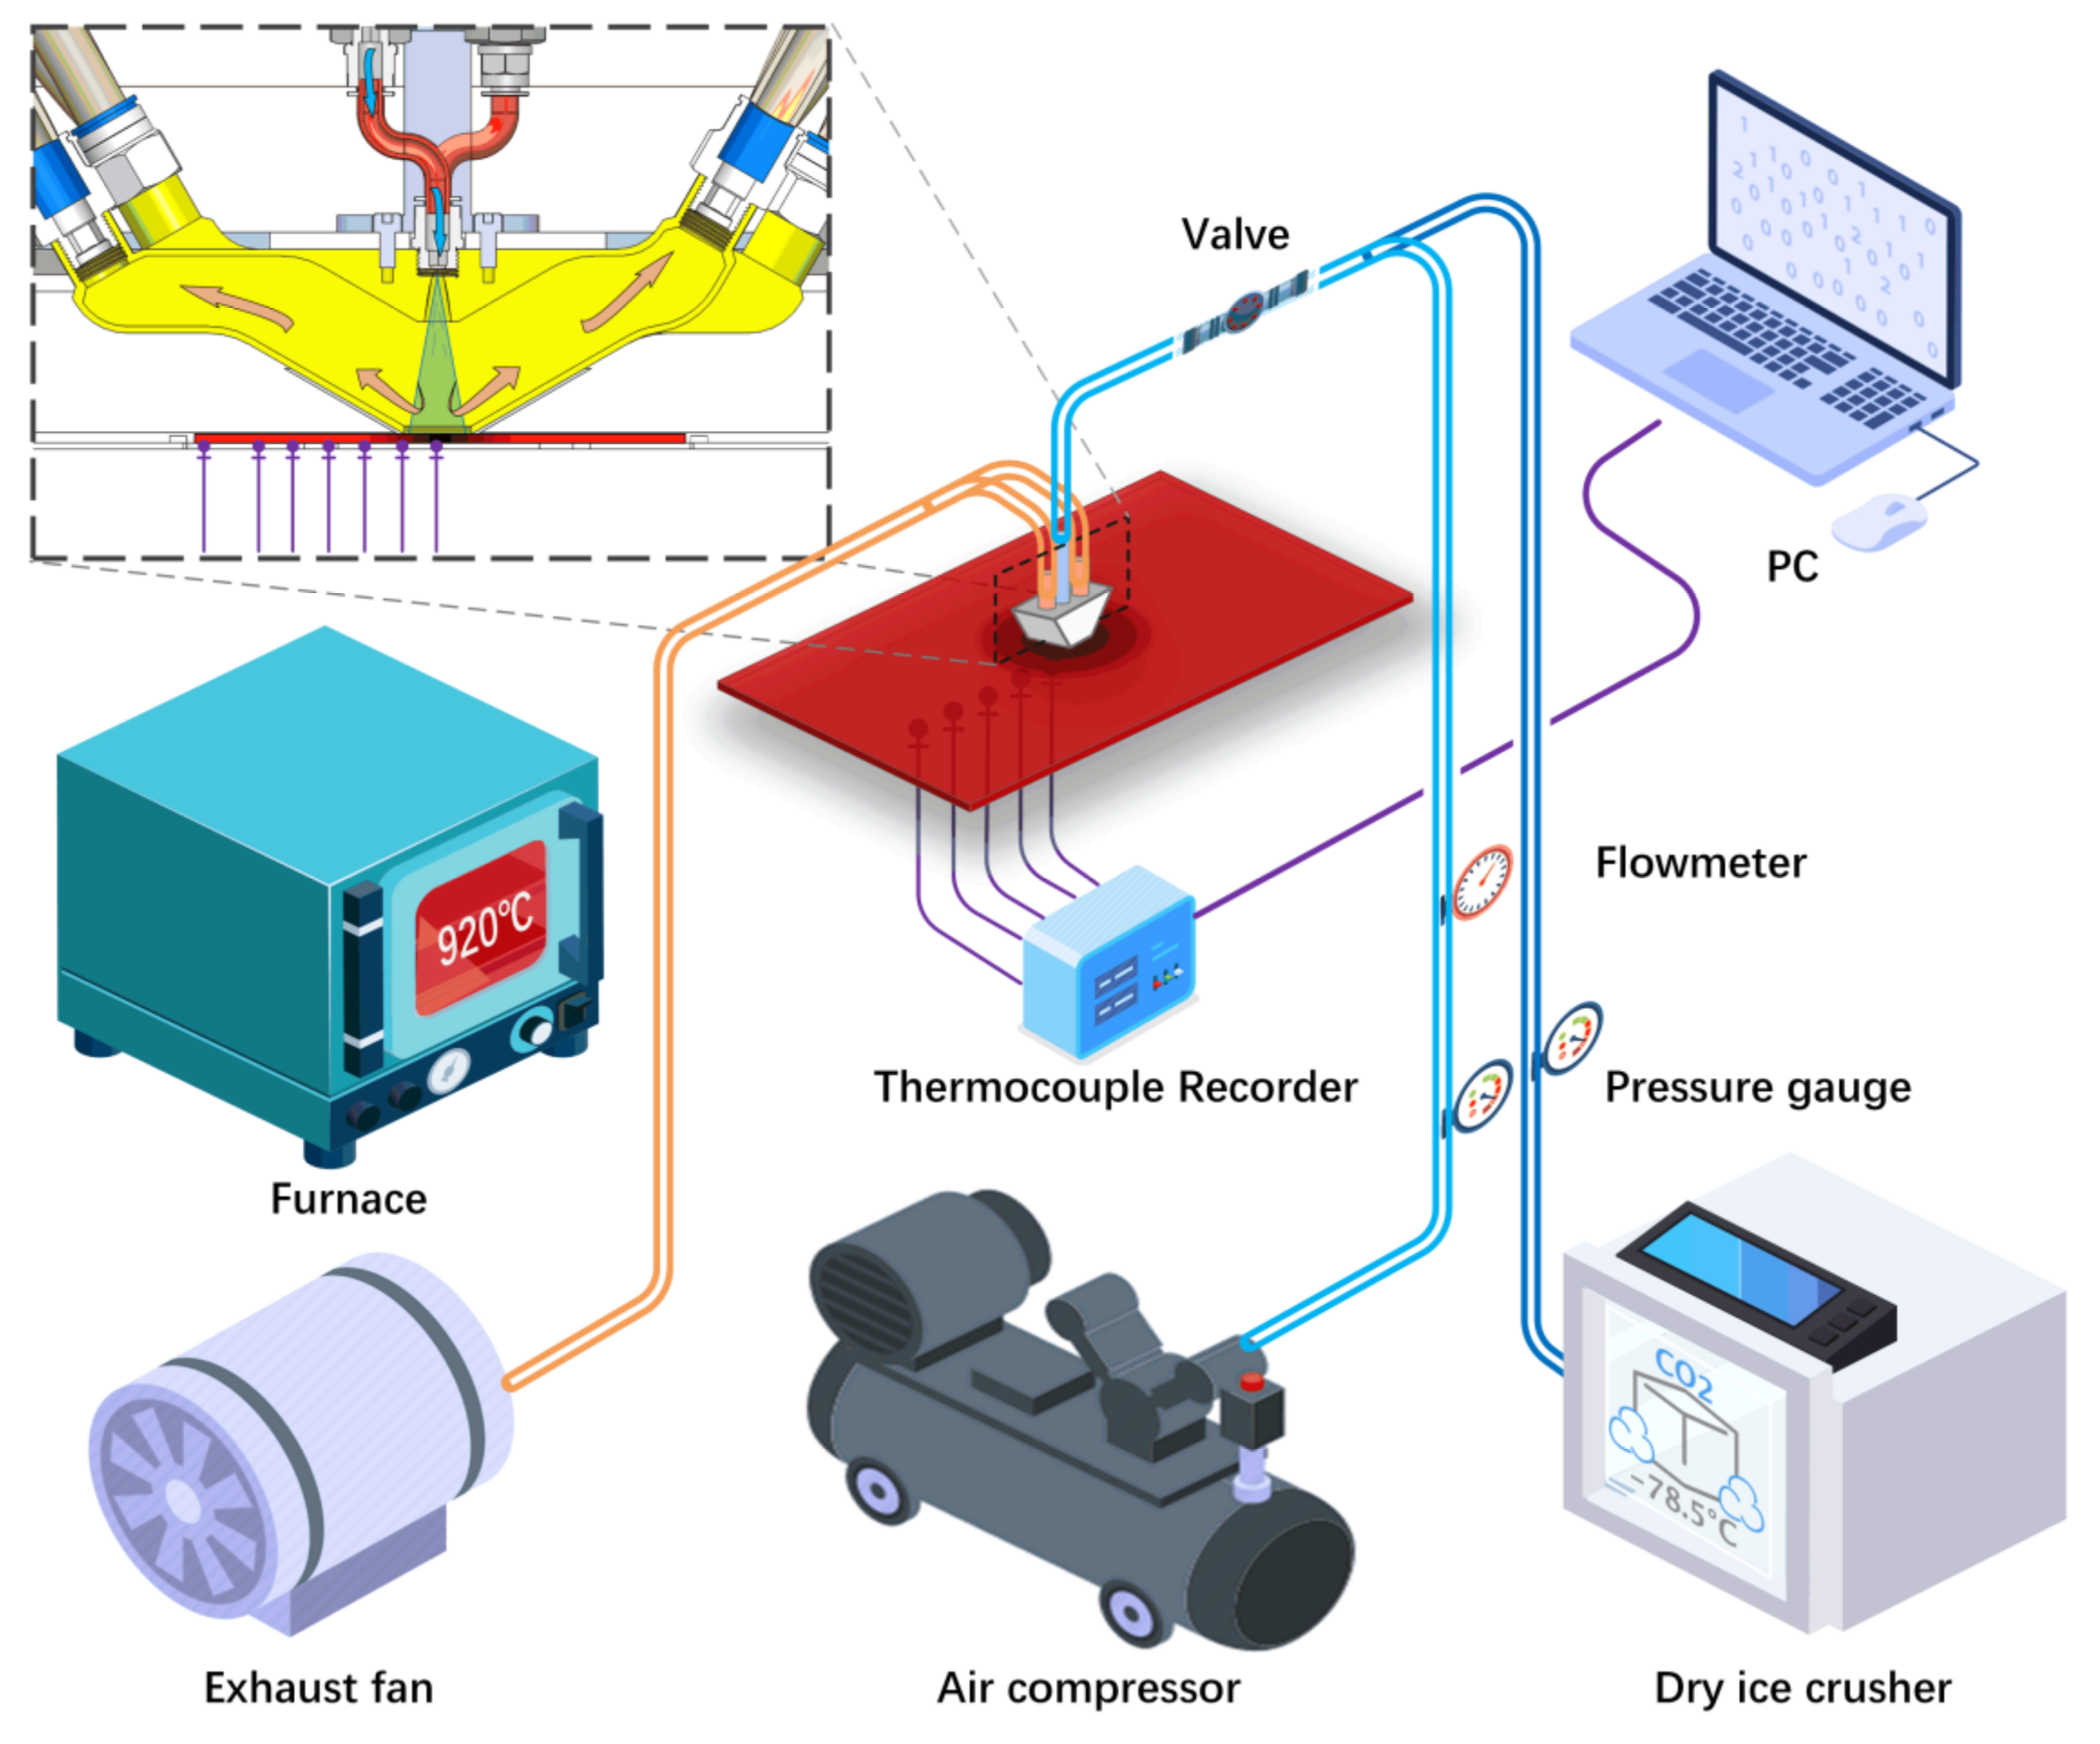
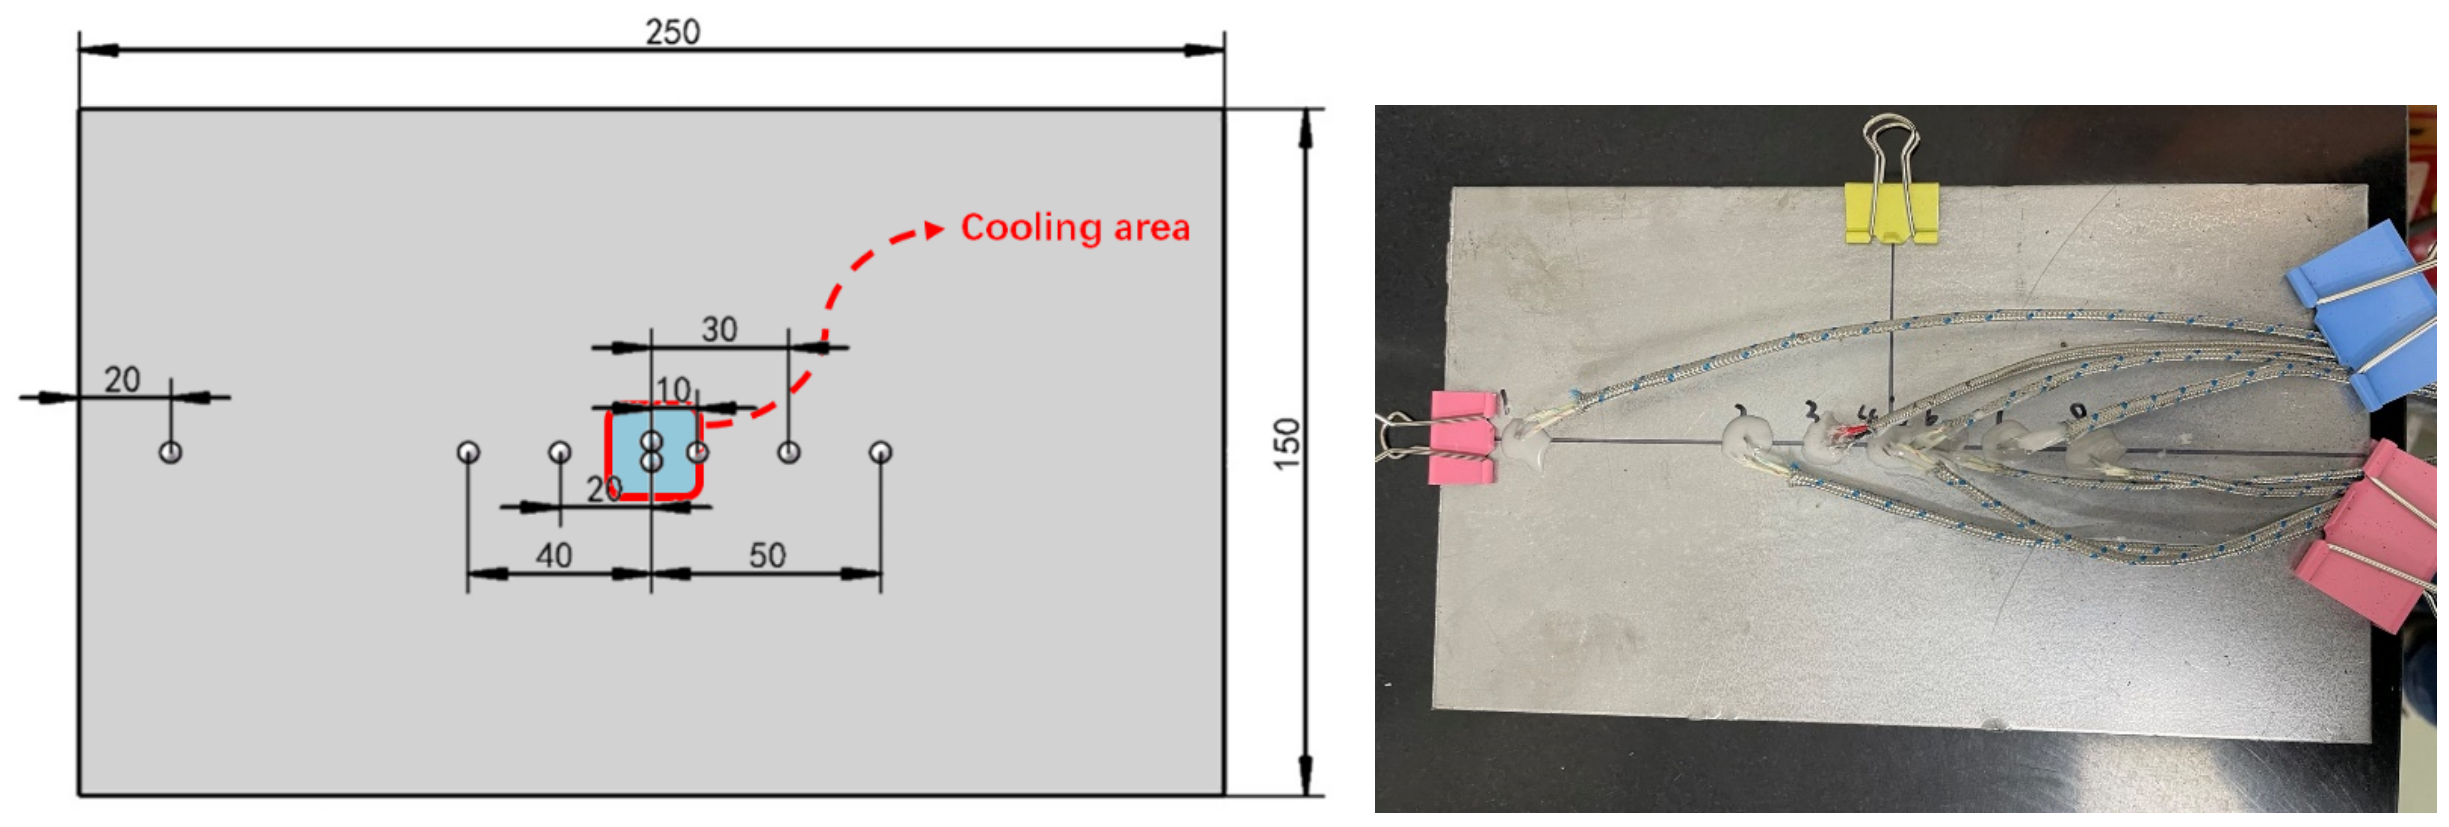
6.1. Experiment with Single-Nozzle Cooling
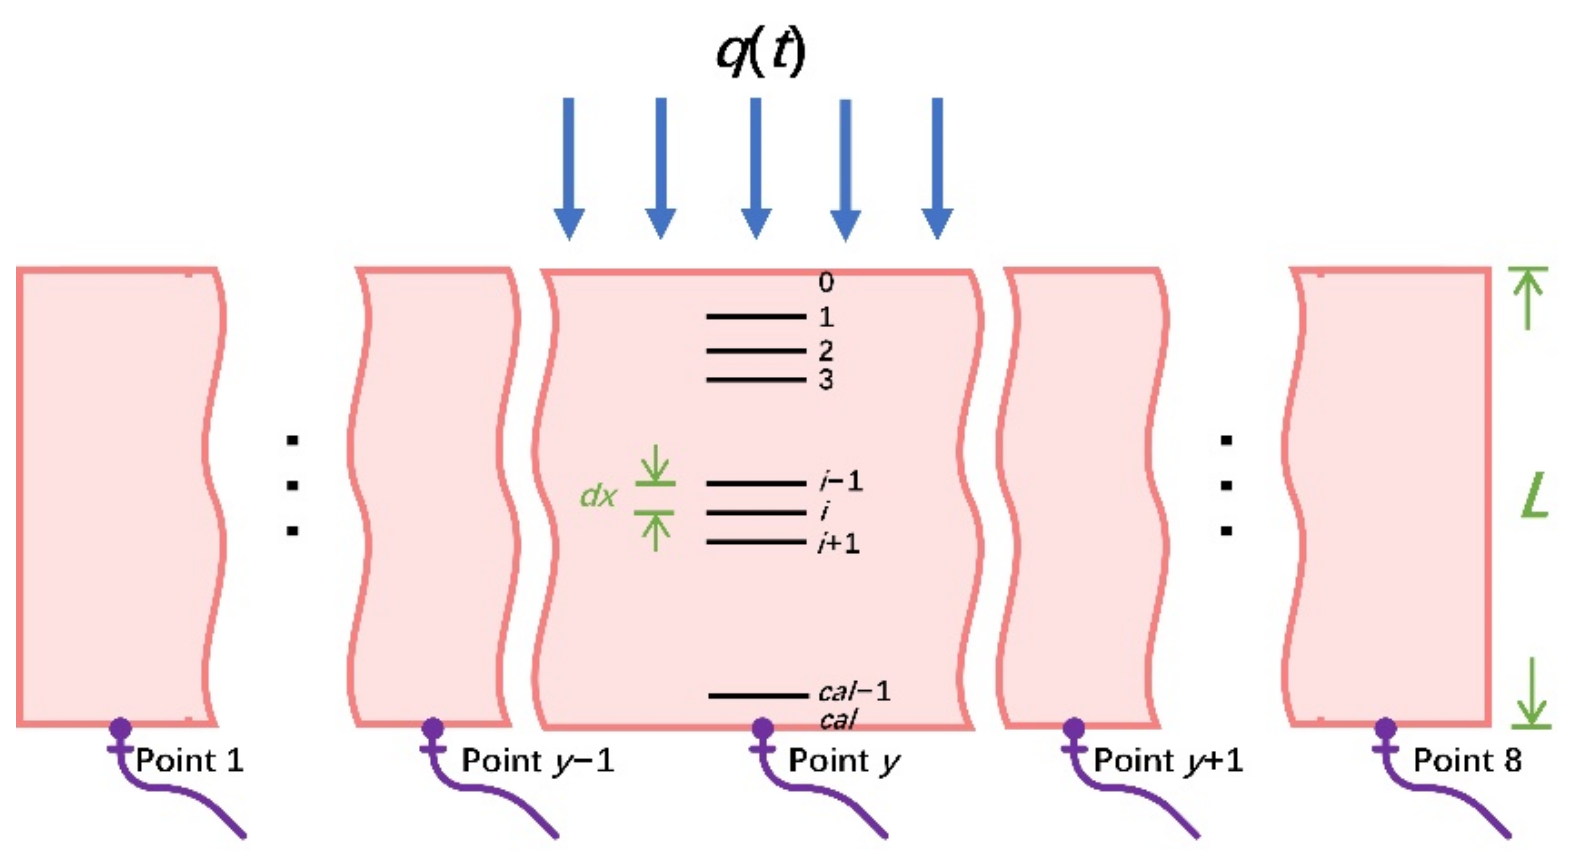
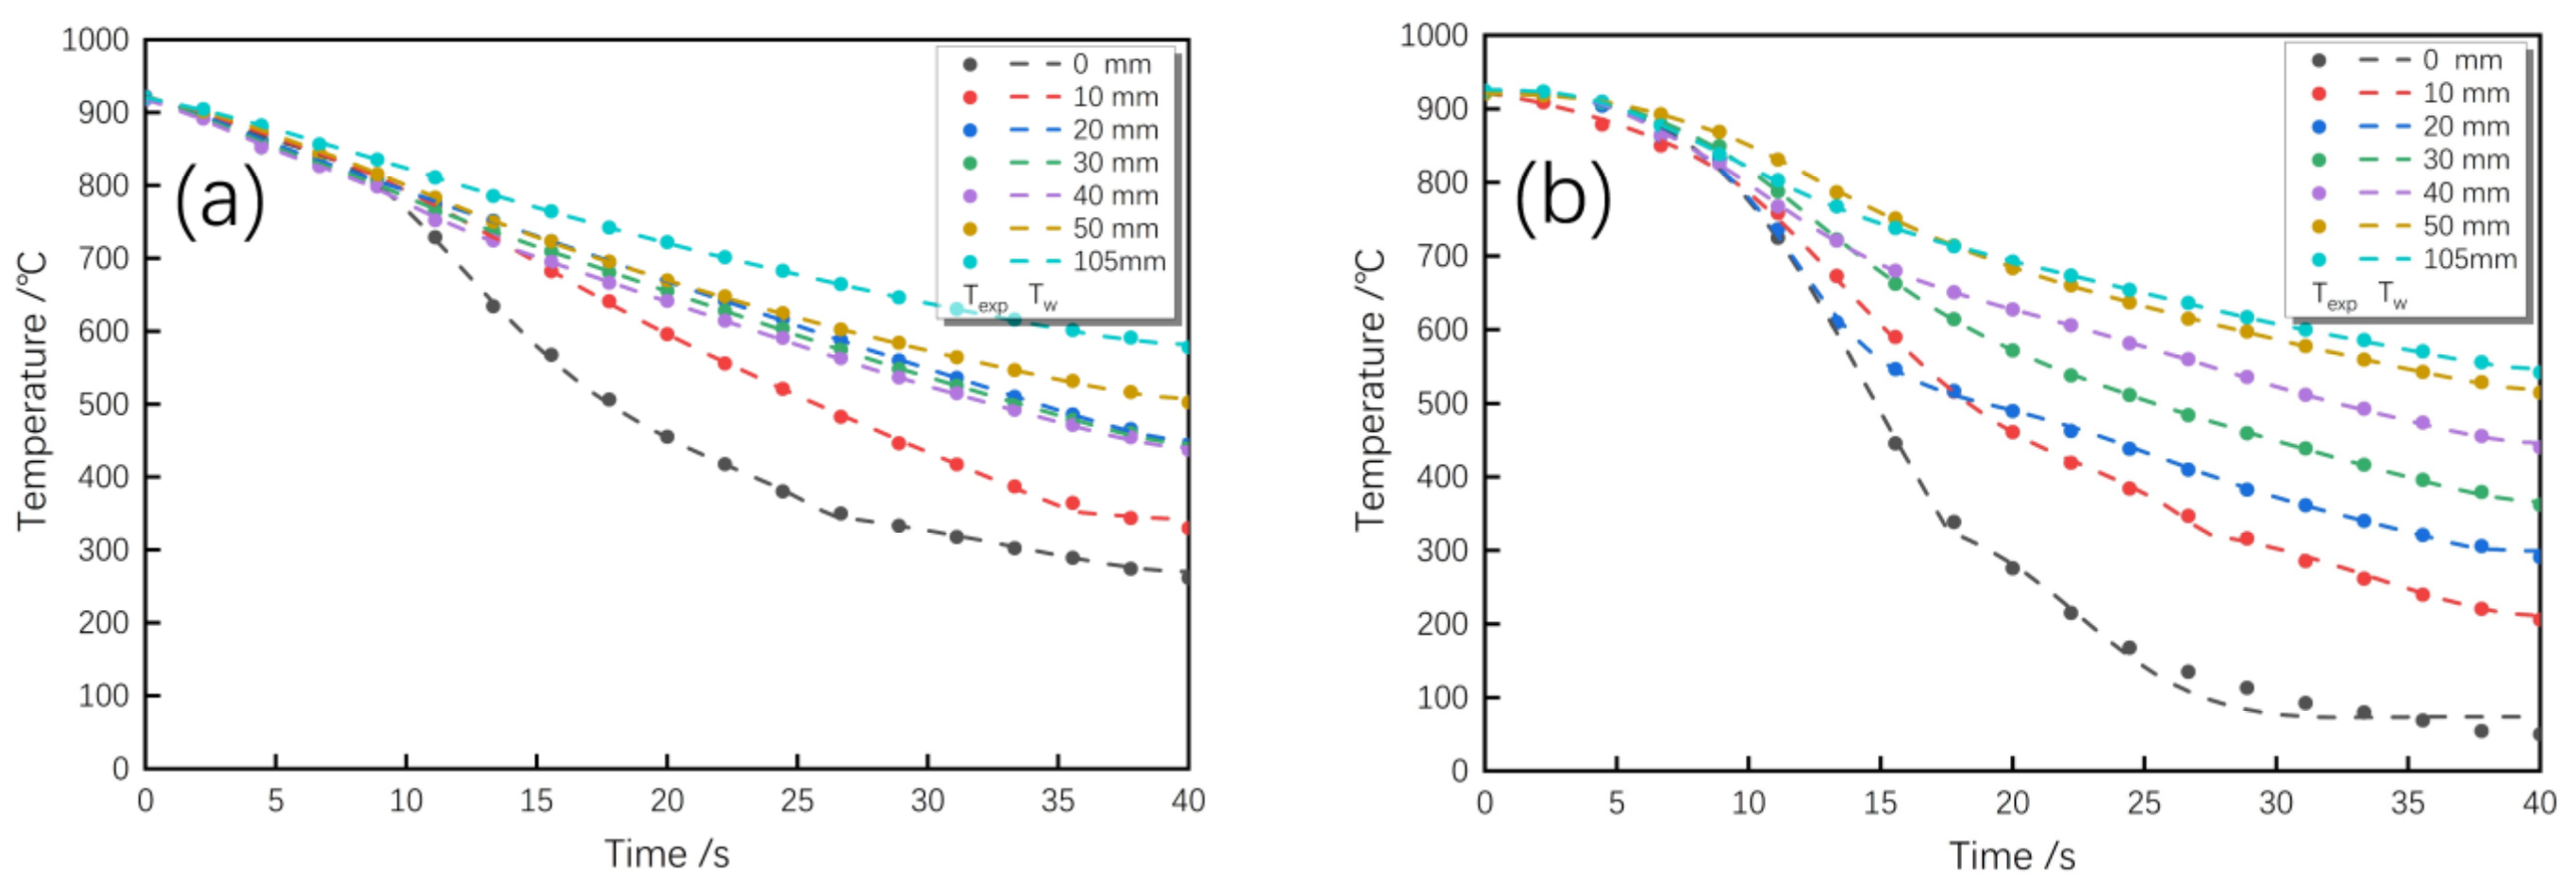
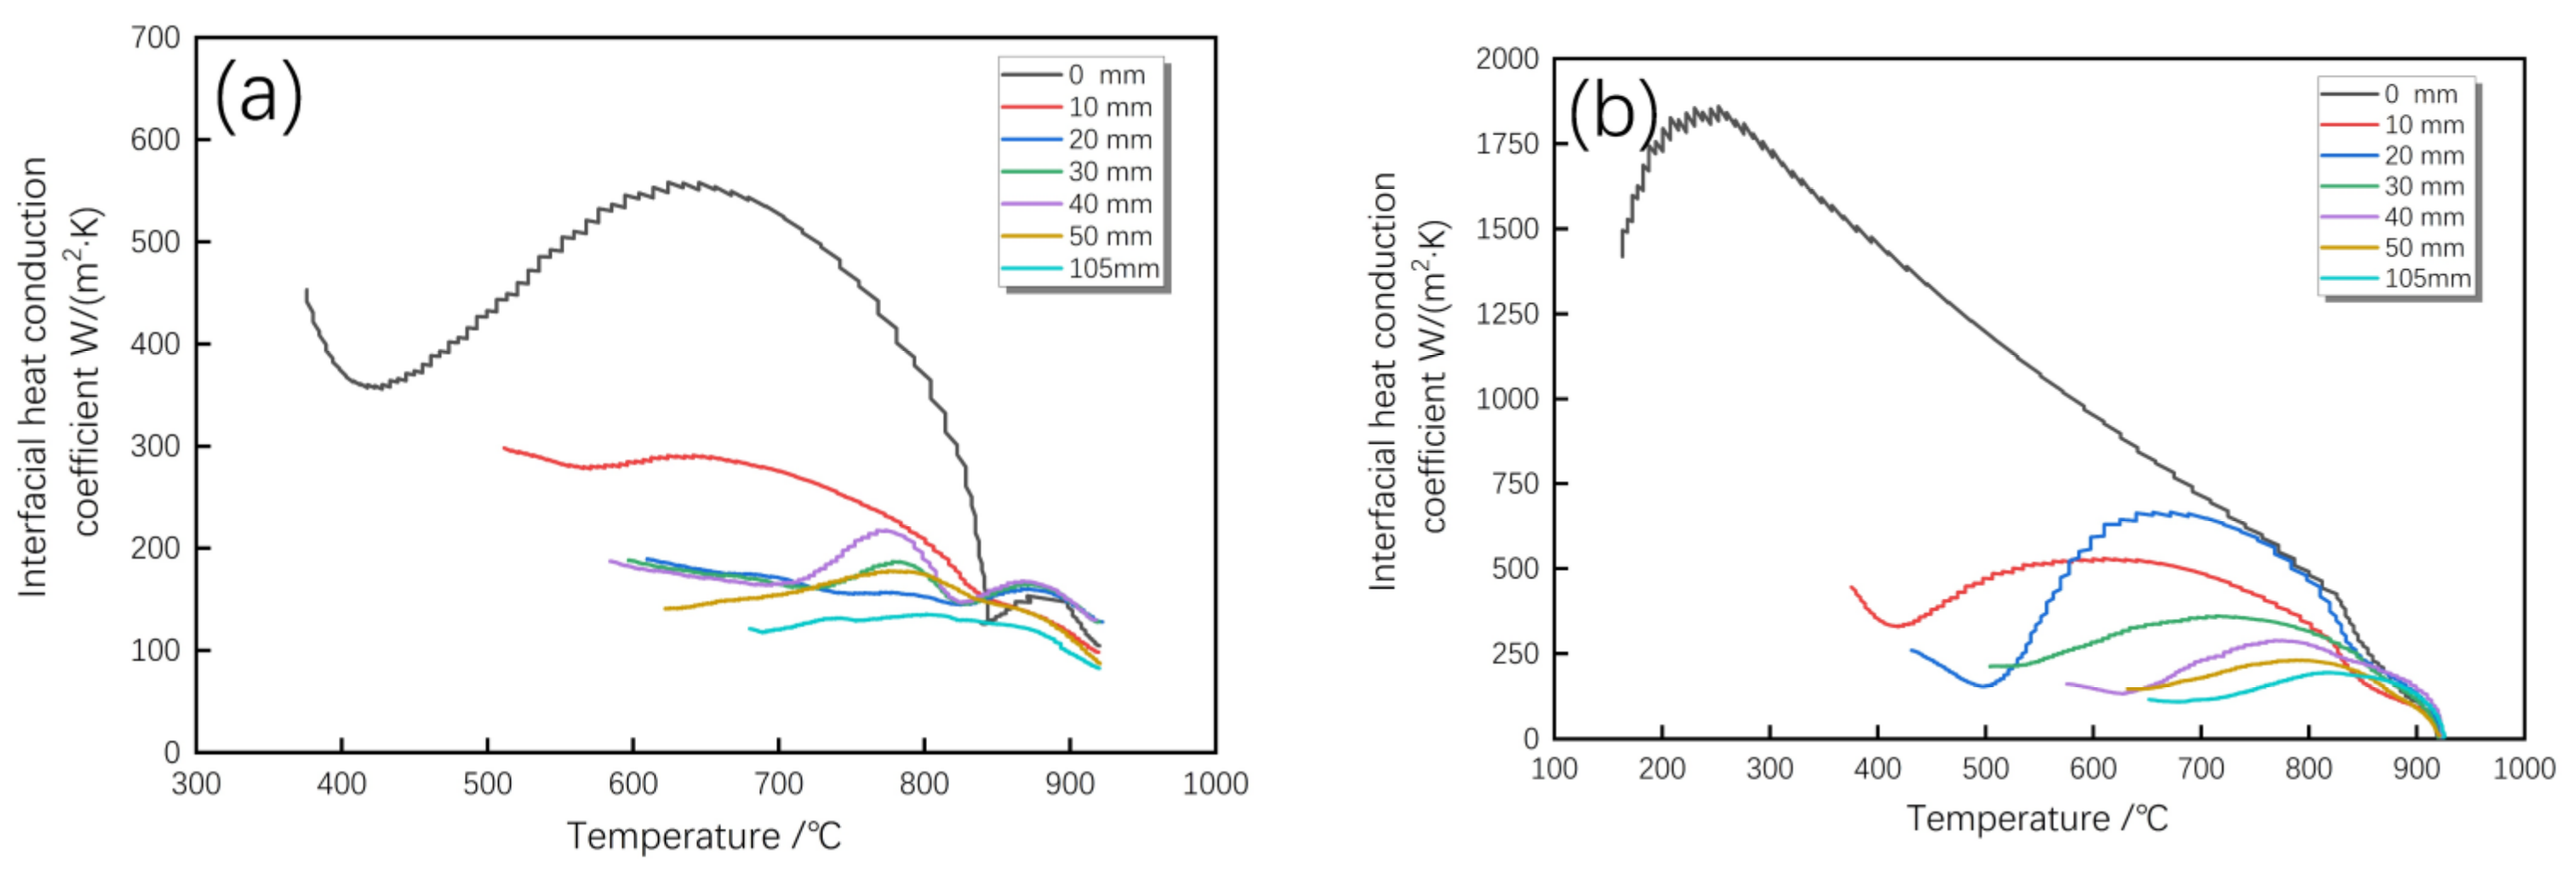
6.2. Solving for Inverse Heat Conduction Problem (IHCP)
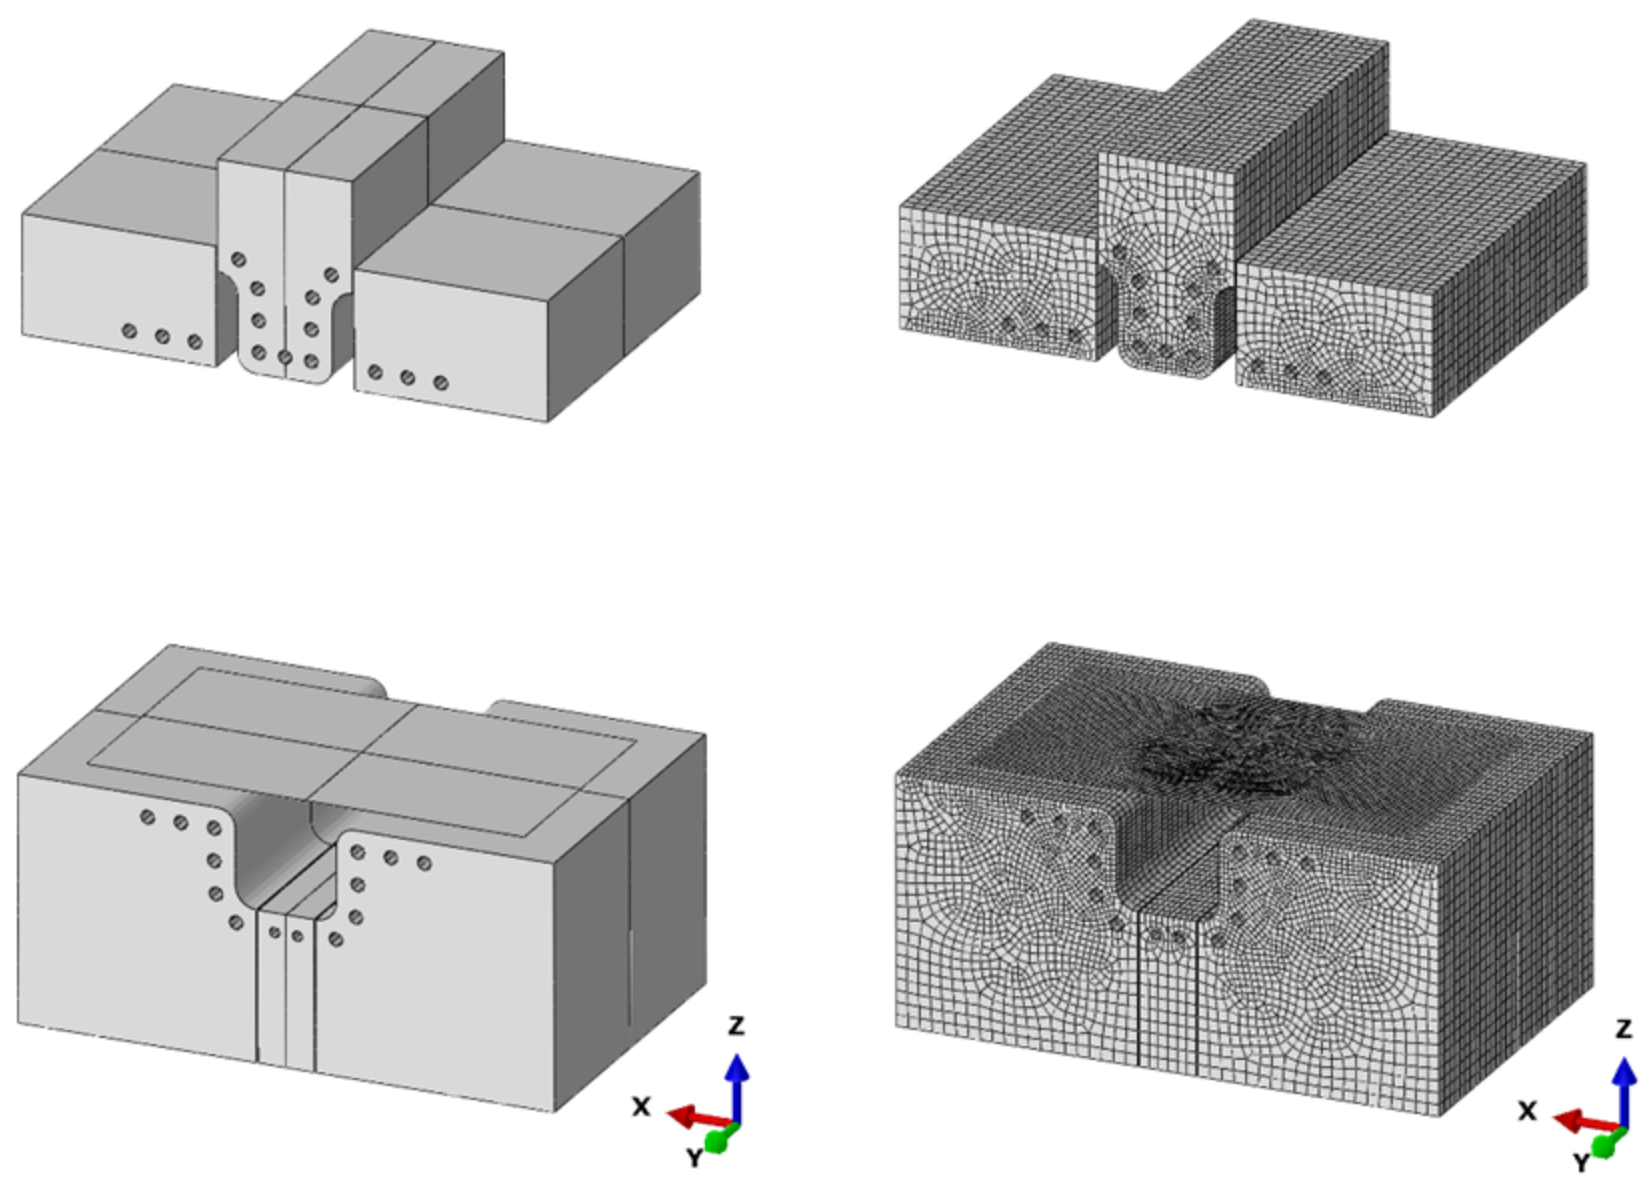
7. FEM of TPP
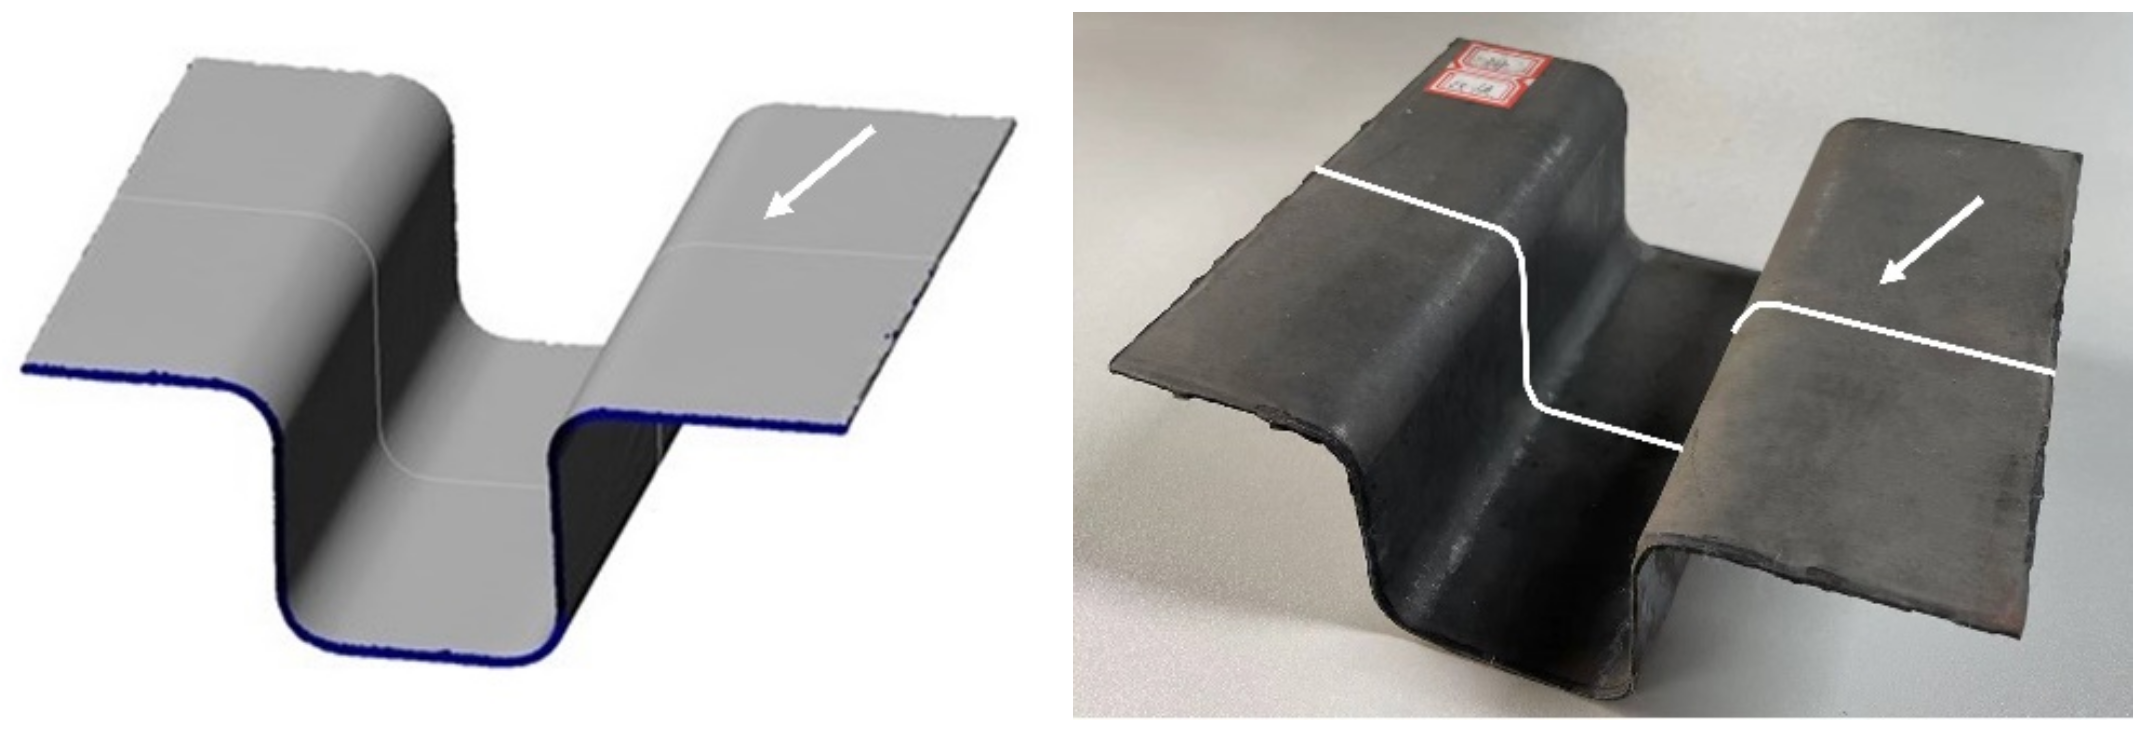
7.1. Applications
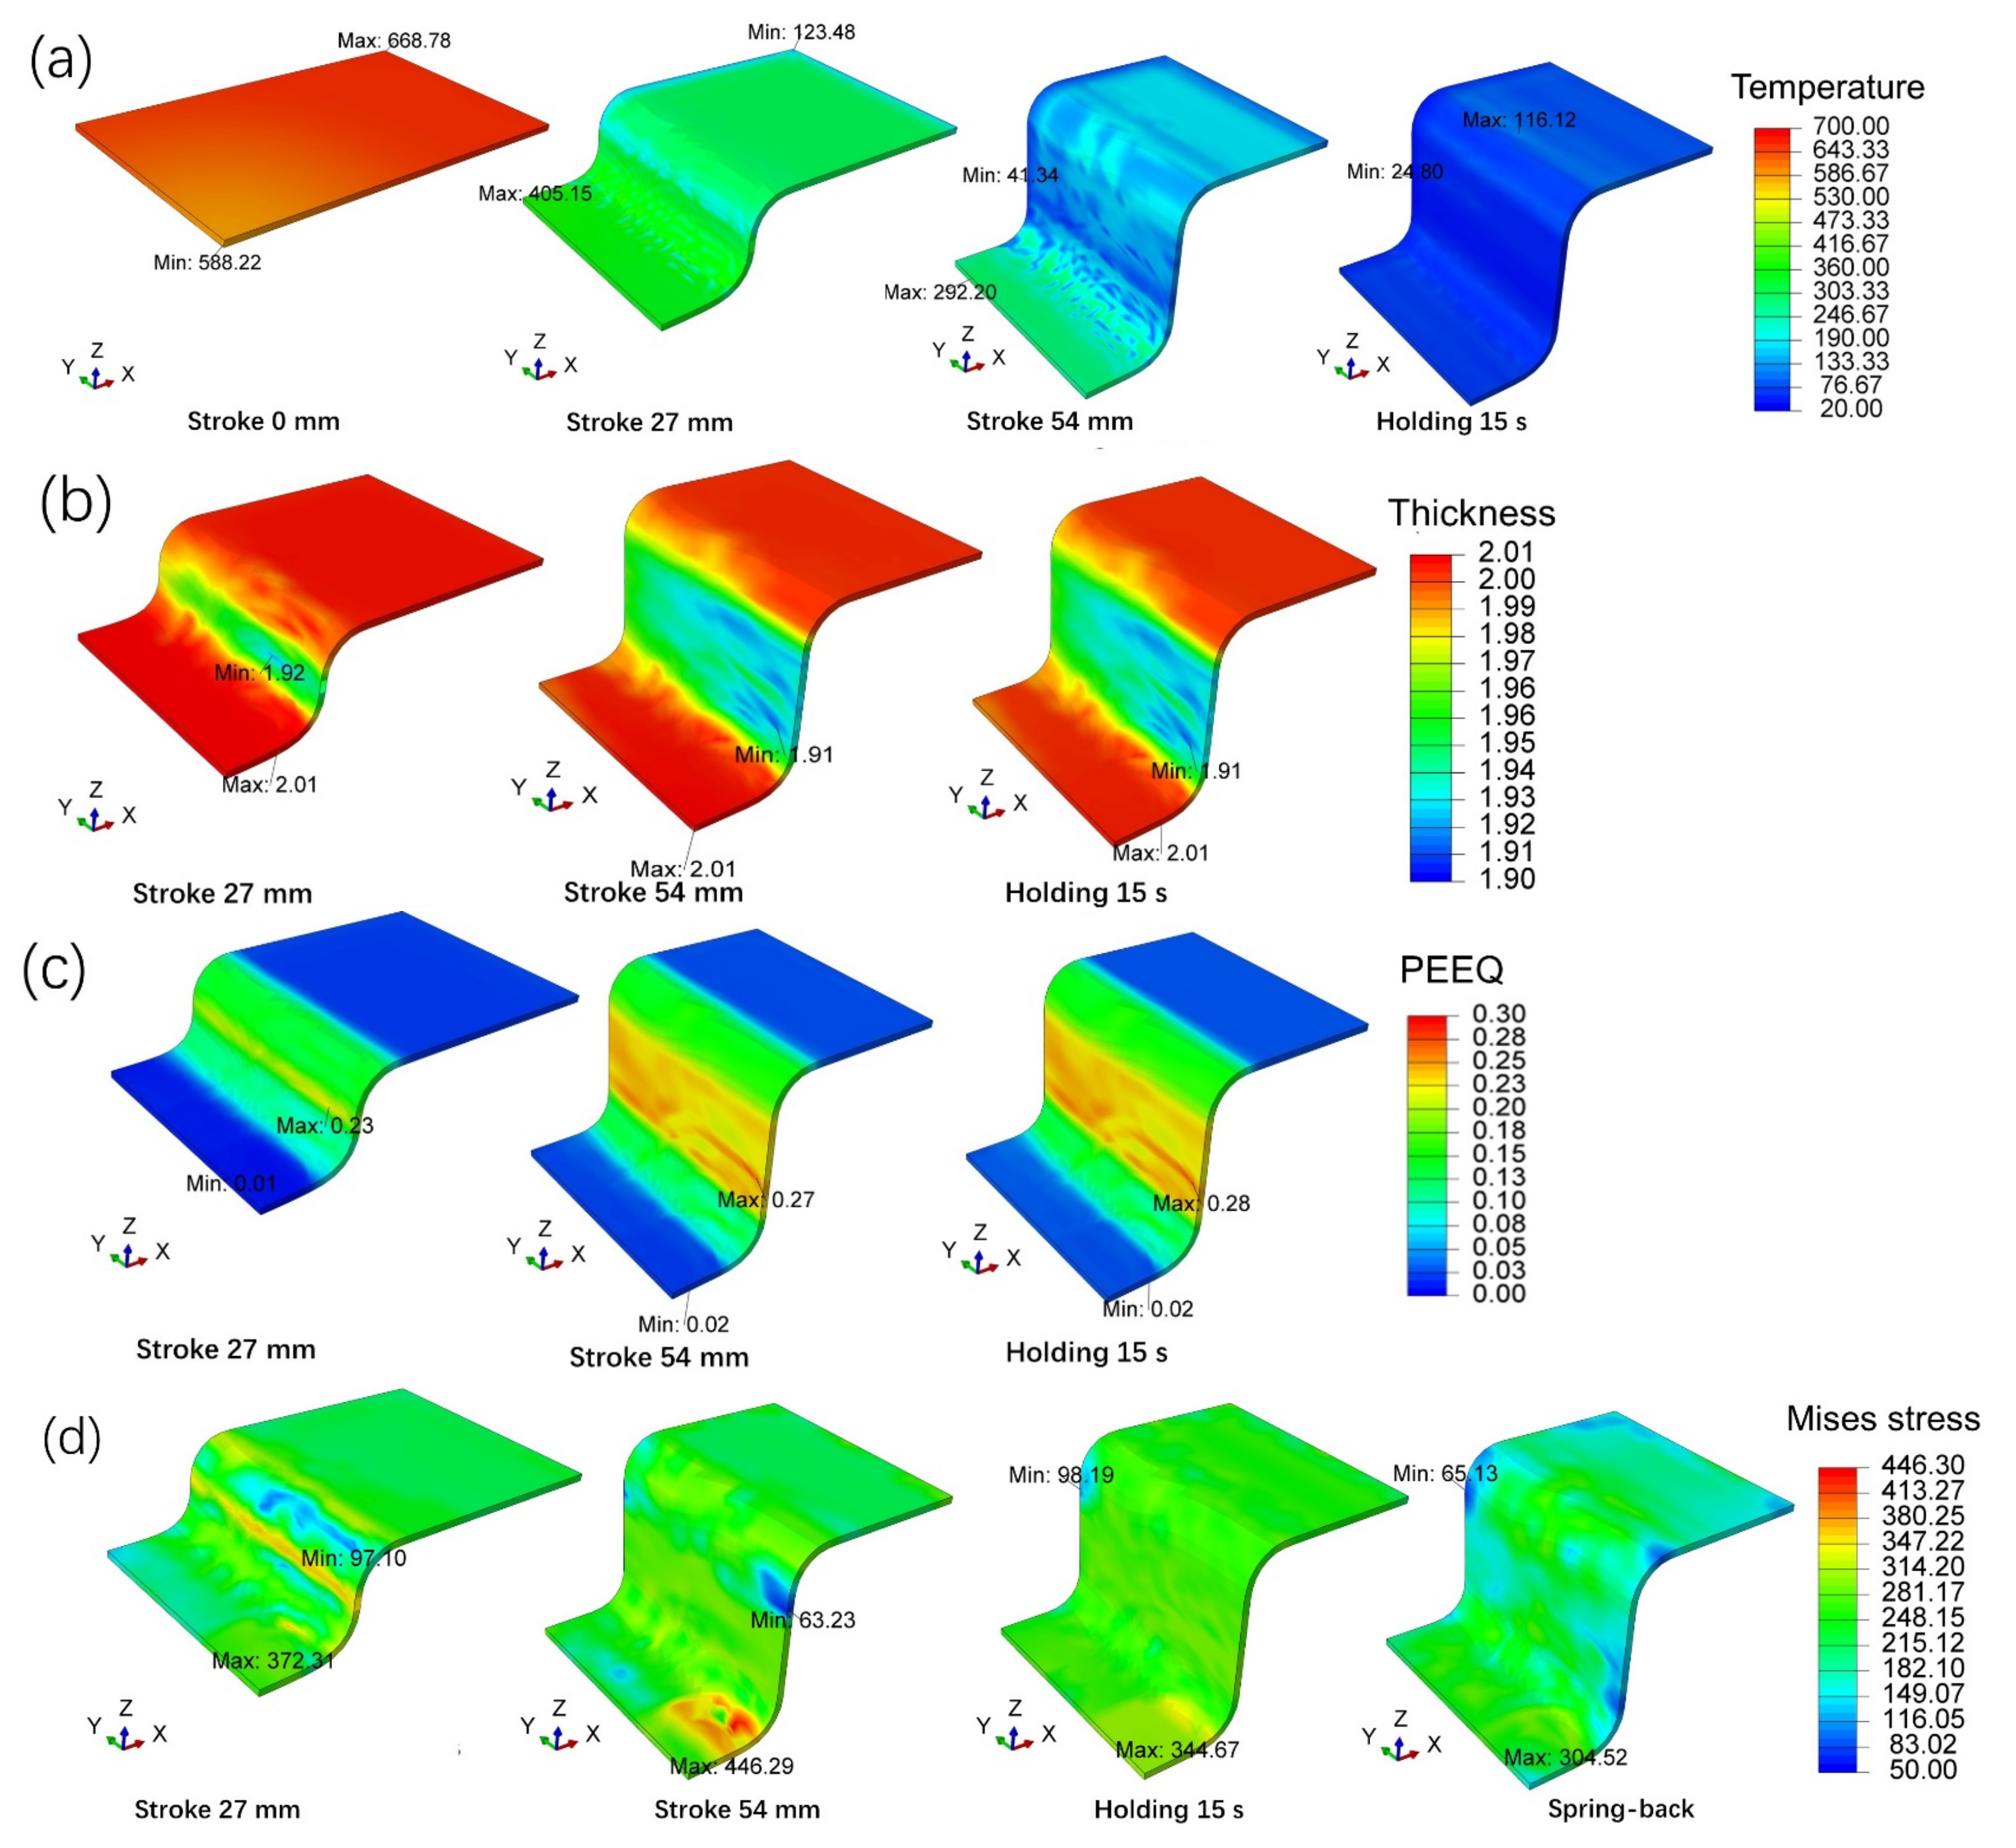
7.2. Numerical Modelling
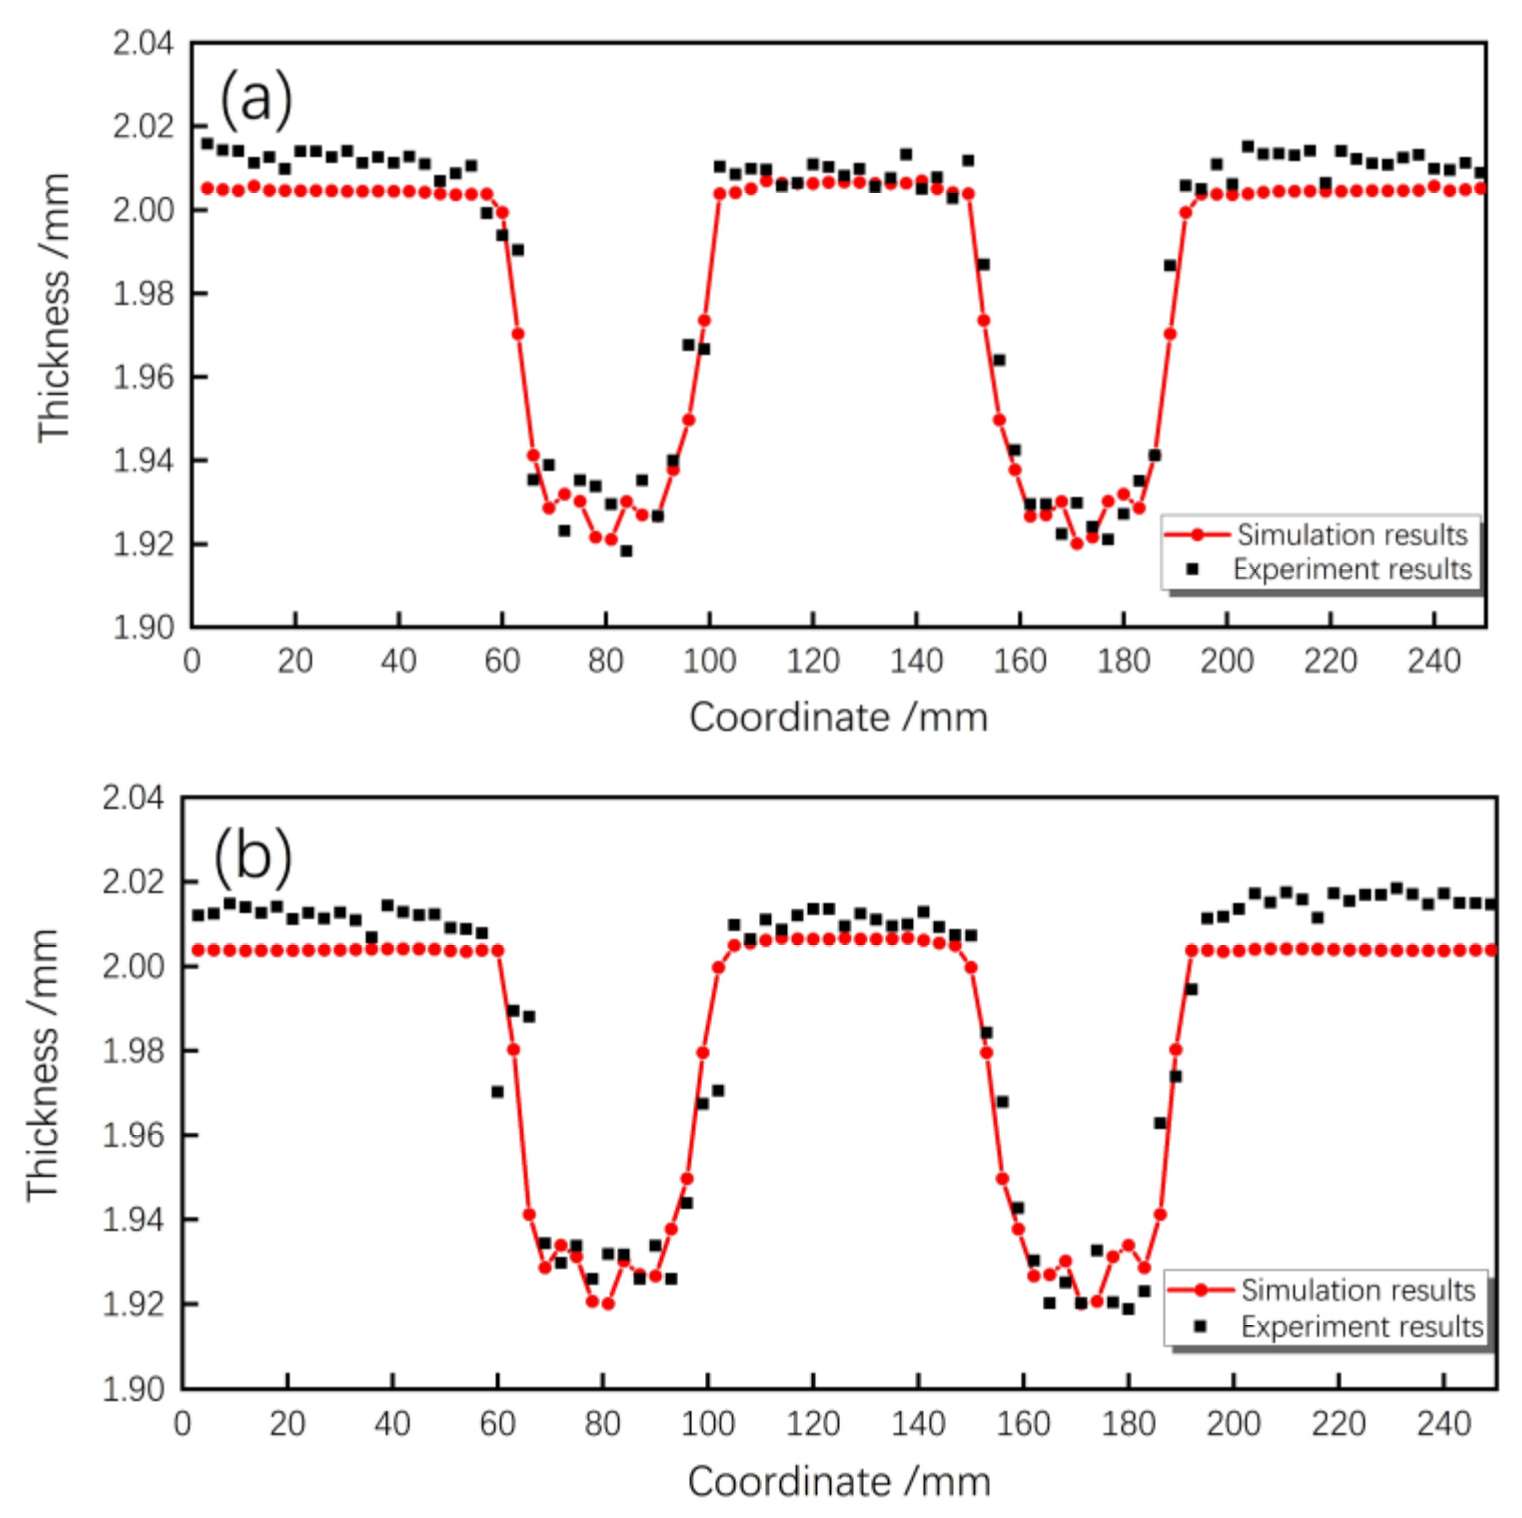
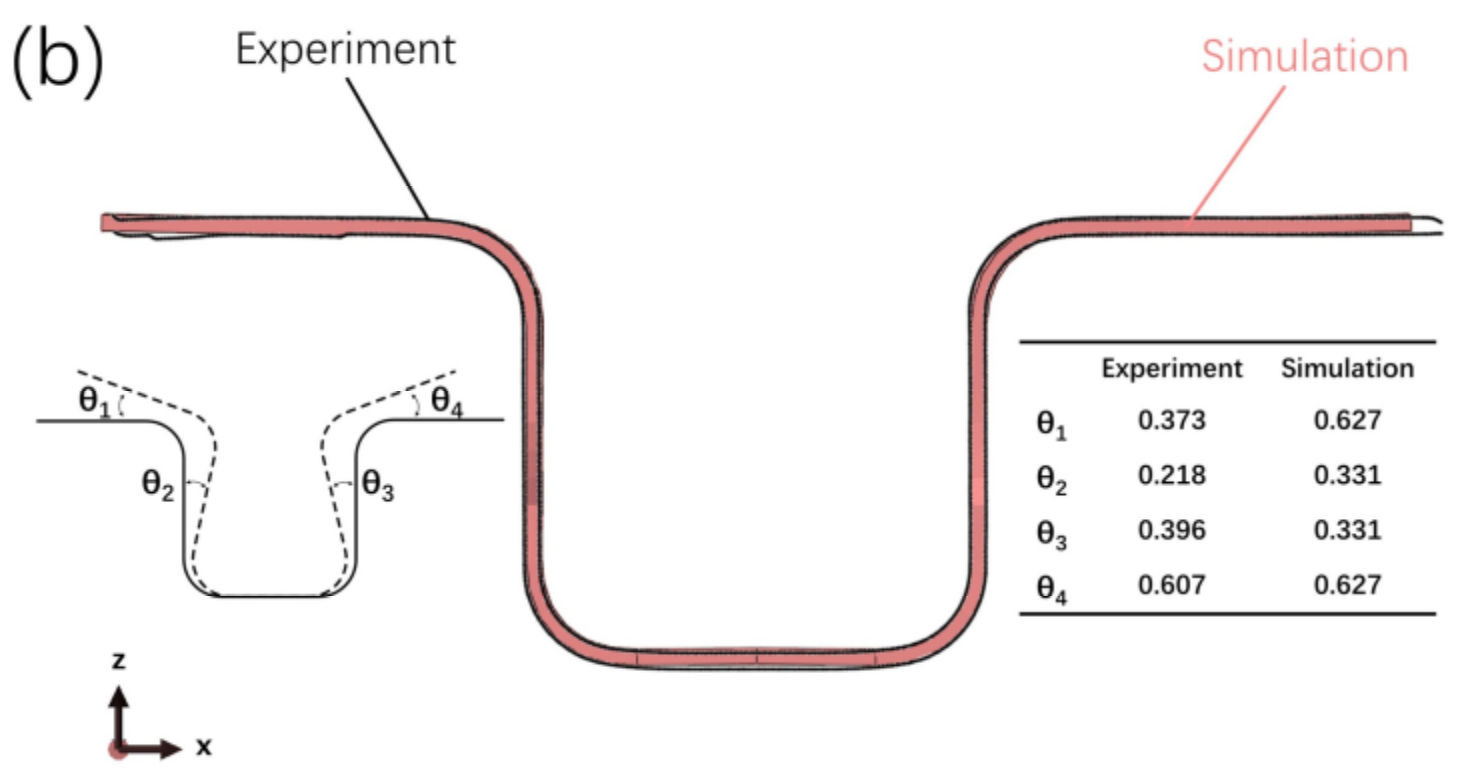
7.3. Results and Discussion
8. Conclusions
Author Contributions
Funding
Institutional Review Board Statement
Informed Consent Statement
Data Availability Statement
Acknowledgments
Conflicts of Interest
References
- Nakagawa, Y.; Mori, K.; Suzuki, Y.; Shimizu, Y. Tailored Tempering without Die Heating in Hot Stamping of Ultra-High Strength Steel Parts. Mater. Des. 2020, 192, 108704. [Google Scholar] [CrossRef]
- Nakagawa, Y.; Mori, K.; Maeno, T. Springback-Free Mechanism in Hot Stamping of Ultra-High-Strength Steel Parts and Deformation Behaviour and Quenchability for Thin Sheet. Int. J. Adv. Manuf. Technol. 2018, 95, 459–467. [Google Scholar] [CrossRef]
- Eller, T.K.; Greve, L.; Andres, M.T.; Medricky, M.; Hatscher, A.; Meinders, V.T.; van den Boogaard, A.H. Plasticity and Fracture Modeling of Quench-Hardenable Boron Steel with Tailored Properties. J. Mater. Process. Technol. 2014, 214, 1211–1227. [Google Scholar] [CrossRef]
- Tajul, L.; Maeno, T.; Kinoshita, T.; Mori, K. Successive Forging of Tailored Blank Having Thickness Distribution for Hot Stamping. Int. J. Adv. Manuf. Technol. 2017, 89, 3731–3739. [Google Scholar] [CrossRef]
- Maeno, T.; Mori, K.-I.; Fujimoto, M. Improvements in Productivity and Formability by Water and Die Quenching in Hot Stamping of Ultra-High Strength Steel Parts. CIRP Ann. 2015, 64, 281–284. [Google Scholar] [CrossRef]
- Jonsén, P.; Svanberg, A.; Ramirez, G.; Casellas, D.; Hernández, R.; Marth, S.; Häggblad, H.-Å.; Oldenburg, M. A Novel Method for Modelling of Cold Cutting of Microstructurally Tailored Hot Formed Components; Wissenschaftliche Scripten: Auerbach, Germany, 2019; pp. 645–652. [Google Scholar]
- Lee, M.S.; Moon, J.H.; Kang, C.G. Investigation of Formability and Surface Micro-Crack in Hot Deep Drawing by Using Laser-Welded Blank of Al–Si and Zn-Coated Boron Steel. Proc. Inst. Mech. Eng. Part B J. Eng. Manuf. 2014, 228, 540–552. [Google Scholar] [CrossRef]
- Lamprecht, K.; Geiger, M. Experimental and Numerical Investigation of the Formability of Laser Welded Patchwork Blanks. Adv. Mater. Res. 2005, 6–8, 689–696. [Google Scholar] [CrossRef]
- Kim, J.H.; Ko, D.H.; Seo, P.G.; Kim, B.M. Limits Considering the Deformation Characteristics of Tailor Rolled Blank during Hot Stamping. Trans. Mater. Process. 2014, 23, 351–356. [Google Scholar] [CrossRef]
- Merklein, M.; Wieland, M.; Lechner, M.; Bruschi, S.; Ghiotti, A. Hot Stamping of Boron Steel Sheets with Tailored Properties: A Review. J. Mater. Process. Technol. 2016, 228, 11–24. [Google Scholar] [CrossRef]
- Landgrebe, D.; Putz, M.; Schieck, F.; Sterzing, A.; Rennau, A. Towards Efficient, Interconnected and Flexible Value Chains–Examples and Innovations from Research on Production Technologies. In Proceedings of the 5th International Conference on Accuracy in Forming Technology, Chemnitz, Germany, 10–11 November 2015; pp. 10–11. [Google Scholar]
- Mori, K.; Maeno, T.; Mongkolkaji, K. Tailored Die Quenching of Steel Parts Having Strength Distribution Using Bypass Resistance Heating in Hot Stamping. J. Mater. Process. Technol. 2013, 213, 508–514. [Google Scholar] [CrossRef]
- Maikranz-Valentin, M.; Weidig, U.; Schoof, U.; Becker, H.-H.; Steinhoff, K. Components with Optimised Properties Due to Advanced Thermo-Mechanical Process Strategies in Hot Sheet Metal Forming. Steel Res. Int. 2008, 79, 92–97. [Google Scholar] [CrossRef]
- Mori, K.; Okuda, Y. Tailor Die Quenching in Hot Stamping for Producing Ultra-High Strength Steel Formed Parts Having Strength Distribution. CIRP Ann. 2010, 59, 291–294. [Google Scholar] [CrossRef]
- Behrens, B.-A.; Bouguecha, A.; Gaebel, C.M.; Moritz, J.; Schrödter, J. Hot Stamping of Load Adjusted Structural Parts. Procedia Eng. 2014, 81, 1756–1761. [Google Scholar] [CrossRef] [Green Version]
- Tang, B.T.; Wang, Q.L.; Bruschi, S.; Ghiotti, A.; Bariani, P.F. Influence of Temperature and Deformation on Phase Transformation and Vickers Hardness in Tailored Tempering Process: Numerical and Experimental Verifications. J. Manuf. Sci. Eng. 2014, 136, 051018. [Google Scholar] [CrossRef]
- Bardelcik, A.; Vowles, C.J.; Worswick, M.J. A Mechanical, Microstructural, and Damage Study of Various Tailor Hot Stamped Material Conditions Consisting of Martensite, Bainite, Ferrite, and Pearlite. Metall. Mater. Trans. A 2018, 49, 1102–1120. [Google Scholar] [CrossRef]
- Omer, K.; ten Kortenaar, L.; Butcher, C.; Worswick, M.; Malcolm, S.; Detwiler, D. Testing of a Hot Stamped Axial Crush Member with Tailored Properties—Experiments and Models. Int. J. Impact. Eng. 2017, 103, 12–28. [Google Scholar] [CrossRef]
- Omer, K.; George, R.; Bardelcik, A.; Worswick, M.; Malcolm, S.; Detwiler, D. Development of a Hot Stamped Channel Section with Axially Tailored Properties—Experiments and Models. Int. J. Mater. Form. 2018, 11, 149–164. [Google Scholar] [CrossRef]
- Múnera, D.D.; Pic, A.; Abou-Khalil, D.; Shmit, F.; Pinard, F. Innovative Press Hardened Steel Based Laser Welded Blanks Solutions for Weight Savings and Crash Safety Improvements. SAE Int. J. Mater. Manuf. 2009, 1, 472–479. [Google Scholar] [CrossRef]
- Tang, B.; Wang, Q.; Wei, Z.; Meng, X.; Yuan, Z. FE Simulation Models for Hot Stamping an Automobile Component with Tailor-Welded High-Strength Steels. J. Mater. Eng. Perform. 2016, 25, 1709–1721. [Google Scholar] [CrossRef]
- Billur, E.; Bošković, V. Tailored Properties. In Hot Stamping of Ultra High-Strength Steels: From a Technological and Business Perspective; Billur, E., Ed.; Springer International Publishing: Cham, Switzerland, 2019; pp. 157–190. ISBN 978-3-319-98870-2. [Google Scholar]
- Lei, C.; Xing, Z.; Xu, W.; Wu, Y.; Li, Y.; Shan, D. Flow Behavior of High Strength Steel TRB at Elevated Temperature. Cailiao Kexue Gongyi Mater. Sci. Technol. 2015, 23, 66–70. [Google Scholar] [CrossRef]
- Ou, H.; Yang, Y.; Hu, M.; Li, G.; Cui, J. Forming Study on a Tailor Rolled Blank (TRB) Structure-Formability Evaluation and Model Verification. J. Manuf. Process. 2019, 44, 397–407. [Google Scholar] [CrossRef]
- Wilsius, J.; Tavernier, B.; Abou-Khalil, D. Experimental and Numerical Investigation of Various Hot Stamped B-Pillar Concepts Based on Usibor® 1500P. In Proceedings of the 3rd International Conference on Hot Sheet Metal Forming of High-Performance Steel, Kassel, Germany, 13–16 June 2011; pp. 427–435. [Google Scholar]
- Mori, K. Smart Hot Stamping of Ultra-High Strength Steel Parts. Trans. Nonferrous Met. Soc. China 2012, 22, s496–s503. [Google Scholar] [CrossRef]
- Mu, Y.; Zhou, J.; Wang, B.; Wang, Q.; Ghiotti, A.; Bruschi, S. Numerical Simulation of Hot Stamping by Partition Heating Based on Advanced Constitutive Modelling of 22MnB5 Behaviour. Finite Elem. Anal. Des. 2018, 147, 34–44. [Google Scholar] [CrossRef]
- Feuser, P.; Schweiker, T.; Merklein, M. Partially Hot-Formed Parts from 22MnB5-Process Window, Material Characteristics and Component Test Results. In Proceedings of the 10th International Conference on Technology of Plasticity, Aachen, Germany, 25–30 September 2011; pp. 25–30. [Google Scholar]
- Casas, B.; Latre, D.; Rodriguez, N.; Valls, I. Tailor Made Tool Materials for the Present and Upcoming Tooling Solutions in Hot Sheet Metal Forming. In Proceedings of the 1st International Conference on Hot Sheet Metal Forming of High-Performance steel, Kassel, Germany, 22–24 October 2008; pp. 23–35. [Google Scholar]
- Kolleck, R.; Veit, R. Möglichkeiten Zur Lokalen Beeinflussung Der Bauteilfestigkeit Beim Presshärten; Erlangen Workshop Warmblechumformung: Erlangen, Germany, 2008; pp. 65–72. [Google Scholar]
- Zimmermann, F.; SpÖer, J.; Volk, W. Partial Tempering of Press Hardened Car Body Parts by a Premixed Oxygen-Methane Flame Jet. In Proceedings of the 4th International Conference on Hot Sheet Metal Forming of High-Performance Steel, Luleä, Sweden, 9–12 June 2013; pp. 9–10. [Google Scholar]
- Xiang, G.Z.; Zhang, Y.S.; Wang, Z.J. A New Technology of Hot Stamping Ultra-high Strength Automobile selective Cooling. Hot Work. Technol. 2013, 42, 108–113. [Google Scholar] [CrossRef]
- Zhou, J. Study on Hot Stamping and Damage Evolution of Boron Steel by Thermal Simulating Experiment Modelling and Simulation. Ph.D. Thesis, University of Science and Technology, Beijing, China, 2017. [Google Scholar]
- Li, H.; He, L.; Zhao, G.; Zhang, L. Constitutive Relationships of Hot Stamping Boron Steel B1500HS Based on the Modified Arrhenius and Johnson–Cook Model. Mater. Sci. Eng. A 2013, 580, 330–348. [Google Scholar] [CrossRef]
- Cao, S.F.; Zhang, L.Q.; Guo, P.C.; Li, L.X. Study on Hot Deformation Behavior and Flow Stress Constitutive Model of 22MnB5 at High Temperature. China Mech. Eng. 2014, 25, 1256–1261. [Google Scholar]
- Lin, J.; Liu, Y. A Set of Unified Constitutive Equations for Modelling Microstructure Evolution in Hot Deformation. J. Mater. Process. Technol. 2003, 143–144, 281–285. [Google Scholar] [CrossRef]
- Lin, J.; Liu, Y.; Farrugia, D.C.J.; Zhou, M. Development of Dislocation-Based Unified Material Model for Simulating Microstructure Evolution in Multipass Hot Rolling. Philos. Mag. 2005, 85, 1967–1987. [Google Scholar] [CrossRef]
- Politis, N.; Politis, D.J.; Davies, C.M.; Lin, J. A Method of Determining Unified Viscoplastic Constitutive Equations for Hot Forging Simulations. Key Eng. Mater. 2016, 716, 251–261. [Google Scholar] [CrossRef]
- Zhong, H.; Wang, Z.; Gan, J.; Wang, X.; Yang, Y.; He, J.; Wei, T.; Qin, X. Numerical Simulation of Martensitic Transformation Plasticity of 42CrMo Steel Based on Spot Continual Induction Hardening Model. Surf. Coat. Technol. 2020, 385, 125428. [Google Scholar] [CrossRef]
- Alberg, H.; Berglund, D. Comparison of Plastic, Viscoplastic, and Creep Models When Modelling Welding and Stress Relief Heat Treatment. Comput. Methods Appl. Mech. Eng. 2003, 192, 5189–5208. [Google Scholar] [CrossRef]
- Cai, J. Modelling of Phase Transformation in Hot Stamping of Boron Steel. Ph.D. Thesis, Imperial College London, London, UK, 2011. [Google Scholar]
- Tang, B.T.; Bruschi, S.; Ghiotti, A.; Bariani, P.F. Numerical Modelling of the Tailored Tempering Process Applied to 22MnB5 Sheets. Finite Elem. Anal. Des. 2014, 81, 69–81. [Google Scholar] [CrossRef]
- Garson, G.D. Correlation, 2013rd ed.; Statistical Associates Publishers: Asheboro, NC, USA, 2012; pp. 154–196. [Google Scholar]
- Mirsepahi, A. An Intelligent Approach to Inverse Heat Transfer Analysis of Irradiative Enclosures. Ph.D. Thesis, University of Adelaide, Adelaide, Australia, 2017. [Google Scholar]
- Karnal, M. High Temperature Measurements at the Internal Nozzle Wall of the Zephyr. Master’s Thesis, Luleå University of Technology, Luleå, Sweden, 2014. [Google Scholar]
- Liu, H.S.; Xing, Z.W.; Bao, J.; Song, B.Y. Investigation of the Hot-Stamping Process for Advanced High-Strength Steel Sheet by Numerical Simulation. J. Mater. Eng. Perform. 2010, 19, 325–334. [Google Scholar] [CrossRef]
- Warlimont, H. Metal Forming Data of Ferrous Alloys—Deformation Behaviour; Springer Berlin Heidelberg: Berlin, Germany, 2009; pp. 15–278. [Google Scholar]
- Turetta, A.; Bruschi, S.; Ghiotti, A. Investigation of 22MnB5 Formability in Hot Stamping Operations. J. Mater. Processing Technol. 2006, 177, 396–400. [Google Scholar] [CrossRef]
- Abdollahpoor, A.; Chen, X.; Pereira, M.P.; Xiao, N.; Rolfe, B.F. Sensitivity of the Final Properties of Tailored Hot Stamping Components to the Process and Material Parameters. J. Mater. Process. Technol. 2016, 228, 125–136. [Google Scholar] [CrossRef]
- Shapiro, A.B. Using LS-Dyna for Hot Stamping. In Proceedings of the 7th European LS-DYNA Users Conference, Salzburg, Austria, 14–15 May 2009. [Google Scholar]
- Naderi, M. Hot Stamping of Ultra High Strength Steels. Ph.D. Thesis, Amirkabir University of Technology, Tehran, Iran, 2007. [Google Scholar]


| Material | C | Si | Mn | Cr | Al | Ti | Mo | Nb | V | B |
|---|---|---|---|---|---|---|---|---|---|---|
| 38MnB5Nb | 0.36 | 0.24 | 1.39 | 0.19 | 0.05 | 0.05 | 0.002 | 0.05 | 0.05 | 0.0035 |
| 4.834 | 985.4 | 2.524 | 3.551 × 10⁴ | 3.525 | 6.811 × 10³ | 4.335 |
| 7.760 × 10³ | 32.147 | 9.436 × 10³ | 10.117 | 1.411 × 10⁴ | 78.021 | 6.779 × 10³ |
| 5.289 | 2.878 × 10⁴ | 111.458 | 3.763 × 10⁴ | 9.725 | 3.629 × 10⁴ | 149.906 |
| 6.867 × 10³ | 1.288 | 0.479 | 35.791 | 4.375 | 4.206 | 4.081 |
| n | ||||||
| 18.105 | 1.069 | 0.712 | 1.925 | 556.589 | 2.149 × 10⁴ | 10.017 |
Publisher’s Note: MDPI stays neutral with regard to jurisdictional claims in published maps and institutional affiliations. |
© 2022 by the authors. Licensee MDPI, Basel, Switzerland. This article is an open access article distributed under the terms and conditions of the Creative Commons Attribution (CC BY) license (https://creativecommons.org/licenses/by/4.0/).
Share and Cite
Liang, X.; Li, X.; Wang, D.; Lin, X.; Luo, P.; Tan, Z.; Song, Y.; Tian, Y.; Hou, J.; Jiang, C.; et al. Numerical and Experimental Study on Hot Forming by Partition Cooling of 38MnB5Nb. Metals 2022, 12, 839. https://doi.org/10.3390/met12050839
Liang X, Li X, Wang D, Lin X, Luo P, Tan Z, Song Y, Tian Y, Hou J, Jiang C, et al. Numerical and Experimental Study on Hot Forming by Partition Cooling of 38MnB5Nb. Metals. 2022; 12(5):839. https://doi.org/10.3390/met12050839
Chicago/Turabian StyleLiang, Xiao, Xianjun Li, Decheng Wang, Xiyue Lin, Ping Luo, Zhunli Tan, Yong Song, Yu Tian, Junqing Hou, Chao Jiang, and et al. 2022. "Numerical and Experimental Study on Hot Forming by Partition Cooling of 38MnB5Nb" Metals 12, no. 5: 839. https://doi.org/10.3390/met12050839
APA StyleLiang, X., Li, X., Wang, D., Lin, X., Luo, P., Tan, Z., Song, Y., Tian, Y., Hou, J., Jiang, C., Bian, Y., & Xie, H. (2022). Numerical and Experimental Study on Hot Forming by Partition Cooling of 38MnB5Nb. Metals, 12(5), 839. https://doi.org/10.3390/met12050839