Article

A Reliability Analysis Framework of Ship Local Structure Based on Efficient Probabilistic Simulation and Experimental Data Fusion

1
Wuhan Rules and Research Institute, China Classification Society, Wuhan 430022, China
2
First Engineering Co., Ltd., China Construction Third Bureau, Wuhan 430048, China
3
School of Naval Architecture and Ocean Engineering, Huazhong University of Science and Technology, Wuhan 430074, China
4
Hubei Key Laboratory of Naval Architecture and Marine Hydrodynamics (HUST), Wuhan 430074, China
*
Author to whom correspondence should be addressed.
Metals 2022, 12(5), 805; https://doi.org/10.3390/met12050805
Submission received: 28 February 2022 / Revised: 29 April 2022 / Accepted: 4 May 2022 / Published: 6 May 2022
(This article belongs to the Special Issue Modelling, Test and Practice of Steel Structures)

Abstract

:
This paper presents a comprehensive framework for the reliability analysis of ship local structures. Existing reliability analysis of ship local structures relies on empirical analysis without experimental validation. The presented framework improves the probabilistic simulation process by combining finite element analysis and the Kriging surrogate model to increase the computational efficiency in uncertainty quantification. In addition, ultimate strength test data are introduced to update the prior distribution based on Bayesian data fusion. A cross-deck structure of a ship is studied in detail to present the application of this work. The framework provides a valuable reference for the reliability analysis of ship local structures and promotes the development of reliability-based design code. The novelty of this paper is that it introduces the combination of testing and probabilistic simulation into the reliability analysis of ship local structures.

1. Introduction

Ship structural strength is a pre-requisite for vessels to avoid the risks brought by severe sea conditions and emergencies. It is necessary to conduct reliability analysis to assess the reliability level of ship structures. The reliability analysis method is an effective tool for safer engineering design [1]. Traditionally, in the marine industry, the empirical safety factor method [2,3] is applied to meet safety requirements, but it has limited effectiveness. This paper proposes a reliability analysis framework based on efficient probability simulation and Bayesian updating to address the issue of the reliability design of ship local structures. Structural reliability assessment with regard to ship local structures has been attracting growing attention. Zhu [4] investigated the ultimate strength and reliability assessment of ore carrier local structures. Zhang [5] studied the safety assessment of a plate structure considering damage caused by an underwater explosion. Zhang [6] investigated the ultimate strength of steel plates and stiffened panels and their employment in ship designs. However, the aforementioned studies lack testing validation of realistic ship local structures. The purpose of this paper is to investigate the reliability of a ship local structure through the combination of testing and efficient probabilistic simulation for practical use.
Reliability analysis is particularly useful in assessing ship structural integrity when facing uncertainties. Nordsenstrom [7] took the wave bending moment and the bearing capacity of the hull longitudinal bending as random variables, considered that the wave bending moment follows the Weibull distribution and the still water bending moment and the ship bearing capacity obey the normal distribution, and calculated the failure probability of the hull structure by the full probability method. Mansour [8,9] conducted a systematic study of the probabilistic model of the longitudinal strength of the hull. Probabilistic models are widely used to analyze the strength of ship structures. However, probabilistic simulations are subject to aleatory uncertainties associated with a lack of experimental data. Hence, it is necessary to introduce testing data for the modification of probabilistic simulation results.
The longitudinal strength of vessels has been widely researched by many scholars. Caldwell [10] firstly estimated the ultimate longitudinal strength of steel ships. Researchers explored the effect of initial imperfections or damage on longitudinal strength [11,12,13]. The ultimate strength of a ship hull girder with openings was investigated by Zhao [14]. Xu [15] and Xia [16] studied the relationship between the load forms and longitudinal strength. Thus far, researches of longitudinal strength have exhaustively explored many relative aspects in terms of reliability analysis. The design of ship structures is not always governed by longitudinal strength. Reliability analysis aiming at specific local structures has great potential to improve the overall performance of ship design. However, design rules based on the reliability analysis of ship local structures have not been well developed.
The computational demand of reliability analysis is tractable on analytical systems, but it can become impossible with complex computer codes such as finite element models [17]. With no analytical formula, the finite element method is essential for the reliability analysis of complex ship local structures, which leads to high computing costs. The surrogate model technique can handle the problem effectively. Due to the complexity of ship structures, the introduction of a surrogate model into the application has practical significance. Researchers proposed a method that combined the first-order reliability method and Kriging model as the response surface, assessed the prediction accuracy, and verified the usefulness and efficiency of the reliability analysis using the Kriging model [18]. Methods based on the Kriging method have been established to optimize the computing problem of the parameterized model [19,20]. The combination of the finite element model and Kriging surrogate model is adopted in this framework to improve the efficiency of probabilistic simulations.
The presented framework proposes an applicable approach to conduct reliability analysis with respect to real ship local structures. Aiming at ship local structural reliability design, this paper proposes a comprehensive framework, which conducts probability simulation using the Kriging method, combines test data fusion based on Bayesian update, and provides structural reliability design recommendations in practice. Considering the trend of larger-sized vessels, the midship structures are subjected to more transverse compressive loads, which is likely to lead to buckling failure. Therefore, this paper selects a cross-deck structure for tests to verify the effectiveness of the reliability analysis framework. The framework effectively overcomes several key problems: time-consuming and expensive probabilistic finite element simulations, testing of realistic ship local structures, and reliability design code development for specific ship structure design considerations. The main contribution of this paper is that it explores the efficient application of structural reliability analysis, with specific illustration on a typical ship local structure for simulation, testing, and practical design application.

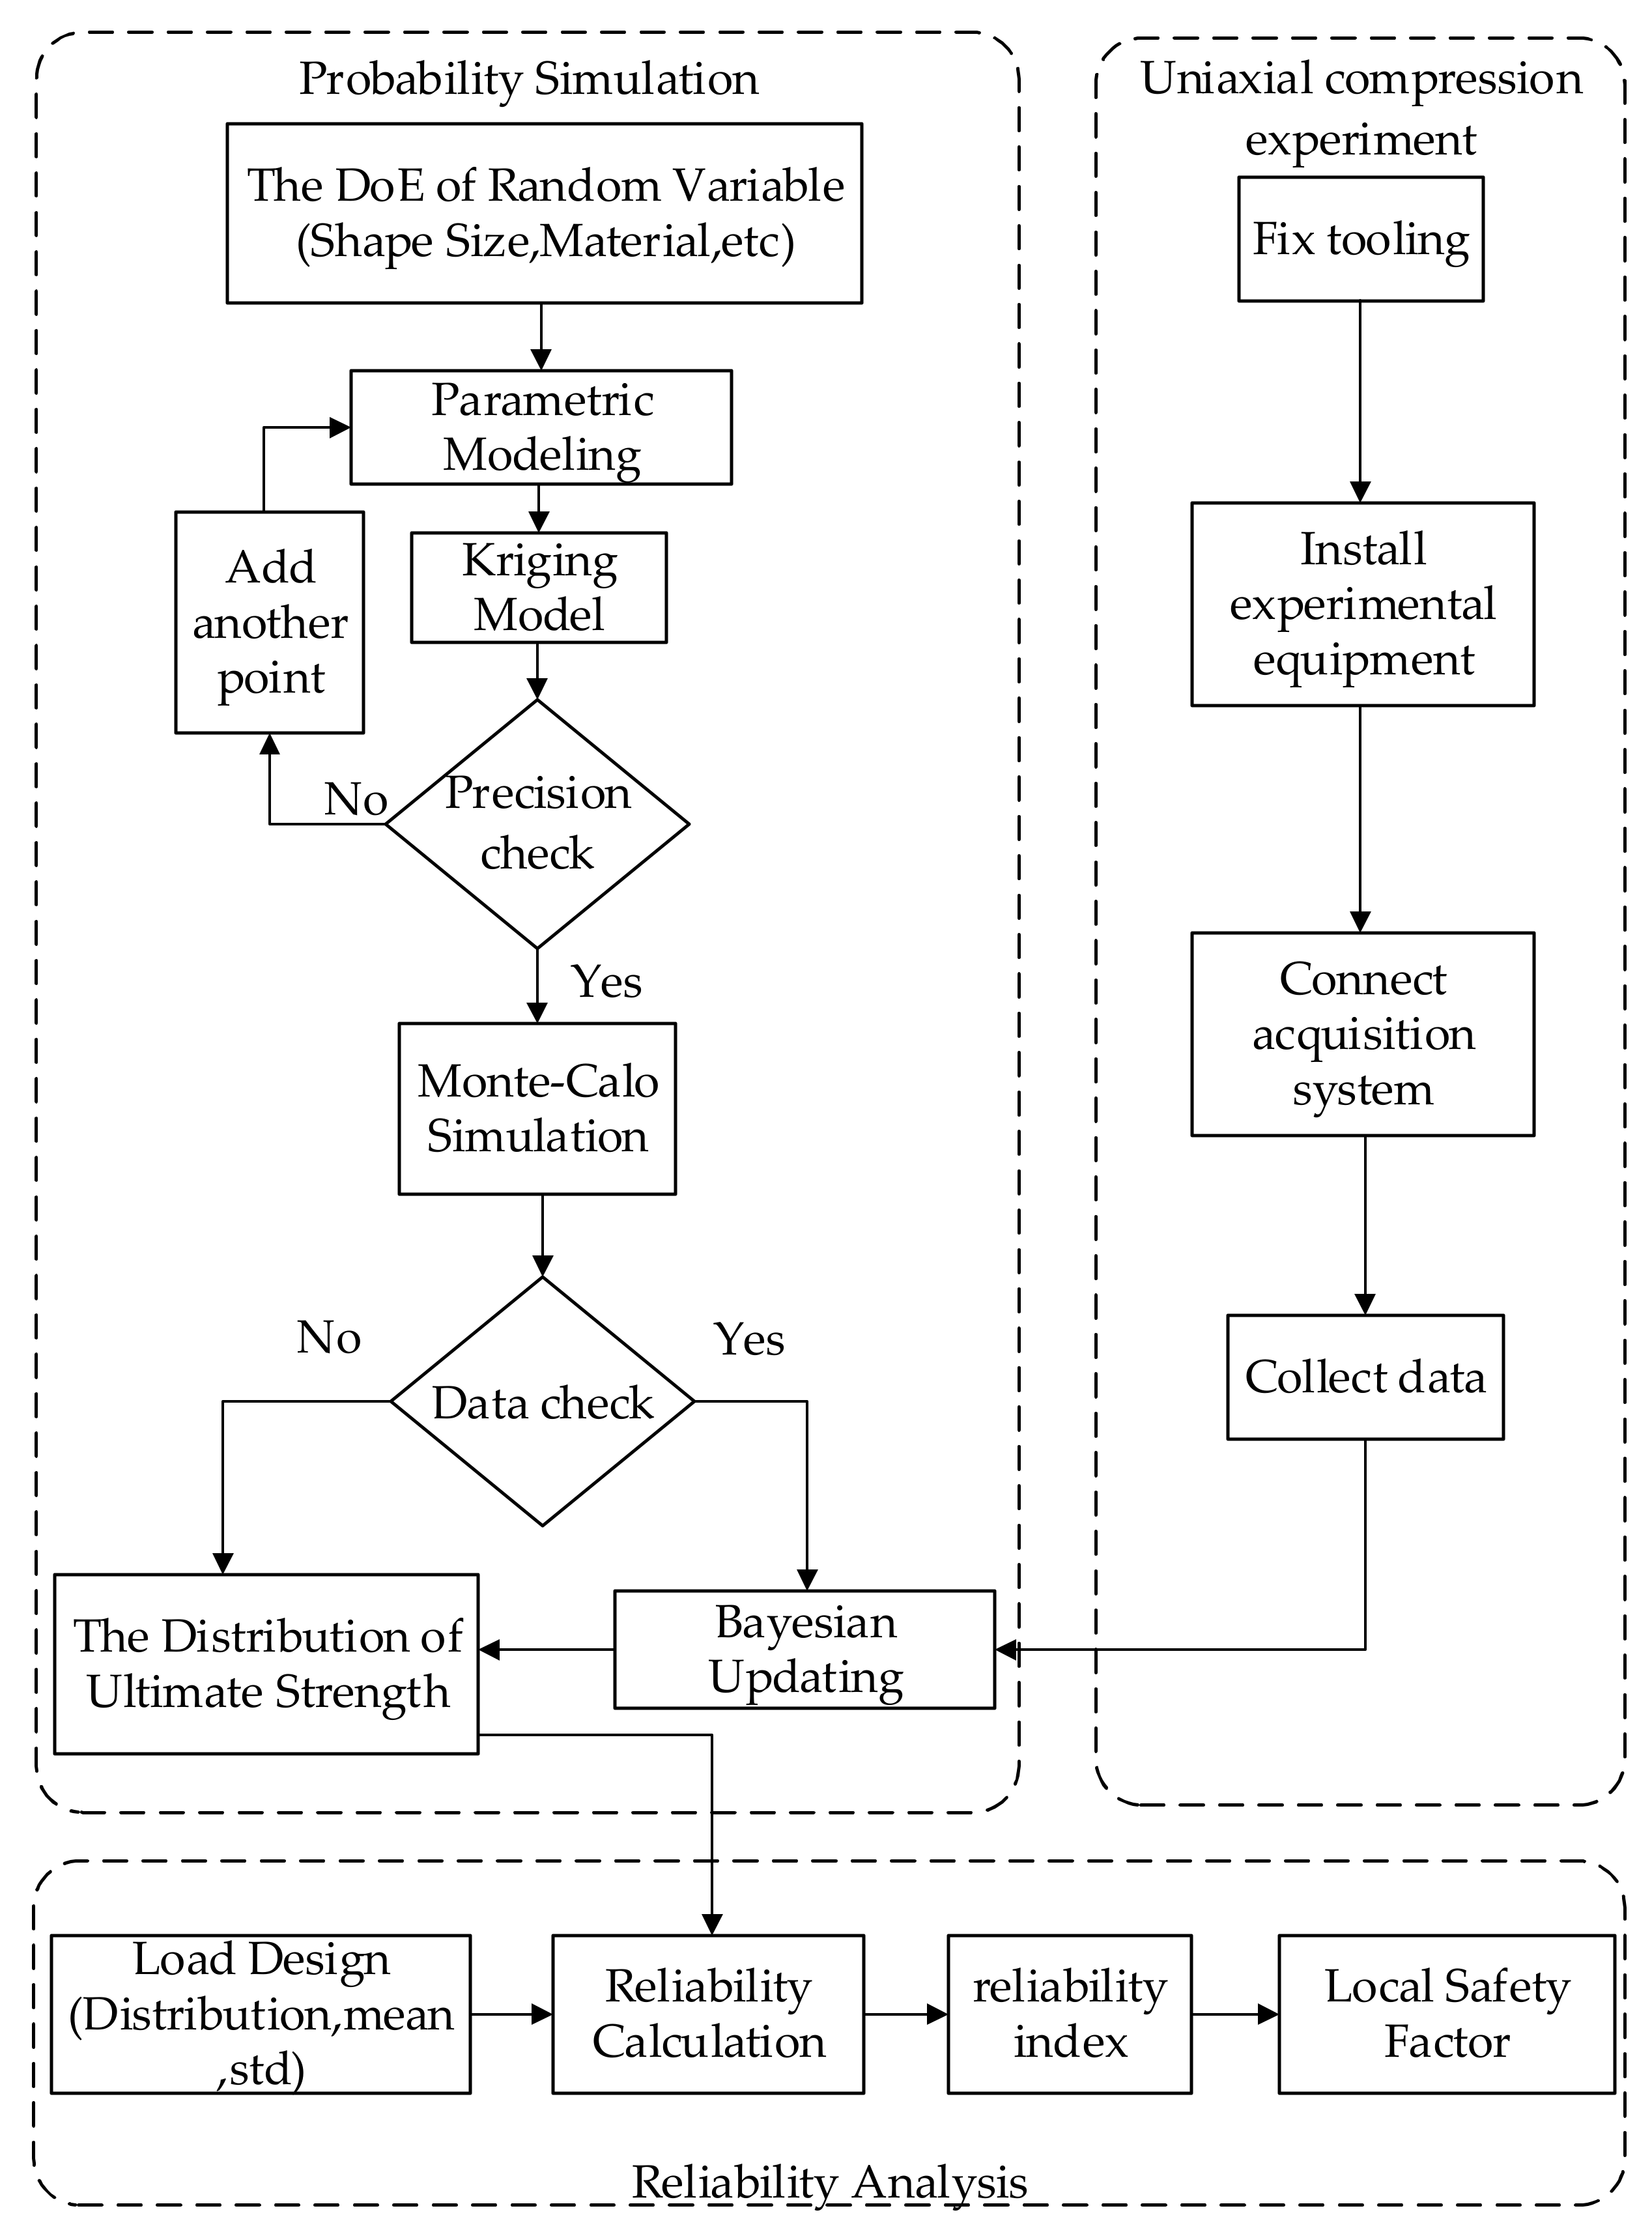
2. Reliability Analysis Framework

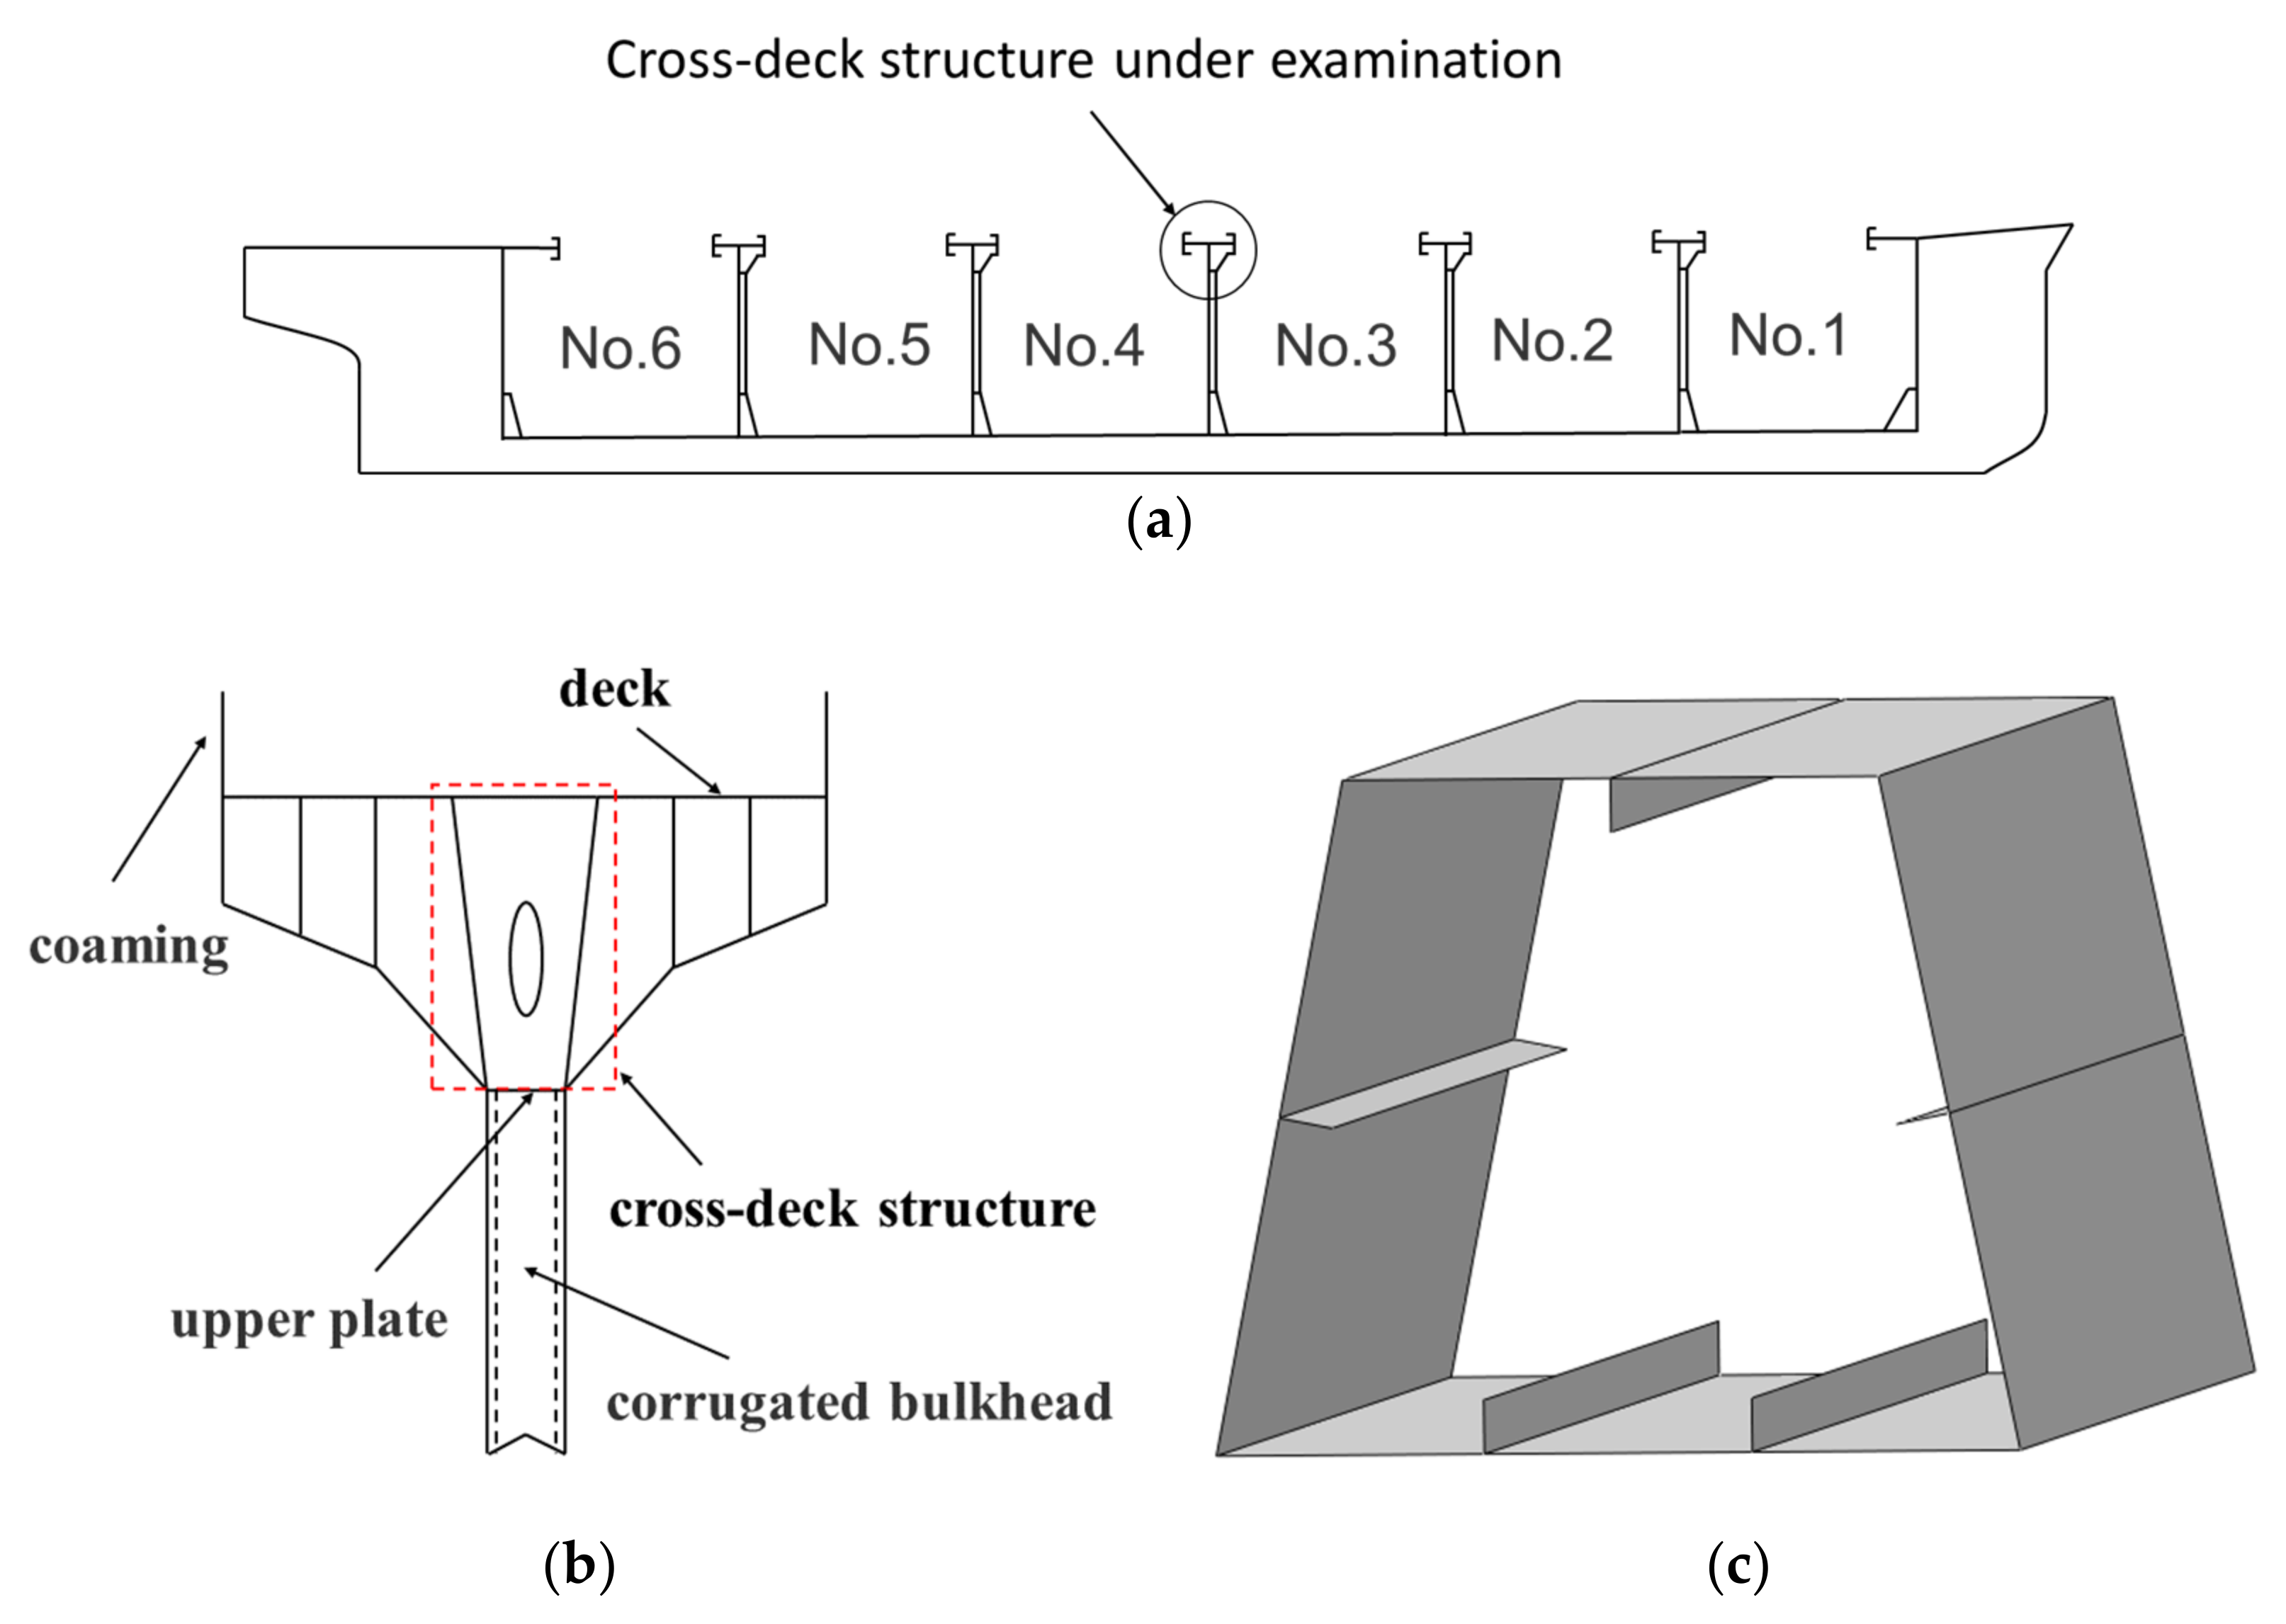
2.1. Cross-Deck Structure

The cross-deck structure is designed to avoid tearing caused by the direct welding of the bulkhead to the deck. The cross-deck structure is usually located between the transverse bulkhead and hatch coaming, and its structure mainly includes inclined plates and vertical plates. The typical structural arrangement is illustrated in Figure 1a,b.
In this paper, the cross-deck structure is simplified as a box girder structure for ultimate strength test consideration. The parametric model of the box girder is established for finite element simulation. The model of the box girder structure is shown in Figure 1c. This framework introduces tests to improve the precision of reliability analysis. A test specimen, shown in Figure 1c, is produced for the ultimate strength test, and the details of the test specimen are listed in Table 1.

2.2. Efficient Probabilistic Simulation and Bayesian Update

An ultimate strength surrogate model based on the Kriging method of the cross-deck structure is introduced based on the response values of structural strength simulations. The response values are obtained by the finite element method, which is applied with parametric modeling. It is necessary to conduct a precision check for the Kriging surrogate model through random sampling. The stochastic distribution data of ultimate strength are obtained through random sampling by the Monte Carlo method of performance function. However, the result of probabilistic simulation is based on prior estimate simulation, leading to a deviation from actual performance. Hence, it is necessary to introduce Bayesian updating to modify the distribution parameters with the box girder test results. The flow chart of the framework is illustrated in Figure 2. As shown in the flow chart, the probability simulation part and experiment part start in parallel, and the experiment part provides data for Bayesian updating.

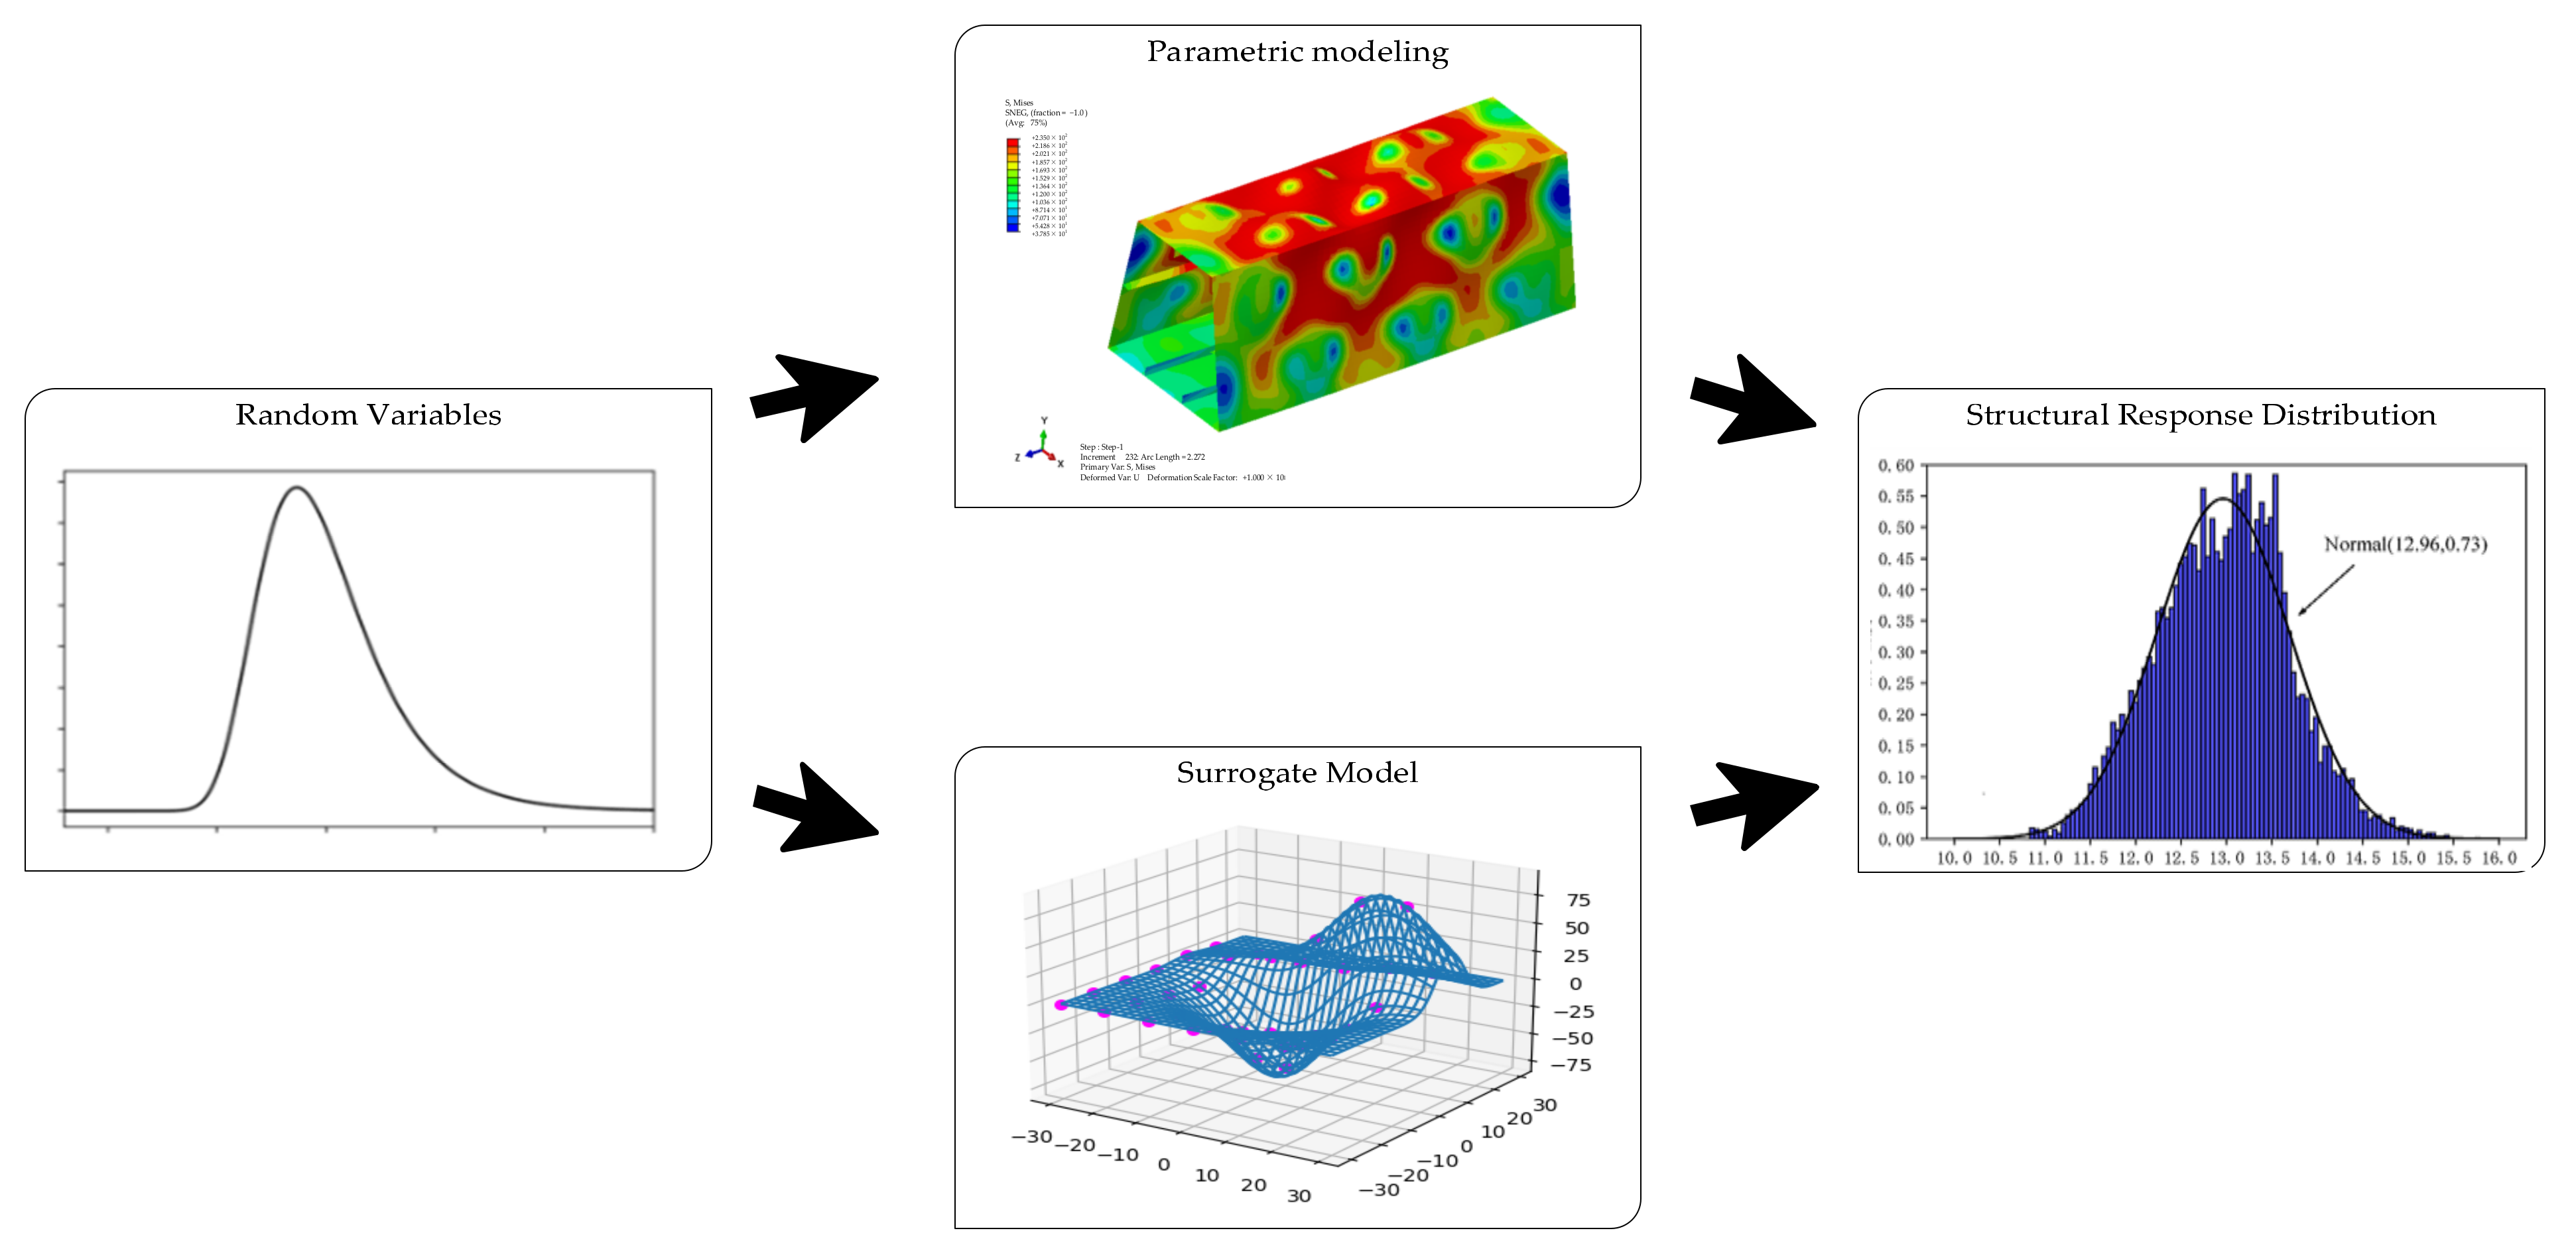
3. Efficient Probabilistic Simulation

With the improvement of simulation tools, the reliability analysis method has also changed from numerical analysis to simulation. For complex structures, it is difficult to obtain efficient solutions with probabilistic simulation. This section introduces the Kriging-assisted probabilistic simulation method for the box girder.

3.1. Probability Parametric Modeling

Referring to the research of Zhu et al. [21], in order to understand the influence of model parameters on the ultimate bearing capacity of the box girder, the plate thickness t p , Young’s modulus E p , stiffener height h s , and stiffener thickness t s of the stiffened panels are studied as random variables. The ultimate strength distribution of the box girder model is obtained from probabilistic simulation. In Table 2, values of mean are given on the basis of the test specimen. The distribution type and coefficient of variation are selected according to the study of Zhu et al. [21].
There are some commonly used sampling methods, such as Monte Carlo sampling, optimal Latin hypercube sampling, uniform sampling, and Hammersley sequence sampling. The optimal Latin hypercube sampling is widely used because of its good spatial uniformity and projection uniformity. This study adopts this method to sample the random variables in Table 2 as experimental points and test points, respectively. The sampling interval of each variable is μ 3 σ , μ + 3 σ , where μ is the mean of the variable and σ is the standard deviation of the variable. The number of sampling points is 50.
For a large number of experimental design points generated by sampling, manual finite element modeling will be inconvenient. When the finite element modeling process is the same but the characteristic parameters are different, the parametric modeling can be performed by modifying the characteristic parameters with code. Parametric modeling has a significant effect on reducing the workload. In this study, the development of Abaqus based on Python can realize the automation of a series of finite element analysis. Figure 3 shows the calculation result of the ultimate strength of the box girder model.

3.2. Surrogate Model

The response data y 1 , y 2 , , y n of the ultimate strength obtained by the parametric modeling of the finite element are used as the experimental points to construct an approximate surrogate model for ultimate strength by the Kriging method. The surrogate model schematic diagram is presented in Figure 4. Referring to the works of Sacks et al. [22] or Simpson et al. [23], the Kriging method used is ordinary Kriging, where f f x is approximated by:
f f x   f f   ˜ x = F + Z x  
where F is an estimator, Z(x) is a local error term specific to each design point in the independent variable space, and x is a vector variable describing a design point in the independent variable space.
The relationship of the plate thickness t p , Young’s modulus E p , stiffener height h s , stiffener thickness t s , and ultimate strength can be constructed through the surrogate model. In order to verify the accuracy of the surrogate model for calculating the ultimate strength, the experimental test points are used to carry out the accuracy analysis. Using experimental test points as input, we compare the calculation results based on the finite element and surrogate model and calculate the root mean square error. The construction of the surrogate model is completed only when the error is less than the specified value. Figure 5 presents the error distribution of the experimental test points. It can be seen from the figure that, compared with the results of the finite element calculation, the mean square error of the surrogate model is 0.170, and the maximum error is 0.56%. In summary, the accuracy of the surrogate model is sufficient.

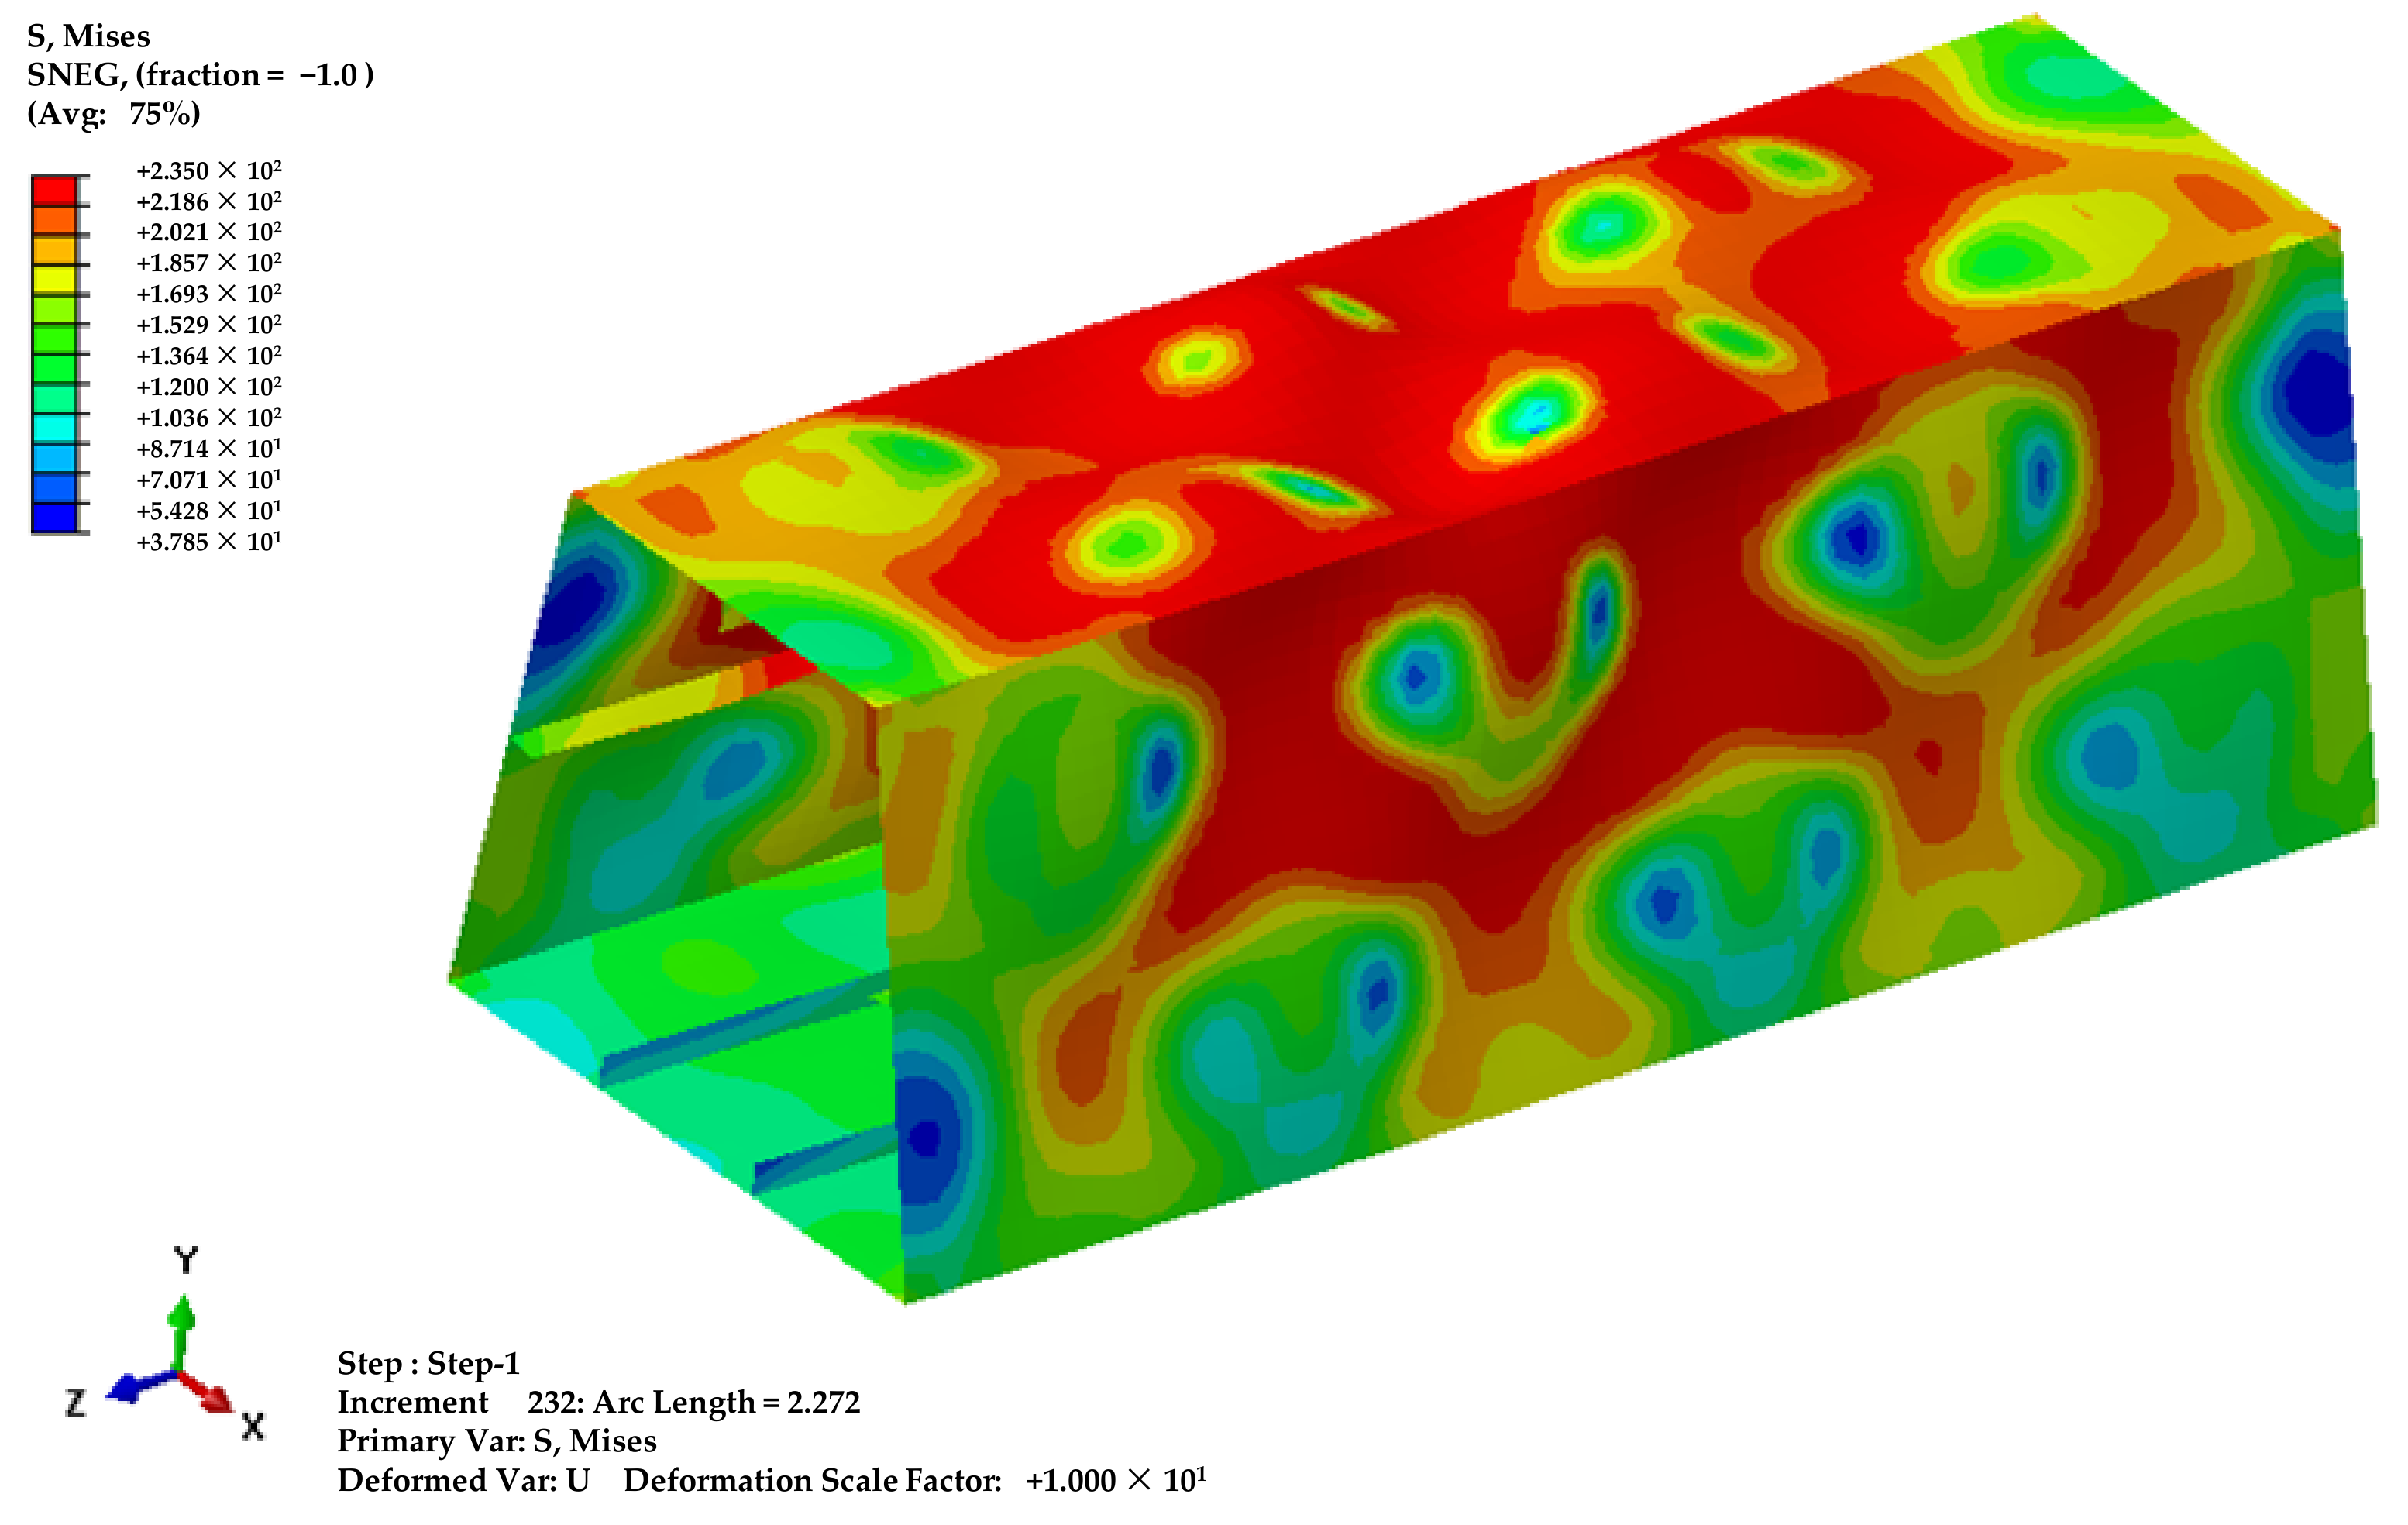
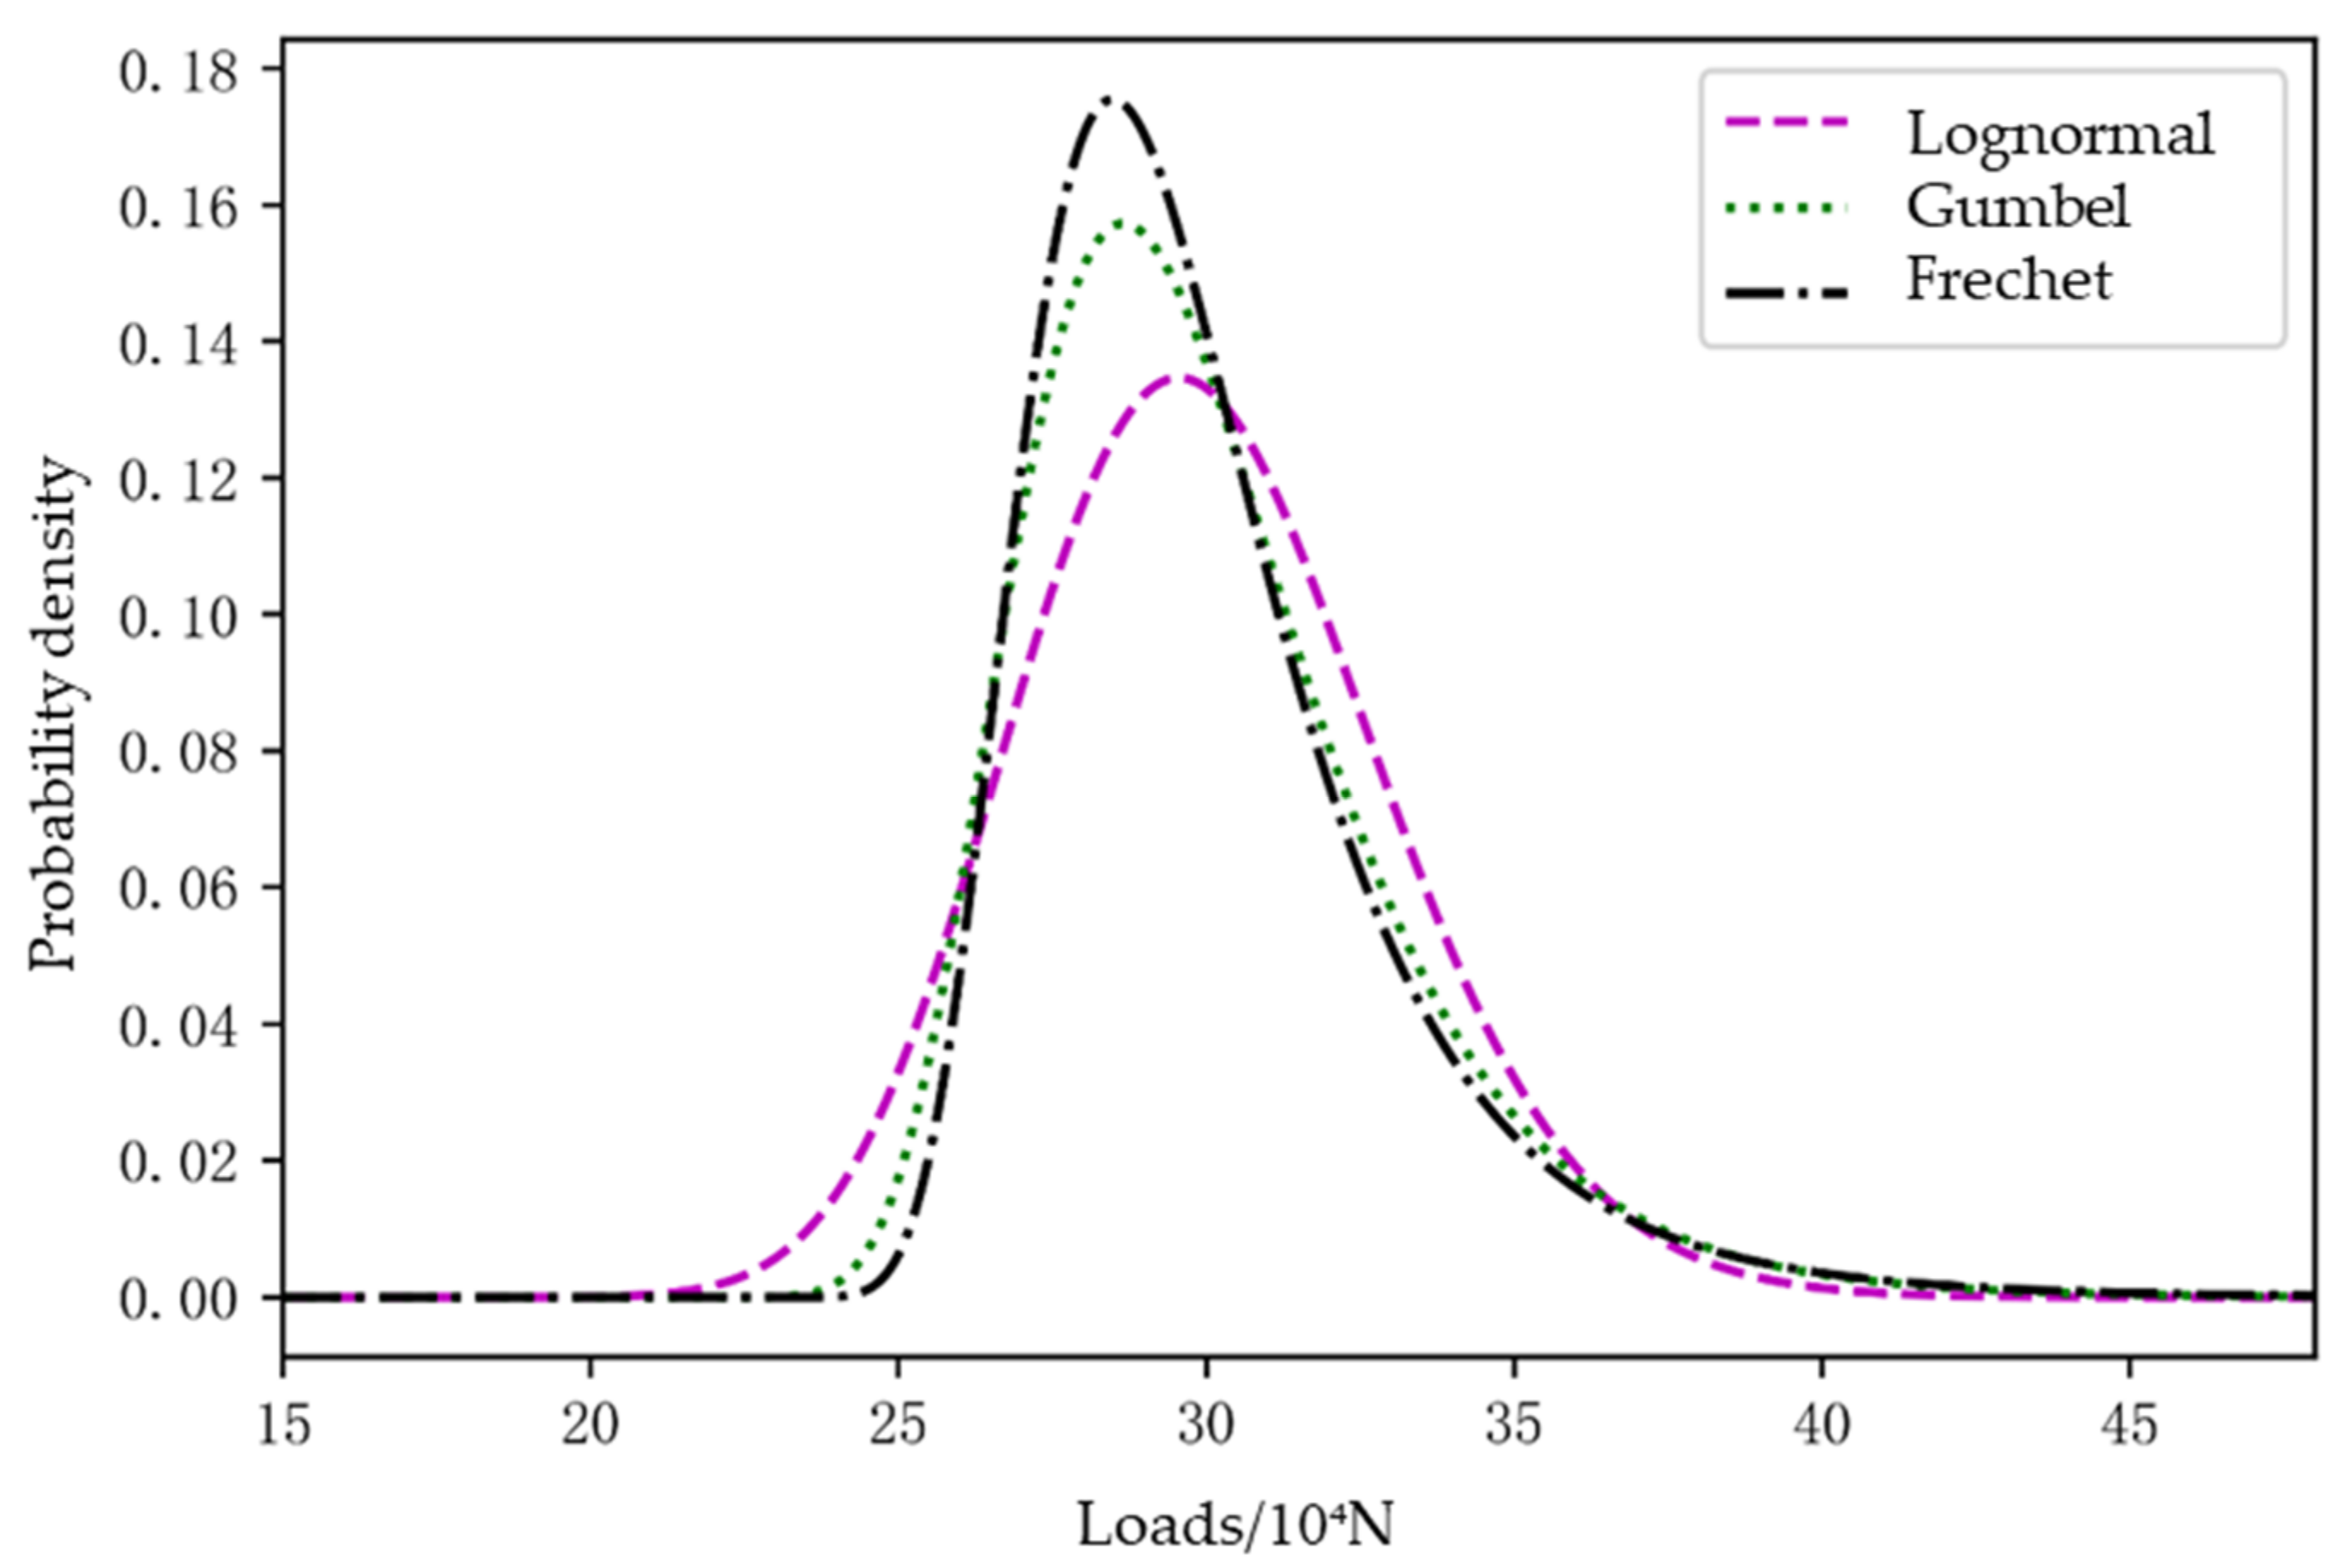
3.3. Ultimate Strength Uncertainty Quantification

After establishing the ultimate strength surrogate model of the box girder structure and verifying its accuracy, the Monte Carlo method is applied to sample random variables and calculate the response value through the surrogate model. Finally, the sampled response values are fitted to a normal distribution. The mean of the fitted distribution is 8.578 × 10⁵ N, and the standard deviation is 3.97 × 10⁴ N.

4. Test of Box Girder Structures for Ultimate Strength

4.1. Test Specimen and Test Purpose

The test specimen is processed on the basis of the model shown in Figure 1, a box girder structure. The processing is performed according to specifications [24] formulated by the China Classification Society.
The failure mode is affected by the load characteristics, material mechanical properties, and structural size, and these factors have different distribution characteristics. Therefore, the structural reliability analysis of the cross-deck structure needs to explore the failure signature under the design load and the failure path of the structure firstly. Hence, the purposes of the test include the following:
  • To obtain the failure path of the structure;
  • To obtain the influence characteristics of uncertain factors;
  • To verify the reasonability of the selection of reliability analysis parameters.

4.2. Test Process

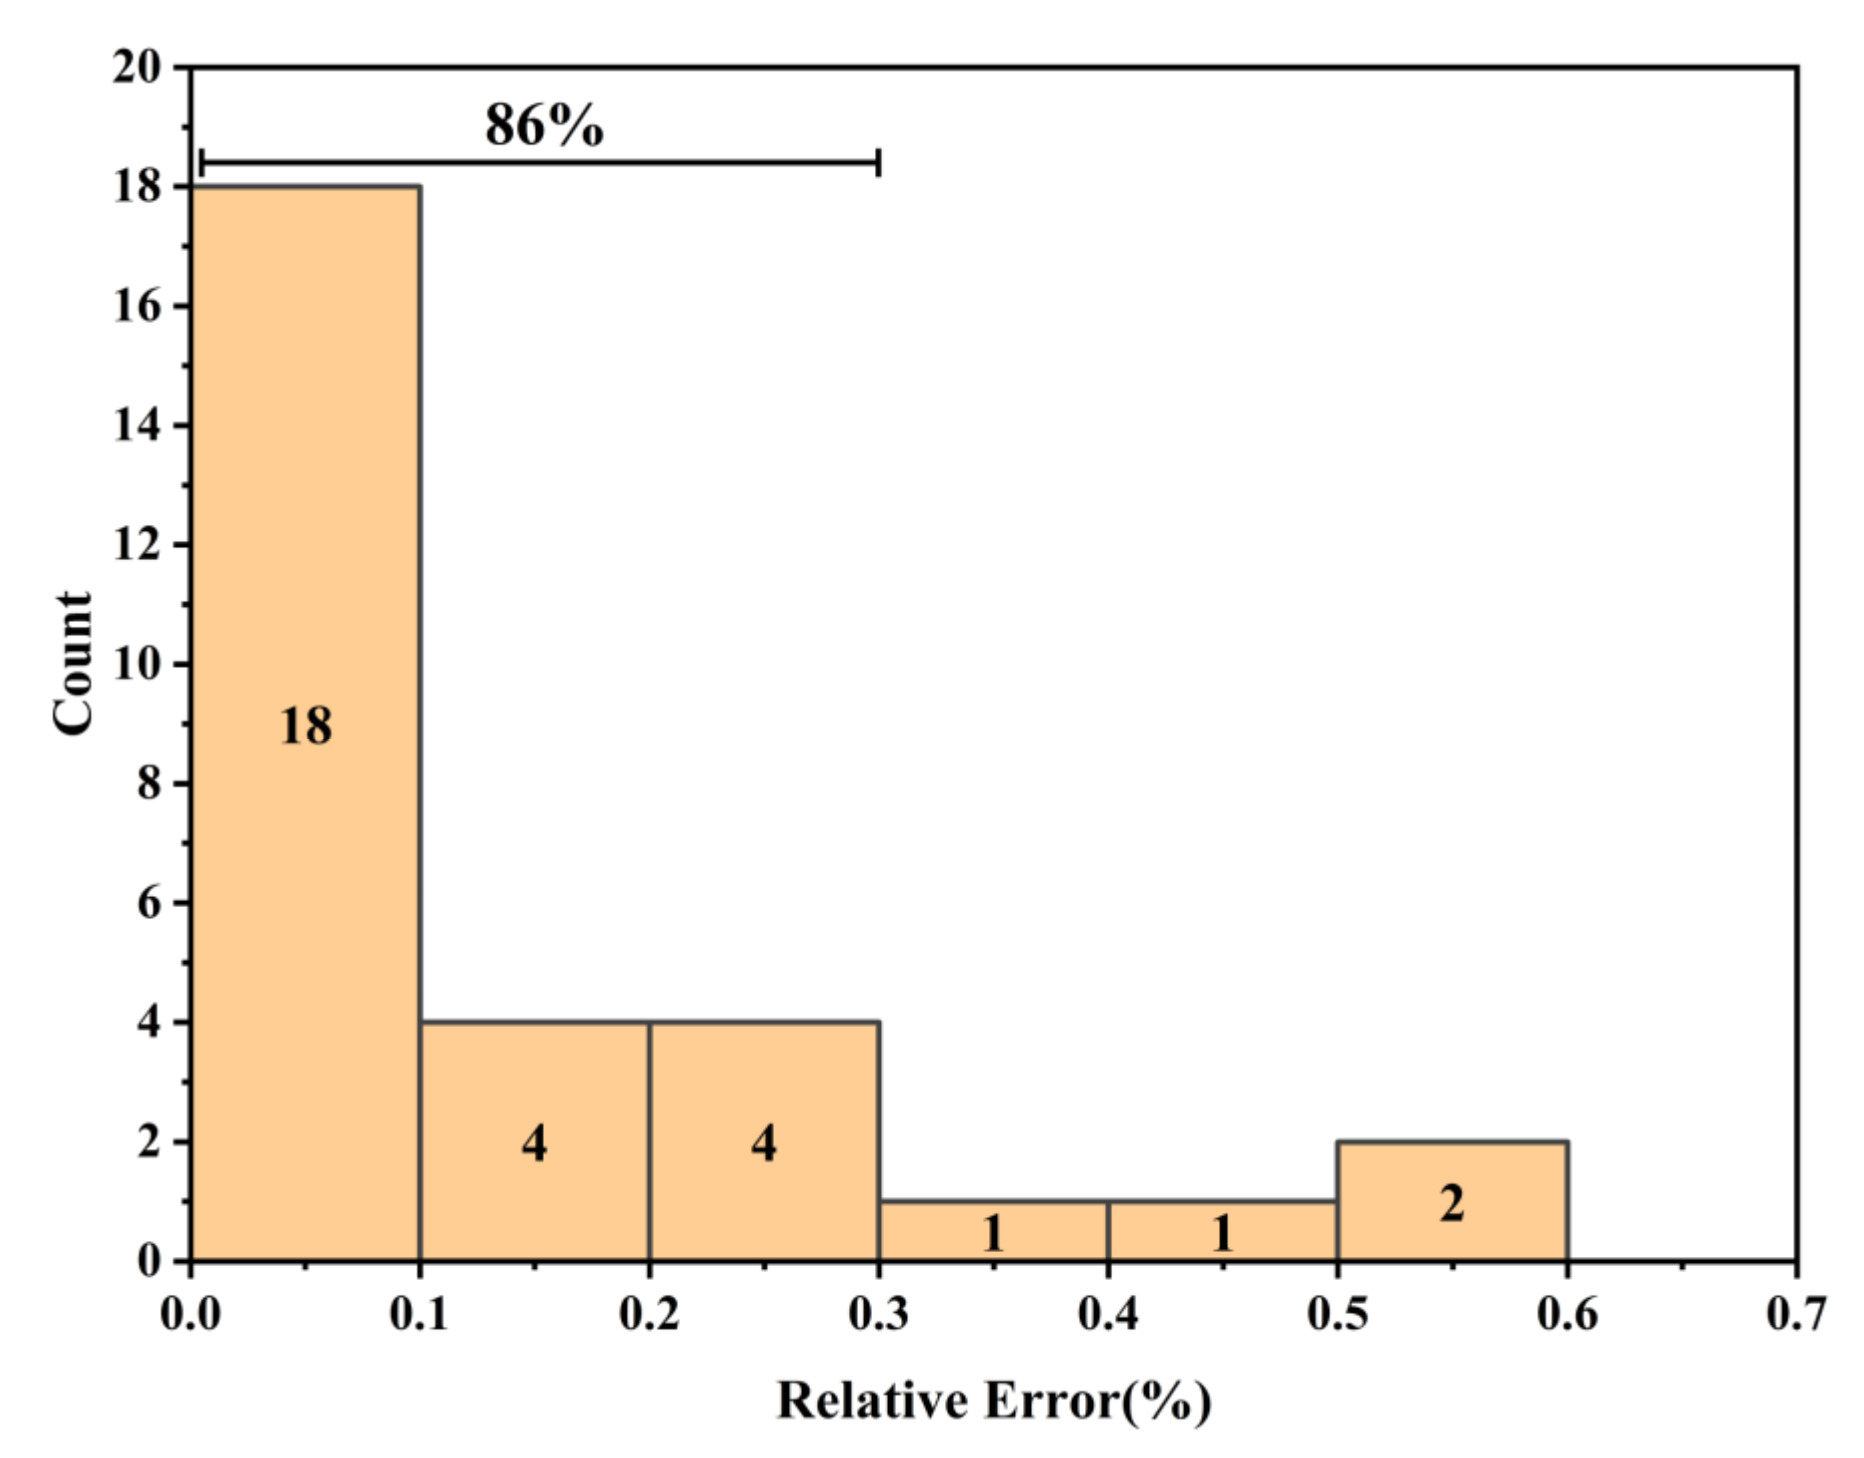
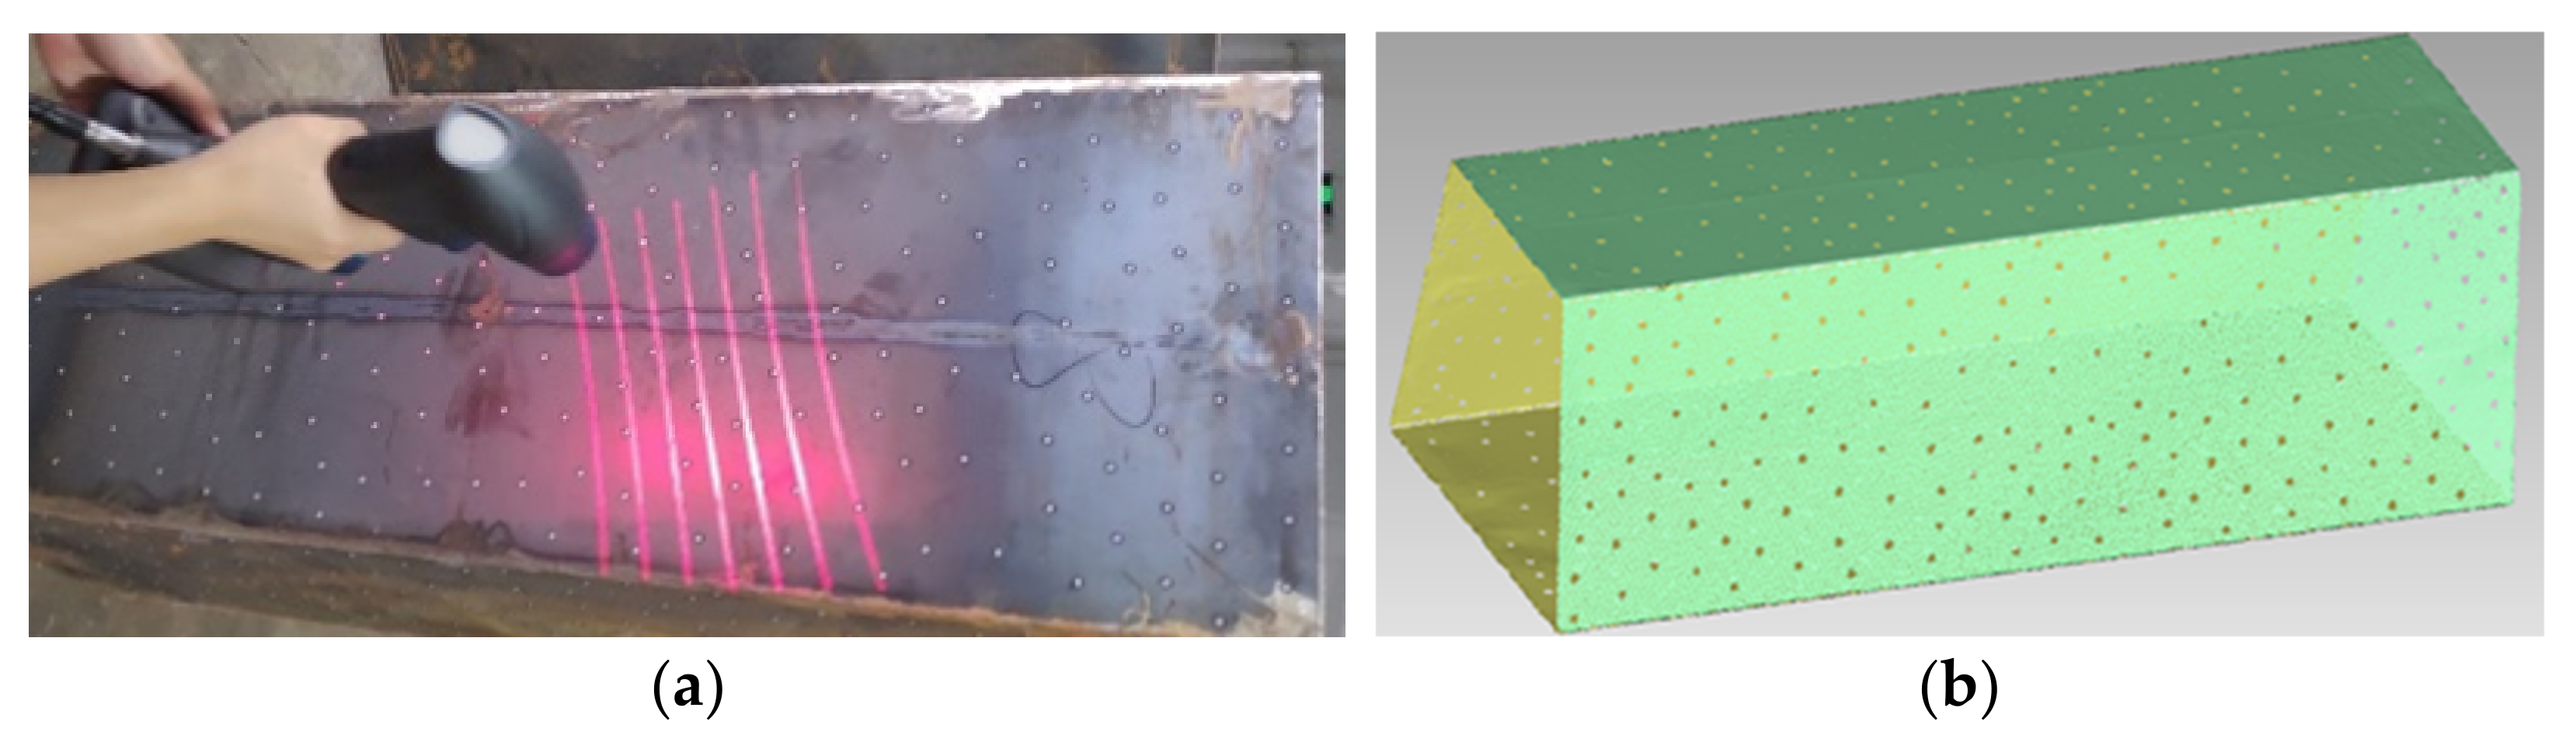
4.2.1. Initial Defect Measurement

It is difficult to avoid initial defects during the cutting and welding process of steel plates. The initial defects have significant impacts on the ultimate strength. Hence, it is necessary to conduct initial defect measurement before the test. The traditional measurement method has the problems of low precision and complicated operation. Therefore, a handheld laser 3D scanner is introduced. The handheld laser 3D scanner positioning technology is able to provide high-precision 3D scanning results, not subjected to dimension, material, and color, etc. The scanning results of the specimen are shown in real time on the computer during the scanning process. The handheld scanner and scanning results are illustrated in Figure 6.

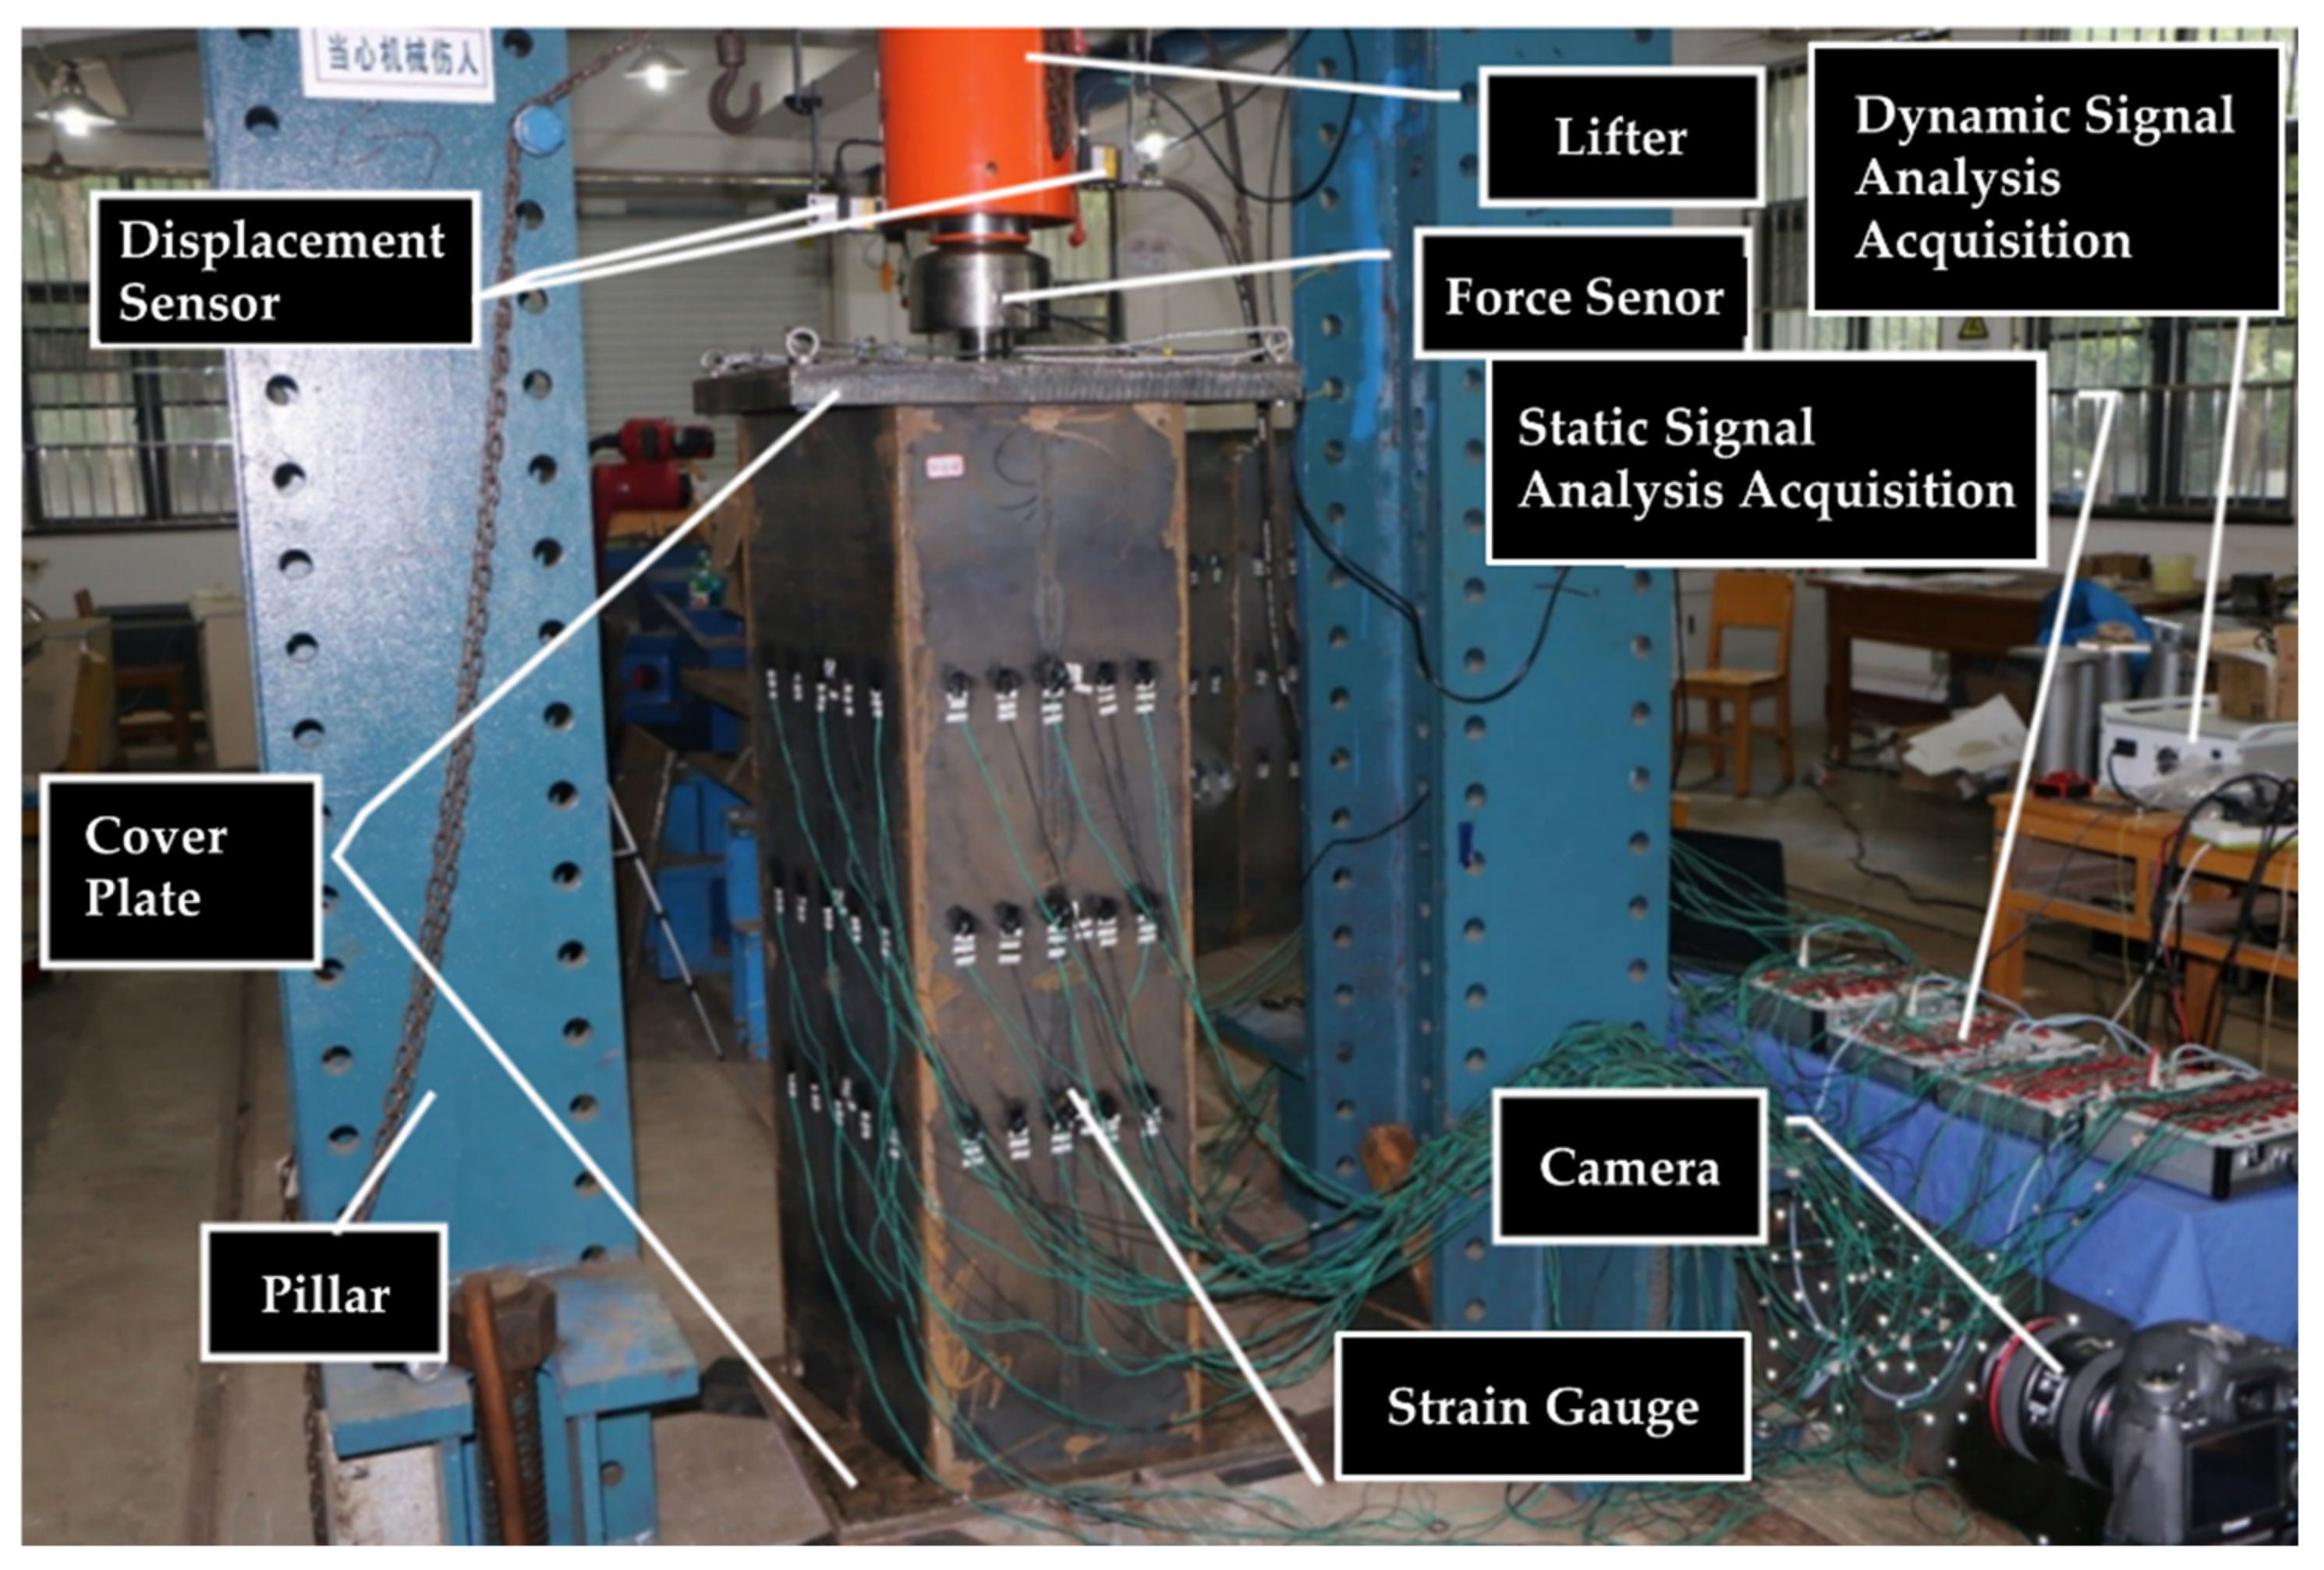
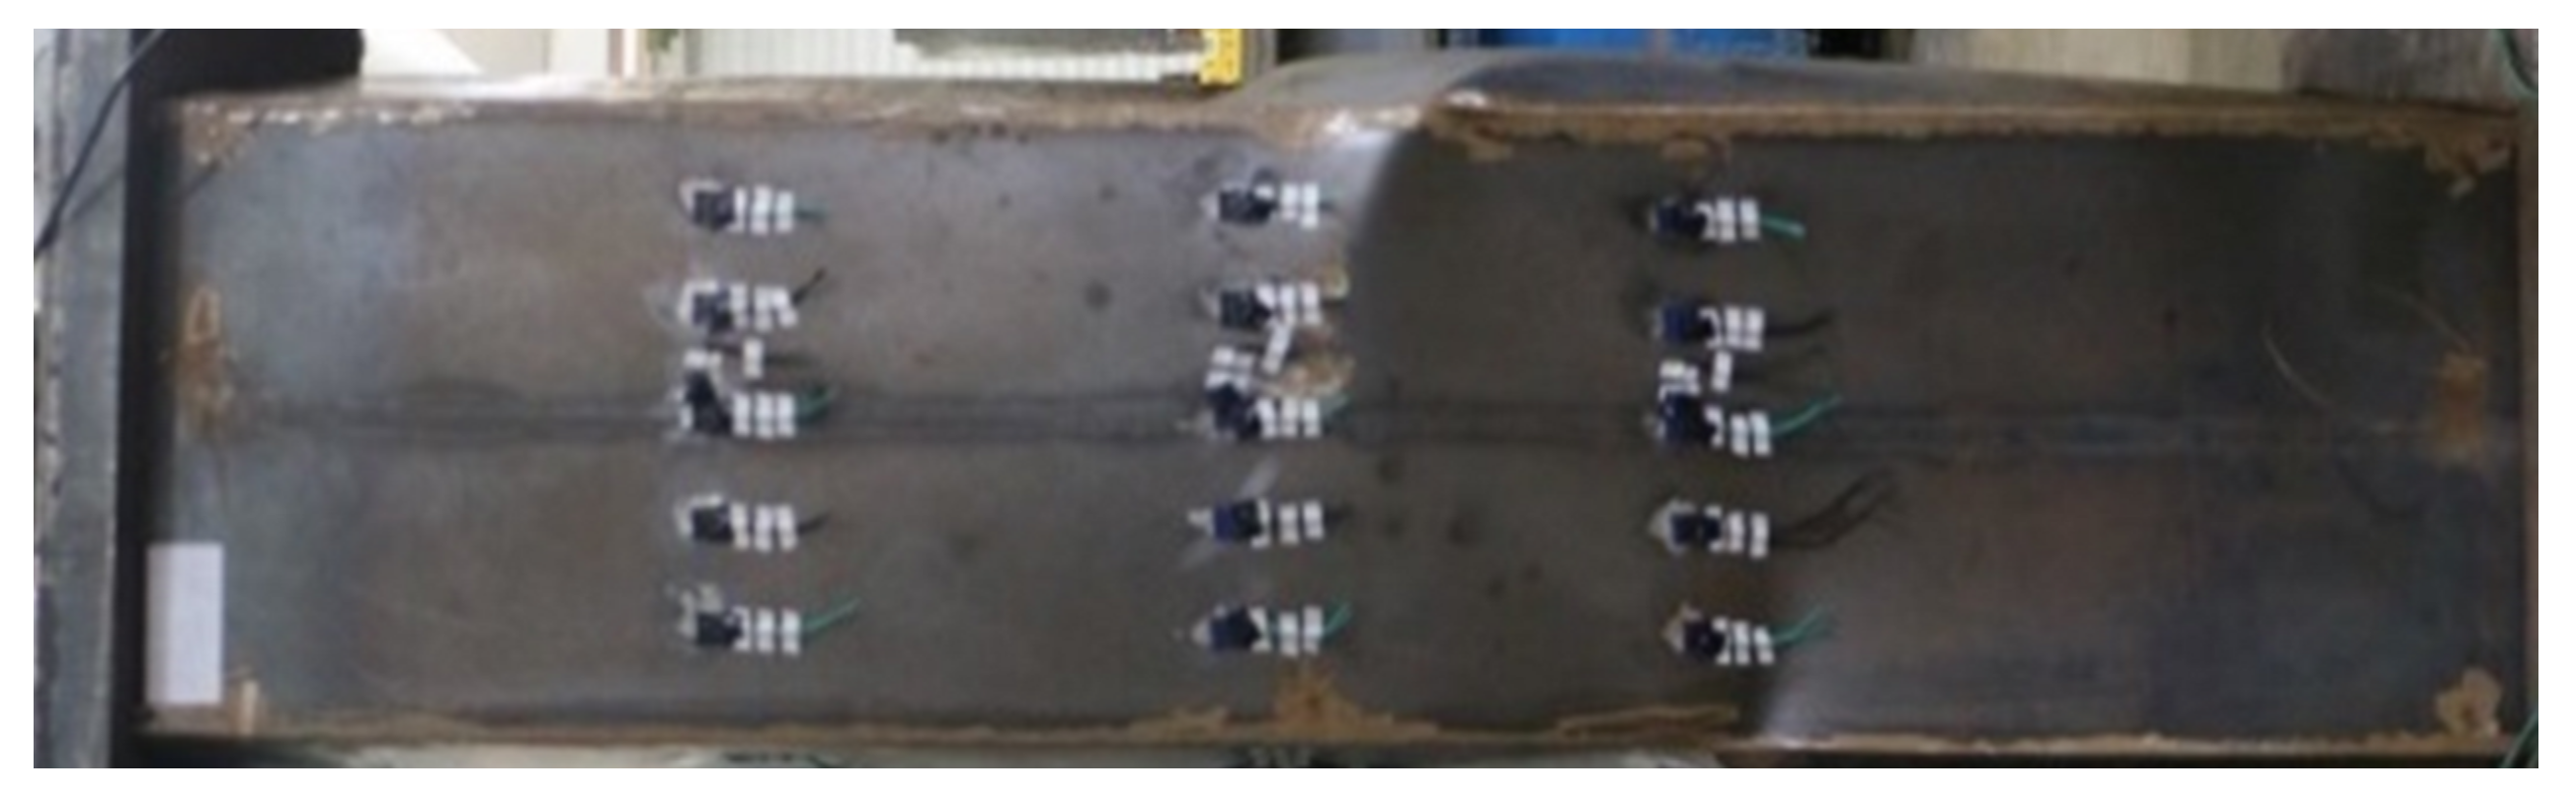
4.2.2. Test Equipment

The test equipment is shown in Figure 7. A hydraulic jack, displacement sensor, force sensor, and cover plate are arranged from top to bottom.
Two special upper and lower cover plates are designed, and the thickness of the plates is 50 mm. The cover plates are provided with grooves with a depth of 10 mm. The width of the grooves is slightly larger than the thickness of the box girder plates and stiffeners. The grooves of the upper and lower cover plates are used to hold both ends of the test specimen, and the force is evenly transmitted to the specimen through the cover plate at the upper end.
The force sensor is fixed between the top of the hydraulic jack and cover plate to measure the axial load on the model. Two laser displacement sensors are arranged symmetrically to measure the axial displacement of the specimen. At the same time, a camera is placed outside each surface of the model to record the deformation process of the specimen during the test.

4.3. Credibility of Test

We apply an axial compressive load to the box girder structure and measure its structural displacement. When the load is increased to 603 KN, the box girder structure is obviously deformed, as shown in Figure 8. Meanwhile, the force sensor values drop, indicating that the structure has been buckling.
A total of 8 sets of box girders are manufactured and tested. Load–displacement curves for a test specimen (No. 7) and the ultimate strength load of 8 sets are illustrated in Figure 9. The displacement takes the average of the two laser displacement sensors’ values. The curves show that the test results are convincing, indicating the credibility of the test design, tooling, and loading process.

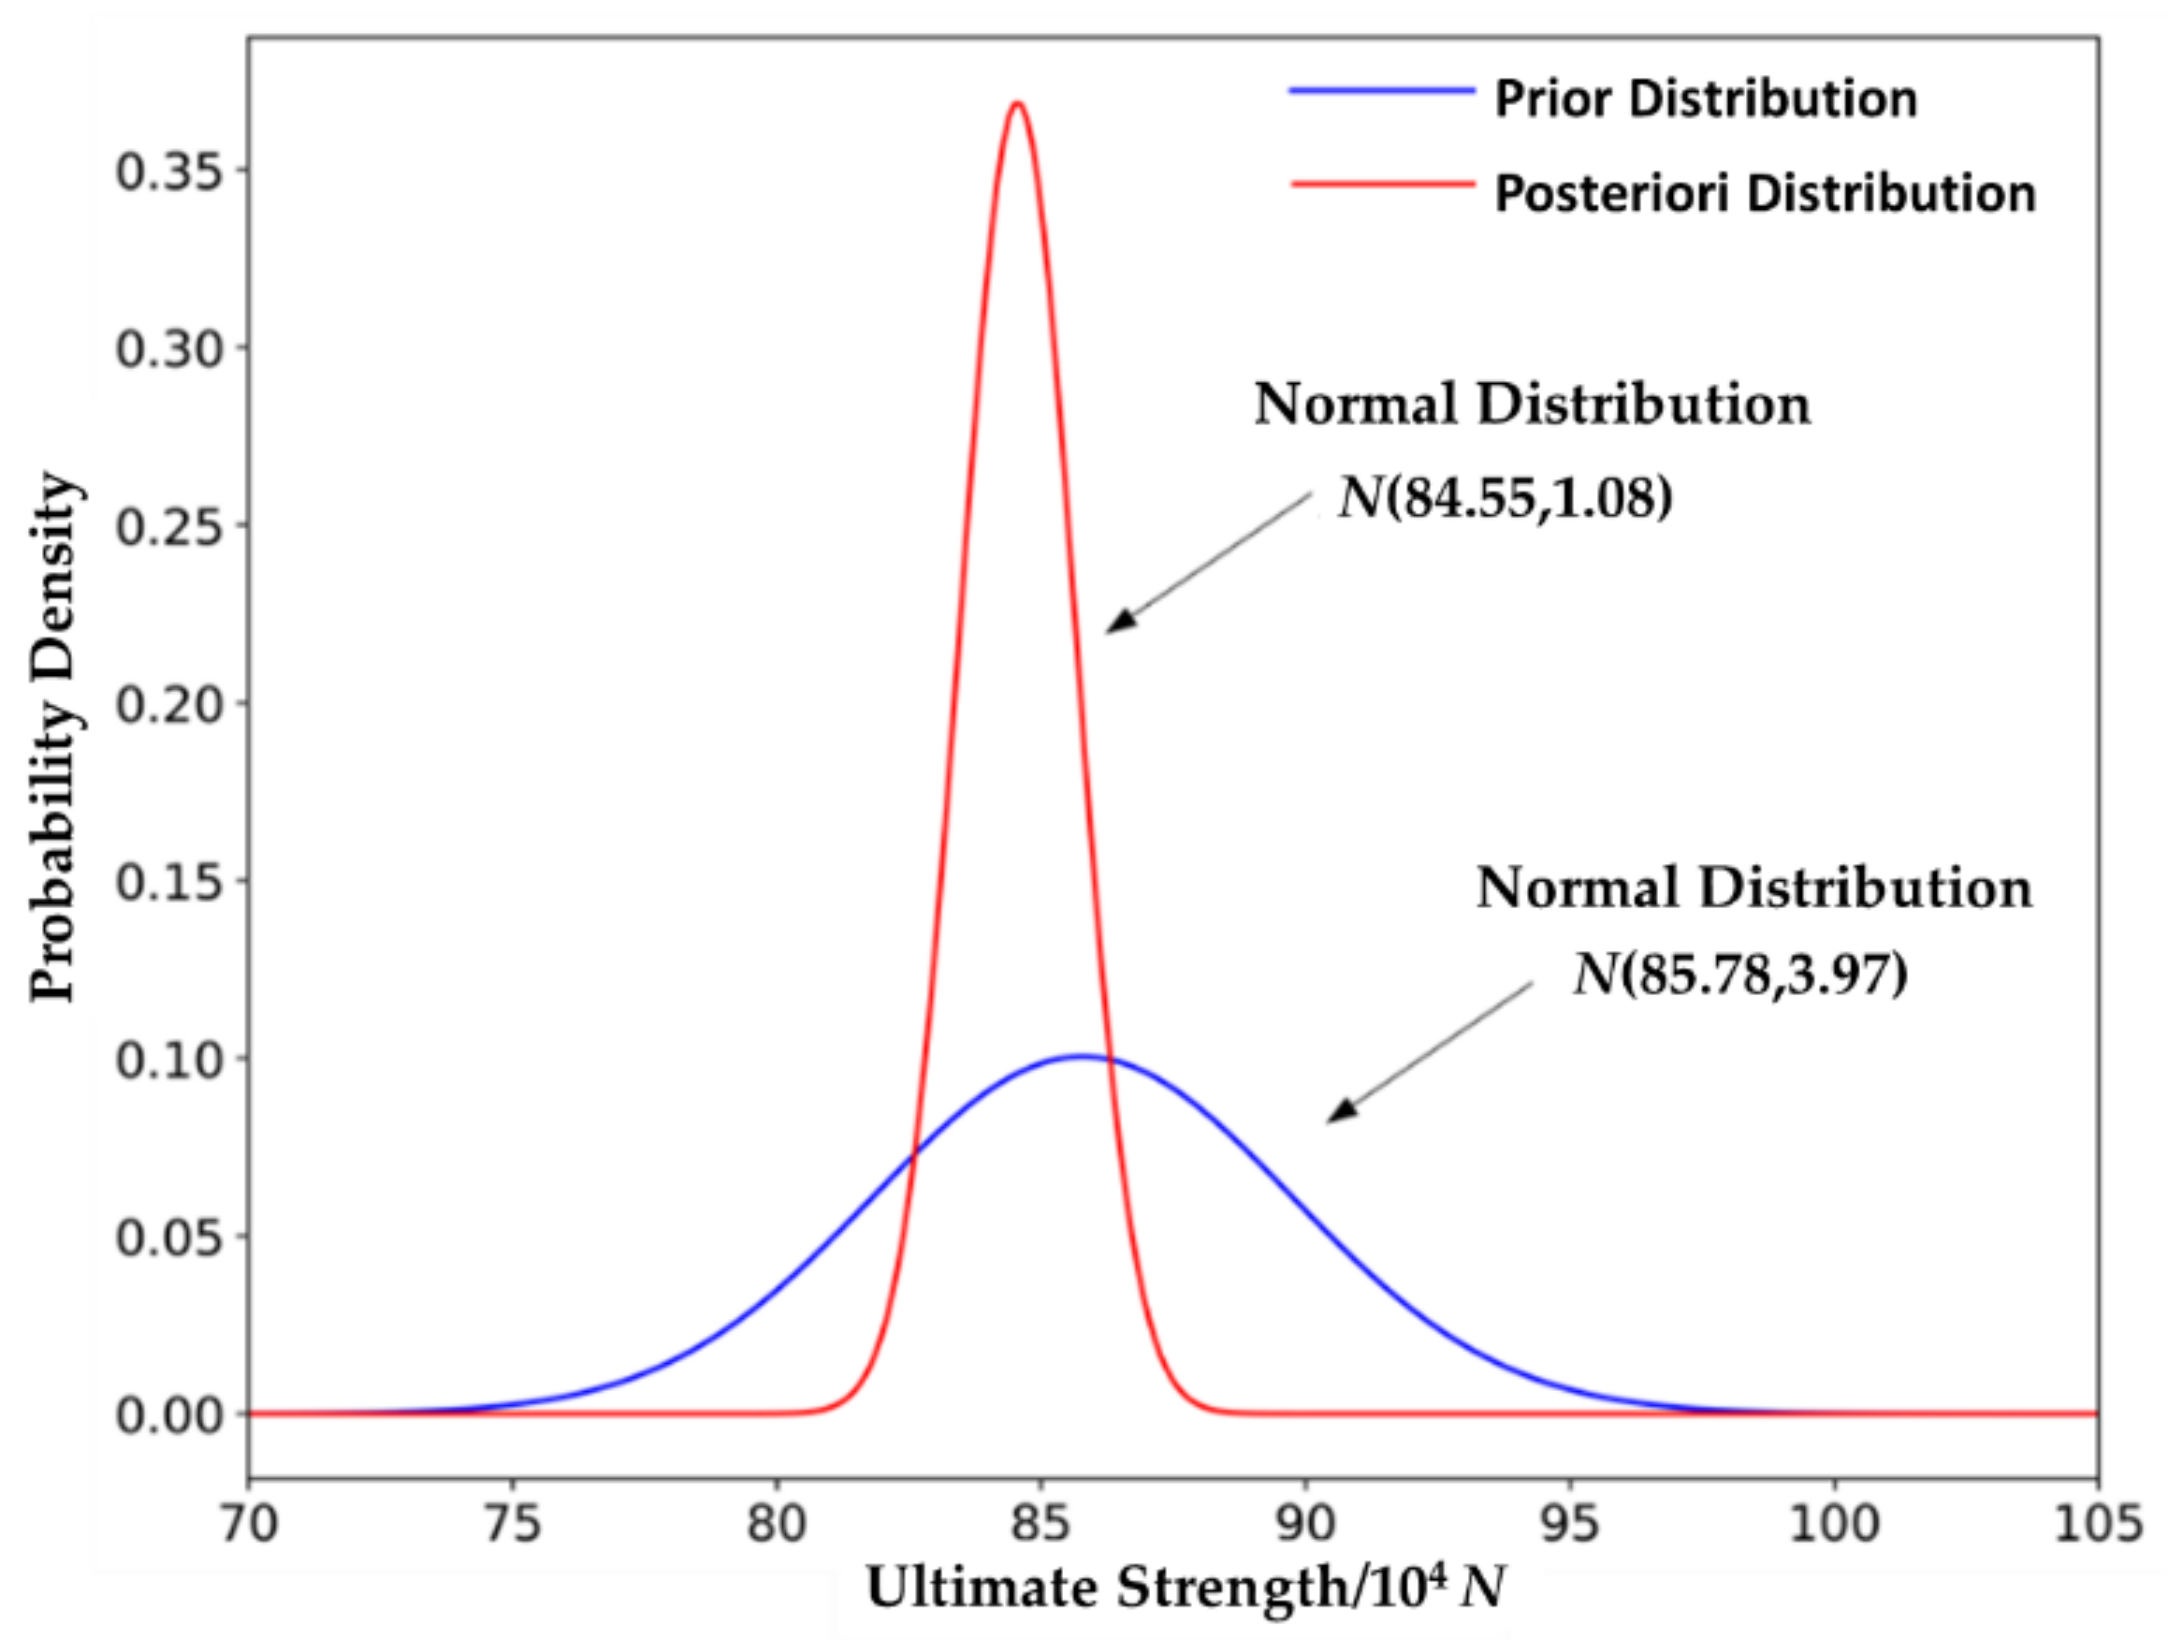
4.4. Data Fusion Using Bayesian Updating

The result of probabilistic simulation based on prior distribution is updated with test data. Test data fusion based on Bayesian updating improves the credibility of the results significantly. The Bayesian formula is the foundation of Bayesian updating, as shown below:
f θ | x = f ( x | θ ) f θ f x
where the parameter θ is a continuous variable:
f x = + f ( x | θ ) f θ d θ
The parameter θ = θ 1 , , θ k is a k × 1 vector, and k is the dimension of θ . The parameter x = X 1 , , X n is a n × 1 vector, and n is the number of stochastic variables X i . f θ in Equation (2) is the prior distribution, which is obtained by probabilistic simulation. f ( x | θ ) is the conditional probability distribution of X under given parameter θ , which can be obtained through test data. The formula of f ( x | θ ) is illustrated as follows [25]:
f x | θ = j = 1 m 1 2 π σ · exp 1 2 x j x ^ σ 2
where x j and x ^ are the j th experimental data and expected value, σ is the standard deviation of the statistical data, and m is the number of experimental data. As shown in Figure 10, the distribution after Bayesian updating is more centralized than the previous distribution.

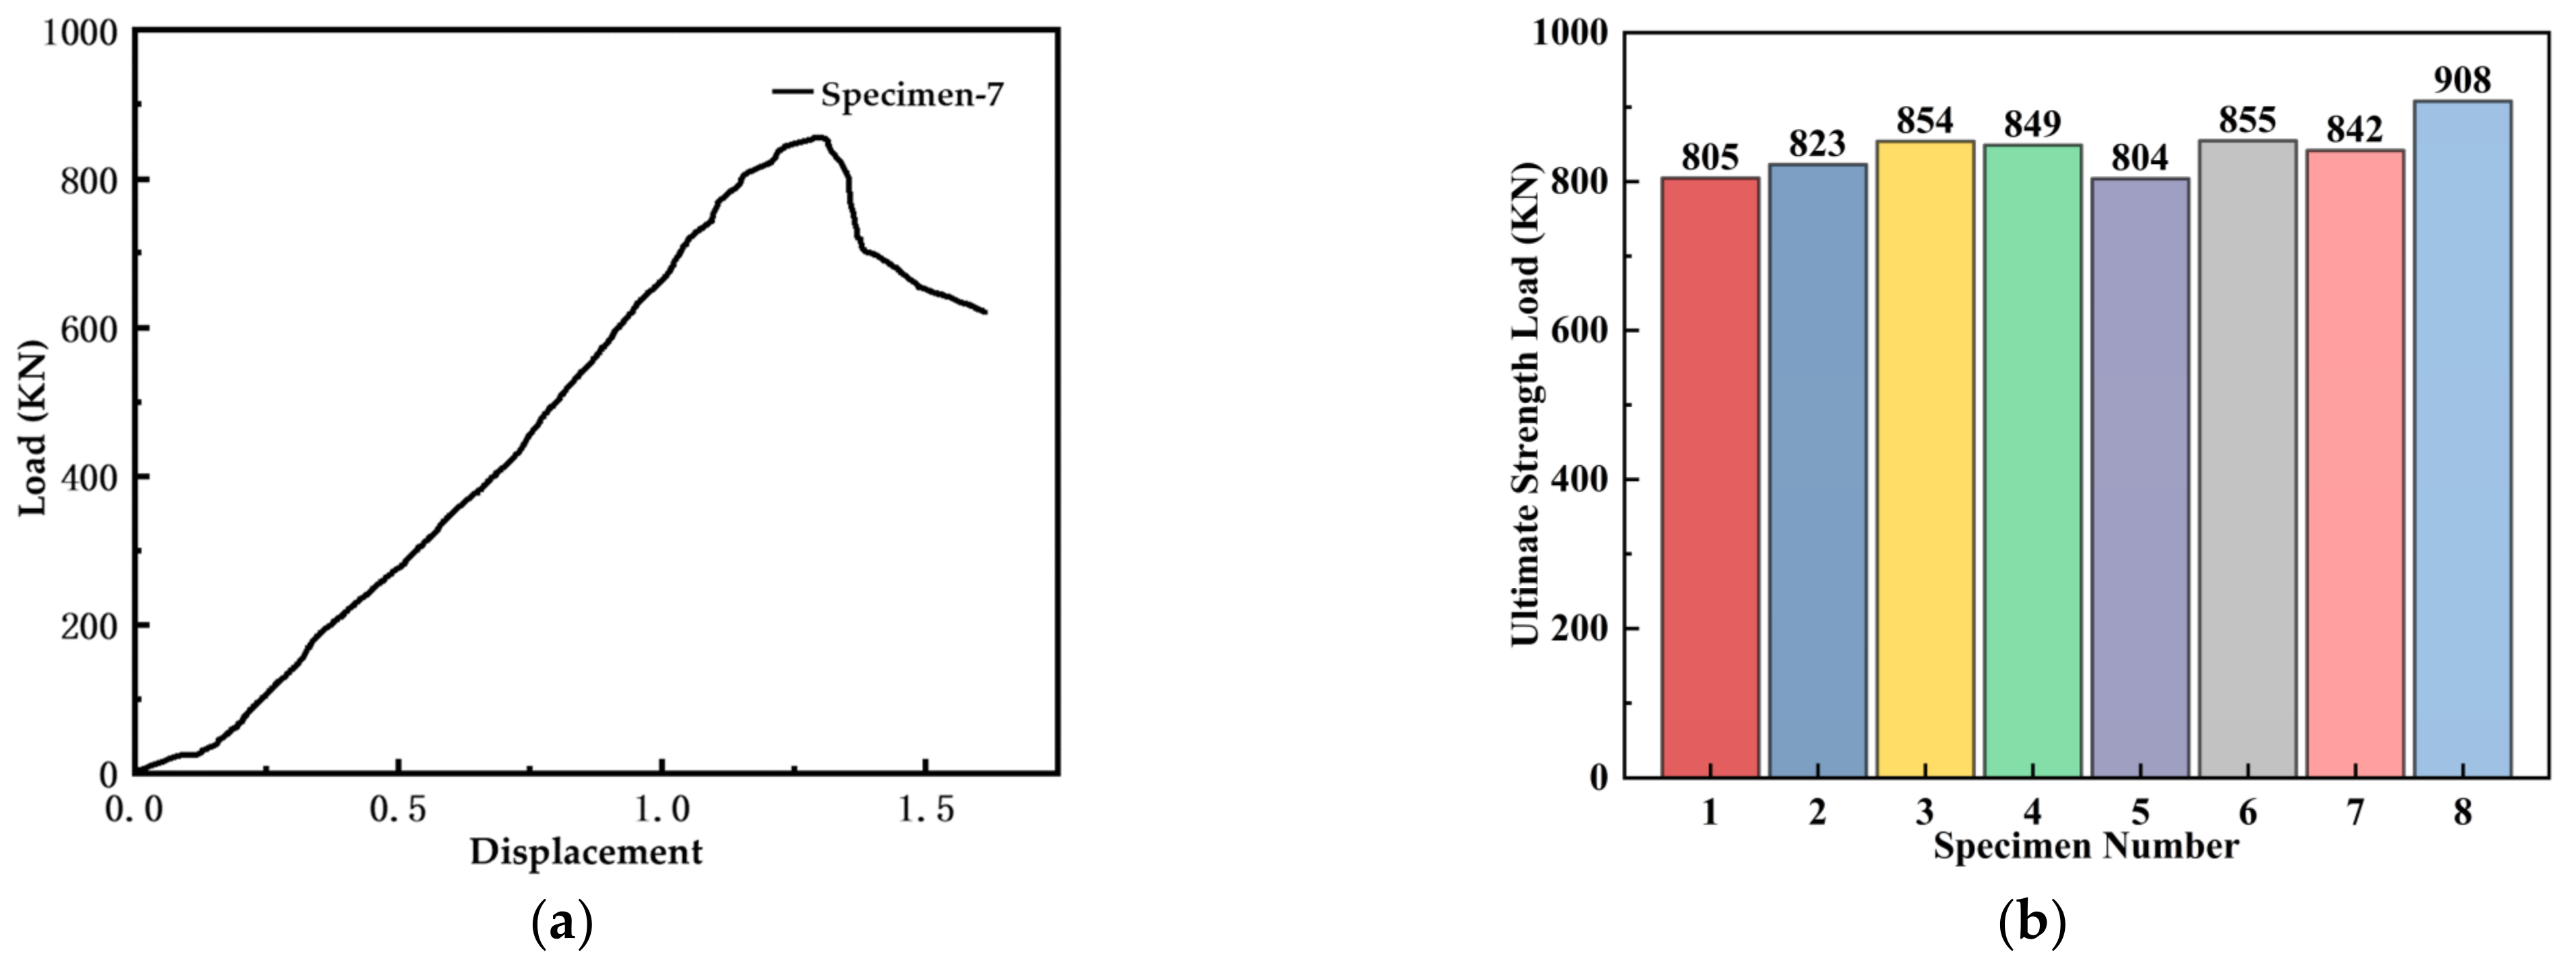
4.5. Analysis of Test and Comparison with Simulation

The initial defect has a great influence on the ultimate strength. The ultimate strength decreases with the increase in the initial defect. Therefore, the deformation caused by welding should be minimized as much as possible during processing. Insufficient stiffness of the upper and side plates is the main reason for the failure of the entire structure. Increasing the thickness of the upper and side plates appropriately is suggested when designing a trapezoidal section box girder. The buckling failure mode and ultimate strength of the test and simulation are anastomotic. The accuracy of the finite element method used in this framework is confirmed by the test.

5. Reliability Analysis

The purpose of this study is to assess the reliability of the cross-deck structures through reliability analysis. Generally speaking, the structural reliability analysis process can be divided into three parts. Firstly, we determine the distribution probability and related statistics of structural random variables X = x 1 , x 2 , , x N . Secondly, we establish the limit state equation G X of the structure. When G X < 0 , it means that the structure fails. Finally, we calculate the probability that G X < 0 is the failure probability P f of the structure. The main methods of reliability analysis are the first-order reliability method, the Monte Carlo simulation method, and Response Surface Methodology. In this work, the first-order reliability method will be used.

5.1. Limit State Equation

Considering the yield failure of the structure under lateral compression, the limit state equation of the box girder structure is defined as follows:
G X = F F c d
where F is the ultimate strength of the box girder structure, which is related to the shape, size, material properties, and boundary conditions of the box girder structure. It can be obtained by probabilistic simulation with the stochastic finite element method or Bayesian update with experimental data; F c d is the lateral load force on the section of the box girder structure, which is affected by factors such as the hull structure, cargo load, still water load, and wave load. It can be obtained by formula derivation.
With the knowledge of the probabilistic distribution function of yield loads and resistance for the box girder structure, the probability of ultimate yield failure of the structure can be assessed as:
P f X = P G X < 0 = Φ β
where Φ is the standard cumulative normal distribution function, P f is the probability of occurrence of the event G t < 0 , and β is the reliability index.

5.2. Load Design

Referring to the article [21], the lateral load force F c d of the box girder structure is affected by the hull structure, cargo load, still water, and wave load. However, due to the lack of information on cargo loads, still water load, and wave load, this paper adopts the method of assuming loads. Figure 11 shows the probability density distribution of three different distributed loads under consideration.

5.3. Local Safety Factor Calculation

In this study, the local safety design criteria for the box girder are:
γ s F c d F γ r
where γ s , γ r are the Partial Safety Factors for load and the Partial Safety Factors for resistance, respectively. F c d , F are the average values of load and resistance, respectively. The relationship between these parameters is shown in Formulas (8)–(10):
K = γ r · γ s
where K is the local safety factor of the box girder structure,
γ r = 1 K R u μ R u C . O . V R u 1 0.75 β C . O . V R u
γ s = 1 + 0.75 β C . O . V S e 1 + K S e μ S e C . O . V S e
where β is the reliability index obtained by the reliability calculation method. The C . O . V R u and C . O . V S e are the coefficients of variation of resistance and load, respectively. K R u takes the value that makes the characteristic resistance R u k equal to the 5th percentile of the resistance distribution. K S e takes the value that makes the characteristic loading effect S e k equal to the 5th percentile of the loading distribution. Table 3 shows the various coefficients and local safety factors under different load distributions and parameters.

6. Discussion on Limitations of Framework

Although this framework presents a comprehensive reliability analysis of practical ship local structures through the combination of testing and probabilistic simulation, several limitations of the framework have to be recognized.
The test is built on a scaling model and not a real cross-deck structure because of the high cost and difficulties of a full-scale ship structure test. Secondly, reliability results can be affected by the choice of probabilistic distribution type and parameters, such as those listed in Table 2. Moreover, a probabilistic load is assumed in the framework. An axial load is considered in the test, while more complex loading conditions can arise in real situations. Thus, it must be noted that these limitations should be taken into consideration before applying this developed framework to ship local structures.

7. Conclusions

The ultimate strength experiment and FEM analysis indicated that the stiffness insufficiency of the upper and side plate is the main reason for the failure of the box girder structure. The thickness of the upper and side plate should be increased appropriately for more capable designs. The high fitness of results on the buckling failure mode and ultimate bearing capacity between the experimental and numerical models reveals the accuracy of the FEM. For model calculation, initial defects lead to a decline in the ultimate strength value. Hence, the deformation caused by welding should be controlled as far as possible during component processing.
The reliability study of a cross-deck structure shows a concrete application of the presented reliability analysis framework, which takes experimental data and FEM modeling into consideration. The Kriging surrogate model significantly reduces the required amount of probabilistic simulations by using parametric modeling. In addition, the Bayesian updating method decreases the uncertainty of the ultimate strength and rectifies errors between the test and modeling. According to the reliability results, the height of the stiffener and the thickness of the plate play a positive role in structural reliability levels.
This paper proposes a reliability analysis framework and explores the comprehensive combination of probabilistic simulation and testing. The framework improves the precision and decreases the computation cost and demands effectively. The study offers contributions to the development of the reliability-based design code for ship local structures.

Author Contributions

Conceptualization, S.X. and J.L.; methodology, Y.L.; software, H.W. and Y.W.; validation, H.W., Q.W. and Y.W.; formal analysis, H.W.; investigation, Y.H. and Y.Z.; resources, N.W.; data curation, S.X. and N.W.; writing—original draft preparation, Q.W. and Y.W.; writing—review and editing, Y.L.; visualization, Q.W.; supervision, J.L.; project administration, N.W.; funding acquisition, S.X. All authors have read and agreed to the published version of the manuscript.

Funding

This research was funded by the National Natural Science Foundation of China, Grant No. 52071150. The opinions and conclusions presented in this paper are those of the authors and do not necessarily reflect the views of the sponsoring organizations.

Data Availability Statement

Not applicable.

Acknowledgments

The authors acknowledge the Laboratory of Ship Structural Strength of the School of Naval Architecture and Ocean Engineering, Huazhong University of Science and Technology for the help with conducting the experimental study in this research.

Conflicts of Interest

The authors declare no conflict of interest.

References

  1. Leveson, N.G. Engineering a Safer World; MIT Press: Cambridge, MA, USA, 2012. [Google Scholar]
  2. Ayyub, B.; Assakkaf, I.; Sikora, J.; Adamchak, J.; Atua, K.; Melton, W.; Hess, P. Reliability-Based Load and Resistance Factor Design (LRFD) Guidelines for Hull Girder Bending. Nav. Eng. J. 2002, 114, 43–68. [Google Scholar] [CrossRef]
  3. Deng, L.; Zou, L.; Tang, W.; Fang, C. Reliability analysis of longitudinal strength of inland river ships and optimization of sub-item safety factors. In Proceedings of the 2017 Outstanding Academic Papers of the Chinese Society of Naval Architects and Marine Engineers, Wuhan, China, 1 July 2016; pp. 13–20. (In Chinese). [Google Scholar]
  4. Zhu, L.; Pan, M.; Zhou, H.-W.; Das, P.K. Transverse Strength and Reliability Assessment on Ore Carrier Cross-Deck Structures. In Proceedings of the 27th International Ocean and Polar Engineering Conference, San Francisco, CA, USA, 25–30 June 2017. [Google Scholar]
  5. Yongkun, Z.; Xin, G. Research on the ship local structure damage subjected to underwater explosion. In Proceedings of the 2017 29th Chinese Control And Decision Conference (CCDC), Chongqing, China, 28–30 May 2017; pp. 6113–6117. [Google Scholar]
  6. Zhang, S. A review and study on ultimate strength of steel plates and stiffened panels in axial compression. Ships Offshore Struct. 2015, 11, 81–91. [Google Scholar] [CrossRef]
  7. Nordsenstrom, N. Probability of Failure for Weibull Load and Normal Strength; Det Norske Veritas: Berum, Norway, 1969. [Google Scholar]
  8. Mansour, A. Methods of Computing the Probability of Failure Under Extreme Values of Bending Moment. J. Ship Res. 1972, 16, 113–123. [Google Scholar] [CrossRef]
  9. Mansour, A.E. Probabilistic Design Concepts in Ship Structural Safety and Reliability. Trans. SNAME 1993, 80, 64–97. [Google Scholar]
  10. Caldwell, J.B. Ultimate longitudinal strength. Trans. Roy Inst. Naval. Arch. 1965, 107, 411–430. [Google Scholar]
  11. Vhanmane, S.; Bhattacharya, B. Estimation of ultimate hull girder strength with initial imperfections. Ships Offshore Struct. 2008, 3, 149–158. [Google Scholar] [CrossRef]
  12. Kim, D.K.; Park, D.K.; Kim, H.B.; Seo, J.K.; Kim, B.J.; Paik, J.K.; Kim, M.S. The necessity of applying the common corrosion addition rule to container ships in terms of ultimate longitudinal strength. Ocean. Eng. 2012, 49, 43–55. [Google Scholar] [CrossRef]
  13. Van Vu, H.; Sang-Rai, C. Generate the Ultimate Longitudinal Strength of Damaged Container Ship Considering Random Geometric Properties under Combined Bending Moment. In Proceedings of the 2nd Annual International Conference on Material, Machines and Methods for Sustainable Development, Cham, Switzerland, 12–15 November 2020; pp. 495–501. [Google Scholar]
  14. Zhao, N.; Chen, B.-Q.; Zhou, Y.-Q.; Li, Z.-J.; Hu, J.-J.; Soares, C.G. Experimental and numerical investigation on the ultimate strength of a ship hull girder model with deck openings. Marine Struct. 2022, 83, 103175. [Google Scholar] [CrossRef]
  15. Xu, M.; Song, Z.; Zhang, B.; Pan, J. Empirical formula for predicting ultimate strength of stiffened panel of ship structure under combined longitudinal compression and lateral loads. Ocean. Eng. 2018, 162, 161–175. [Google Scholar] [CrossRef]
  16. Xia, T.; Yang, P.; Song, Y.; Hu, K.; Qian, Y.; Feng, F. Ultimate strength and post ultimate strength behaviors of hull plates under extreme longitudinal cyclic load. Ocean. Eng. 2019, 193, 106589. [Google Scholar] [CrossRef]
  17. Echard, B.; Gayton, N.; Lemaire, M. AK-MCS: An active learning reliability method combining Kriging and Monte Carlo Simulation. Struct. Saf. 2011, 33, 145–154. [Google Scholar] [CrossRef]
  18. Shi, X.; Teixeira, Â.P.; Zhang, J.; Soares, C.G. Kriging response surface reliability analysis of a ship-stiffened plate with initial imperfections. Struct. Infrastruct. Eng. 2014, 11, 1450–1465. [Google Scholar] [CrossRef]
  19. De Baar, J.; Roberts, S.; Dwight, R.; Mallol, B. Uncertainty quantification for a sailing yacht hull, using multi-fidelity kriging. Comput. Fluids 2015, 123, 185–201. [Google Scholar] [CrossRef] [Green Version]
  20. Bichon, B.; Eldred, M.; Swiler, L.; Mahadevan, S.; McFarland, J. Efficient Global Reliability Analysis for Nonlinear Implicit Performance Functions. Aiaa J. AIAA J. 2008, 46, 2459–2468. [Google Scholar] [CrossRef]
  21. Pan, M.; Zhu, L.; Kumar, D.P. Structural reliability assessment on cross-deck structures of ore carrier (in Chinese). J. Ship Mech. 2020, 24, 118–126. [Google Scholar]
  22. Sacks, J.; Welch, W.J.; Mitchell, T.J.; Wynn, H.P. Design and analysis of computer experiments. Stat. Sci. 1989, 4, 409–423. [Google Scholar] [CrossRef]
  23. Simpson, T.W.; Poplinski, J.; Koch, P.N.; Allen, J.K. Metamodels for computer-based engineering design: Survey and recommendations. Eng. Comput. 2001, 17, 129–150. [Google Scholar] [CrossRef] [Green Version]
  24. China Classification Society. Materials and Welding Specifications; China Classification Society: Beijing, China, 2021. [Google Scholar]
  25. Perrin, F.; Sudret, B.; Pendola, M. Bayesian updating of mechanical models—Application in fracture mechanics. In CFM 2007—18ème Congrès Français de Mécanique; AFM, Maison de la Mécanique: Courbevoie, France, 2007. [Google Scholar]
Figure 1. Cross-deck structure and its simplified model (a) The position of cross-deck structure in ships. (b) Schematic diagram of cross-deck structure (c) Simulation model of cross-deck structure.
Metals 12 00805 g001
Figure 2. Flow chart of reliability analysis framework.
Metals 12 00805 g002
Figure 3. Finite element analysis of ultimate strength of box girder model.
Metals 12 00805 g003
Figure 4. Surrogate model schematic diagram.
Metals 12 00805 g004
Figure 5. Error distribution of experimental test points.
Metals 12 00805 g005
Figure 6. Three-dimensional scanning (a) Three-dimensional scanning with laser scanner (b) Three-dimension scanning point cloud map.
Metals 12 00805 g006
Figure 7. Arrangement of test equipment.
Metals 12 00805 g007
Figure 8. Buckling failure of the specimen.
Metals 12 00805 g008
Figure 9. Load–displacement curve and histogram of ultimate strength load (a) Load-displacement curve of specimen-7 (b) Ultimate strength load of 8 sets of test specimen.
Metals 12 00805 g009
Figure 10. Probability density distribution plot before and after Bayesian update.
Metals 12 00805 g010
Figure 11. Probability density distribution of three different distributed loads.
Metals 12 00805 g011
Table 1. Main parameters of box girder structure.
ParameterUnitData
Upper bottom widthmm400
Bottom widthmm600
Section heightmm500
Overall lengthmm1500
Plate thicknessmm3
Stiffener thicknessmm3
Stiffener heightmm30
Material\Q235
Table 2. Distribution and parameters of random variables.
Random VariablesDistribution TypeMeanCoefficient of Variation
stiffener height h s normal30 (mm)0.03
Young’ modulus E p lognormal210,000 (MPa)0.03
plate thickness t p normal3 (mm)0.03
stiffener thickness t s normal3 (mm)0.03
Table 3. Coefficients and local safety factors under different load distributions and parameters.
Statistical ParametersDistribution Type β γ s 1 γ r K
mean: 30 × 10 4 N
standard deviation: 3 × 10 4 N
Lognormal10.3511.9930.8472.353
Gumbel7.1411.9700.8472.325
Frechet4.9361.9690.8472.325
mean: 40 × 10 4 N
standard deviation: 4 × 10 4 N
Lognormal7.4911.6000.9071.764
Gumbel4.9491.5820.9071.744
Frechet4.1071.5820.9071.744
mean: 50 × 10 4 N
standard deviation: 5 × 10 4 N
Lognormal5.2731.3370.9471.411
Gumbel3.7681.3220.9471.395
Frechet3.3401.3220.9471.395
Publisher’s Note: MDPI stays neutral with regard to jurisdictional claims in published maps and institutional affiliations.

