Article

The Mechanism of In-Situ Laser Polishing and Its Effect on the Surface Quality of Nickel-Based Alloy Fabricated by Selective Laser Melting

1
School of Mechanical and Electronic Engineering, Shandong Jianzhu University, Fengming Road, Jinan 250101, China
2
Jinan Special Equipment Inspection Institute, Jinan 250100, China
3
Hangzhou Optimax Tech Co., Ltd., Hangzhou 310000, China
*
Author to whom correspondence should be addressed.
Metals 2022, 12(5), 778; https://doi.org/10.3390/met12050778
Submission received: 17 March 2022 / Revised: 29 April 2022 / Accepted: 29 April 2022 / Published: 30 April 2022
(This article belongs to the Topic Numerical Modeling on Metallic Materials)

Abstract

:
Laser polishing (LP) is an effective method to improve the surface quality of an additively manufactured nickel-based alloy. In this paper, the in-situ laser polishing (ILP) experiment is performed on the selective laser melting (SLM) IN718 samples. The white light interferometer is used to test the three-dimensional surface profile and surface roughness of samples. The results show that the surface quality of as-SLMed samples by ILP is improved. In particular, the surface roughness is decreased by 33.5%. To reveal the mechanism of ILP, a three-dimensional numerical model is established based on the finite volume method (FVM). The model can accurately simulate the mesoscopic scale physical phenomena when the laser interacts with the metal. The temperature field, the melt pool flow, and the evolution of the surface morphology during the ILP process are predicted using this model. The mechanism of ILP is revealed based on the dynamics of the molten pool. The contribution of capillary and thermocapillary forces to the reduction of bulge curvature at different stages is studied. Furthermore, the effect of ILP power on the surface quality is investigated, and the mechanism of bulges and depressions on the track surface during high-power ILP is revealed.

1. Introduction

Nickel-based alloys have been widely used in the nuclear industry [1], aerospace [2], and other industries due to their excellent yield strength, structural stability, and resistance to oxidation and corrosion [3] at elevated temperatures. Nickel-based alloy parts often have complex structures that are difficult to manufacture by traditional methods. Additive manufacturing (AM) technology is one of the most efficient means of manufacturing complex parts. Among them, SLM technology is particularly suitable for the manufacture of complex components [4], such as centrifugal compressor blades [5]. However, the surface quality of SLM alloys is still poorer compared to subtractive manufacturing. Subsequent subtractive processing is required to meet the needs of assembly [6]. It also seriously affects the fatigue performance of parts [7]. These factors limit the popularization and application of SLM to a certain extent [8].

1.1. Polishing and LP

Polishing can effectively improve the surface quality of parts. The traditional polishing methods for IN718 materials mainly include electrochemical polishing and abrasive flow polishing. Electrochemical polishing can reduce the surface roughness of AM IN718 parts to 0.25 microns [9]. Abrasive flow polishing is good at grinding the inner surface of complex parts [10]. However, traditional polishing methods also have their disadvantages. Traditional mechanical polishing is not suitable for the complex parts manufactured by SLM [8]. Chemical polishing is dangerous and has environmental concerns [11]. In addition, abrasive flow polishing has material loss [9].
As an eco-friendly manufacturing method, LP does not pollute the environment, does not harm the health of workers [12], does not affect mechanical properties, and has a high degree of automation [13]. LP has begun to be used to improve the surface quality of SLM parts [14]. Li et al. [3] studied the thermodynamic behavior and porosity change of SLM IN718 parts subjected to LP. The results showed that the polishing zone temperature was above 1683 K, the cooling rate was about 2.46 × 10⁶ K/s, and the porosity decreased by 65.7% after polishing. Fang et al. [15] carried out LP on the laser additive manufacturing of IN718 parts. In addition, it was reported that the surface roughness can be reduced from 7 μm to less than 1 μm by the LP process. The microhardness increased from 345 HV to 440 HV. Cwikła et al. [16] used LP to reduce the surface roughness of AM IN718 parts by 87.9% and proved that the argon environment is more conducive to the improvement of surface quality than the air environment. Ma et al. [17] performed LP on AM TC4, and the surface roughness was decreased from 5 μm to 1 μm after polishing. Due to the formation of the α’ martensitic phase in the polishing zone, the surface microhardness was increased by 32%, and the wear resistance was also greatly improved. Chen et al. [18] used LP as a post-processing technique to improve the mechanical properties of 316 L stainless steel parts fabricated by SLM. The research showed that the average grain size of the polished zone was 17.3 μm. A hardened layer of 50–70 μm was formed. In addition, the tensile strength and ductility were also significantly improved. Liang et al. [19] studied the effect of LP on the surface quality of SLM aluminum alloy. The results showed that LP can repair the cracks on the surface of the alloy, fuse the pores on the surface, melt the powders on the surface, and greatly reduce the surface roughness. It can be seen that LP can effectively improve the surface quality of SLM parts. Immediately before the work environment is cooled and ventilated, the surface of parts made with SLM is subjected to an LP process, namely, ILP. ILP technology can not only improve the surface quality of parts but also improve processing efficiency and avoid oxidation during LP [20].

1.2. Mechanism of LP

In order to improve the surface quality of parts more effectively, many scholars have devoted themselves to the study of the LP mechanism. Because it is difficult to observe the interaction between laser and material during LP-only by experimental means, it is even more difficult to reveal the mechanism of LP. Therefore, some scholars have carried out LP numerical simulation research to try to explain the mechanism of LP. Marimuthu et al. [8] used experiments and numerical simulation to prove the importance of energy input on LP surface quality. The surface roughness of the LP region strongly depends on the flow velocity of the molten pool, which is also directly related to the energy input. Xu et al. [21] established a two-dimensional numerical model to study the mechanism of bulge formation during the LP process. The main reason for this was that the molten material on both sides of the track flows toward the center of the track. Zhang et al. [22] established a model to describe the flow behavior of the molten pool during LP and mainly studied the effects of capillary force and thermocapillary force in the LP process. The results showed that capillary forces play a leading role and were responsible for eliminating surface defects with large curvatures. Li et al. [23] used numerical simulation to explain why the defects cannot be completely eliminated during LP. Due to the rapid cooling rate of the molten pool, the flow time of the molten pool was too short to completely eliminate the surface defects. Li et al. [24] established a two-dimensional axisymmetric numerical model for LP. The process of cooling was simulated. The model observed that the top of the peak starts to melt first, and the molten liquid flows from the peak to the trough. At the same time, the flow velocity would suddenly increase, and the molten pool was in an unstable state. As the study revealed, an unstable melt pool might prevent the flow of liquid from the bulge to the depression, which is detrimental to the improvement of surface quality.

1.3. Scope of This Research

The surface morphology of SLM-fabricated parts has a significant impact on the process of LP and the final surface quality [25]. Few current LP numerical simulation studies take this into account. The purpose of this study is to fill in the knowledge gap so as to reveal the mechanism of the effect of LP on the surface quality of SLM parts more realistically and effectively.
To this end, the fabrication of SLM samples and ILP experiments were carried out first. The macro- and micro-surface morphologies of the samples were observed. Based on FVM, a three-dimensional numerical model, including the SLM and LP stages, was established. The physical phenomena, such as capillary force, thermocapillary force, vaporization, recoil pressure, convective heat transfer, thermal radiation, and latent heat of phase change, were fully considered. Based on this model, the temperature field, molten pool dynamics, and surface morphology evolution during the ILP were simulated. The mechanism of the reduction of bulge curvature and the generation of new bulges and depressions after ILP on the SLM surface was revealed.

2. In-Situ Laser Polishing (ILP) Experiment

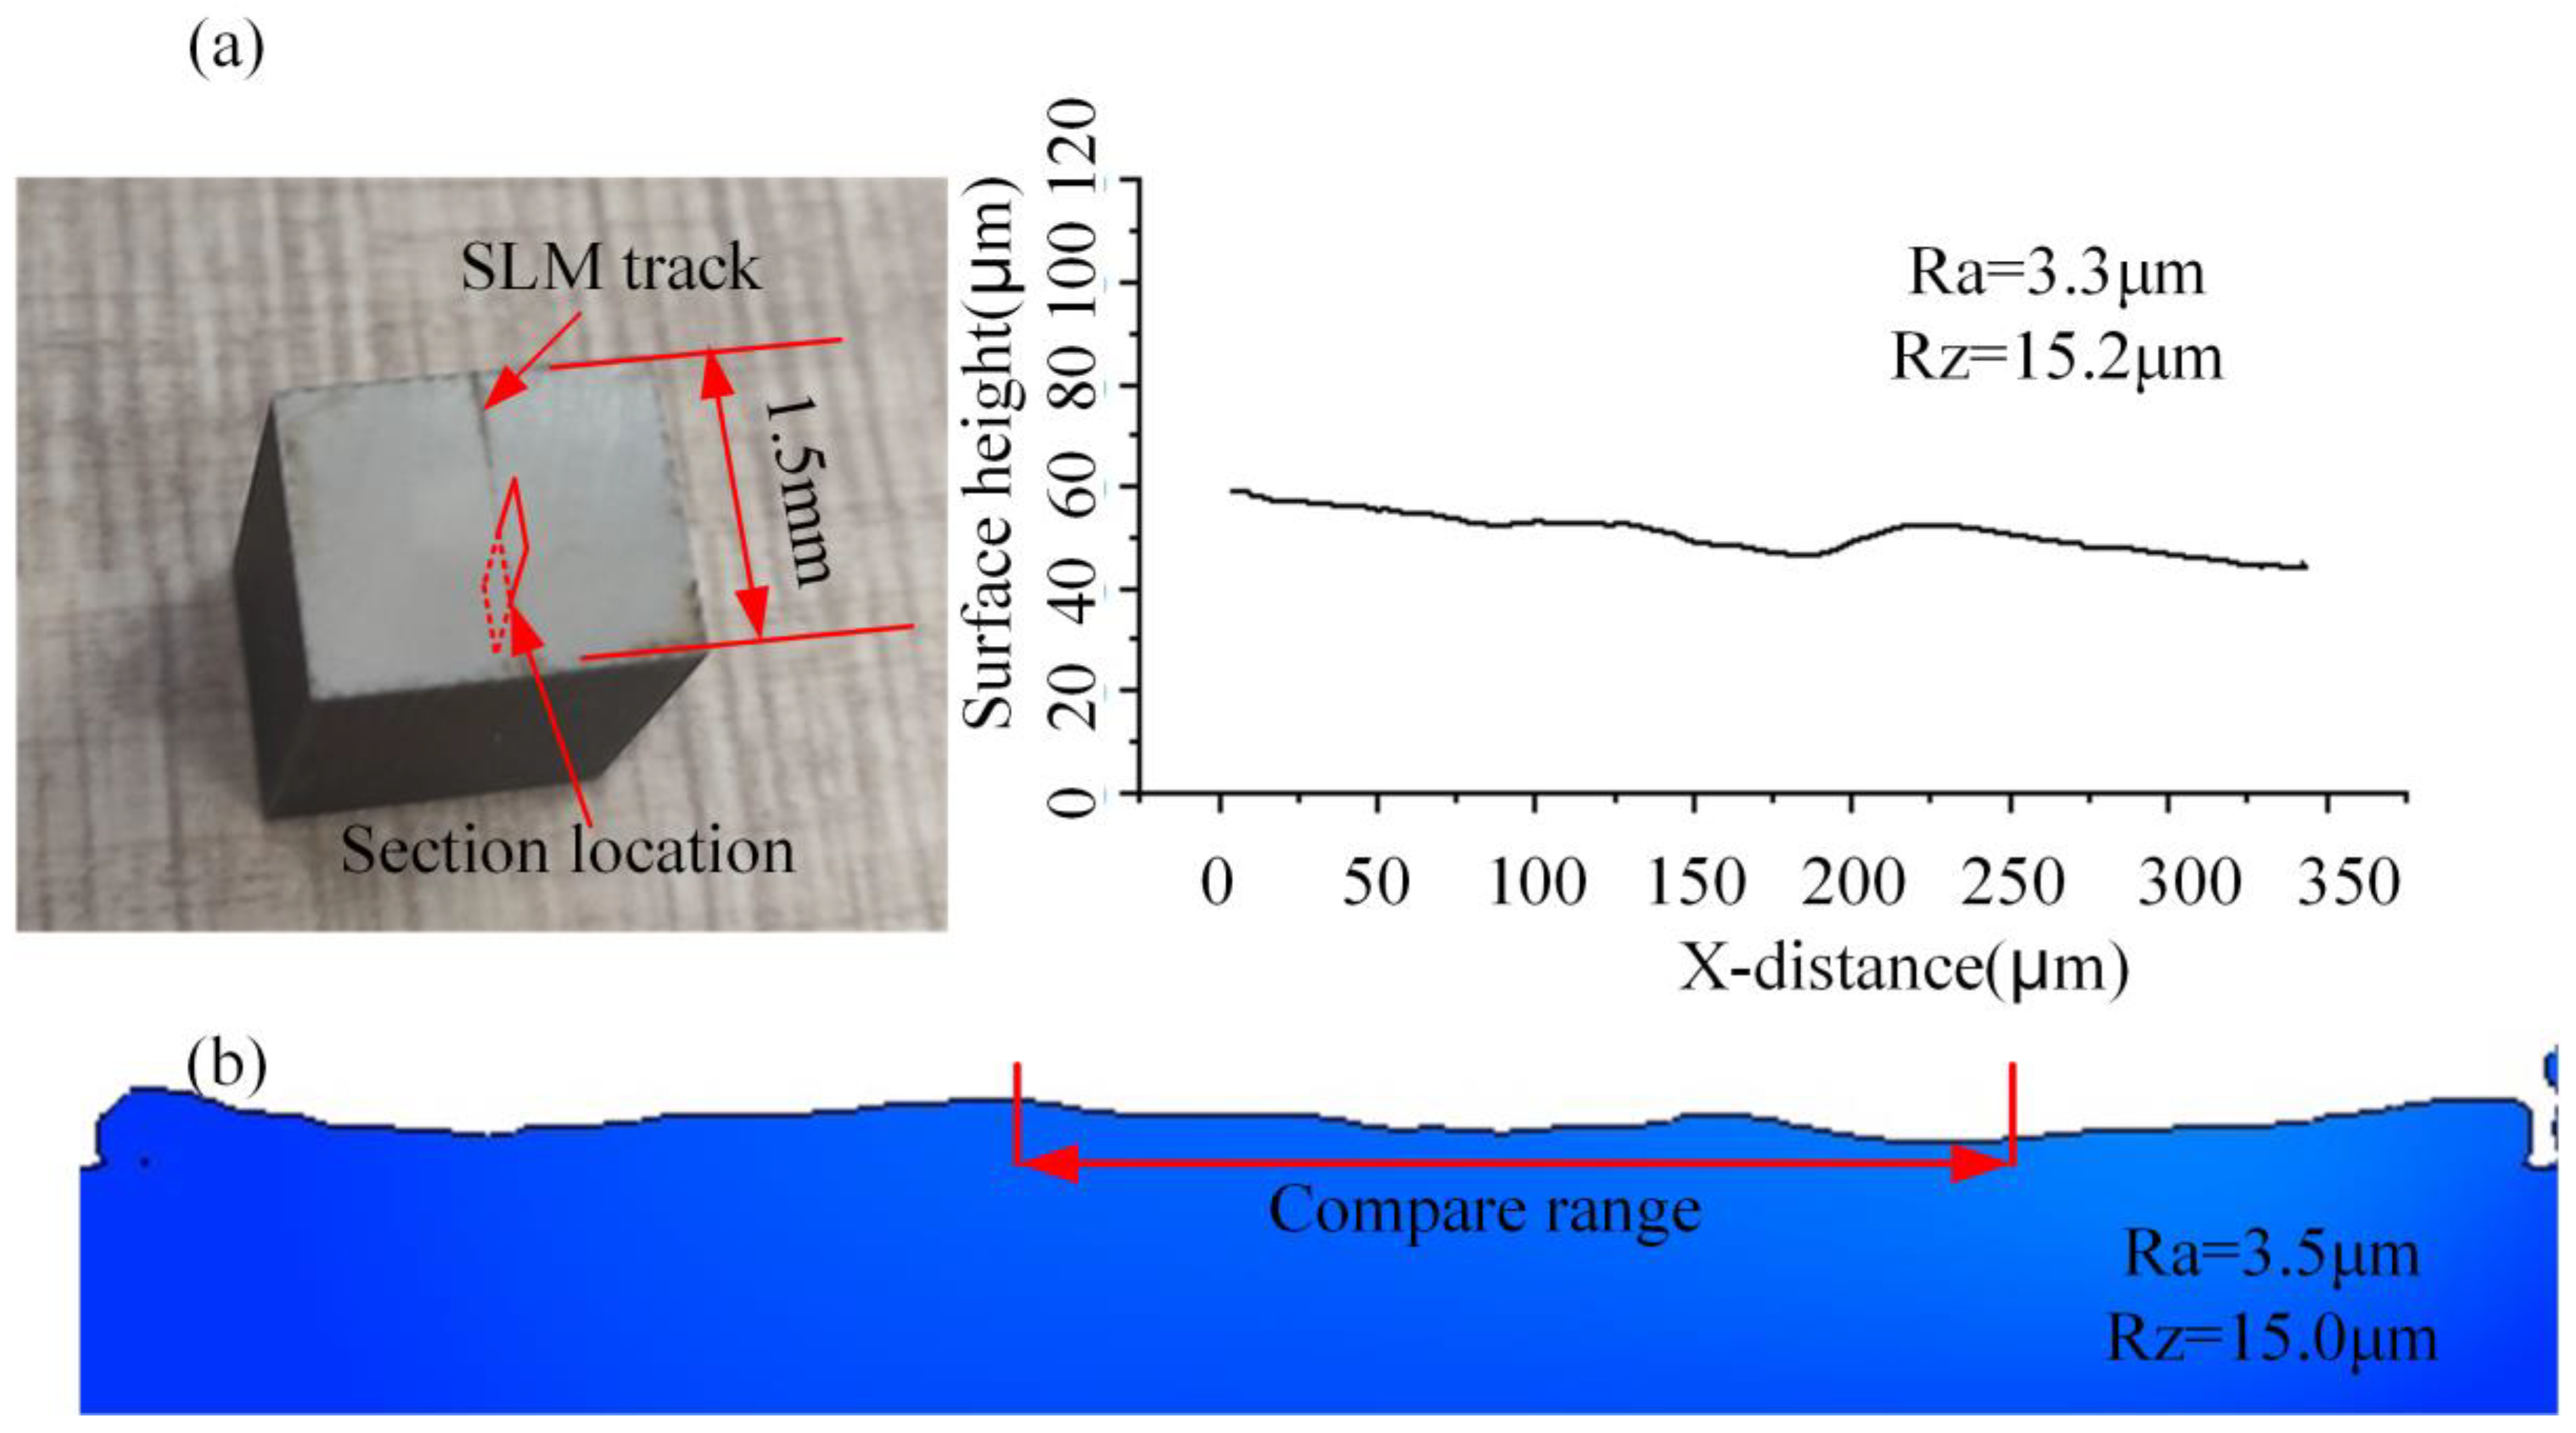
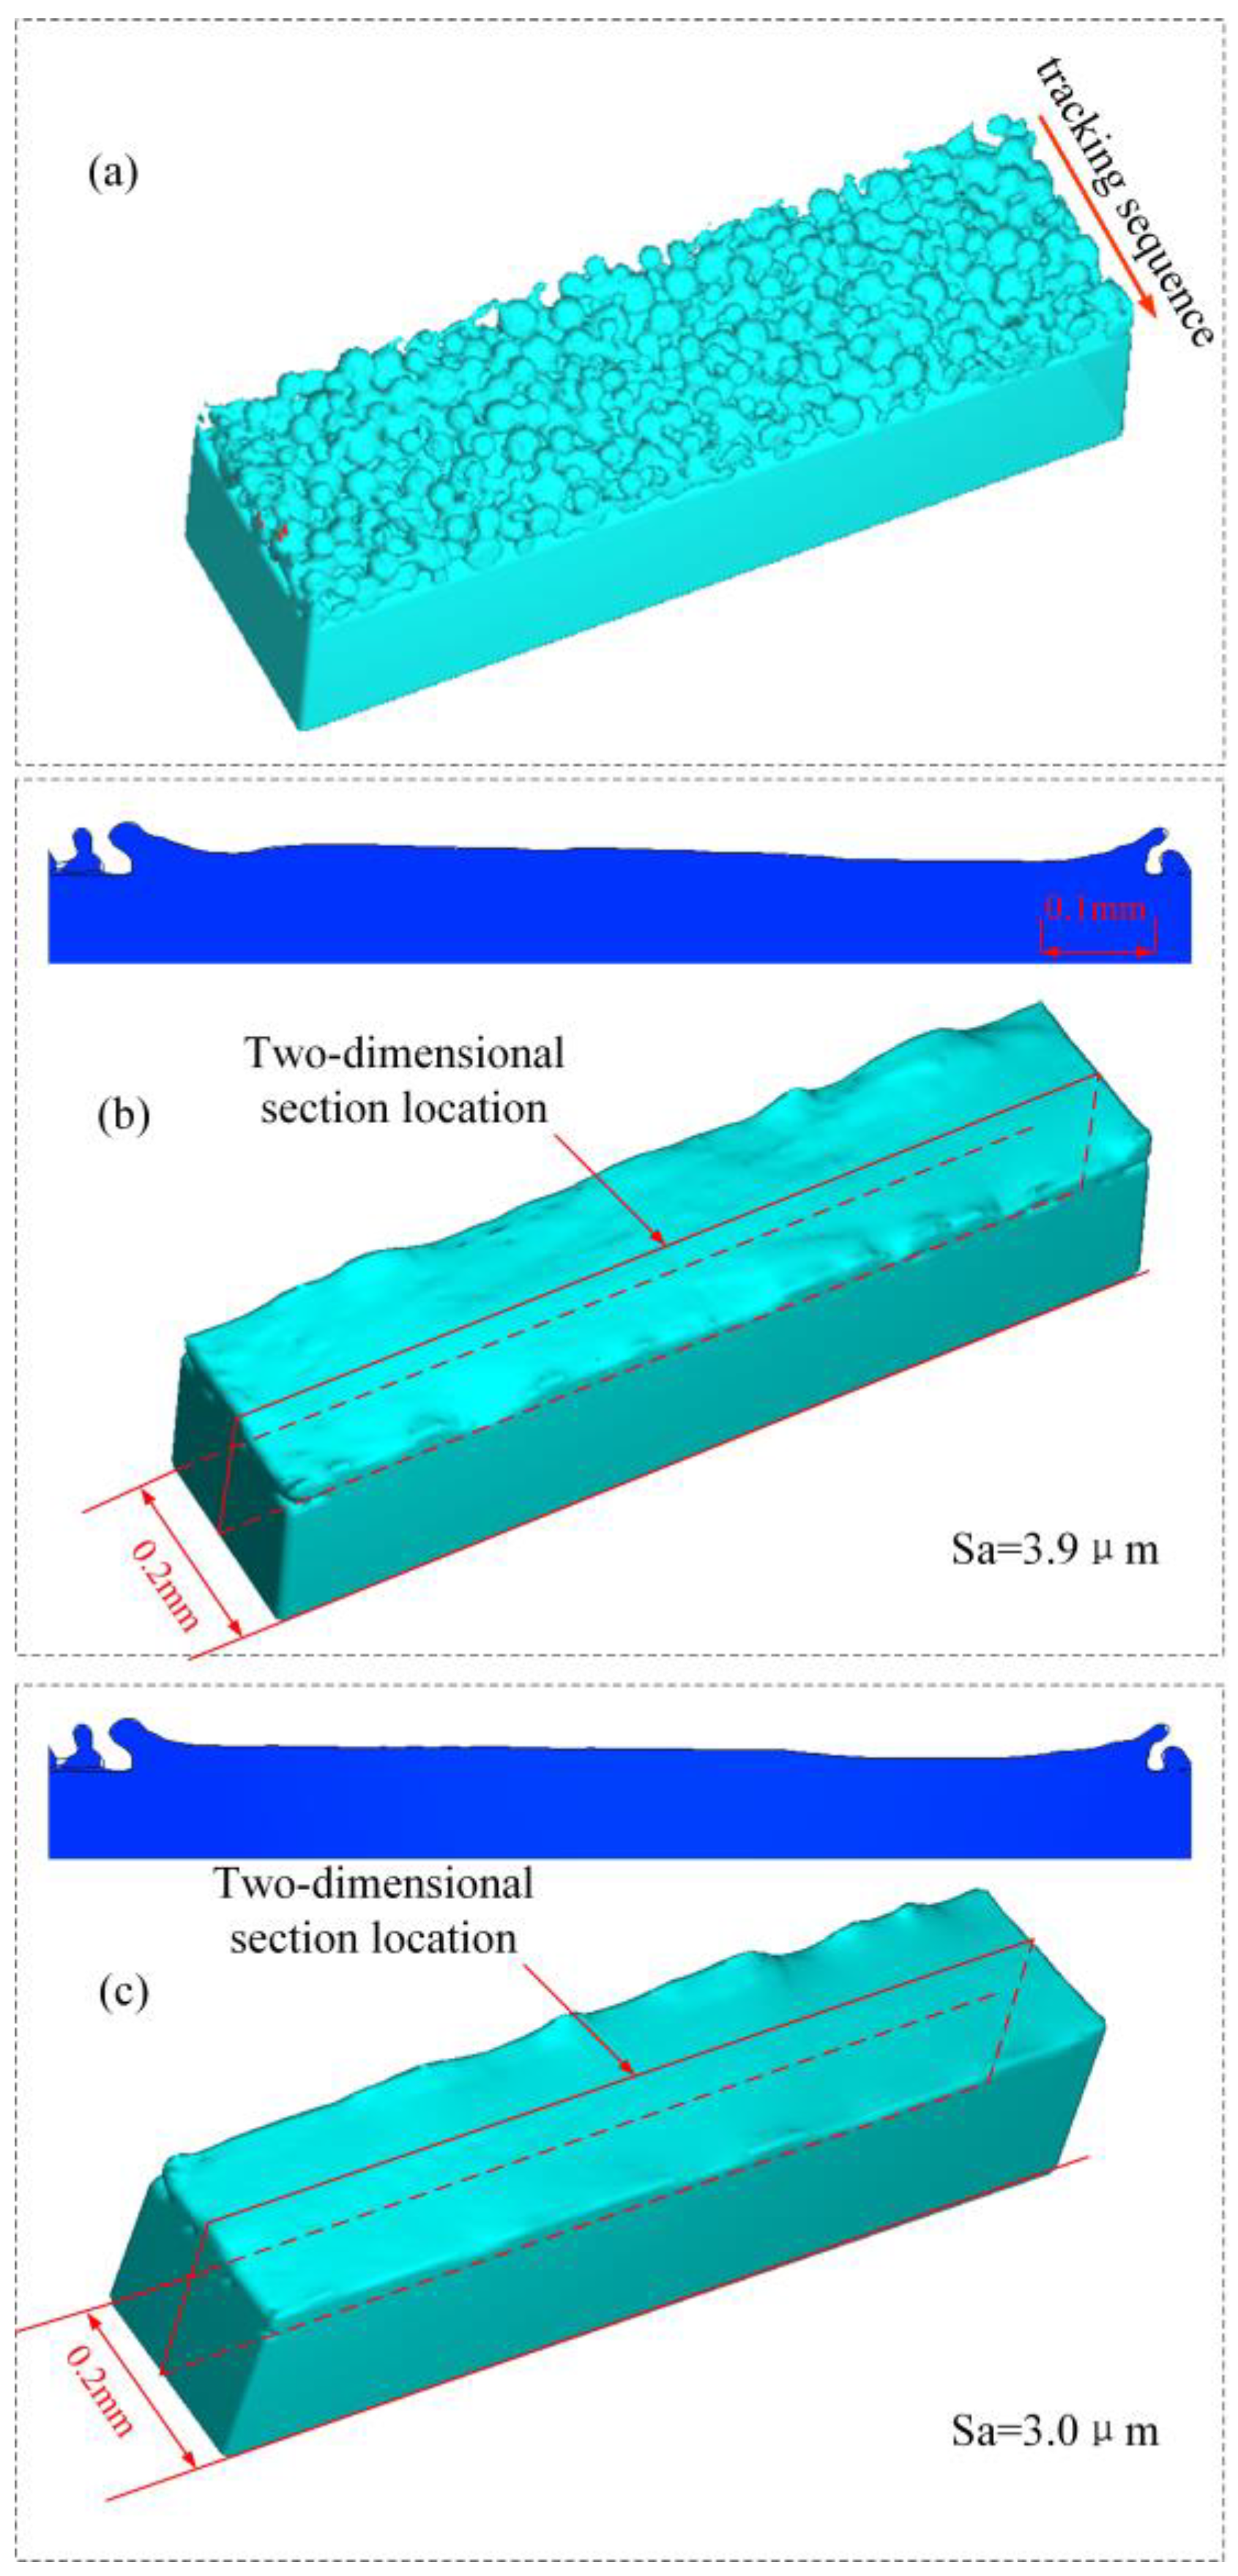
2.1. Experiment Methods

The material used in this study was the IN718 powder obtained by gas atomization. The size of the powder was 15–53 μm, and the base material was 304 stainless steel. The SLM and ILP equipment was a LATEC LAM-150V 3D printer, with a maximum power of 1000 W, and the oxygen content could be controlled within 100 ppm.
The purpose of the experimental work was to study the influence of LP on the surface quality of parts fabricated using SLM. Similar process parameters (i.e., power, speed, etc.) were used for both the SLM and ILP processes. According to our previous experimental exploration, the SLM processing parameters were determined to be 185 W of laser power and a 0.6 m/s scanning speed, and the ILP processing parameters were 180 W of laser power and a 0.6 m/s scanning speed. The spot diameter was 0.05 mm. The laser energy distribution was a Gaussian distribution. The layer thickness was 0.04 mm. In addition, the hatch spacing was 0.01 mm. The time-lapse between SLM and ILP was about 0.023 s. The IPL was carried out immediately after the SLM. The size of the samples was 10 mm × 10 mm × 5 mm. The samples were printed in 125 layers, each with 500 tracks. The ILP scanning was consistent with the SLM. In this experiment, a single laser was used, and the ILP was performed after the SLM was completed. The as-SLMed and ILPed samples are shown in Figure 1a,b, respectively.
A total of 8 samples were prepared, as-SLMed samples 1—4, ILPed samples 1—4, and the surface roughness was tested, respectively. Sample No. 1 was measured four times each. All measurement results are shown in Figure 2. The errors of the measurement data are all within the allowable range, which proves the repeatability of processing and measurement is good. All as-SLMed and ILPed samples’ test results are averaged together and obtained surface roughness with uncertainty.
A Morphology Elite K white light interferometer was used to test the surface morphology and surface roughness of the samples. The surface area of the samples is 10 mm × 10 mm. Due to the limitation of the measuring range of the equipment, and in order to facilitate the positioning of the sample during measurement, the measurement was carried out in an area of 1.302 mm × 1.735 mm in the center of the sample. There were 305,000 data points. According to the research results of scholar Przemysław [26], high-frequency noise will seriously affect the measurement results of the surface topography. When using the white light interferometer for 3D surface measurement, the main sources of noise are shot noise, positioning noise, and discretization noise [27]. In this study, the Fourier filtering technology was used to deal with high-frequency noise in the raw data.

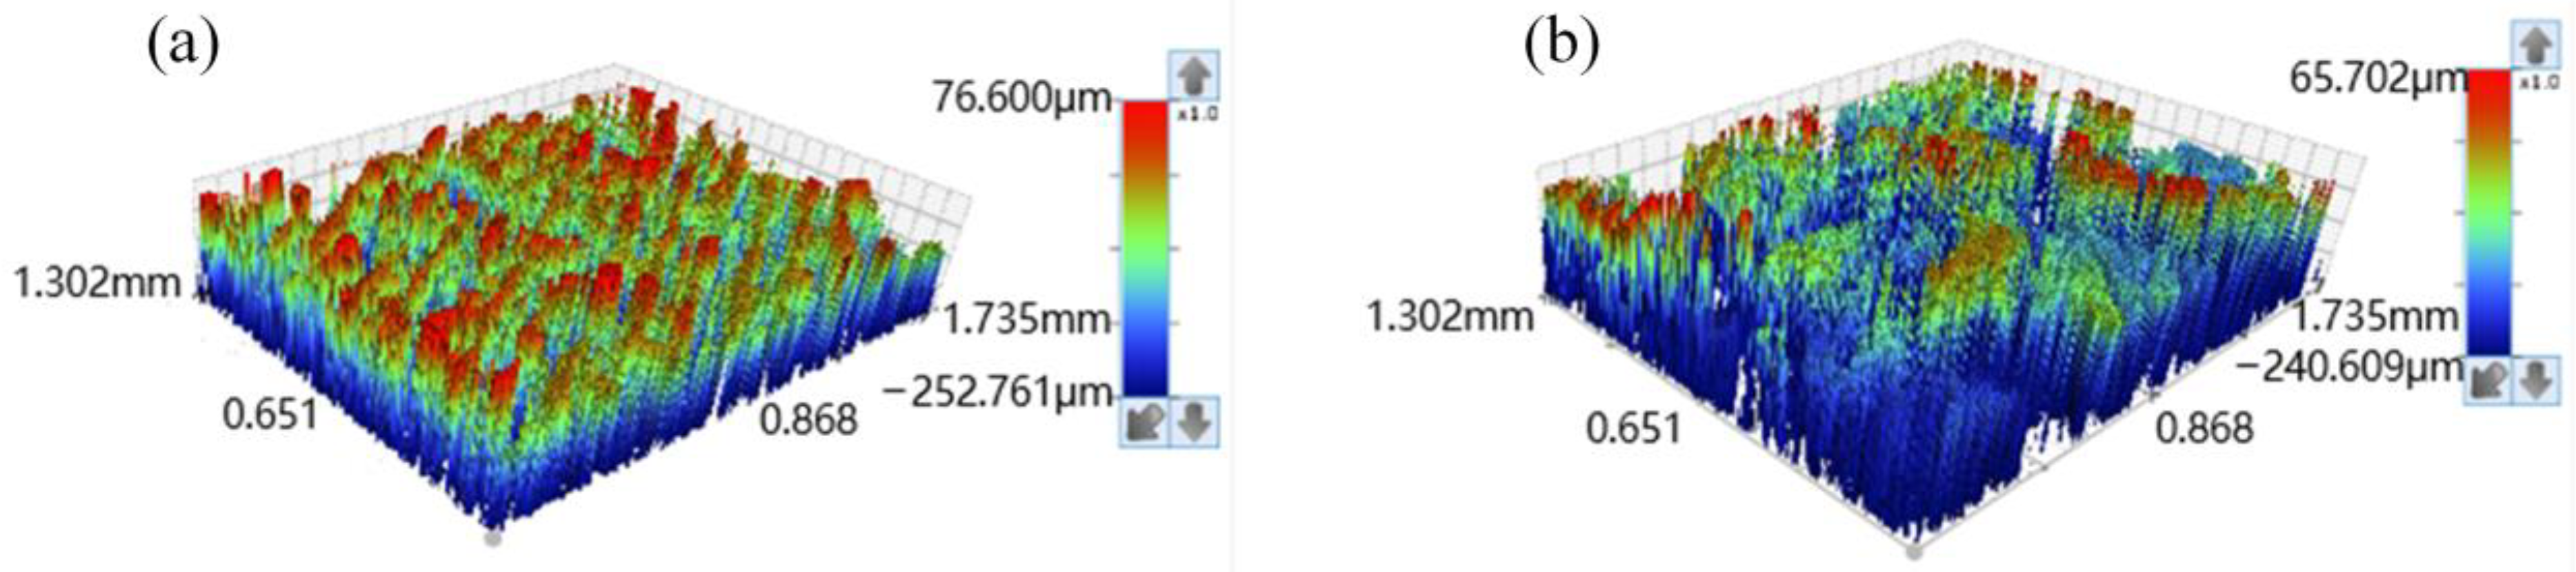
2.2. Results of Experiment

Figure 3 shows the microscopic three-dimensional contour of the samples. Figure 3a,b are as-SLMed and ILPed, respectively. Compared with an as-SLMed sample, the height difference in the ILPed sample is reduced, and the number of bulges is also reduced. The surface roughness results are shown in Figure 2. Sa represents the difference between the height of each point and the arithmetic mean of the entire surface. The calculation formula is the following:
Sa = 1 A A   | Z ( x , y ) | dxdy
where A is the area of the sample, and Z(x,y) is the height of the point.
Sa is the extension of Ra from a straight line to a curved surface, which is more suitable for evaluating the surface quality of a curved surface. In addition, compared with other surface quality parameters, Sa is more comprehensive and can better represent the smoothness of the entire surface. Sz represents the height difference of the surface. As shown in Table 1, compared with the as-SLMed sample, the ILPed samples have a great decrease in Sa, but not much in Sz. Even some ILP samples have a larger Sz. The Sa of the additive part is 20.0 ± 1.25 μm, and the Sz is 315.9 ± 22.75 μm. The Sa after ILP is 13.3 ± 0.35 μm, and the Sz is 302.2 ± 33.35 μm. The skewness (Ssk) of the two samples is less than 0, and the kurtosis (Sku) is greater than 3, indicating that the surface morphology of SLMed sample is mainly characterized by ‘peak’. The shape of the peak is narrow and sharp, and LP does not change this surface morphology feature. The Ssk increased by 62.5%, closer to 0, indicating a more uniform height distribution of the ILP sample. The Sku decreased by 13.1%, indicating that the ILP sample was smoother. LP improves the surface quality that is, the metal surface is remelted under the irradiation of the laser. The molten metal liquid is redistributed on the surface by the combined driving of capillary force and thermocapillary force, and the molten material at the bulge will fill the depression, making the surface becomes smooth. This ultimately reduces surface roughness. The experimental results show that ILP can improve the surface quality of the SLMed samples.

3. Numerical Model and Validation

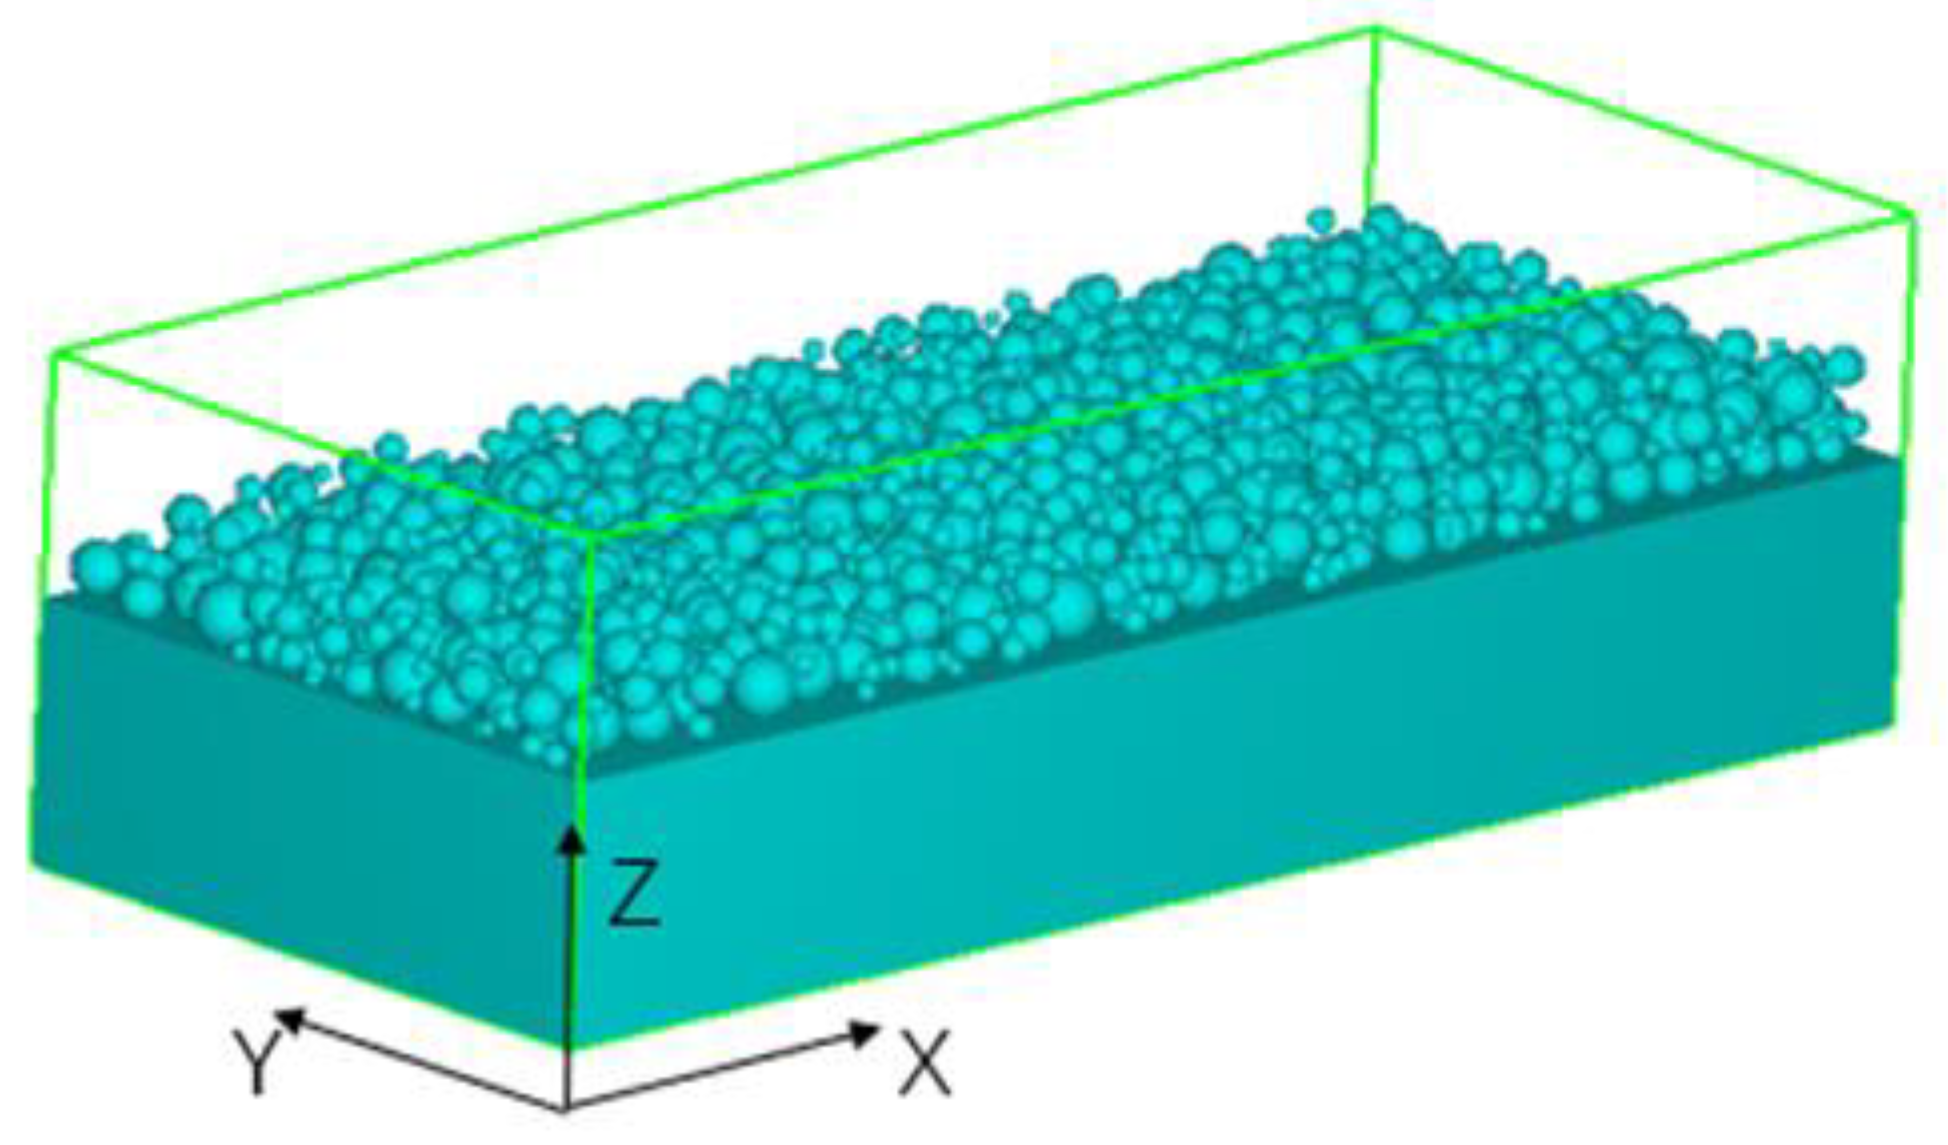
3.1. Model Establishment

The processes of SLM and LP include heat conduction between laser and metal, phase transformation of metal, molten pool flow, heat conduction and convection, vaporization, thermal radiation, latent heat of phase change, and other mechanisms [28]. These factors constitute the numerical model.
To simplify the physical model, the following assumptions are made: (1) The fluid is assumed to be an incompressible Newtonian fluid. (2) The heat flux is assumed to be Gaussian distribution.
The three-dimensional model of the computational domain is shown in Figure 4. The size of the computational domain was 1 mm × 0.4 mm × 0.24 mm. The size of the powder bed was 1 mm × 0.4 mm × 0.04 mm. The thickness of the powder bed was the same as in the experiment. The powder bed was established by the discrete element software EDEM 2018. Its thickness was controlled by the distance between the blade and the base. The powder bed was placed on the base. The model was placed in an argon environment and contained 868,602 grids with a uniform grid size of 5 μm. A single-track simulation and three-track simulation were performed in this study. The three-track simulation only appeared in Section 4.4. The simulation used a single laser, and the ILP scan would wait until the SLM scan of the whole layer was completed.
The modeling was carried out using FLOW-3D V11.1 [29], a commercial computational fluid dynamics (CFD) code, on a GTS2-RIS212Q workstation with 24 cores and 24 threads. Using the FVM method to simulate the SLM and ILP, information such as surface morphology evolution, molten pool flow, and temperature distribution can be obtained. However, the information on stress evolution during processing cannot be obtained. This is a limitation of the FVM approach.

3.2. Governing Equations

The metal solid is melted under the role of laser. In addition, the fluid flow in the molten pool satisfies continuity, momentum conservation, and energy conservation.
Continuity equation [30]:
· ( ρ v ) = 0
Momentum conservation equation [30]:
t ( ρ v ) + ( ρ v v ) = · ( μ V ) P + ρ g
Energy conservation [31]:
h t + ( v ) h = 1 ρ ( k T )
In Equations (2)–(4), ρ is the density of the material, μ is the viscosity, v is the fluid velocity, g is the acceleration of gravity, h is enthalpy, t is the time, k is the thermal conductivity, and T is temperature of the material.
The volume of fluid (VOF) method is used to capture the free surface. The free surface is viewed as a material surface, and the fluid volume fraction is used to represent the proportion of fluid occupying space in the grid, so as to realize the capturing of the free surface. The volume fraction function satisfies the following transportation equation [32]:
F t + ( F v ) = 0
where F is the volume fraction of the fluid, F = 1, F = 0, 0 < F < 1 represent fluid-filled, fluid-free, and partially fluid-filled with free surface, respectively [32].
As the laser moves, the temperature in the computational domain changes sharply. The heat conduction obeys the energy conservation law and the Fourier law. It is a typical three-dimensional transient heat conduction process, which satisfies the following equation [29]:
ρ c T t = x ( k T x ) + y ( k T y ) + z ( k T z ) + Q
In the formula, c is the specific heat capacity of the material and Q is the source term.

3.3. Gaussian Heat Source and Boundary Conditions

Since the energy of free photoelectrons in the laser is relatively low, it is difficult to reach a deeper position directly through the metal surface, so the surface heat source model is adopted. The following is the heat source formula [33]:
q ( r ) = 2 α P π ω 2 exp ( 2 r 2 ω 2 )
where q (r) is the heat flux, P is the laser power, α is absorption, ω is the heat source radius, and r is the distance from any point in the plane to the laser center point. In this study, α was 0.38 and ω was 0.025 mm. α is cited from the paper by Li et al. [31], ω is consistent with the experiment. They are used for all simulations. (These parameters are used for all performed simulations).
Thermal boundary conditions at the free surface of the molten pool are as follows [34]:
q in = q ( r ) h c ( T T 0 ) ε r σ ( T 4 T 0 4 ) q ev
In the formula, q in is the heat flux variation at the free interface of the molten pool, h c is the natural convection heat transfer coefficient, ε r is the emissivity, σ s is the Stefan-Boltzmann constant, T is the temperature, T 0 is the ambient temperature, and q ev is the evaporation heat.
In the process of SLM and ILP, the metal phase is melted rapidly and even reach the boiling temperature, evaporation occurs, and heat dissipation to the environment. The following is the evaporative heat equation [31,35]:
q ev = 0.82 Δ H * 2 π MRT p 0 exp ( Δ H * T T lv RTT lv )
In the formula, Δ H * is the escape metal vapor, M is the molar mass of the material, R is the ideal gas constant, p 0 is the environmental pressure, and T lv is the boiling temperature.
Metal vapor will exert recoil pressure on free interface as follows [35]:
p r = 0.54 p 0 exp ( L lv T T lv RTT lv )
L lv is the latent heat of vaporization of metallic materials.

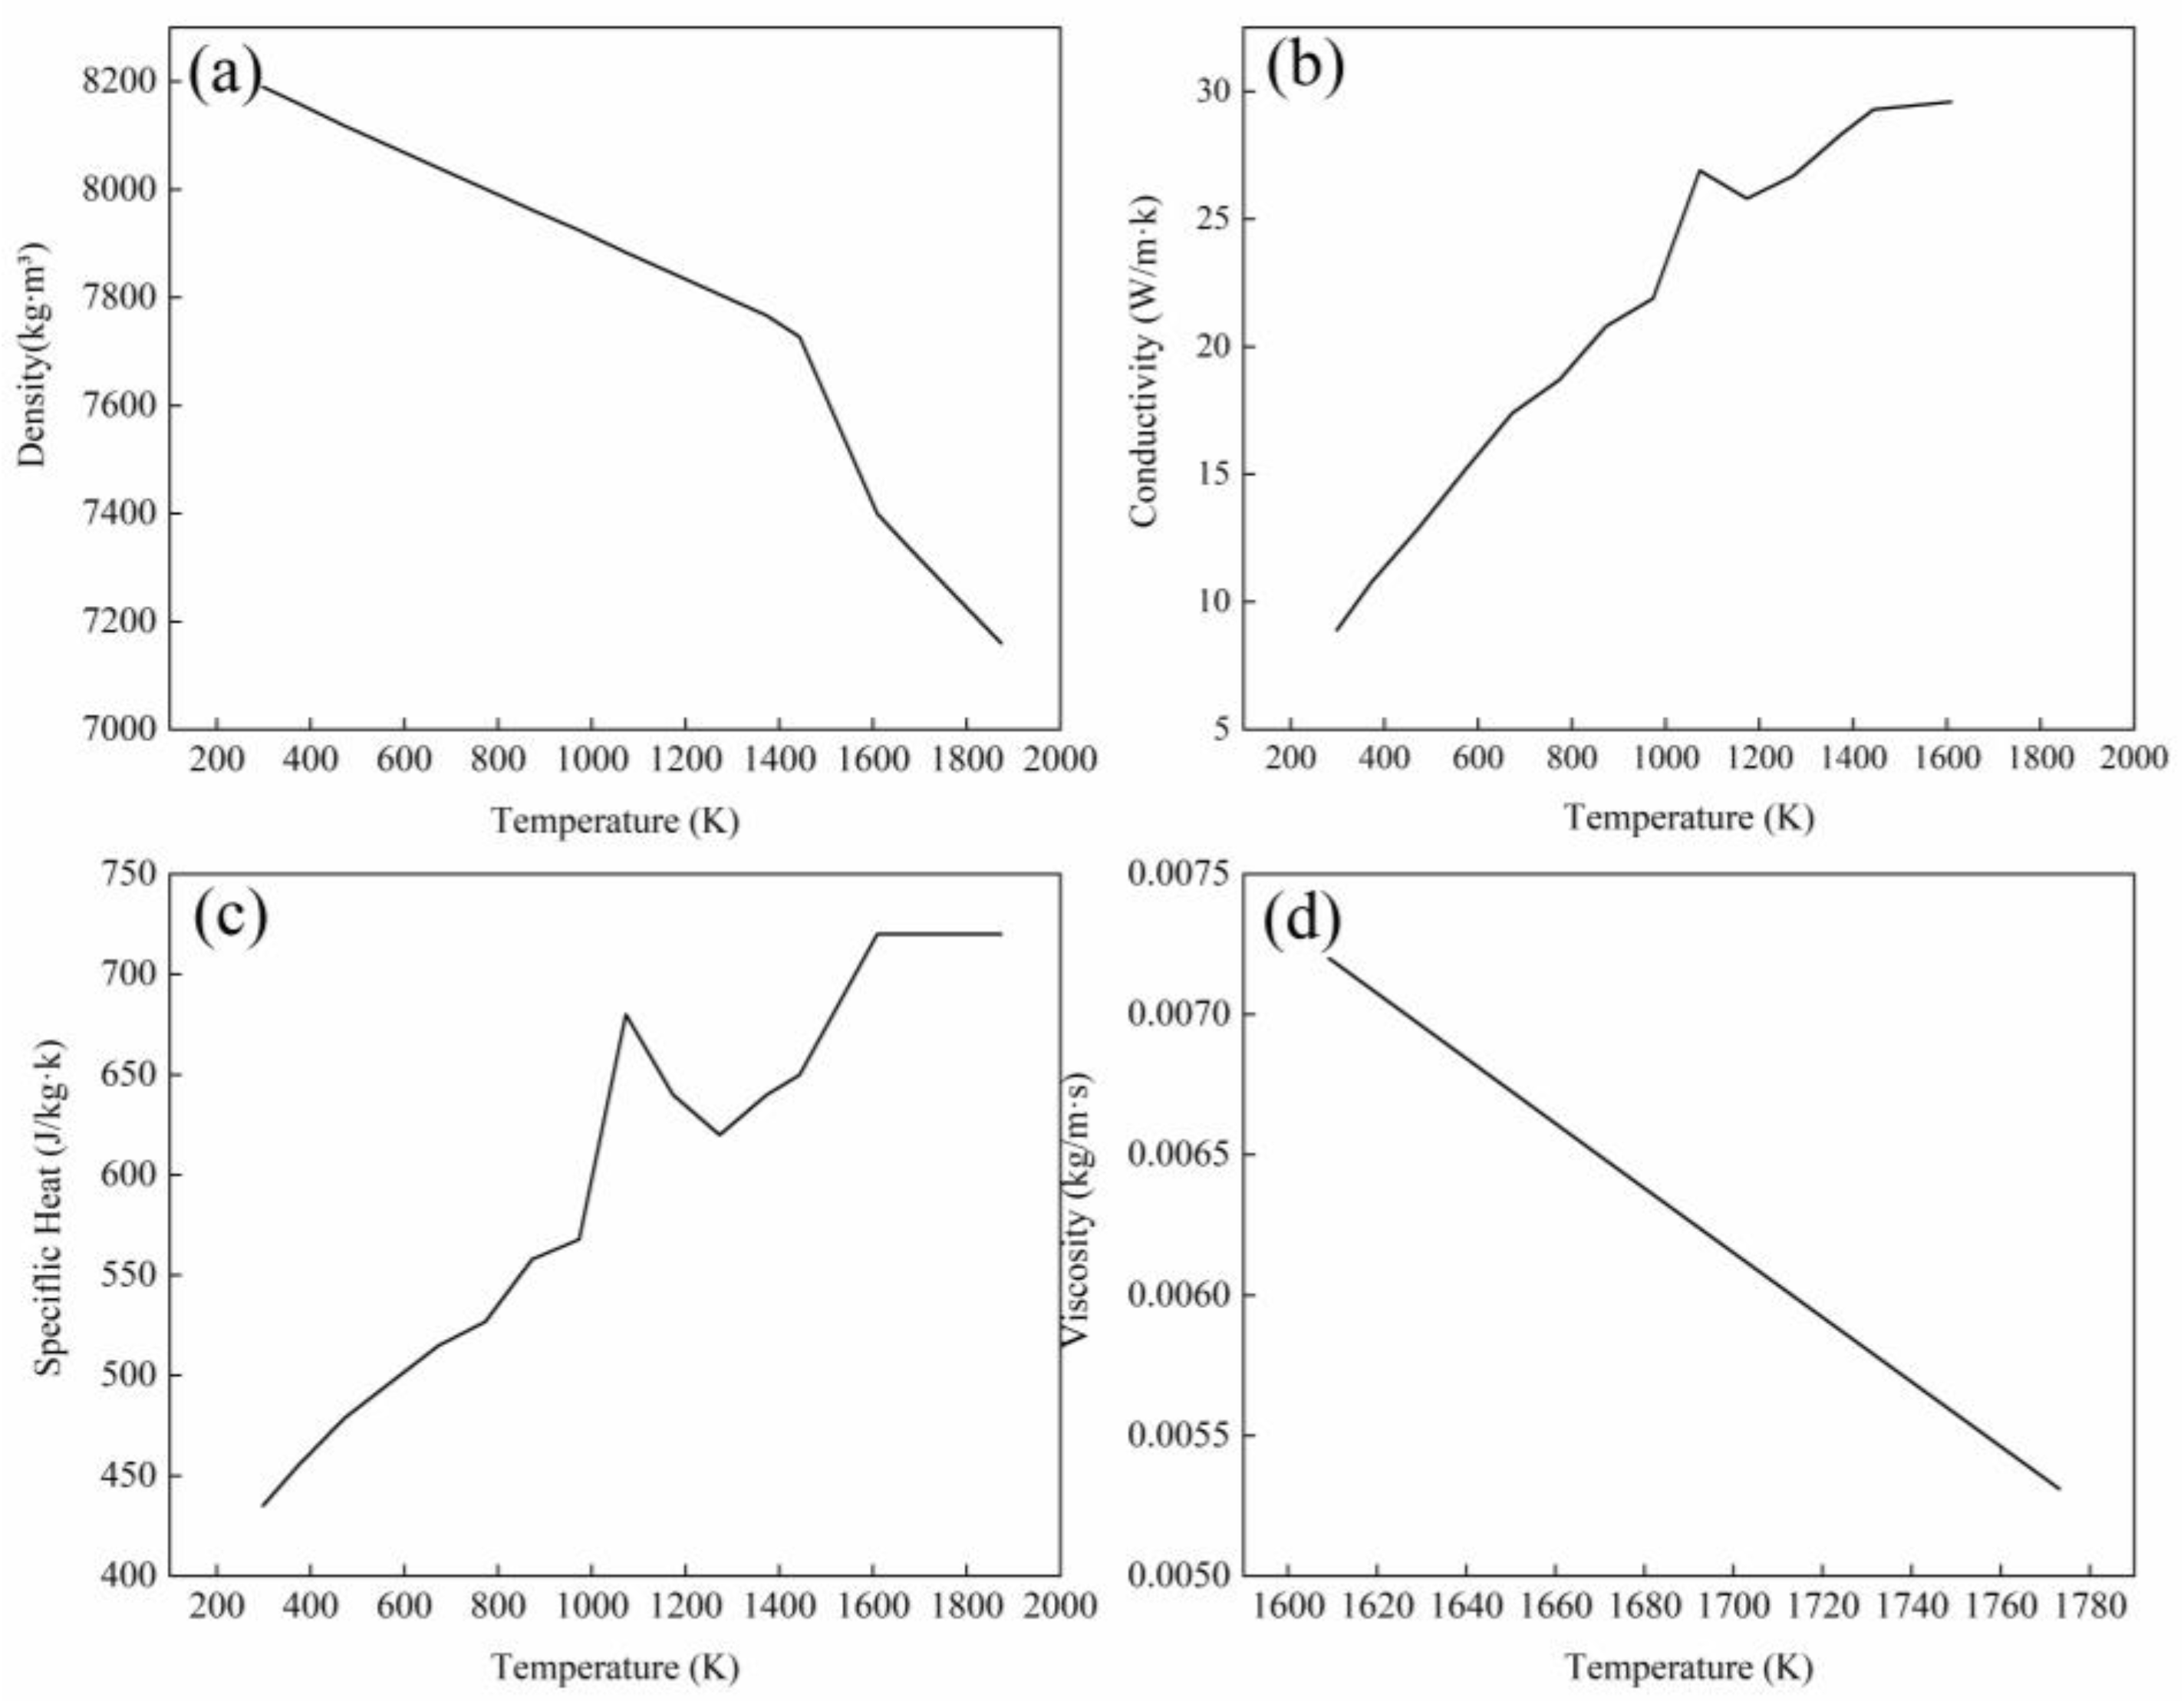
3.4. Process Parameters and Material Properties

The SLM process and four ILP process parameters are shown in Table 2. The purpose of the modeling study is to reveal the mechanism of ILP. Modeling should try to ensure the quality of the track. And there must be no excessive computing time. The typical computing time of a single track SLM is about 40 hours (h) [30]. To choose suitable parameters, the parameters of Yuan et al. [36], using 0.8 m/s and 200 W, were referred to. A series of simulations were performed by varying the power. Finally, the scanning speed was 0.8m/s and the power used was 150W. Using these parameters, good track quality is obtained with suitable computing time.
The thermophysical properties of IN718 are shown in Figure 5. The other material properties are shown in Table 3.

3.5. Validation

To demonstrate the viability of the modelling techniques adopted in the current study, a single-layer, single-track SLM process was simulated, using the same pro-cessing parameters as for the SLM experiment in Section 2.1. The simulated surface topography was compared with that of the experiment that was characterized using the white light interferometer. The section location, line profile and line roughness of the experimental surface are shown in Figure 6a. The section location, line profile and line roughness of the simulated surface are shown in Figure 6b. The roughness of the experimental surface was compared with the roughness of the simulated surface. The error of Ra is 6.06%; the error of Rz is 1.33%, and the variation trend of the line profile of the simulated and experimental surfaces is consistent. That is, the simulated surface is in good agreement with the experimental surface.
In order to further verify the validity of the simulation model. The surface topography of a 1 mm-long SLM single track obtained by the simulated was compared with the surface topography of the track obtained by the SLM test [37]. The simulation and experiment use the same parameters, as shown in Figure 7. The contour of Figure 7a represents the boundary of the track. It can be seen that the width of the track obtained by experiment and simulation is gradually reduced along the laser scanning direction. The shape of the width reduction area is approximately conical. The experimental track and the simulated track show good agreement. The variation trend of the track width is related to the inherent heat and mass transfer characteristics during the SLM process [37], and the LP also depends on the heat and mass transfer of the molten pool [36,38]. Therefore, the numerical model established in this paper can well predict the changing trend of the SLM track and can be used to simulate the ILP process.

4. Results and Discussion of Numerical Simulation

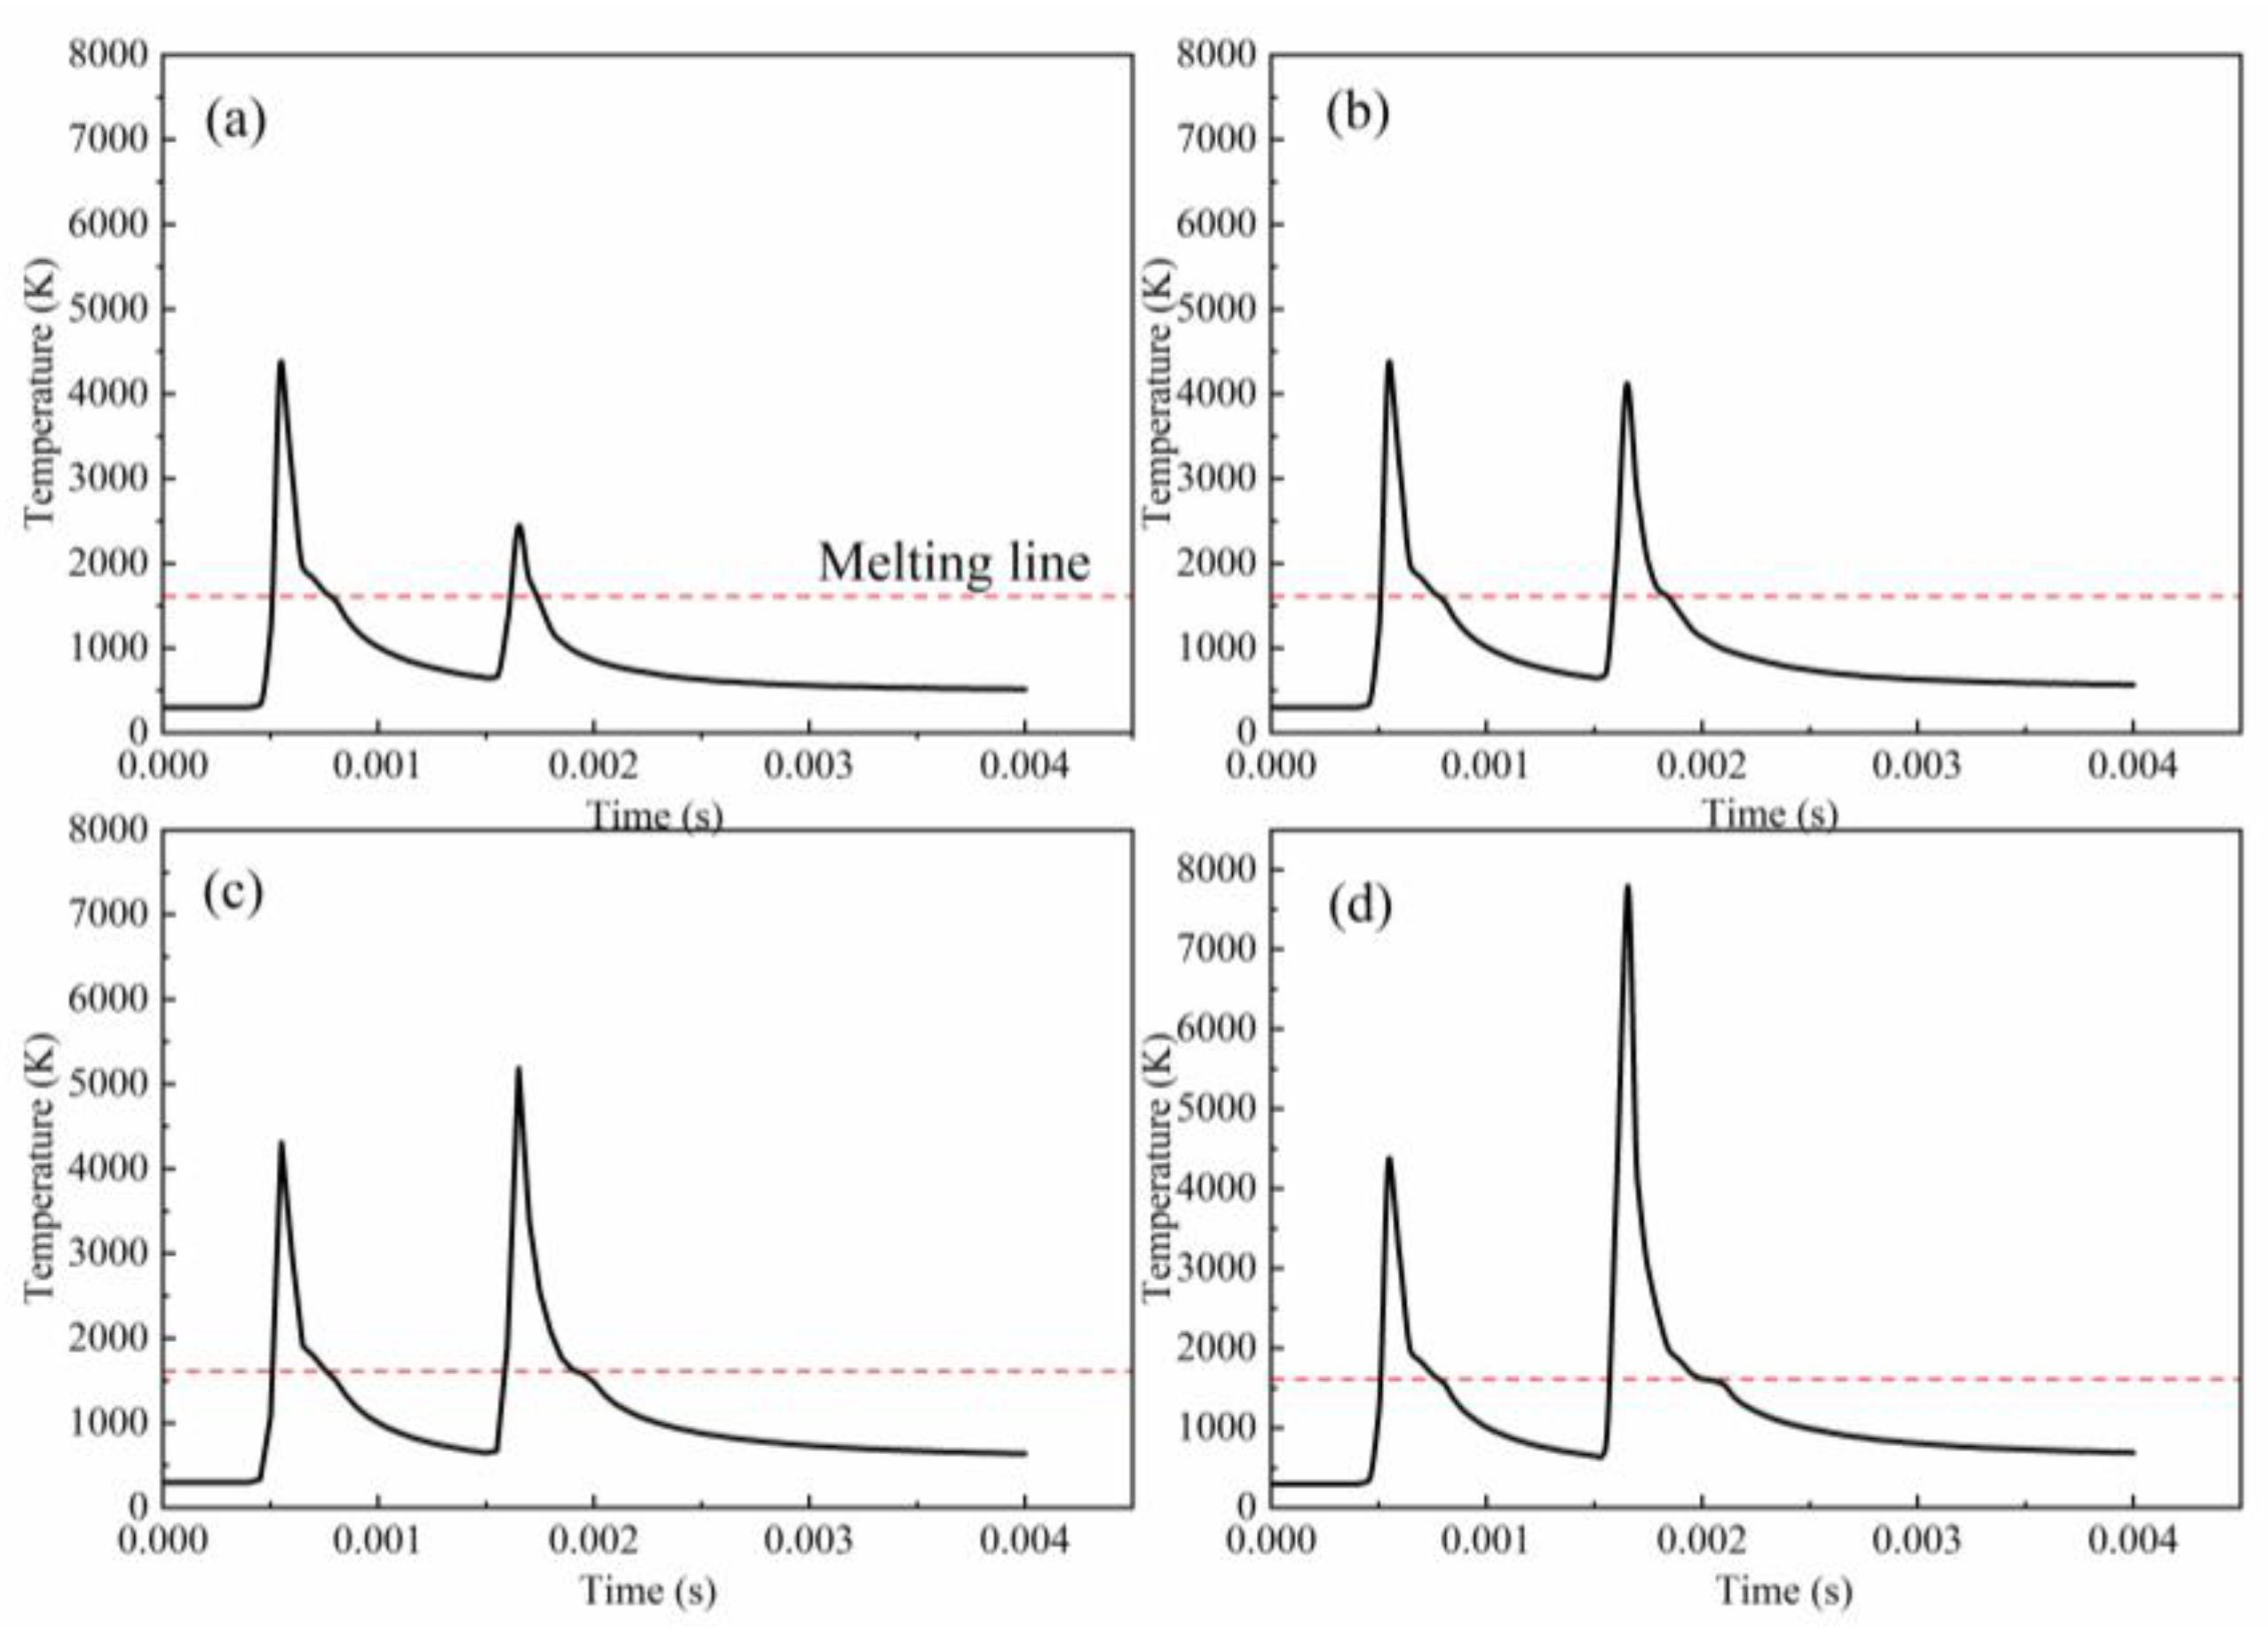
4.1. Temperature Change in ILP Process

The temperature change curve of the monitoring point under different ILP powers is shown in Figure 8. The monitoring point is located below the center point of the top surface of the track. The simulation was performed in the computational domain shown in Figure 4. The temperature in the powder bed and the solidified layers changed rapidly during SLM. The peak temperature of the SLM stage is 4309 K and reaches its peak at 0.55 ms. The peak temperature is above the evaporation temperature, indicating that the monitoring point is in the direct-action area of the laser at this time. The liquid at the monitoring point is evaporated. At 1.65 ms, because the ILP laser moves to this point, the temperature of the monitoring point reaches a peak again. With the increase in ILP power, the peak temperature of the monitoring point of the ILP stage gradually increased.
When the ILP power is 50 W, although there is heat residue in the SLM stage, the second temperature peak is only 2448 K, which is far lower than the first peak of 4309 K (as shown in Figure 8a). Mainly due to the energy density of the ILP laser being much lower than the SLM laser. When the ILP power is 90 W, the second peak temperature is increased greatly to 4052 K, which is still below the first peak temperature. When the molten pool of the monitoring point cools down, the cooling rate tends to decrease gradually. From Figure 8b, it can be seen that the slope of the curve above the liquid line in the ILP stage is gradually decreasing. This is because as the laser moves, the monitoring point is positioned further back in the molten pool.
The temperature contours on the vertical plane through the center of the ILP track predicted by the numerical simulation under different powers are shown in Figure 9. The black horizontal lines are the paths along which the temperature gradient curves are derived and plotted in Figure 10. As shown in Figure 10, in the molten pool, the more backward (the opposite direction of the X direction), the smaller the temperature gradient, and the slower the temperature change rate of the monitoring point. When the ILP power is 50 W, the cooling rate does not change significantly, because, under this processing condition, the temperature gradient in the molten pool changes very little. After the molten pool at the monitoring point is solidified, the cooling rate is significantly accelerated. From Figure 8, it can be seen that the sudden change in the slope of the curve at the liquid line in the ILP stage. This is because the heat transfer rate from liquid to solid is lower than the heat transfer rate between solids, so the metal phase dissipates heat to the base faster after solidification. When the ILP power is 130 W, the first peak temperature is exceeded by the second, and the second peak temperature is 5184 K. Although the ILP power is less than the SLM power, the working temperature is higher than the latter. This phenomenon occurs because the thermal conductivity of a continuous solid is greater than that of powder [39], and the heat of the laser is more easily transferred to the monitoring point. In addition, there is residual heat on the track after SLM, and the initial temperature of the monitoring point during ILP is 660 °C. When the ILP power is 170 W, the second peak temperature is 7710 K due to the increase in input energy density.
In the ILP process, the working temperature of the molten pool is increased with increasing power. The larger working temperature can increase the fluidity of the molten pool so that the liquid at the bulge can fully flow in the molten pool and redistribute evenly. However, too high of a working temperature also greatly increases the instability of the molten pool [40], which may impair the surface quality.

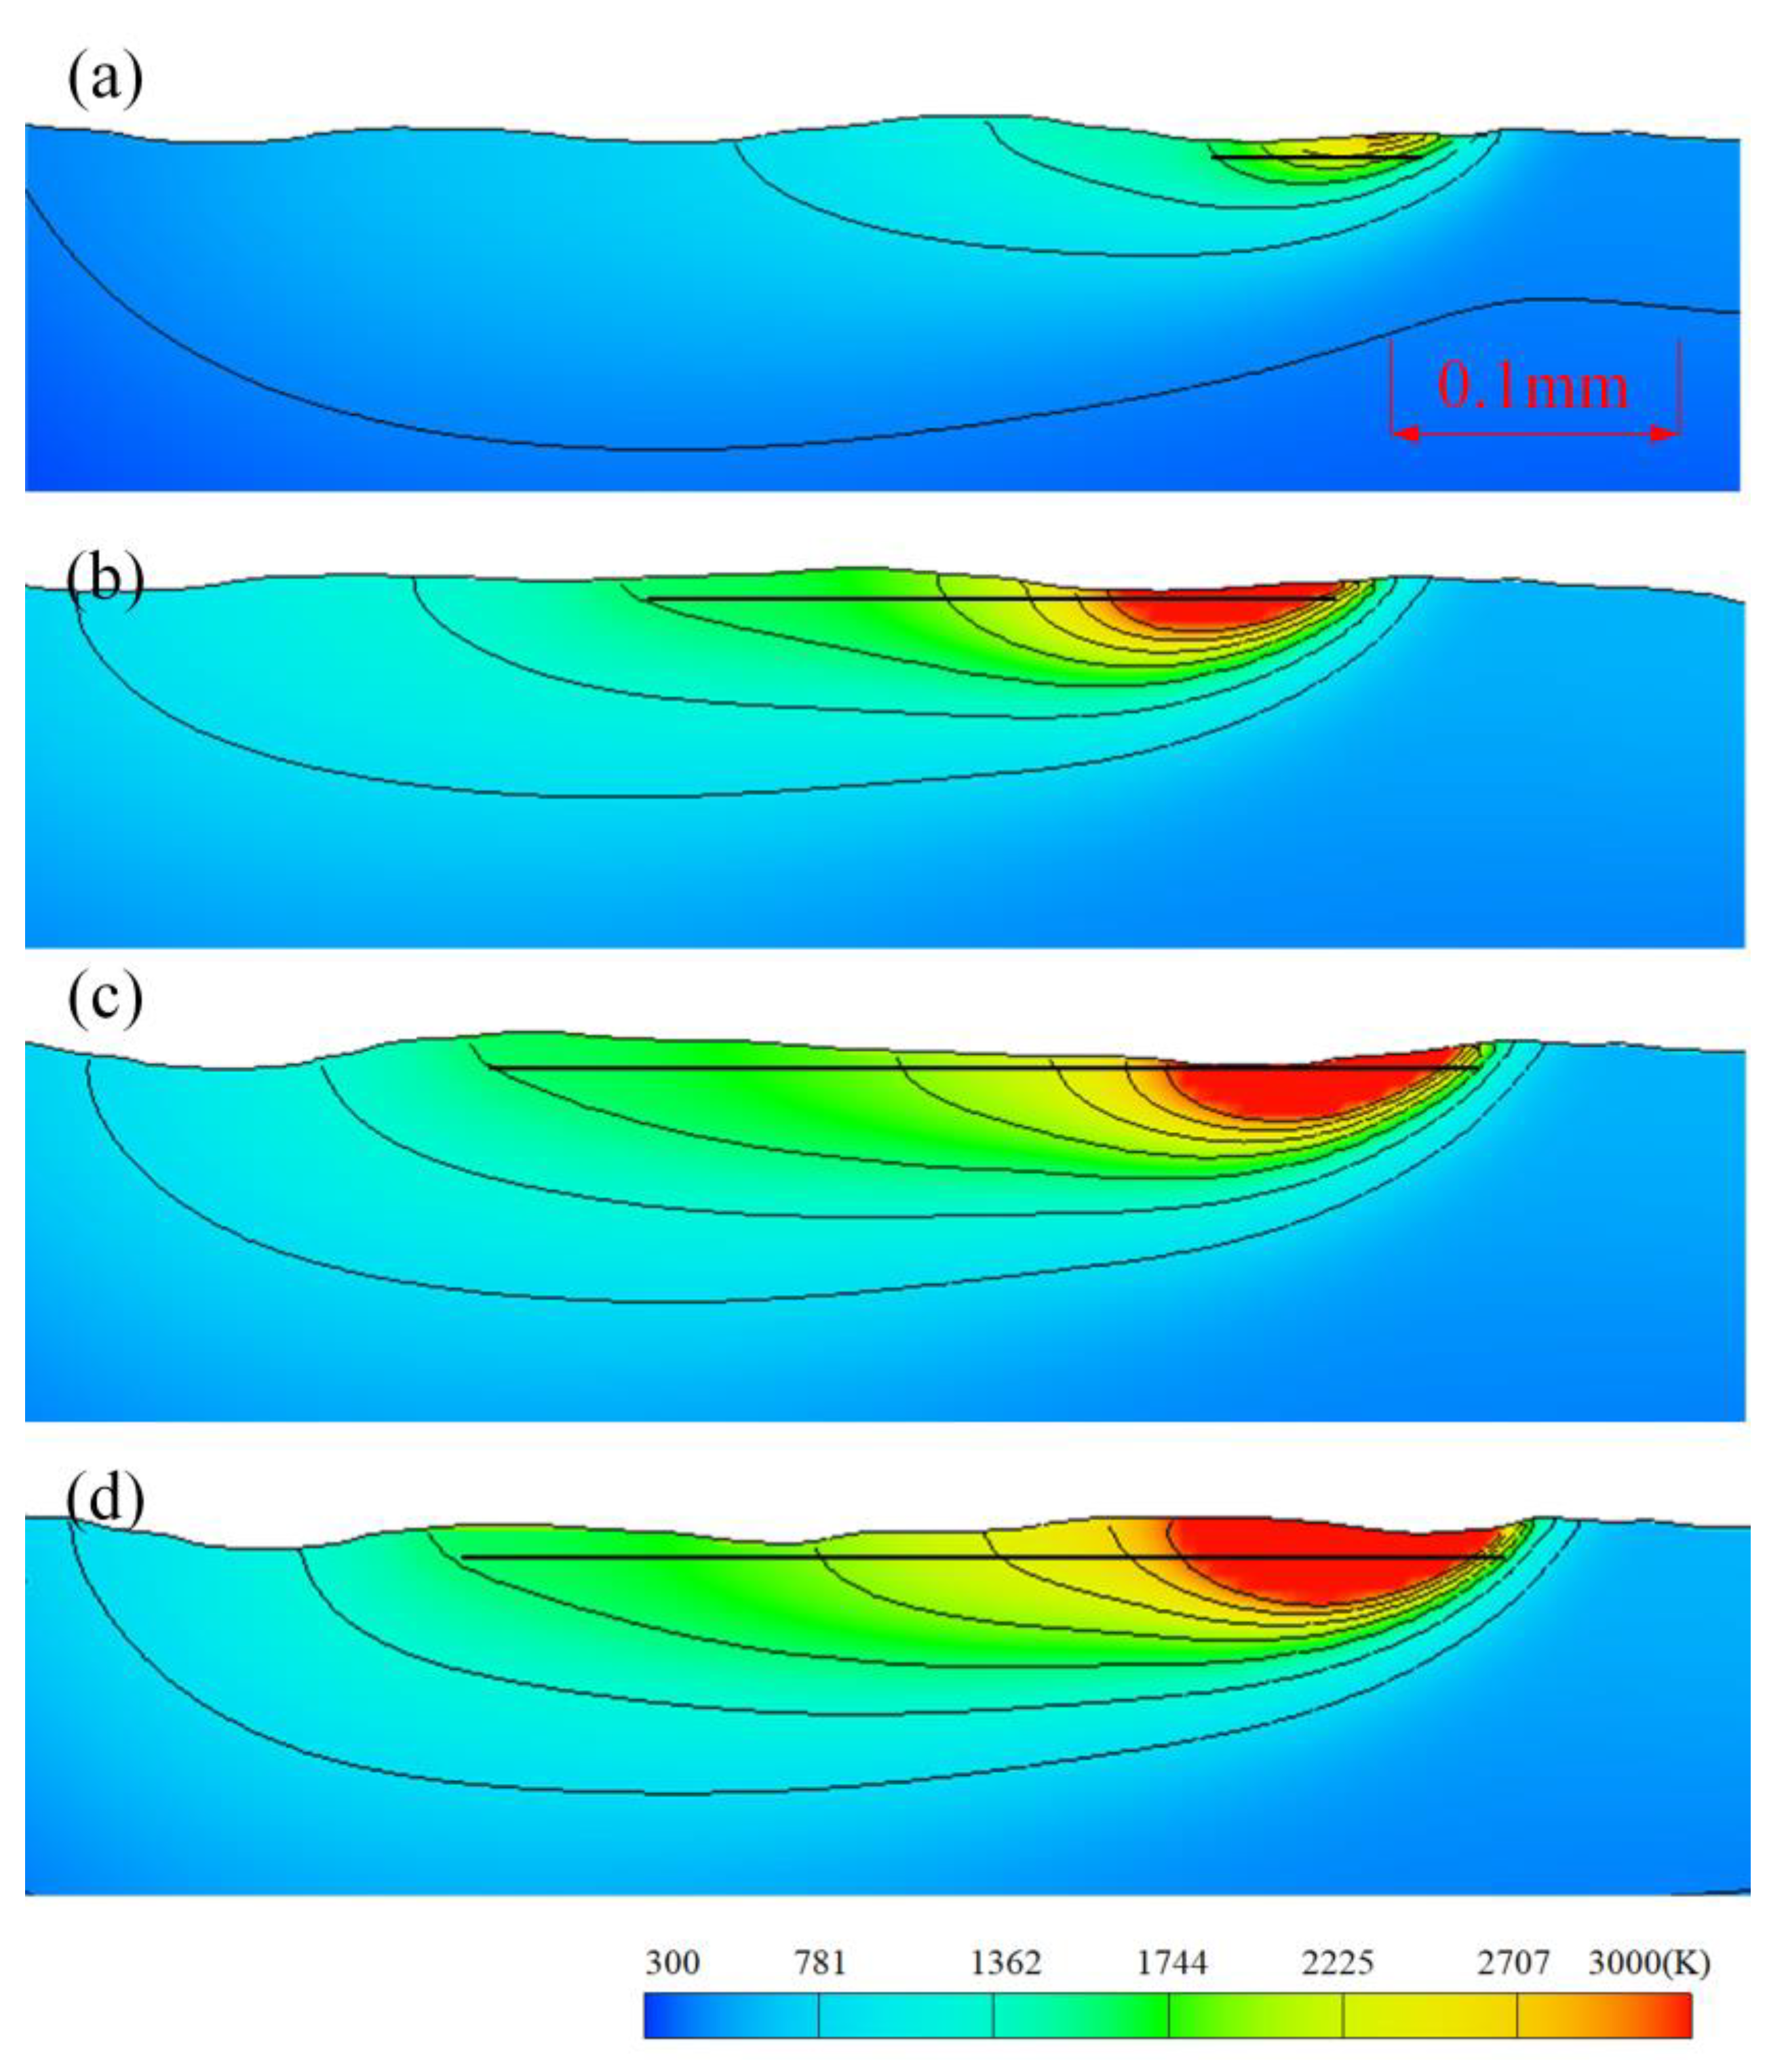
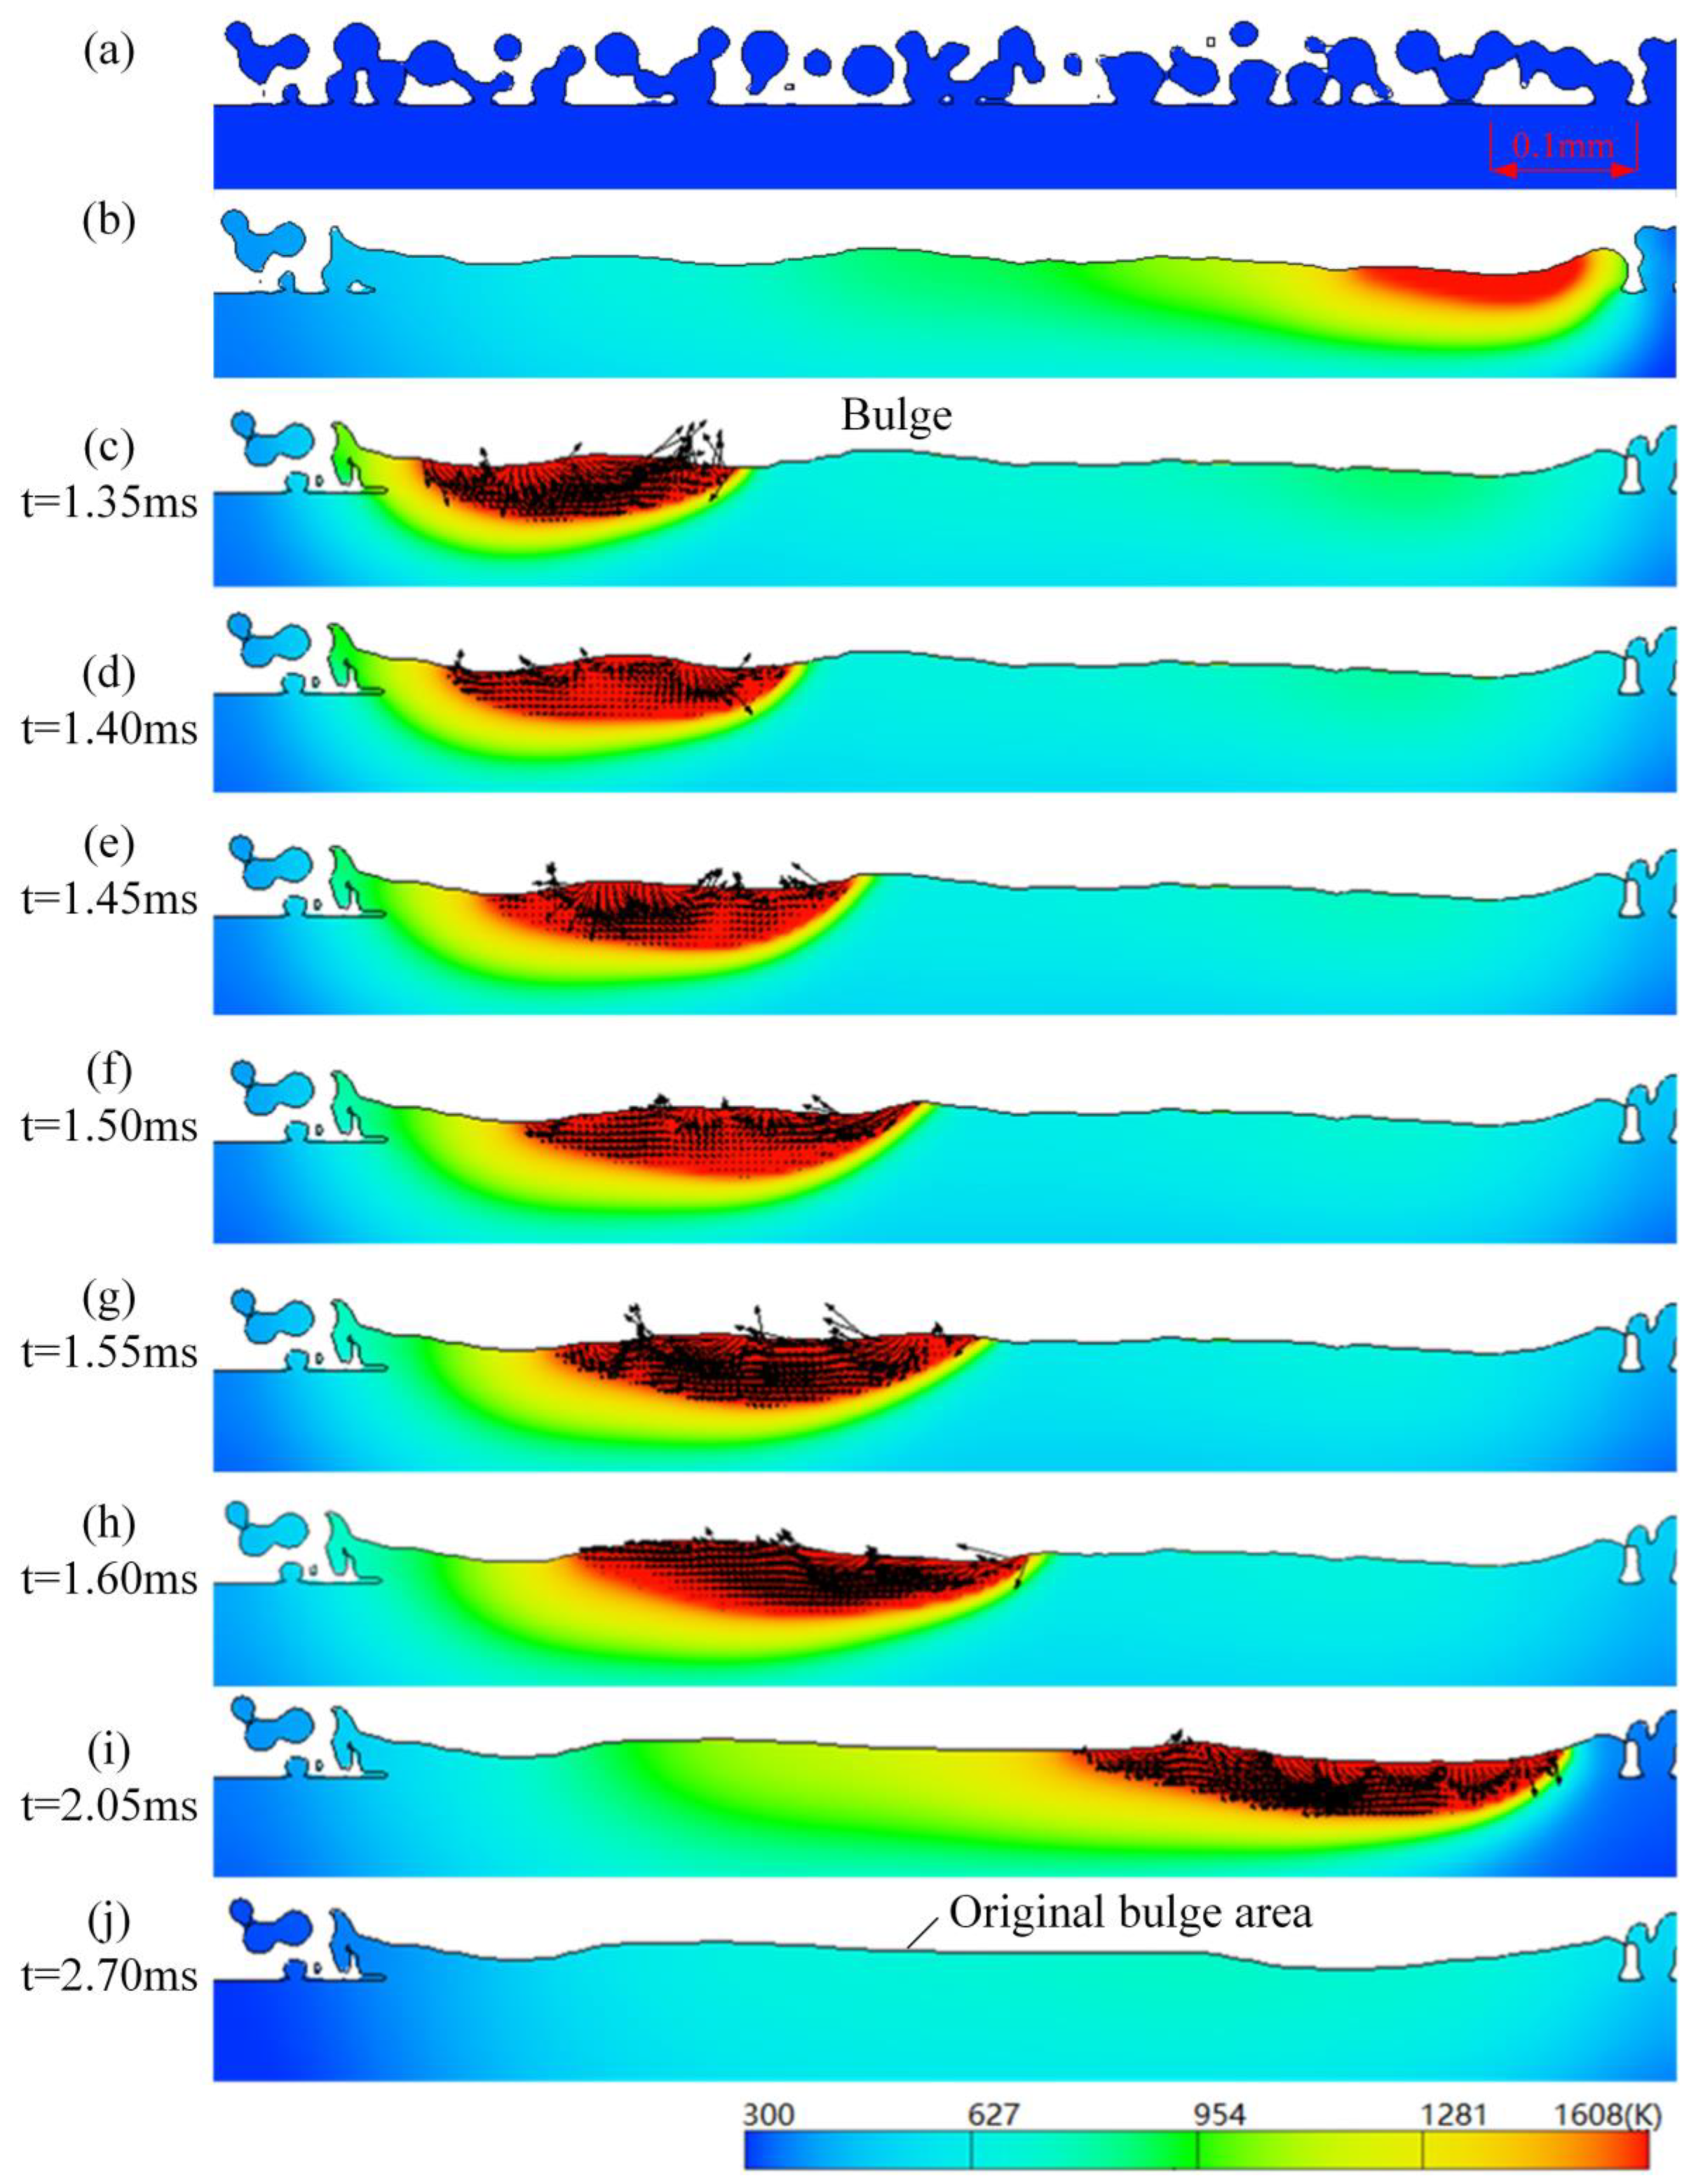
4.2. Surface Morphology Evolution and Molten Pool Dynamics during ILP

To reveal the mechanism of ILP, the evolution of the surface morphology and the molten pool dynamics in the ILP process were studied. Taking the large bulge in the middle of Figure 11c as an example, it is described how the surface topography of the SLMed track is altered by ILP. Figure 11 is a x-z view of the center of the track, the contour is the temperature contour, and the arrow is the molten pool velocity vector. Figure 11a shows the initial state of the powder bed. Figure 11b shows the surface profile after SLM. When t = 1.35 ms, the track of the SLM has been completely solidified, but the temperature of the original molten pool area is still about 1000 K, and the temperature of other areas is also higher than the ambient temperature. The temperature accumulation in the SLM stage is beneficial for the ILP process. At this time, the ILP molten pool has not yet touched the bulge. The laser is just acting on the track, and the energy input is low, and the temperature gradient of the molten pool is low.
Among the internal forces in the molten pool, surface tension (capillary force) plays a leading role. As shown in Figure 11, the velocity vectors of the molten pool surface mostly point to the center of the molten pool. The surface area of the molten pool tends to be reduced by surface tension, which may lead to balling [35]. When t = 1.40 ms, as shown in Figure 11d, the molten pool is elongated at this time, and the Marangoni flow effect appears behind it. These indicate that there is a surface tension gradient at the gas-liquid interface. A vortex appears in the middle of the molten pool. The circulation of the liquid in the molten pool can be accelerated by the vortex, thereby the cooling and solidification of the molten metal are also accelerated [28]. At the front of the molten pool, the velocity vector points to the bulge. The molten pool begins to wet the bulge and the heat transfers to the bulge. This is the accumulation of heat for the molten pool to swallow the bulge. When t = 1.45 ms, as shown in Figure 11e, with the forward movement of the laser and the influence of the wetting behavior of the molten pool, the left half of the bulge has been swallowed by the molten pool [41]. The molten pool does not diffuse downward to the SLM track at the bulge area but flows into the valley under the action of the capillary force [21,22,24], thereby filling the valley. This flow trend can be seen in Figure 11, which is in the surface shallow melting (SSM) state of LP [42]. When t = 1.50 ms, as shown in Figure 11f, most of the bulge area has been melted. Since the liquid in the bulge area flows to the lower left of the bulge under the action of capillary force, the bulge in Figure 11e has been flattened at this moment.
At this moment, the remaining bulge area wetted by the molten pool also has this flow to the lower left. When t = 1.55 ms, as shown in Figure 11g, the bulge has been completely swallowed by the molten pool, which is in the surface over melting (SOM) state of LP [42]. The capillary force and thermocapillary force work together [22,24,41] in the molten pool. There is a downward flow driven by capillary force and a tangential flow driven by thermocapillary force. The capillary force plays a major role, which gradually reduces the curvature of the bulge. When t = 1.60 ms, the original bulge was eliminated under the driving of capillary force. At this time, the thermocapillary force plays a major role, as shown in Figure 11h. When t = 2.05 ms, as shown in Figure 11i, the molten pool at the original bulge area is completely solidified and becomes flat under the action of ILP. When t = 2.7 ms, as shown in Figure 11j, the laser no longer acts on the track, and the molten pool is completely solidified. Several bulges in the as-SLMed track disappear, and the track becomes smooth. However, there are depressions at both ends of the track, indicating that new surface defects will also be generated during the ILP process.
The main driving force in the molten pool changes with the development of the molten pool. When the bulge begins to be swallowed by the molten pool, capillary force dominates, causing the liquid in the molten pool to flow to the lower left of the bulge along the slope. When the bulge is completely swallowed by the molten pool, the capillary force continues to dominate, causing a downward normal flow of the molten pool to reduce the curvature of the bulge. As the curvature of the bulge decreases, the effect of capillary force is gradually weakened, and the thermocapillary force becomes the main driving force in the molten pool.
The surface roughness of SLMed parts is reduced by ILP. That is, as the laser advances and under the action of the wettability of the molten pool, the bulges on the surface of the SLMed part are constantly swallowed by the molten pool. The molten material at the bulge is moved backward by the combined action of capillary force and thermal capillary force and is redistributed in the molten pool. The surface becomes flat.

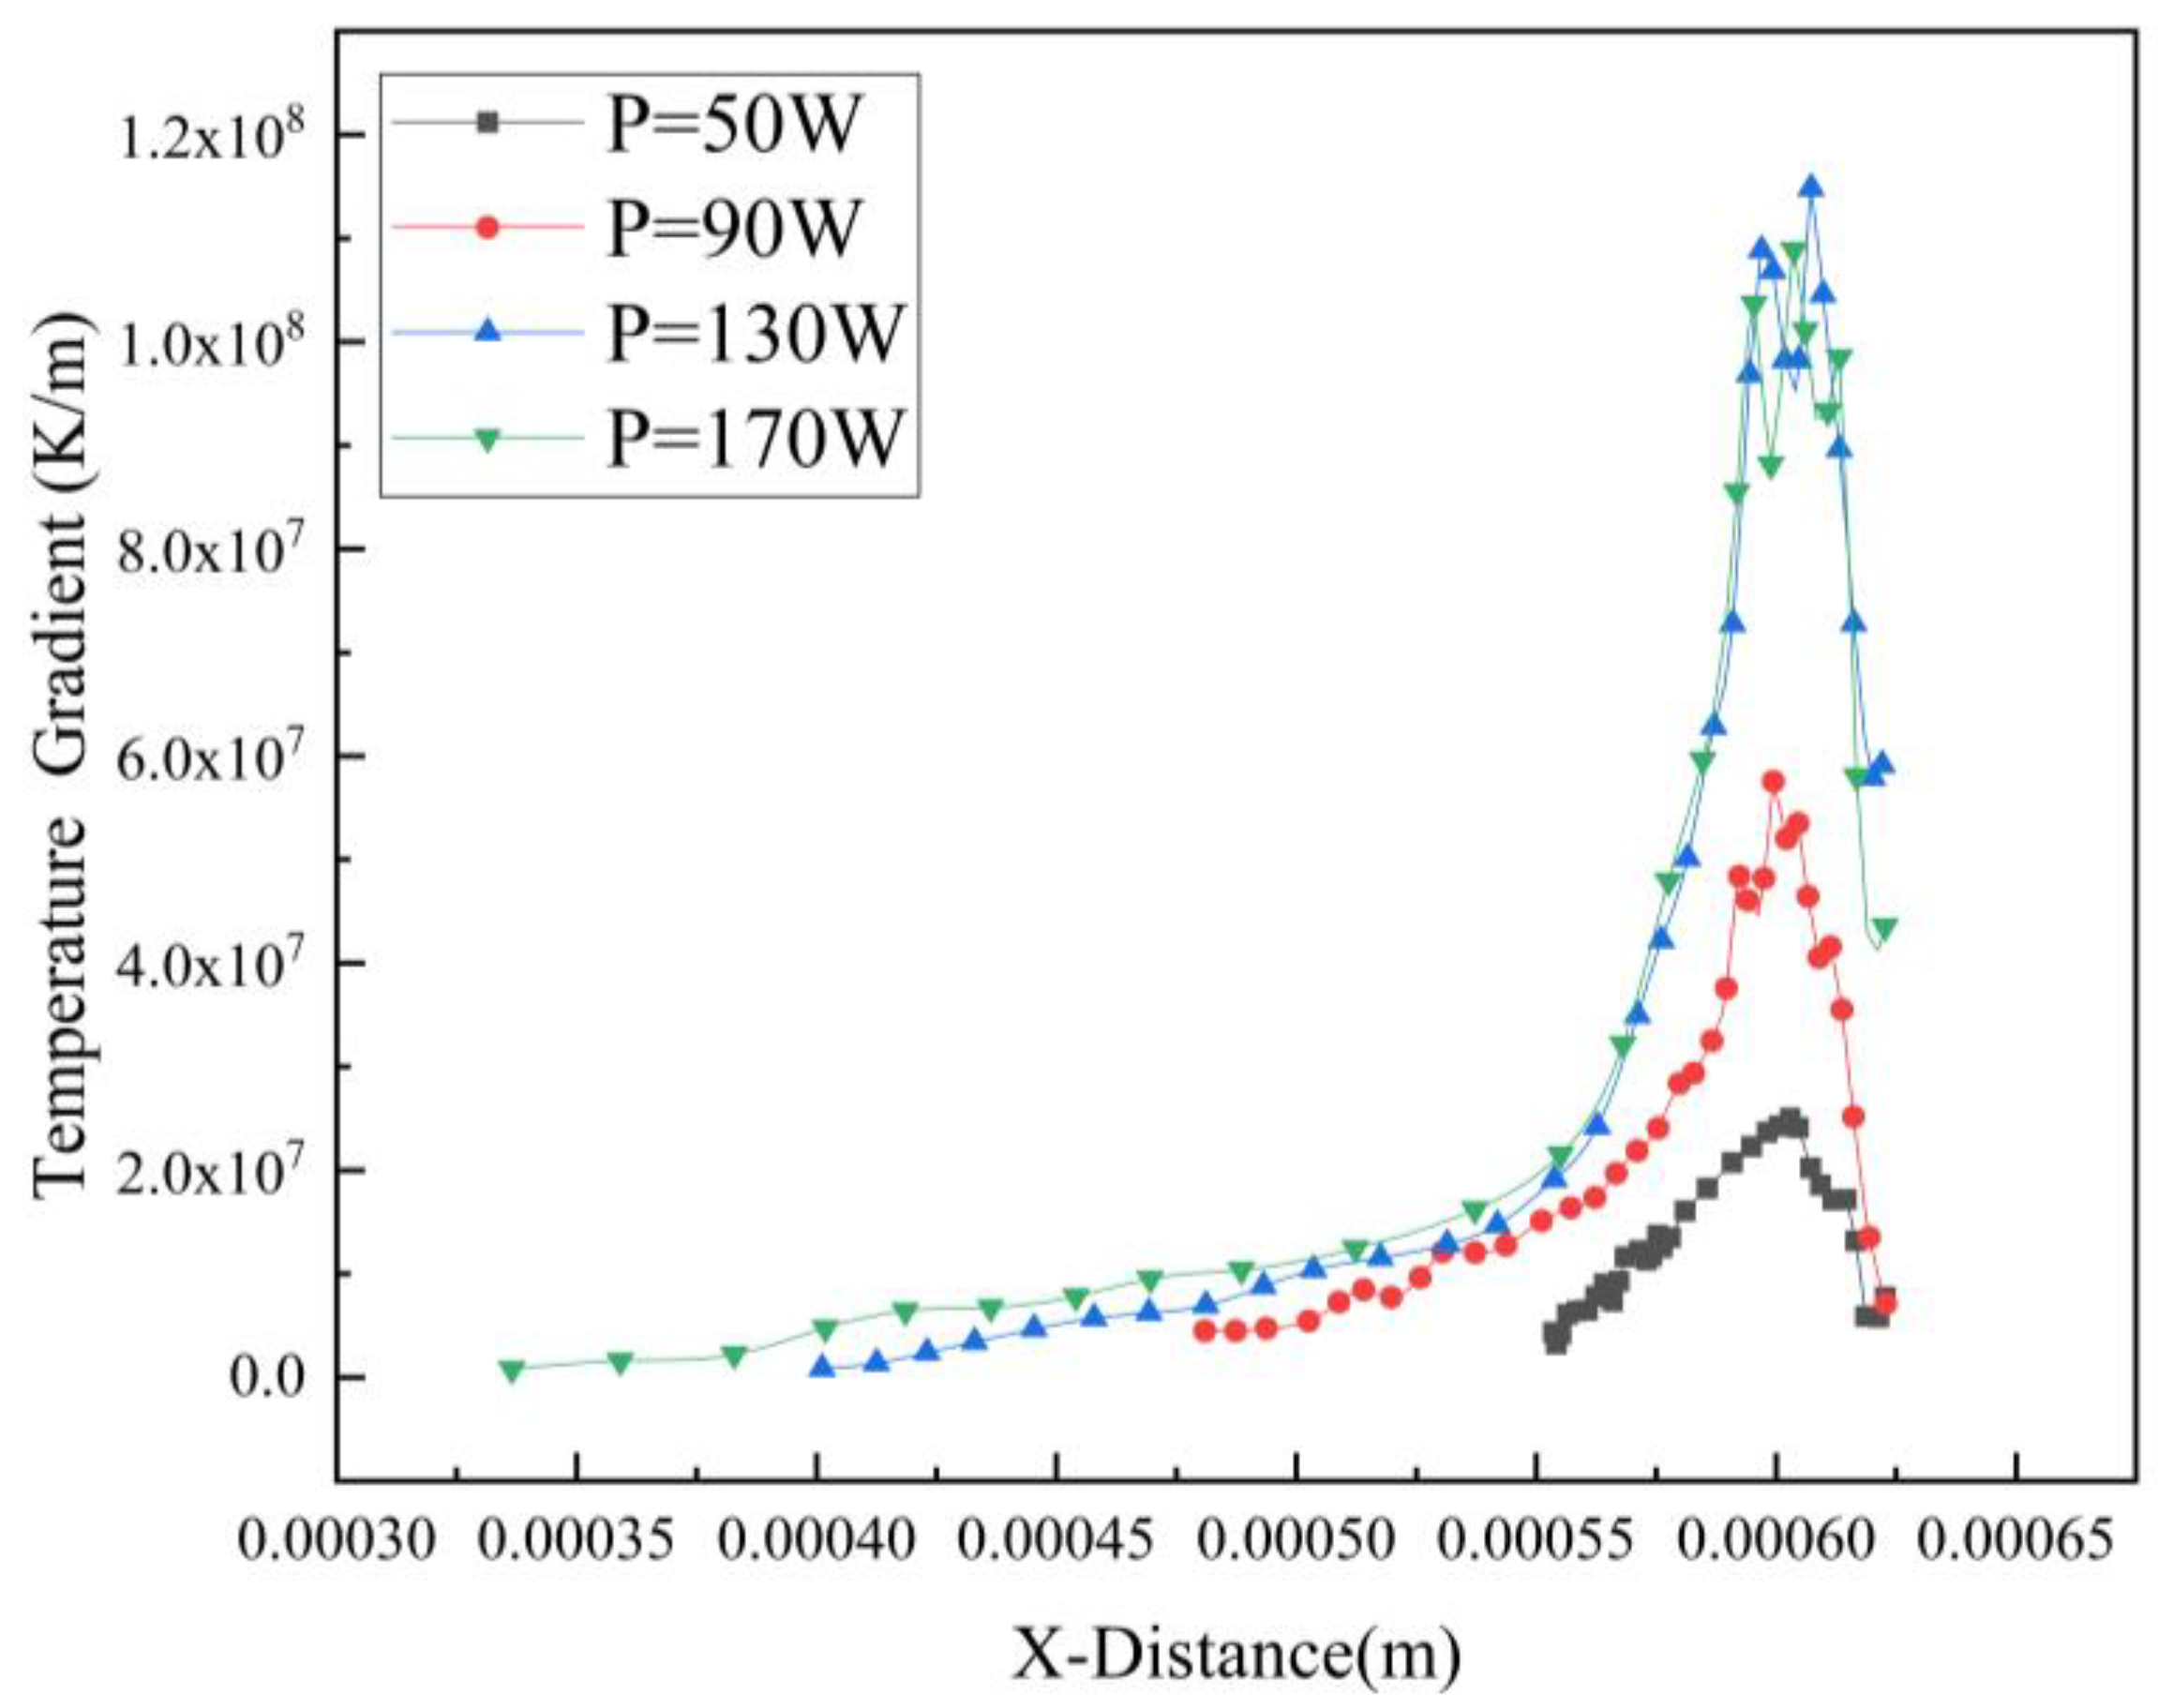
4.3. Effect of ILP Power on the Surface Quality of as-SLMed Track and Its Mechanism

ILP simulations at 50 W, 90 W, 130 W, and 170 W were carried out, and the surface morphology characteristics of all samples and the underlying mechanism were analyzed. Figure 12 shows the cross-sectional of the samples. Figure 12a shows the morphology of the track before ILP, and the track shows an uneven wavy shape, which is caused by the bulge caused by the laser scanning and the lack of fusion and spatter of the powder [18,42]. The surface roughness of the as-SLMed track is 4.9 μm. The coordinate data of the surface points were extracted in the simulation software, and Sa was calculated by the formula (1). The track morphology at an ILP power of 50 W is shown in Figure 12b. It can be seen that the length and height of each bulge are reduced, but the overall surface roughness changes little, only 0.1 μm less than the as-SLMed surface roughness. When the power of the ILP is 90 W, as shown in Figure 12c, the length and height of each bulge are further reduced. Due to the short life of the molten pool, the bulges do not completely disappear [23], and the surface roughness is reduced to 4.0 μm. From the three-dimensional surface morphology of Figure 12, the surface morphology of 50 W and 90 W has no significant change compared with the as-SLMed. When the ILP power is 130 W, the life of the molten pool is increased. As shown in Figure 12d, the original bulges are eliminated after ILP, but new bulges are generated, and depressions are generated at both ends of the track surface. From Figure 12d, the surface morphology has changed greatly compared with the as-SLMed, and a new surface morphology has been formed. The surface morphology is closely related to the molten pool flow velocity, and too fast flow velocity is not conducive to the formation of good surface morphology [8]. The molten pool flow velocity during ILP was investigated. The location of the monitoring of the molten pool flow velocity point is shown in Figure 12a. This point is melted under all processing conditions. In addition, in the fluctuating melt pool, this point is always in a liquid state. Figure 13 shows the velocity fluctuation during the ILP. As the laser moves, the position of the monitoring point in the molten pool is constantly changing. The flow velocity of the fluid at the monitoring point is also constantly changing, and the flow velocity curve fluctuates accordingly. When the flow velocity is 0, the monitoring point is solidified. The ILP powers are 50 W, 90 W, 130 W, and 170 W, and they solidify at 0.0018 s, 0.0019 s, 0.0020 s, and 0.0022 s, respectively. When the ILP power is at 170 W, the melt pool flow velocity is increased greatly, and the growth range is also greater compared to the first two groups. The large increase in the molten pool velocity makes the molten pool extremely unstable. During the ILP process, the surface morphology of the molten pool changes rapidly, and some bulges will be generated on the surface of the molten pool. Some of the molten materials at the bulges will be brought to other areas during the flow of the molten pool, and some will have solidified before they are redistributed in the molten pool. Periodic waves are generated at the track surface due to the high energy input, as shown in Figure 12e. These waves severely affect the surface roughness. At this time, the surface roughness is 13.4 μm.
The mechanism of depression generation during ILP can be revealed by analyzing the melt pool fluid dynamics results from modelling with 130W laser power. As shown in Figure 14, when t = 1.30 ms, the molten pool at the left end of the track generates a depression under the action of capillary force. When t = 1.40 ms, there is a liquid flow from the bulge to the depression. When t = 1.60 ms, the depression has been solidified but not flattened. This is because when t = 1.40 ms, due to the insufficient heat accumulation, the molten pool size is small and the life is short, which causes the depression to not have enough time to be filled [23]. At t = 1.60 ms, the depression is further deepened due to the accumulation of material on the right side of the depression by the Marangoni flow. The depression on the right side of the track is generated because the material is continuously transported to the left by the Marangoni flow during the laser movement. The depression area transports material to the left area, but the depression area does not receive the material, resulting in a depression, is generated at the right end of the track.
The molten pool flow is used to reveal the mechanism of the formation of the new bulges in the ILP process. Figure 15 shows the velocity fields of the y-z section when the ILP power is 130 W. As shown in Figure 15a, when t = 1.7 ms, the surface tension gradient of the molten pool is greater than 0. The velocity vector points from both sides of the laser scanning track to the center of the track. The molten material on both sides of the track is delivered to the center of the track [21]. At this time, it is in the heating stage of molten pool formation. As shown in Figure 15b, when t = 1.85 ms, the size of the molten pool is the largest, and the molten pool begins to cool at this time. The surface tension gradient is still greater than 0. Both sides of the track transport material to the center of the track, and a bulge has been generated in the center at this time. When t = 1.90 ms, as shown in Figure 15c, the surface tension gradient of the molten pool becomes negative. The bulge in the center of the track begins to transport material to both sides of the track. When t = 1.95 ms, as shown in Figure 15d, the molten pool surface becomes flat under the action of the previous negative surface tension gradient. However, at this time, the surface tension gradient of the molten pool becomes positive, and both sides of the track transport materials to the center of the track. At t = 2.0 ms, a bulge is generated in the center of the track in the melt pool, as in Figure 15e, and the bulge is dragged up by the velocity vector. When the molten pool is completely solidified, as shown in Figure 15f, the bulge still exists. The formation of the bulge has a great relationship with the surface tension gradient, and the final formation of the surface bulge depends on the surface tension gradient during the cooling stage of the molten pool. The thermal capillary force affected by surface-active elements is the driving force for the tangential flow of the molten pool [24], and it plays a major role in the formation of bulges [21,37]. If the bulge created in the transverse direction is hemispherical, it will also be seen in the longitudinal direction. If it is semi-cylindrical, it will not be seen in a longitudinal direction. However, both will increase the surface roughness. The bulge in Figure 15 resembled a semi-cylindrical shape. When the ILP power is 130 W, there is no further reduction in surface roughness due to the presence of new depressions and new bulges. However, the surface roughness is still reduced to 4.6 μm.
The ILP power is a key factor in improving surface quality. At the appropriate power, the molten material will be redistributed on the metal surface under the combined action of capillary and thermocapillary forces. The curvature of the bulges is reduced, and the depressions are filled, thereby the surface roughness is reduced, as shown in Figure 12c. As the laser power increases, the life of the molten pool is increased and the molten material has more time to be redistributed on the surface, resulting in the surface roughness being further reduced. However, after the laser power exceeds a certain value, the surface roughness is not reduced but increased. Increasing the input energy increases the life and instability of the molten pool. During the flow of the molten pool, although the original defects are eliminated, new defects are also created, as shown in Figure 12d,e. Eventually, this leads to the surface roughness being increased.

4.4. Influence of the Interaction between the Tracks on Surface Quality

In order to investigate the effect of the interaction between the tracks on the final surface quality, two three-track simulations were performed. One was for SLM, and the other was for ILP after the SLM with an elapsed time of 0 ms. The processing parameters were the same as those of SLM and Sample-2 in Table 1. The results are shown in Figure 16. The multiple-track has a great improvement in the surface quality compared with single-track. In the single-track simulation, the Sa of the as-SLM sample is 4.9 μm, and the Sa of the ILPed sample is 4.0 μm. While in the multi-track simulation, the two numbers are 3.9 μm and 3.0 μm. In the multiple-track simulation, the surface roughness after ILP is reduced by 23%, which is greater than the 18.4% of the single track. This is because in the multiple-track simulation, the laser heats up and melts the tracks on both sides, which results in the surface having been remelted several times and the surface quality being improved. Therefore, the interaction between the tracks is beneficial to the improvement of the surface quality.
In addition, during SLM and ILP, the interaction between tracks is affected by hatch spacing and spot diameter. If the hatch spacing is too large or the spot diameter is too small, the tracks will not overlap, and they will not affect each other. So, the surface quality of the samples is affected by the hatch spacing and spot diameter, which deserves further study.

5. Conclusions

This paper demonstrates the effectiveness of ILP to improve the surface quality of nickel-based alloys fabricated by SLM. The temperature field, molten pool flow, and surface morphology evolution of the ILP process were studied by numerical simulation. The mechanisms of ILP for surface quality improvement and new defect formation were revealed. The following results were obtained:
(1)
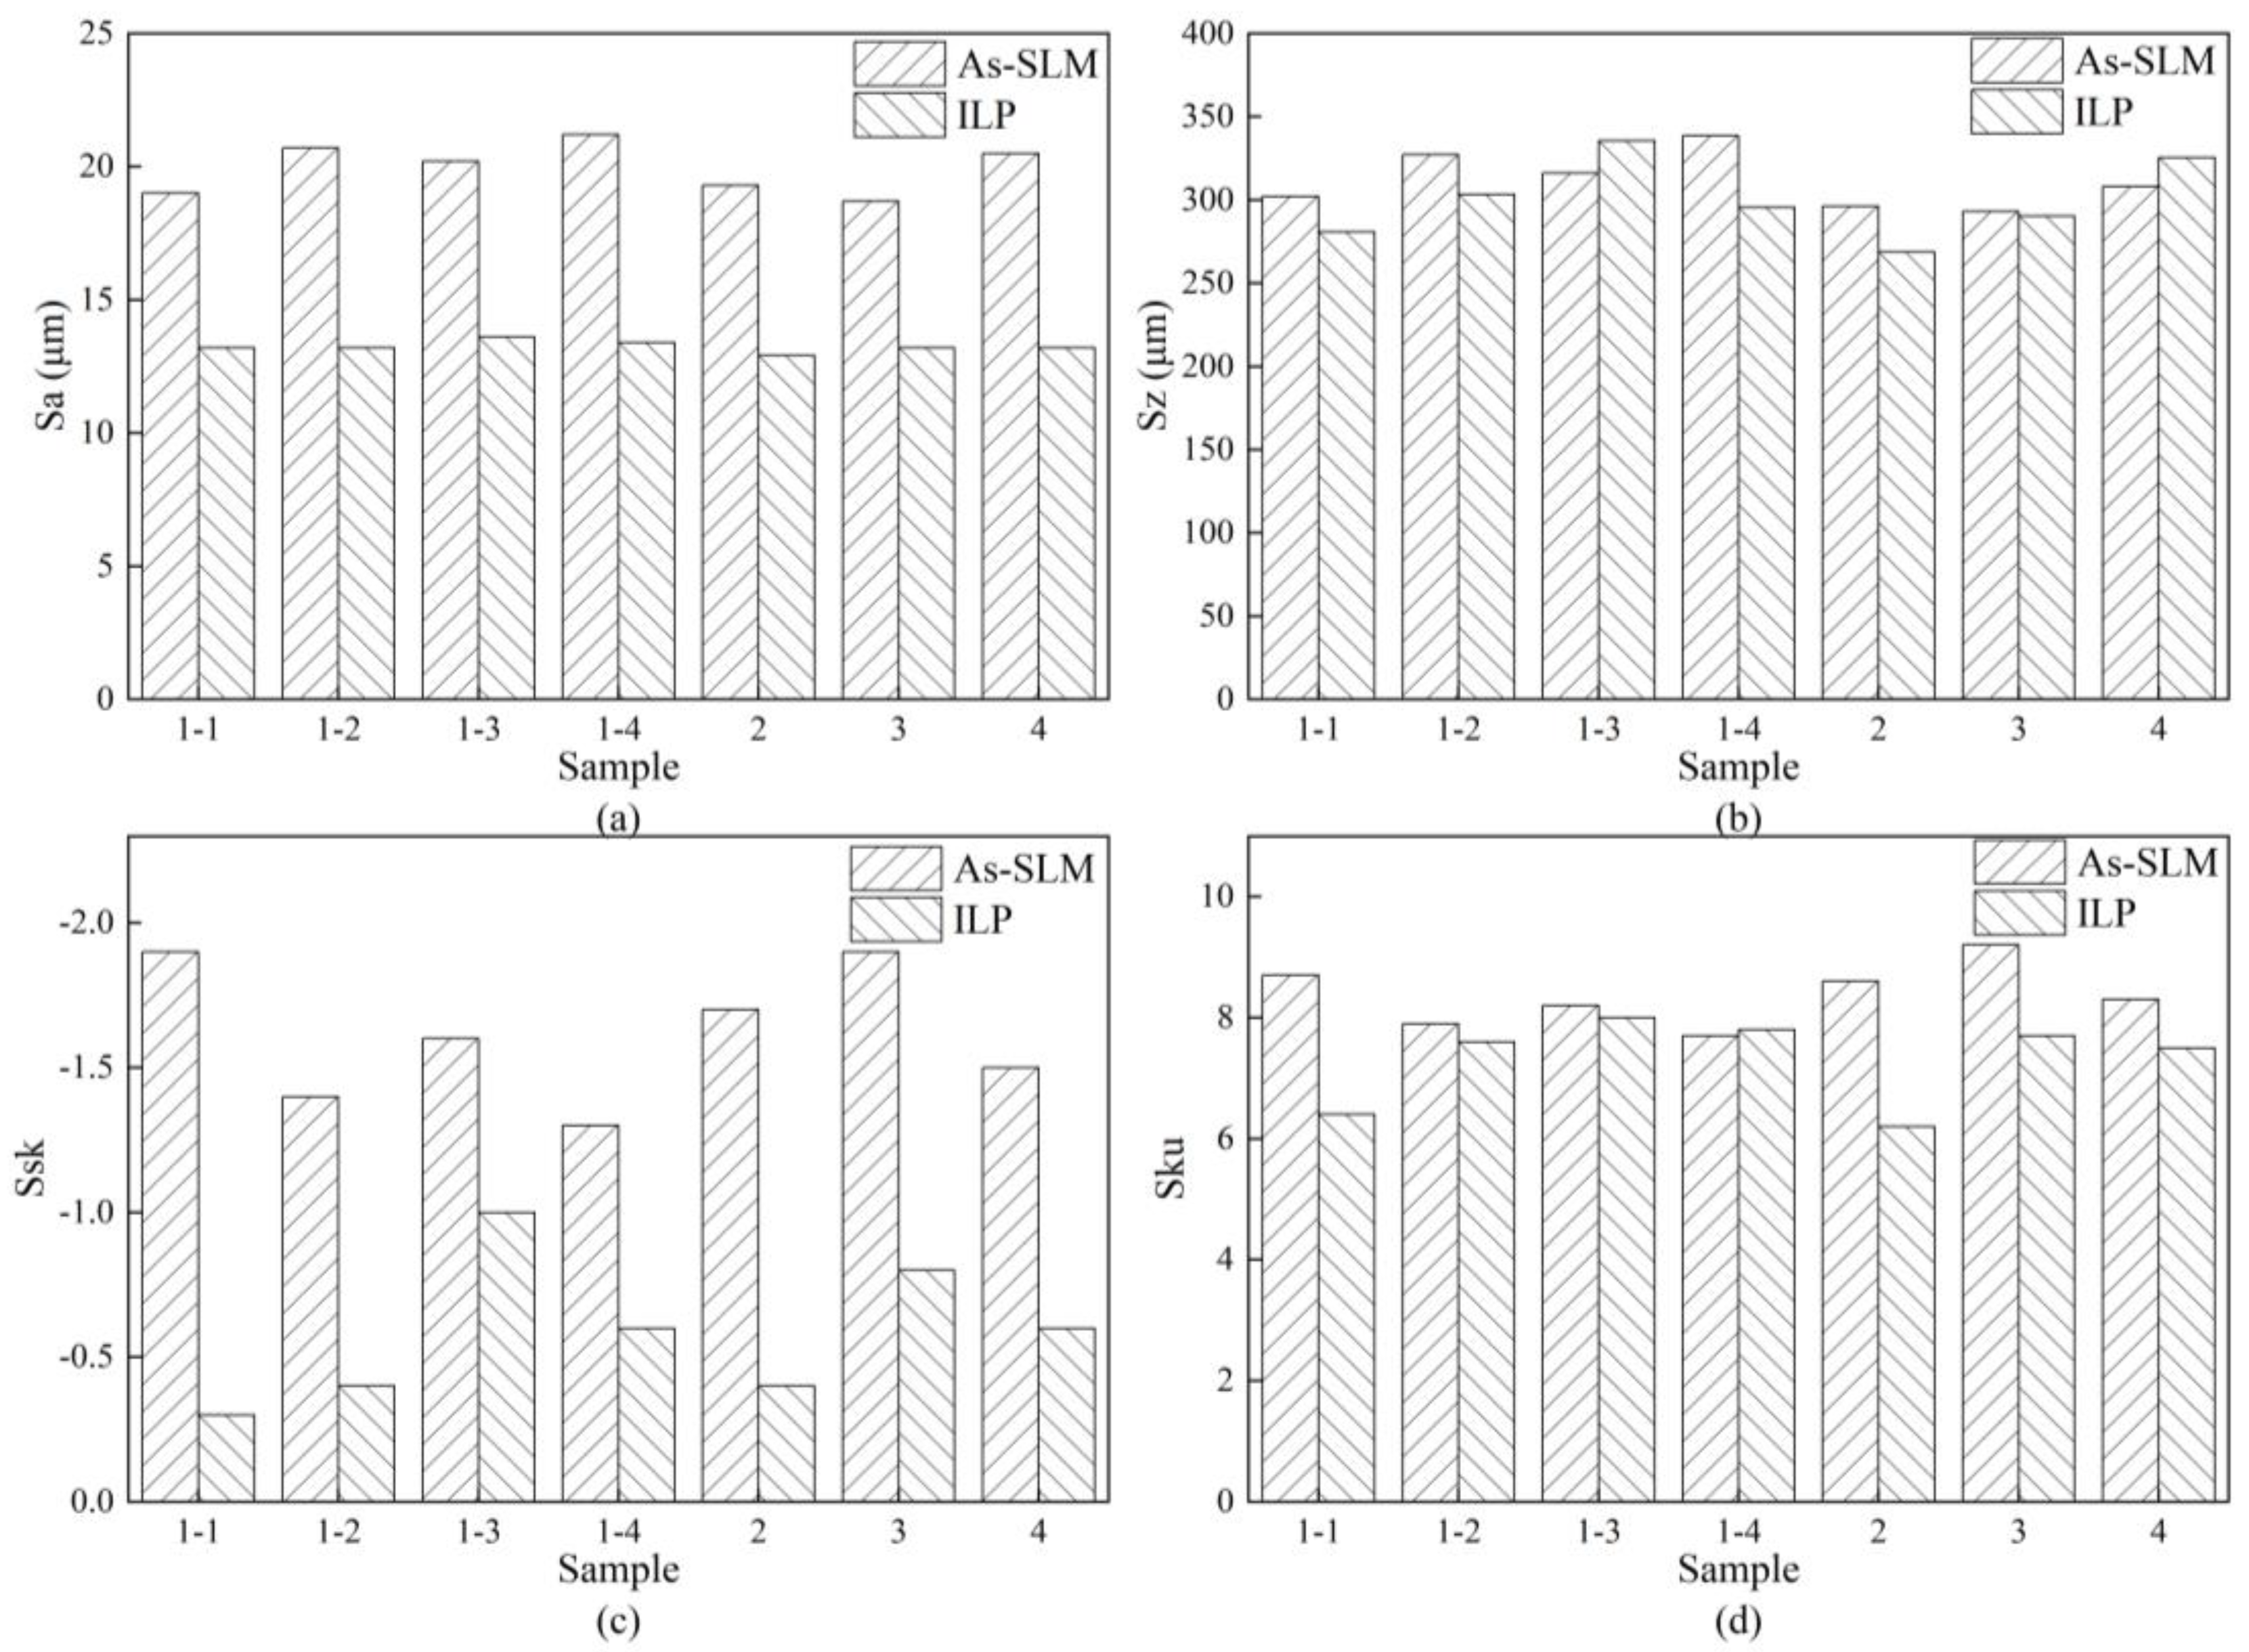
SLM and ILP experiments were performed, respectively. The surface roughness of the SLM samples after ILP is reduced from 20.0 ± 1.25 μm to 13.3 ± 0.35 μm. The quality of the surface is significantly improved, which proves the effectiveness of ILP in improving the surface quality of nickel-based alloys fabricated by SLM;
(2)
During the ILP process, the peak temperature in the ILP stage increases with increasing power, and the life of the molten pool also increases. When the ILP power is 130 W, the peak temperature in the ILP stage exceeds the peak temperature in the SLM stage. The high temperature of the molten pool will make the molten pool unstable, which is not conducive to the improvement of surface quality;
(3)
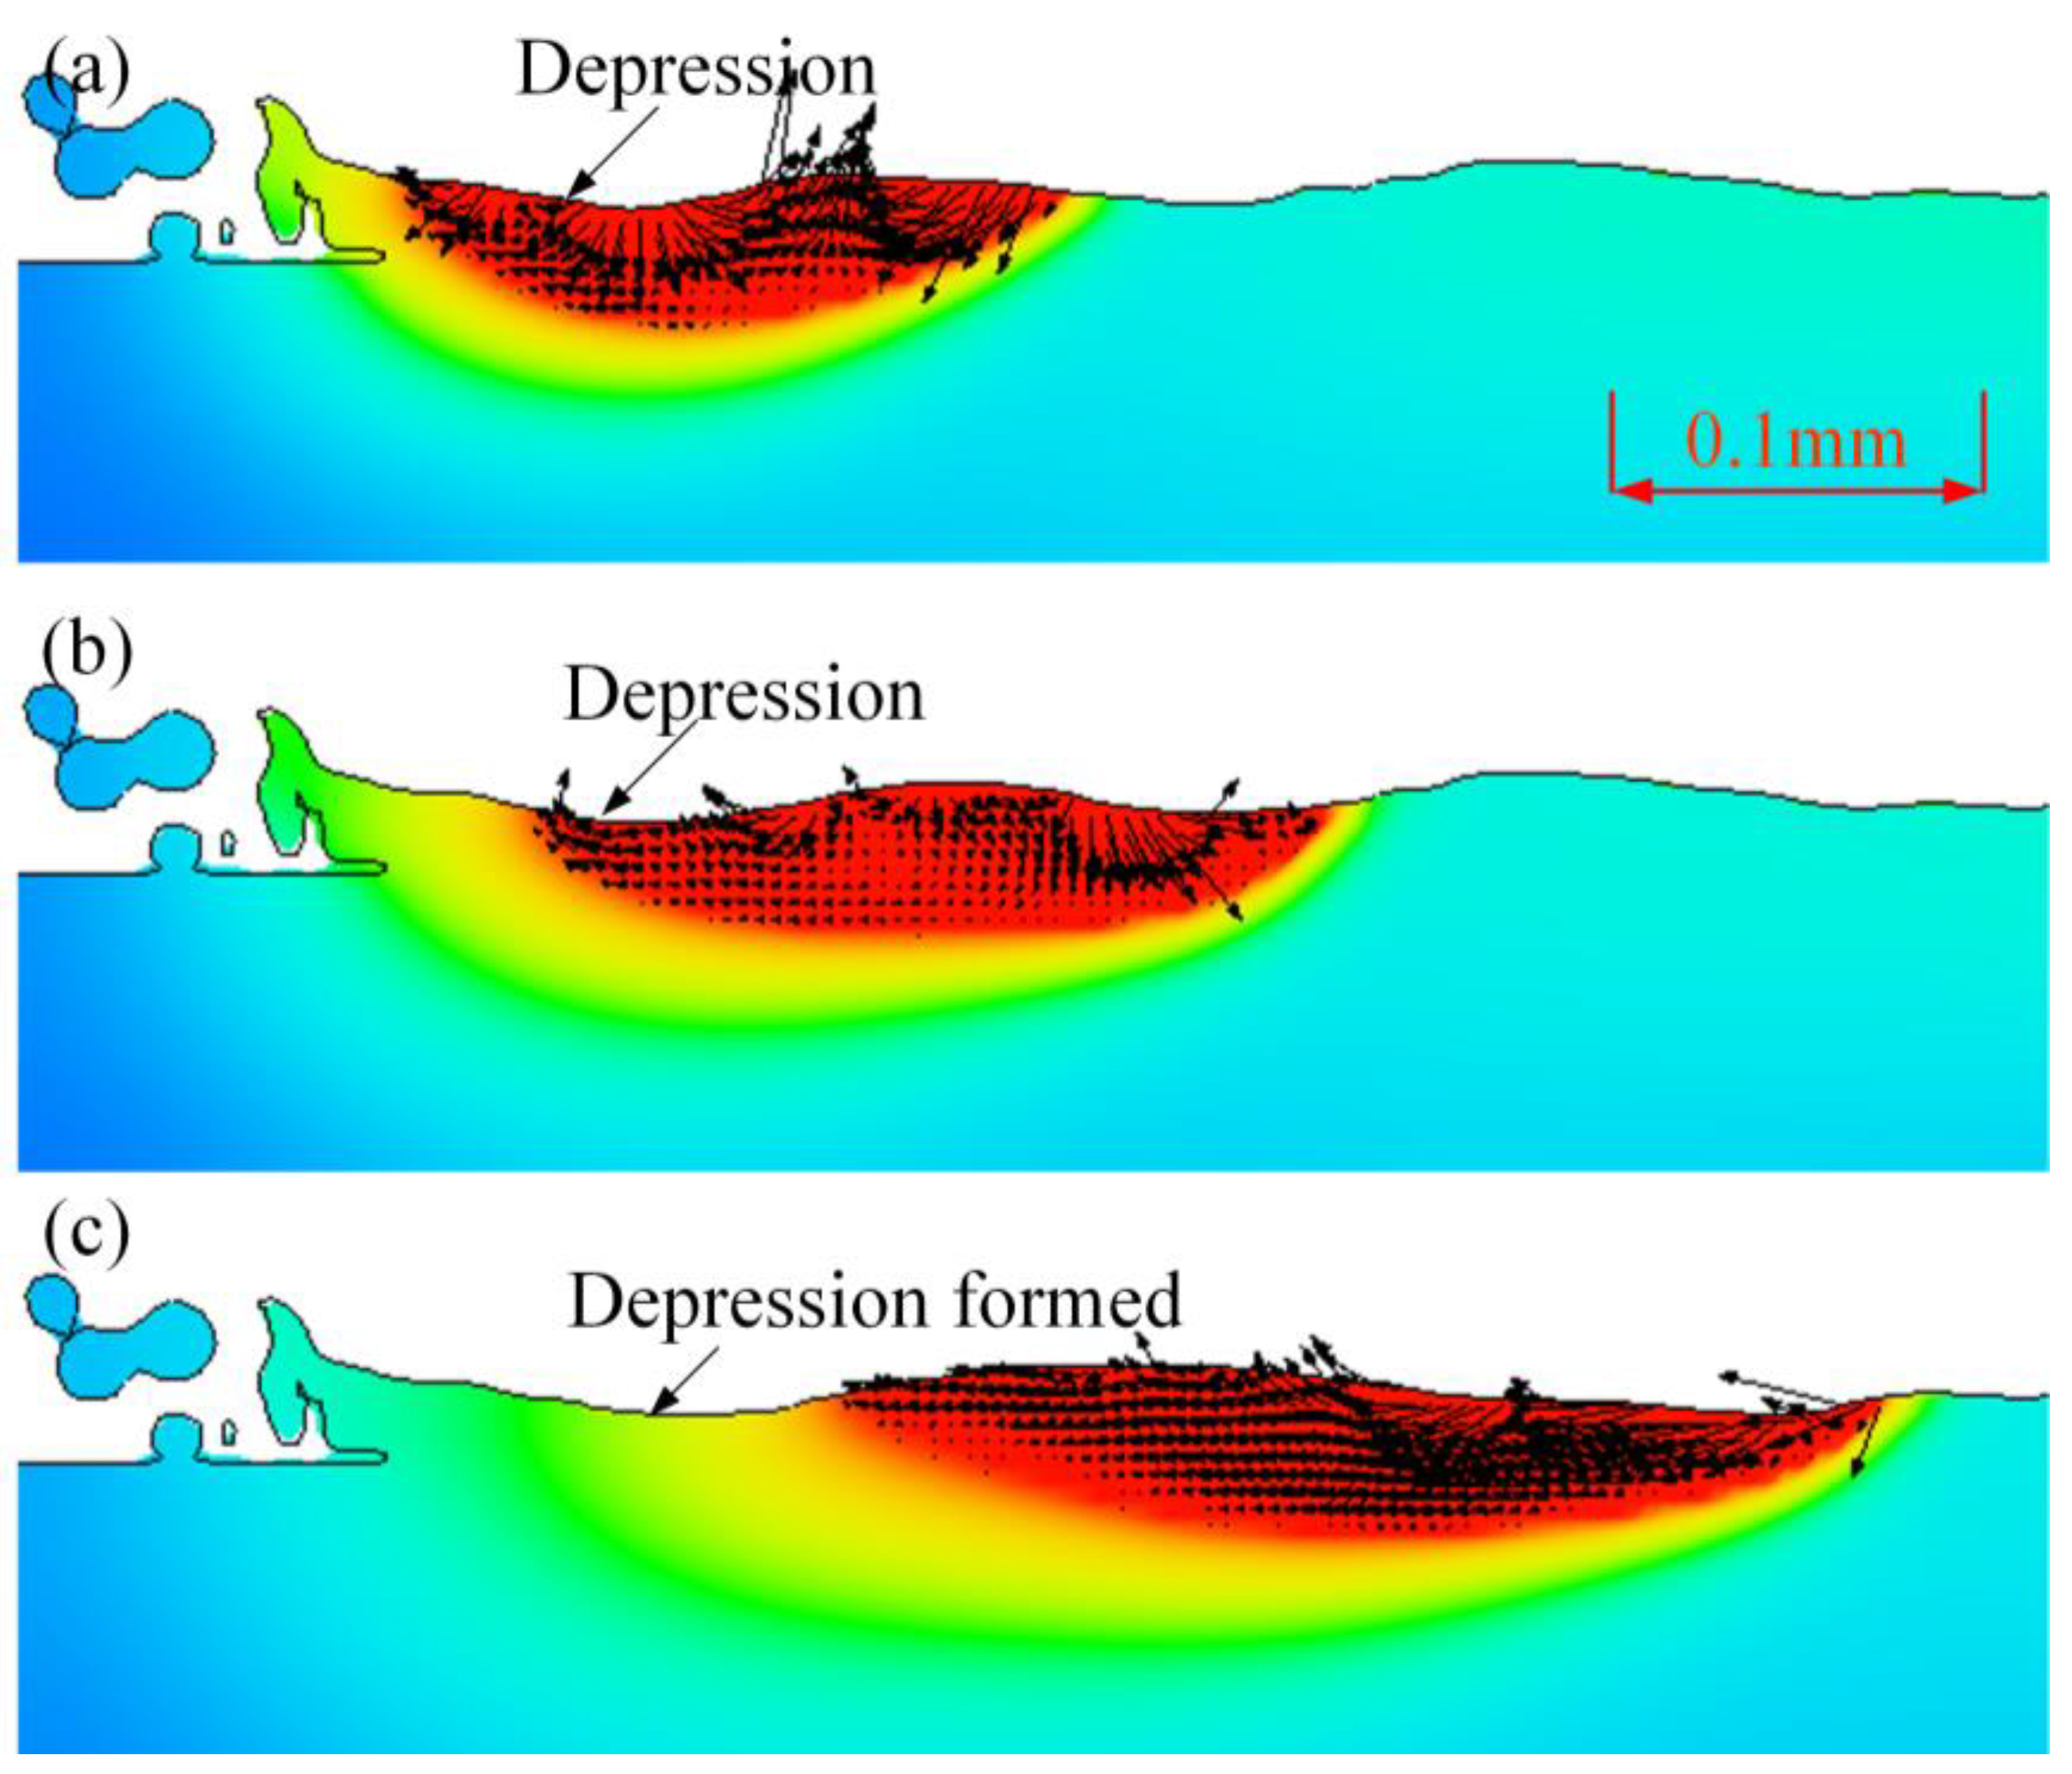
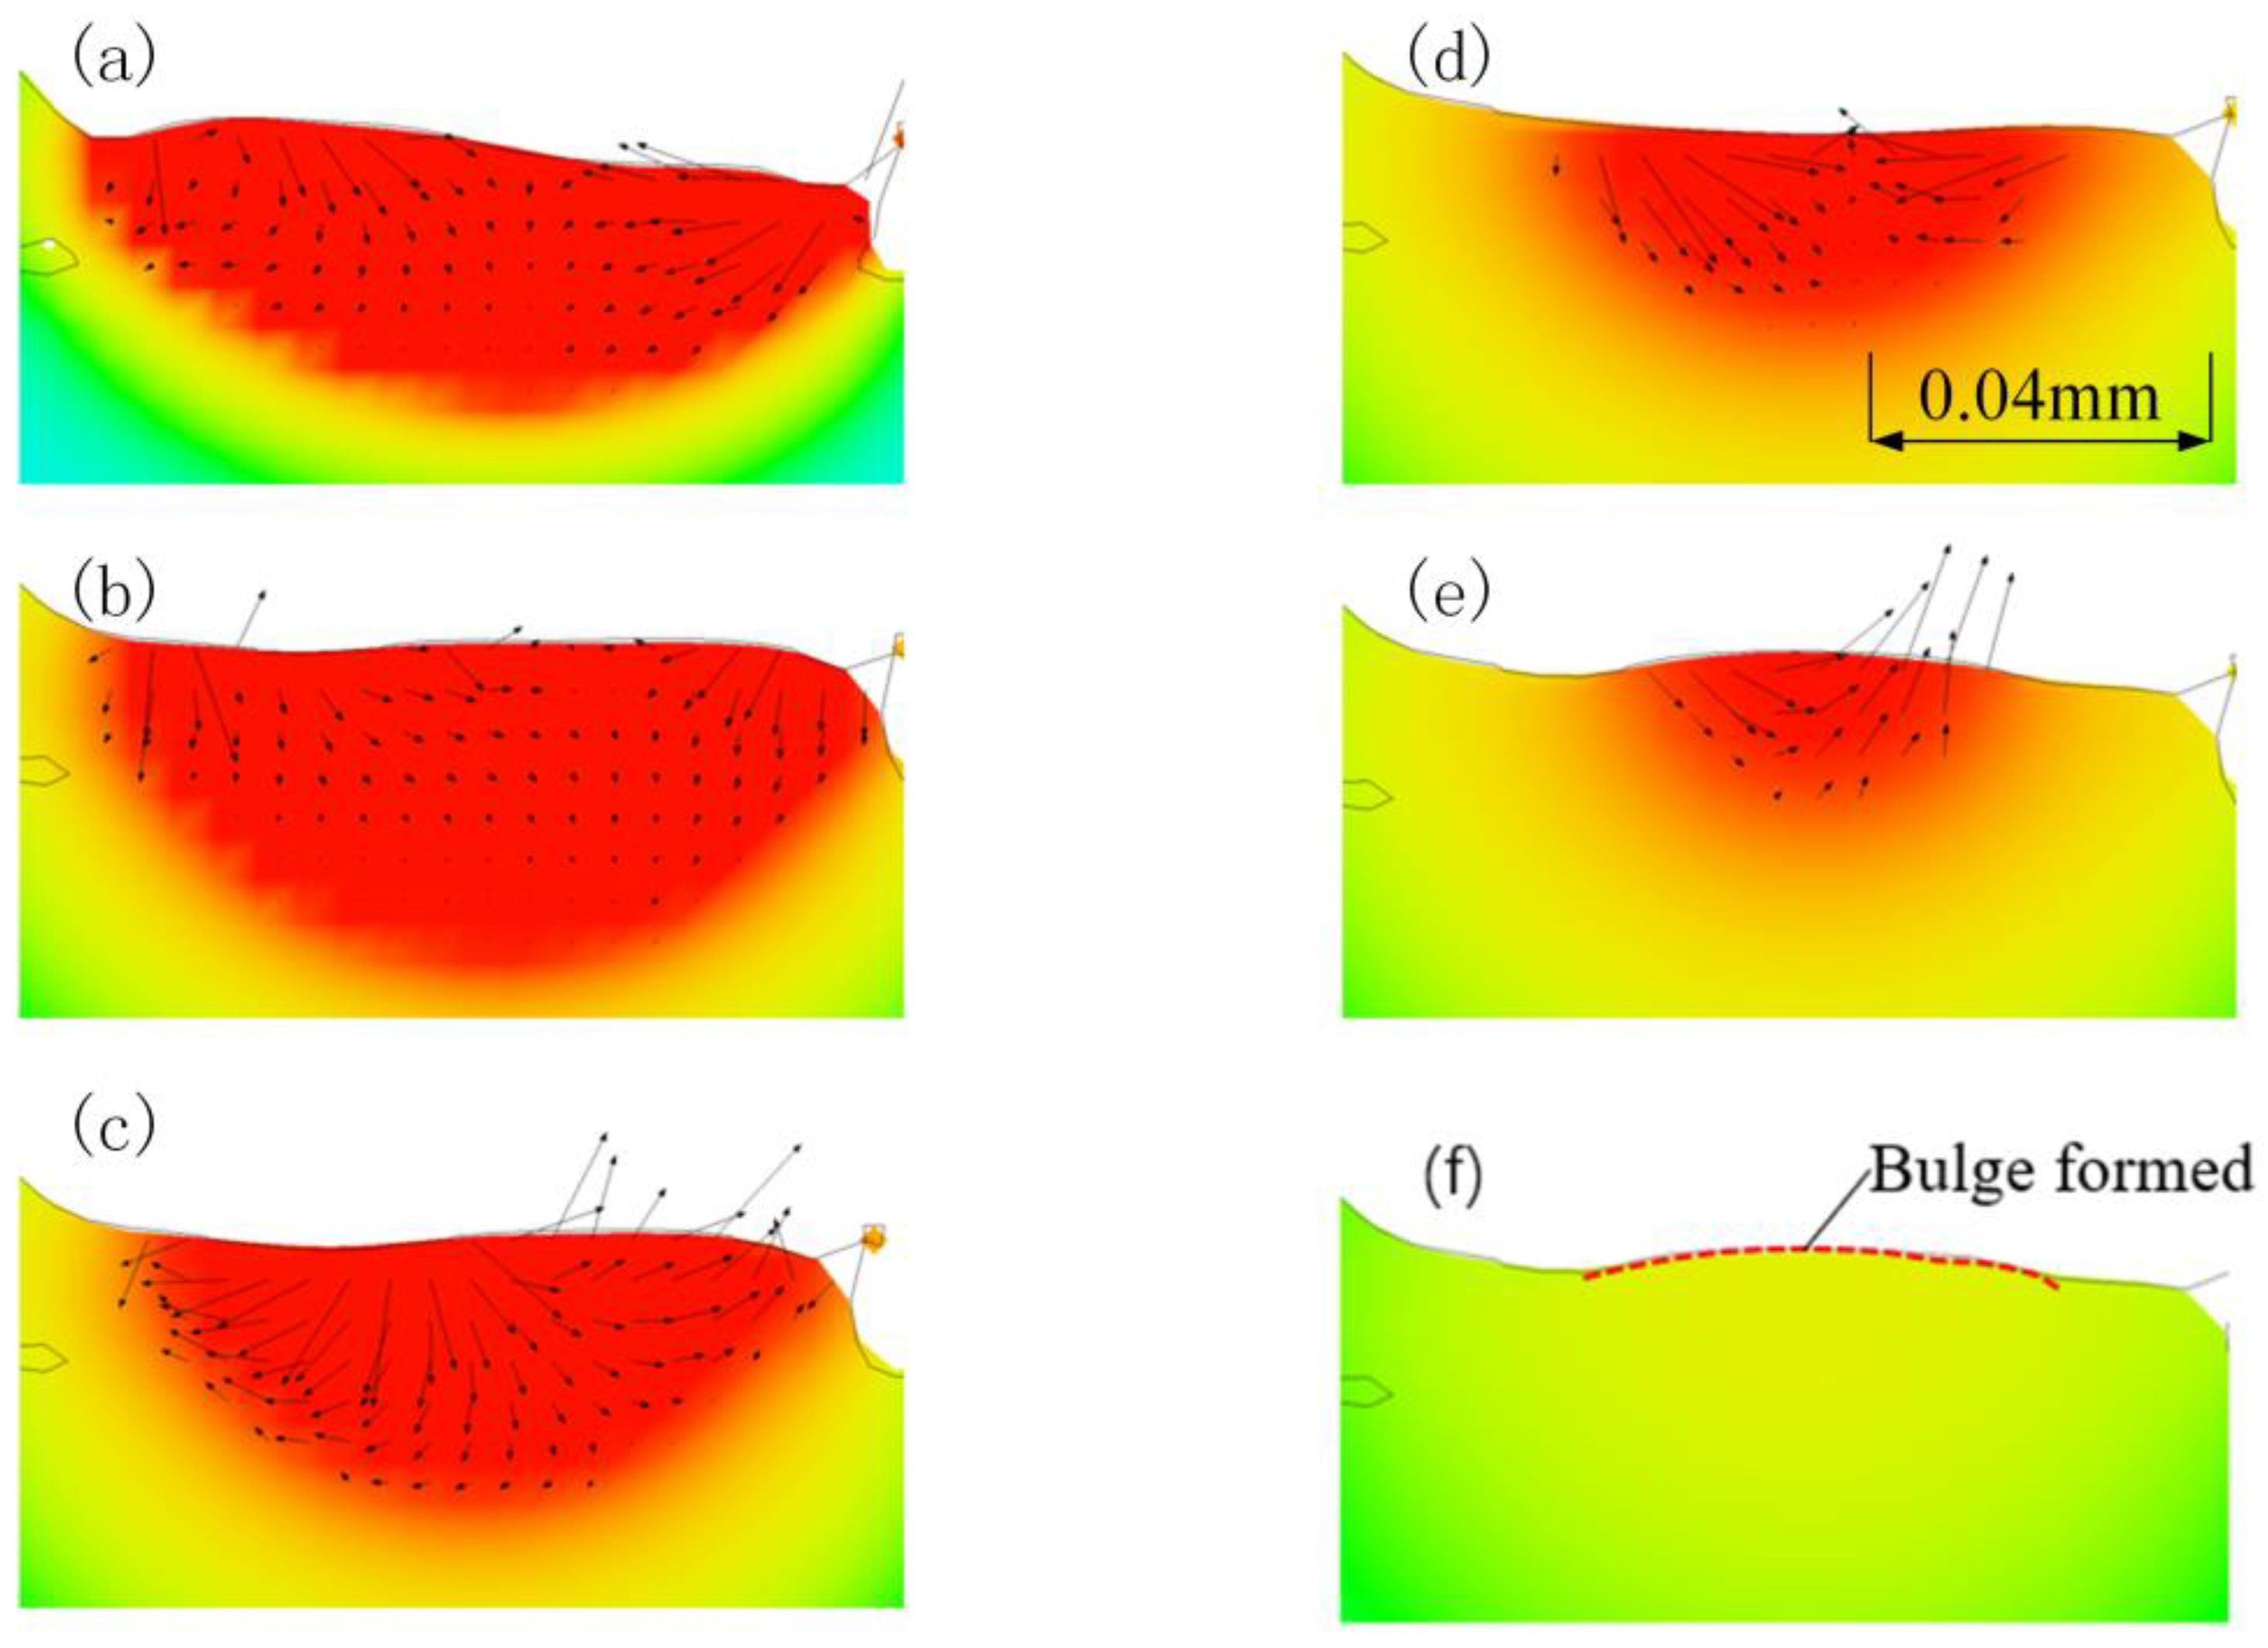
The mechanism of ILP improving the surface quality of SLM parts is that capillary force and thermal capillary force drive the molten pool flow to reduce the curvature of the bulge. During the initial stage of the molten pool swallowing the bulge, capillary force drives the liquid to the left of the bulge. When the bulge is completely swallowed by the molten pool, capillary force drives the molten pool to flow downward. As the curvature of the bulge decreases, the thermocapillary force becomes the main driving force, and the liquid is driven to the back of the molten pool;
(4)
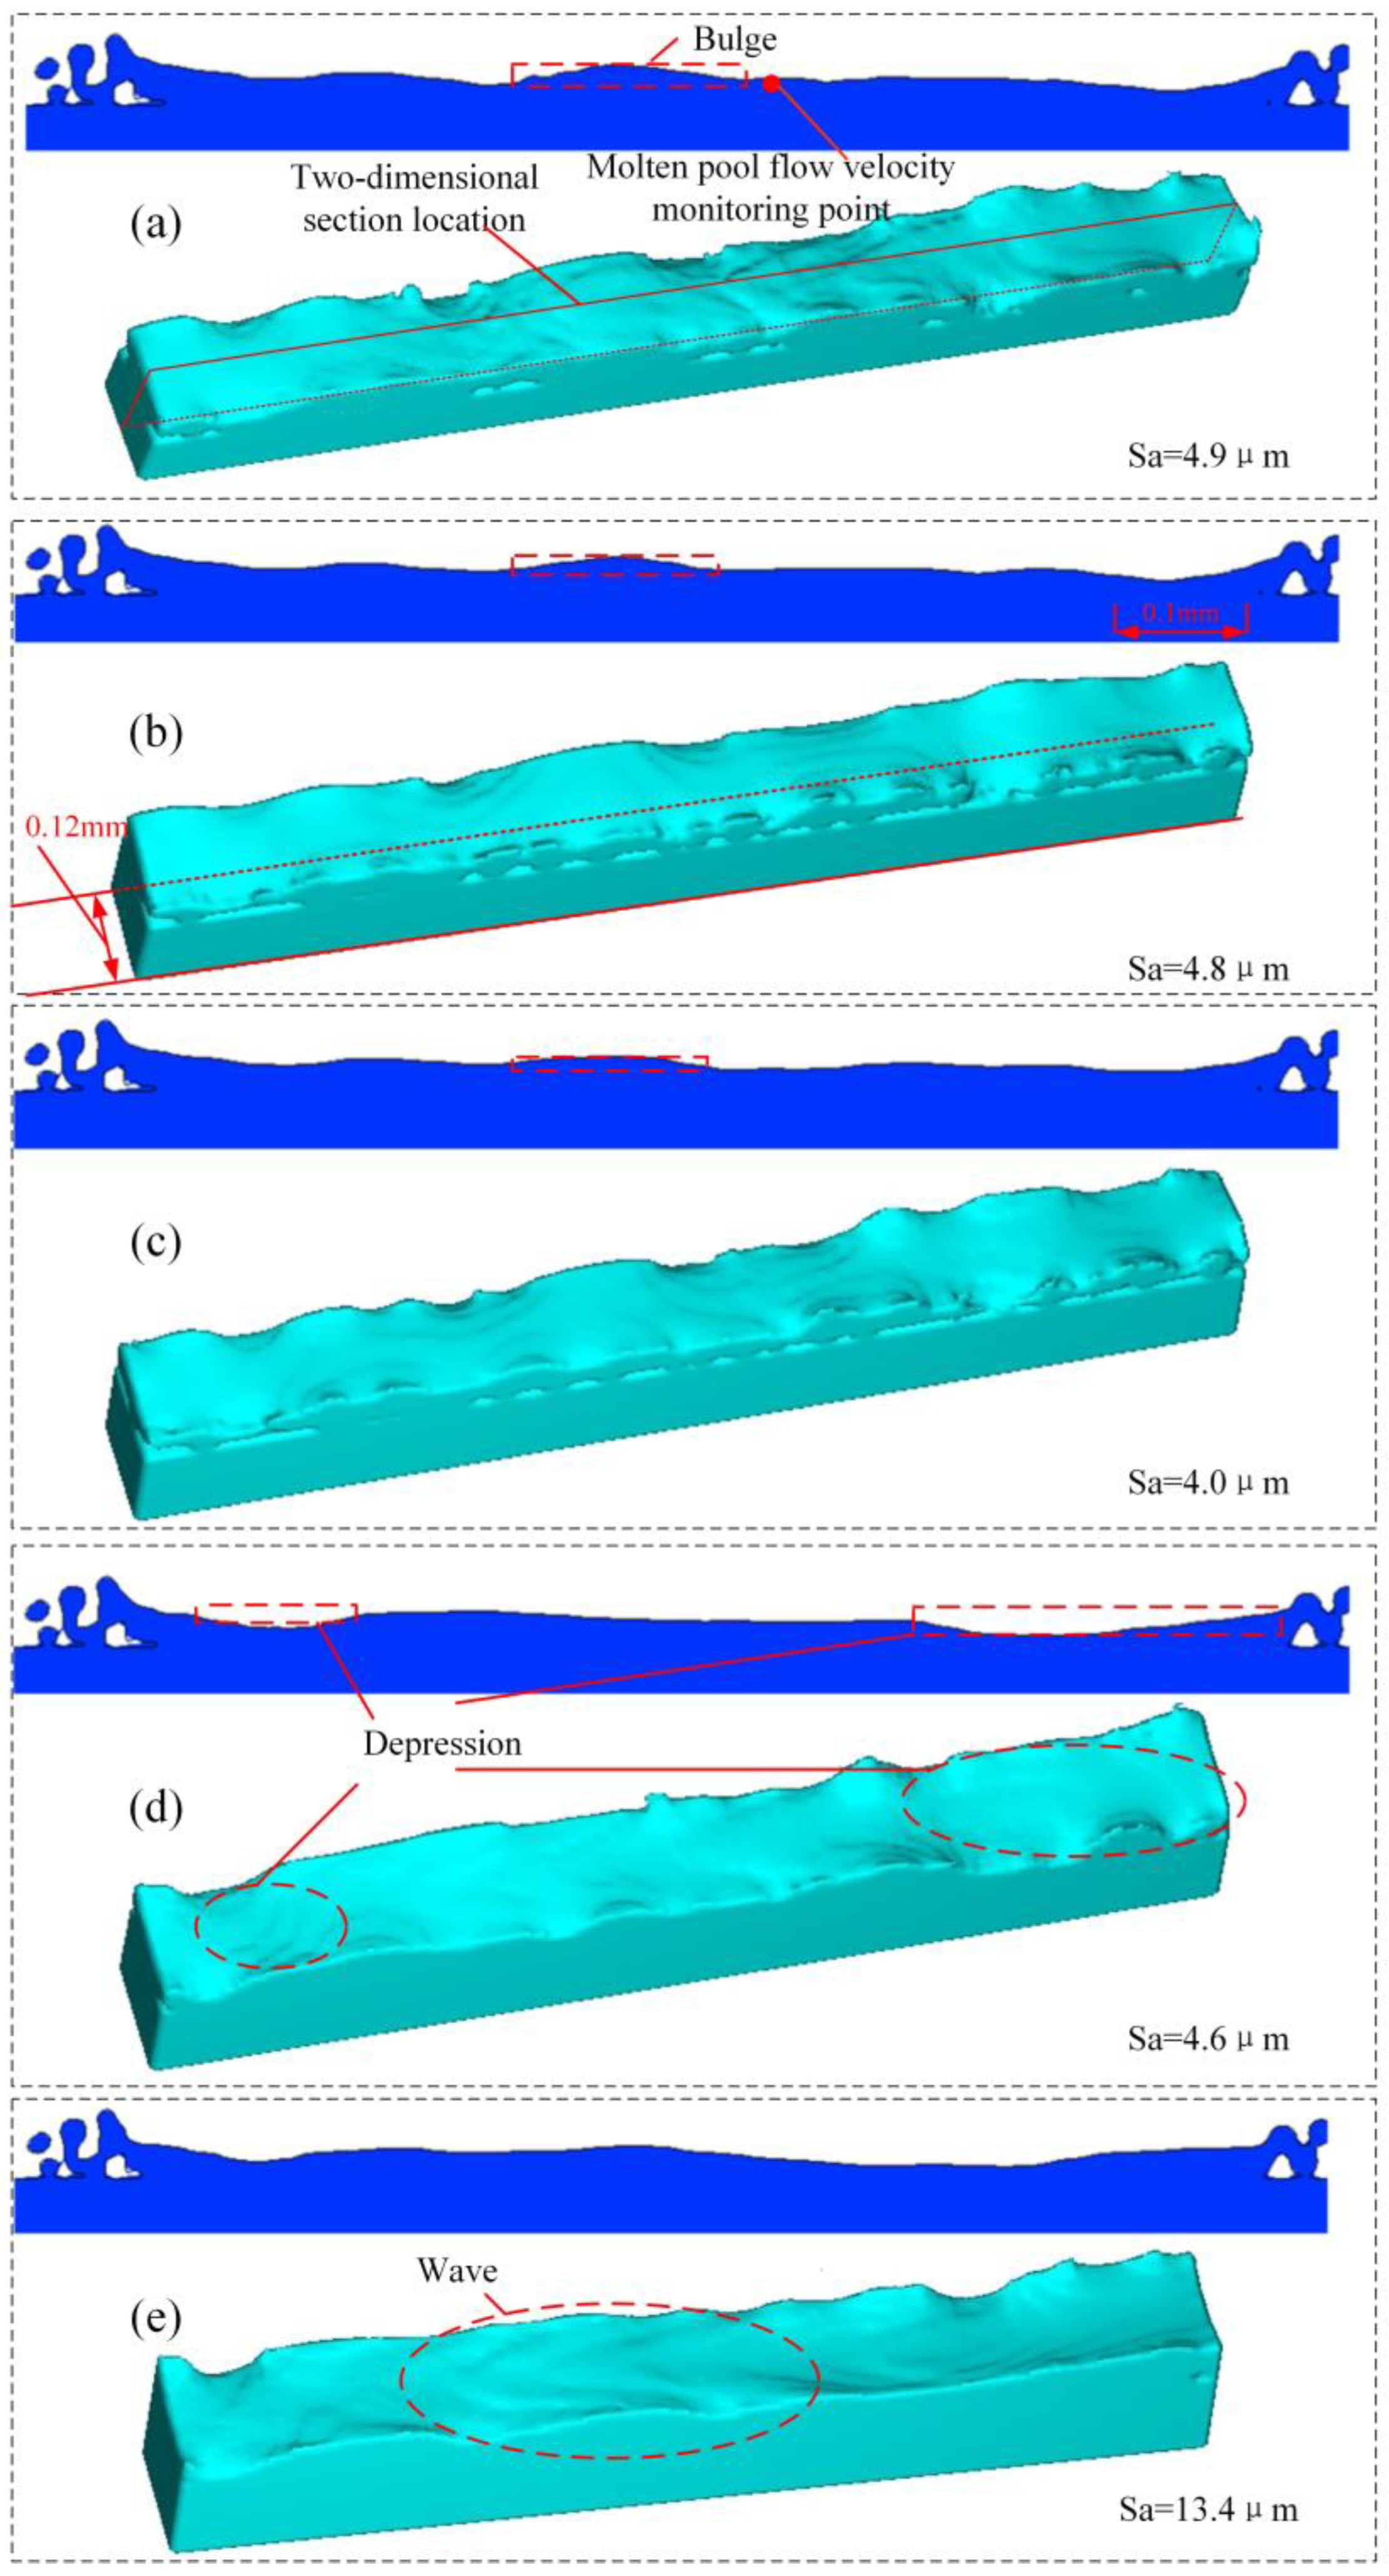
The ILP power has a great influence on the surface quality. If the ILP power is too small, the molten pool life will be short, which is not enough to make the surface bulge disappear, and the effect on the surface quality improvement is limited. If the ILP power is too large, new bulges and depressions will be produced on the track surface, which will affect the surface quality;
(5)
Capillary force during the ILP process leads to the formation of the depression in the molten pool. If the mass transfer caused by the thermocapillary force cannot fill the depression in time, it will cause the formation of a recessed defect on the track surface. The material exchange between the center and both sides of the track caused by the surface tension gradient leads to the formation of the bulges. The final surface bulge depends on the surface tension gradient in the cooling stage of the molten pool.

Author Contributions

Y.Z. designed the experimental plan and supervised the entire work. C.D. established the numerical model and carried out a numerical simulation analysis. P.W. completed the sample preparation, W.M. completed the model verification part, and C.L. completed the sample test. All authors have read and agreed to the published version of the manuscript.

Funding

This research was funded by National Natural Science Foundation of China (Grant No. 51975339,51605262); China Postdoctoral Science Foundation (Grant No. 2019T120602,2017M610439); Youth Innovation and Technology Support Program for University in Shandong Province (Grant No. 2019KJB003).

Informed Consent Statement

Not applicable.

Data Availability Statement

Not applicable.

Acknowledgments

The authors would like to thank Shandong Leishi Intelligent Manufacturing Co., Ltd. for providing the technical support.

Conflicts of Interest

The authors declare no conflict of interest.

References

  1. Wang, Z.; Guan, K.; Gao, M.; Li, X.; Chen, X.; Zeng, X. The microstructure and mechanical properties of deposited-IN718 by selective laser melting. J. Alloys Compd. 2011, 513, 518–523. [Google Scholar] [CrossRef]
  2. Qiu, C.; Chen, H.; Liu, Q.; Yue, S.; Wang, H. On the solidification behaviour and cracking origin of a nickel-based superalloy during selective laser melting. Mater. Charact. 2018, 148, 330–344. [Google Scholar] [CrossRef]
  3. Li, Y.; Zhang, Z.; Guan, Y. Thermodynamics analysis and rapid solidification of laser polished Inconel 718 by selective laser melting. Appl. Surf. Sci. 2020, 511, 145–152. [Google Scholar] [CrossRef]
  4. Li, N.; Huang, S.; Zhang, G.; Qin, R.; Liu, W.; Xiong, H.; Shi, G.; Blackburn, J. Progress in additive manufacturing on new materials: A review. J. Mater. Sci. Technol. 2018, 35, 242–269. [Google Scholar] [CrossRef]
  5. Zhao, Y.; Sun, J.; Li, J.; Yan, Y.; Wang, P. A comparative study on Johnson-Cook and modified Johnson-Cook constitutive material model to predict the dynamic behavior laser additive manufacturing FeCr alloy. J. Alloys Compd. 2017, 723, 179–187. [Google Scholar] [CrossRef]
  6. Zhao, Y.; Sun, J.; Li, J.; Wang, P.; Zheng, Z.; Chen, J.; Yan, Y. The stress coupling mechanism of laser additive and milling subtractive for FeCr alloy made by additive–subtractive composite manufacturing. J. Alloys Compd. 2018, 769, 898–905. [Google Scholar] [CrossRef]
  7. Cao, L.; Zhou, Q.; Han, Y.; Song, B.; Nie, Z.; Xiong, Y.; Xia, L. Review on intelligent monitoring of defects and process control of selective laser melting additive manufacturing. Acta Aeronaut. Astronaut. Sin. 2020, 65, 199–233. [Google Scholar] [CrossRef]
  8. Jain, S.; Corliss, M.; Tai, B.; Hung, W. Electrochemical polishing of selective laser melted Inconel 718. Procedia CIRP 2019, 34, 239–246. [Google Scholar] [CrossRef]
  9. Marimuthu, S.; Triantaphyllou, A.; Antar, M.; Wimpenny, D.; Morton, H.; Beard, M. Laser polishing of selective laser melted components. Int. J. Mach. Tools. Manuf. 2015, 95, 97–104. [Google Scholar] [CrossRef] [Green Version]
  10. Tsai, M.; Yang, W. Combined ultrasonic vibration and chemical mechanical polishing of copper substrates. Int. J. Mach. Tools Manuf. 2012, 53, 69–76. [Google Scholar] [CrossRef]
  11. Guo, J.; Au, K.; Sun, C.; Goh, M.; Kum, C.; Liu, K.; Wei, J.; Suzuki, H.; Kang, R. Novel rotating-vibrating magnetic abrasive polishing method for double-layered internal surface finishing. J. Mater. Process. Technol. 2019, 264, 422–437. [Google Scholar] [CrossRef]
  12. Pereira, O.; Rodríguez, A.; Fernández-Abia, A.; Barreiro, J.; López de Lacalle, L.N. Cryogenic and minimum quantity lubrication for an eco-efficiency turning of AISI 304. J. Clean. Prod. 2016, 139, 440–449. [Google Scholar] [CrossRef]
  13. Habibzadeh, S.; Li, L.; Shum-Tim, D.; Davis, E.C.; Omanovic, S. Electrochemical polishing as a 316L stainless steel surface treatment method: Towards the improvement of biocompatibility. Corros. Sci. 2014, 87, 89–100. [Google Scholar] [CrossRef]
  14. Yao, Y.; Zhou, R.; Zhang, C.; Mei, T.; Wu, M. Surface polishing technology for additive manufacturing complex metal components. Acta Aeronaut. Astronaut. Sin. 2020, 78, 1–14. [Google Scholar] [CrossRef]
  15. Fang, Z.; Lu, L.; Chen, L.; Guan, F. Laser Polishing of Additive Manufactured Superalloy. Procedia CIRP 2018, 71, 150–154. [Google Scholar] [CrossRef]
  16. Cwikła, M.; Dziedzic, R.; Reiner, J. Influence of Overlap on Surface Quality in the Laser Polishing of 3D Printed Inconel 718 under the Effect of Air and Argon. Materials 2021, 14, 1479. [Google Scholar] [CrossRef] [PubMed]
  17. Ma, C.; Guan, Y.; Zhou, W. Laser polishing of additive manufactured Ti alloys. Opt. Laser. Eng. 2017, 93, 171–177. [Google Scholar] [CrossRef]
  18. Chen, L.; Richter, B.; Zhang, X.; Bertsch, K.; Thoma, D.; Pfefferkorn, F. Effect of laser polishing on the microstructure and mechanical properties of stainless steel 316L fabricated by laser powder bed fusion. Mater. Sci. Eng. A 2021, 802, 140–154. [Google Scholar] [CrossRef]
  19. Liang, C.; Hu, Y.; Liu, N.; Zou, X.; Wang, H.; Zhang, X.; Fu, Y.; Hu, J. Laser Polishing of Ti6Al4V Fabricated by Selective Laser Melting. Metals 2020, 10, 191. [Google Scholar] [CrossRef] [Green Version]
  20. Zhou, J.; Han, X.; Li, H.; Liu, S.; Shen, S.; Zhou, X.; Zhang, D. In-Situ Laser Polishing Additive Manufactured AlSi10Mg: Effect of Laser Polishing Strategy on Surface Morphology, Roughness and Microhardness. Materials 2021, 14, 393. [Google Scholar] [CrossRef]
  21. Xu, J.; Zou, P.; Kang, D.; Wang, W. Theoretical and experimental study of bulge formation in laser polishing of 304 stainless steel. J. Manuf. Process. 2021, 66, 39–52. [Google Scholar] [CrossRef]
  22. Zhang, C.; Zhou, J.; Shen, H. Role of Capillary and Thermocapillary Forces in Laser Polishing of Metals. J. Manuf. Sci. Eng. Trans. ASME 2017, 139, 41–56. [Google Scholar] [CrossRef]
  23. Li, K.; Zhao, Z.; Zhou, H.; Zhou, H.; Yin, J.; Zhang, W.; Zhou, G. Numerical Simulation of Effect of Different Initial Morphologies on Melt Hydrodynamics in Laser Polishing of Ti6Al4V. Micromachines 2021, 12, 581. [Google Scholar] [CrossRef] [PubMed]
  24. Li, K.; Zhao, Z.; Zhou, H.; Zhou, H.; Jin, J. Numerical analyses of molten pool evolution in laser polishing Ti6Al4V. J. Manuf. Process. 2020, 58, 574–584. [Google Scholar] [CrossRef]
  25. Song, Y. Research on Laser Polishing Mechanism and Process of SLM Additive Manufacturing Surface; Shandong University: Jinan, China, 2021. [Google Scholar] [CrossRef]
  26. Przemysław, P. Reduction of Influence of the High-Frequency Noise on the Results of Surface Topography Measurements. Materials 2021, 14, 333. [Google Scholar] [CrossRef]
  27. Pavel, P.; Ondřej, H. White-light interferometry on rough surfaces—measurement uncertainty caused by noise. Appl. Opt. 2012, 51, 465–473. [Google Scholar]
  28. Lv, F.; Liang, H.; Xie, D.; Mao, Y.; Wang, C.; Shen, L.; Tian, Z. On the role of laser in situ re-melting into pore elimination of Ti–6Al–4V components fabricated by selective laser melting. J. Alloys Compd. 2021, 854, 156–168. [Google Scholar] [CrossRef]
  29. Khairallah, S.; Anderson, A.; Rubenchik, A.; King, W. Laser powder-bed fusion additive manufacturing: Physics of complex melt flow and formation mechanisms of pores, spatter, and denudation zones. Acta Mater. 2016, 108, 36–45. [Google Scholar] [CrossRef] [Green Version]
  30. Ye, W. Numerical Simulation of Temperature Field and Morphology Evolution of Molten Pool during Laser Selective Melting Process; Xi’an University of Technology: Xi’an, China, 2019. [Google Scholar]
  31. Lee, Y.; Zhang, W. Modeling of heat transfer, fluid flow and solidification microstructure of nickel-base superalloy fabricated by laser powder bed fusion. Addit. Manuf. 2016, 12, 178–188. [Google Scholar] [CrossRef] [Green Version]
  32. Hu, Y.; Zhu, K.; Xi, B. A 3-dimensional volume of fluid method-PLIC3D. Chin. Q. Mech. 2003, 18, 238–243. [Google Scholar] [CrossRef]
  33. Dai, D.; Gu, D. Influence of thermodynamics within molten pool on migration and distribution state of reinforcement during selective laser melting of AlN/AlSi10Mg composites. Int. J. Mach. Tools Manuf. 2016, 100, 14–24. [Google Scholar] [CrossRef]
  34. Xiang, Y.; Zhang, S.; Li, J.; Wei, Z.; Yang, L.; Jiang, L. Numerical simulation and experimental verification for selective laser single track melting forming of Ti6Al4V. J. Zhejiang Univ. (Eng. Sci.) 2019, 53, 2102–2109. [Google Scholar] [CrossRef]
  35. Gürtler, F.; Karg, M.; Leitz, K.H.; Schmidt, M. Simulation of Laser Beam Melting of Steel Powders using the Three-Dimensional Volume of Fluid Method. Phys. Procedia 2013, 41, 881–886. [Google Scholar] [CrossRef] [Green Version]
  36. Yuan, W.; Chen, H.; Cheng, T.; Wei, Q. Effects of laser scanning speeds on different states of the molten pool during selective laser melting: Simulation and experiment. Mater. Des. 2020, 189, 108–129. [Google Scholar] [CrossRef]
  37. Shrestha, S.; Chou, K. A study of transient and steady-state regions from single-track deposition in laser powder bed fusion. J. Manuf. Process. 2021, 61, 226–235. [Google Scholar] [CrossRef]
  38. Xu, J.; Zou, P.; Wang, W.; Kang, D. Study on the mechanism of surface topography evolution in melting and transition regimes of laser polishing. Opt. Laser. Technol. 2021, 139, 106–118. [Google Scholar] [CrossRef]
  39. Roberts, I.; Wang, C.J.; Esterlein, R.; Stanford, M.; Mynors, D. A three-dimensional finite element analysis of the temperature field during laser melting of metal powders in additive layer manufacturing. Int. J. Mach. Tools Manuf. 2009, 49, 916–923. [Google Scholar] [CrossRef]
  40. Bayat, M.; Thanki, A.; Mohanty, S.; Yang, A.S.; Tiedje, J.N.; Hattel, J. Keyhole-induced porosities in Laser-based Powder Bed Fusion (L-PBF) of Ti6Al4V: High-fidelity modelling and experimental validation. Addit. Manuf. 2019, 30, 100–112. [Google Scholar] [CrossRef]
  41. Leung, C.; Marussi, S.; Towrie, M.; Atwood, R.; Withers, P.; Lee, P. The effect of powder oxidation on defect formation in laser additive manufacturing. Acta Mater. 2019, 166, 294–305. [Google Scholar] [CrossRef] [Green Version]
  42. Basha, S.; Bhuyan, M.; Basha, M.; Venkaiah, N.; Sankar, M. Laser polishing of 3D printed metallic components: A review on surface integrity. Mater. Today Proc. 2020, 26, 2047–2054. [Google Scholar] [CrossRef]
Figure 1. Macroscopic morphology of sample. (a) As-SLMed; (b) ILPed. The parameters of SLM were 185 W, 0.6 m/s and 0.05 mm and 0.01mm (power, speed, spot diameter and hatch spacing). The parameters of ILP were 180 W, 0.6 m/s and 0.05 mm and 0.01mm (power, speed, spot diameter and hatch spacing).
Metals 12 00778 g001
Figure 2. Surface roughness data. (a) Sa; (b) Sz; (c) Ssk; (d) Sku. The parameters of SLM were 185 W, 0.6 m/s and 0.05 mm and 0.01mm (power, speed, spot diameter and hatch spacing). The parameters of ILP were 180 W, 0.6 m/s and 0.05 mm and 0.01mm (power, speed, spot diameter and hatch spacing).
Metals 12 00778 g002
Figure 3. Three−dimensional surface morphology measured by white light interferometer. (a) As−SLMed; (b) ILPed. The parameters of SLM were 185 W, 0.6 m/s and 0.05 mm and 0.01mm (power, speed, spot diameter and hatch spacing). The parameters of ILP were 180 W, 0.6 m/s and 0.05 mm and 0.01mm (power, speed, spot diameter and hatch spacing).
Metals 12 00778 g003
Figure 4. Computational domain.
Metals 12 00778 g004
Figure 5. Temperature-dependent thermophysical properties of IN718. (a) Density; (b) Conductivity; (c) Specific Heat; (d) Viscosity. Reprinted with permission from [31]. Copyright 2016 Elsevier.
Metals 12 00778 g005
Figure 6. Simulation and experimental surface comparison. (a) experiment; (b) simulation. Obtained at 185 W, 0.6 m/s and spot diameter were 0.05 mm (power, speed and spot diameter).
Metals 12 00778 g006
Figure 7. Track morphology comparison. (a) The simulated track morphology, obtained at 195 W, 0.4 m/s and 0.05 mm; (b) Experimental track morphology, obtained at 195 W, 0.4 m/s and 0.05 mm (power, speed and spot diameter). Reprinted with permission from [37]. Copyright 2021 The Society of Manufacturing Engineers.
Metals 12 00778 g007
Figure 8. The temperature change of ILP with different ILP power. (a) 50 W; (b) 90 W; (c) 130 W; (d) 170 W.
Metals 12 00778 g008
Figure 9. The temperature contours of ILP with different ILP power. (a) 50 W; (b) 90 W; (c) 130 W; (d) 170 W. The scanning speed was 0.8 m/s, and the spot diameter was 0.05 mm. The entire domain is 0.6 mm long and 0.13 mm high.
Metals 12 00778 g009
Figure 10. The temperature gradient in the X direction of the molten pool during the ILP process with four processing parameters.
Metals 12 00778 g010
Figure 11. Surface topography evolution. (a) Powder bed; (b) surface profile after SLM; (cj) are the ILP process. The parameters of SLM were 150 W, 0.8 m/s and 0.05 mm (power, speed and spot diameter). The parameters of ILP were 130 W, 0.8 m/s and 0.05 mm (power, speed and spot diameter). The entire domain is 1 mm long and 0.15 mm high.
Metals 12 00778 g011
Figure 12. Surface morphology. (a) As received; (b) 50 W; (c) 90 W; (d) 130 W; (e) 170 W. The parameters of SLM were 150 W, 0.8 m/s and 0.05 mm. The other parameters of ILP were 0.8 m/s and 0.05 mm. The length of the plane domain is 1 mm, and the height is 0.15 mm. The size of the 3D domain is 1 mm × 0.12 mm × 0.2 mm.
Metals 12 00778 g012
Figure 13. The flow velocity of the molten pool of the monitoring point fluctuates with time under different ILP power.
Metals 12 00778 g013
Figure 14. The cause diagram of the left end depression of the track when the ILP power is 130 W. (a) t = 1.30 ms; (b) t = 1.40 ms; (c) t = 1.60 ms. The parameters of SLM were 150 W, 0.8 m/s and 0.05 mm. The parameters of ILP were 130 W, 0.8 m/s and 0.05 mm. The entire domain is 0.54 mm long and 0.15 mm high.
Metals 12 00778 g014
Figure 15. The formation of bulge in LP process. (a) t = 1.70 ms; (b) t = 1.85 ms; (c) t = 1.90 ms; (d) t = 1.95 ms; (e) t = 2.00 ms; (f) 2.15 ms. The parameters of SLM were 150 W, 0.8 m/s and 0.05 mm. The parameters of ILP were 130 W, 0.8 m/s and 0.05 mm. The entire domain is 0.11 mm long and 0.06 mm high.
Metals 12 00778 g015
Figure 16. Multi-track simulation surface profile. (a) Powder bed; (b) As-SLMed; (c) ILPed. The parameters of SLM were 150 W, 0.8 m/s and 0.05 mm. The parameters of ILP were 90 W, 0.8 m/s and 0.05 mm. The hatch spacing was 0.01 mm. The length of the plane domain is 1 mm, and the height is 0.15 mm. The size of the 3D domain is 1 mm × 0.2 mm × 0.2 mm.
Metals 12 00778 g016
Table 1. Average value of surface roughness.
LabelAs-SLMedILPChange Percentage
Sa (μm)20.0 ± 1.2513.3 ± 0.3533.5%
Sz (μm)315.9 ± 22.75302.2 ± 33.354.3%
Ssk−1.6 ± 0.3−0.6 ± 0.362.5%
Sku8.4 ± 0.757.3 ± 0.9013.1%
Table 2. Process parameters used in the modelling computation of SLM followed by ILP with different power.
SamplePower (W)Scanning Speed (m/s)
SLM
ILP
ILP
ILP
ILP
150
50
90
130
170
0.8
0.8
0.8
0.8
0.8
Table 3. IN718 material properties. Data from [30].
PropertyValueUnitsPropertyValueUnits
Reflection coefficient0.7KMarangoni coefficient 1.1 × 10 4 N · m 1 · K 1
Solidus temperature1523KLatent heat of fusion270 kJ · kg 1
Liquidus temperature1608KLatent heat of vaporisation6300 kJ · kg 1
Boiling temperature3188KSurface tension coefficient1.89 N · m 1
Publisher’s Note: MDPI stays neutral with regard to jurisdictional claims in published maps and institutional affiliations.

