Article

Microstructures, Mechanical Behavior, and Radiation Damage of (TiVCr)x-(TaW)1-x Binary System High-Entropy Alloy Films

1
Institute of Materials Science, Shanghai Dian Ji University, Shanghai 201306, China
2
State Key Laboratory for Advanced Metals and Materials, University of Science and Technology Beijing, Beijing 100083, China
3
Department of Materials Science and Engineering, The University of Tennessee, Knoxville, TN 37996, USA
*
Author to whom correspondence should be addressed.
Metals 2022, 12(5), 772; https://doi.org/10.3390/met12050772
Submission received: 28 March 2022 / Revised: 19 April 2022 / Accepted: 26 April 2022 / Published: 29 April 2022
(This article belongs to the Special Issue Amorphous and High-Entropy Alloy Coatings)

Abstract

:
An experimental method for preparing high-entropy thin films with gradient changes of alloying elements by magnetron sputtering co-deposition is proposed in this work to evaluate the effect of alloying element composition changes on the properties of non-equal molar ratio high-entropy alloys. The (TiVCr)x-(TaW)1-x binary system thin films were deposited by a magnetron sputtering system with two intermediate alloy targets. The surface morphology, element composition, roughness, and phase structure of the coatings were studied with scanning electron microscope (SEM), energy dispersive X-ray (EDX), X-ray diffractometer (XRD), atomic force microscope (AFM), and transmission electron microscope (TEM). The results show that at x = 0.51, the films had the best mechanical properties under the action of multiple strengthening mechanisms, and the hardness and modulus reached 27.61 GPa and 274.42 GPa, respectively. Due to higher hardness and special surface morphology, the films showed a lower average friction coefficient and had excellent wear resistance with wear rates of 0.34 and 5.01 × 10⁻⁹ mm3/(N·mm), respectively. On the other hand, it was found that forming a BCC polycrystalline structure and an amorphous-mixed structure can improve the radiation resistance of the material.

1. Introduction

With the development of the nuclear-power industry, the next-generation nuclear reactors have put forward stricter requirements for structural materials in the reactor. The material needs to maintain phase stability and structural stability in harsh conditions such as high temperatures, high pressures, and strong particle irradiation, without radiation hardening, radiation embrittlement, precipitation, or volume swelling [1,2,3]. Therefore, the development of radiation-resistant materials is important for the development of next-generation nuclear energy technologies. The study of high-entropy alloys (HEAs) is an important research direction of radiation-resistant materials. Since the concept of HEAs was first proposed in 2004, they haves gradually come to occupy an important position in materials science research after more than ten years of development. Their unique high-entropy effect, cocktail effect, lattice-distortion effect, and diffusion barrier effect afford them excellent performance in contrast to traditional materials in some specific environments [4,5,6,7]. HEAs have broad application prospects in hard films, light-to-heat conversion films, diffusion barriers, and internal components of nuclear reactors.
In the traditional definition, a high-entropy alloy specifically refers to a single-phase solid-solution alloy composed of five or more alloy elements in near-equiatomic proportions, such as AlCoCrFeNi [8], CoCrFeMnNi [9], and WTaMoNb [10]. However, HEAs do not necessarily achieve the best performance in near-equiatomic proportions. Therefore, with in-depth understanding, the definition of HEAs has been broadened beyond the constraint of equimolar ratios and single solid solutions, by combining the non-equimolar formation of multiple-phase solid solutions and dispersed phases to achieve a richer combination of excellent properties, such as AlxCo1.5CrFeNi1.5Tiy [11] and (FeNiCoCu)86Ti7Al7 [12]. With a recently studied class of non-equivalent molar ratio HEAs of WxTaTiVCr [13], when the X value is 71 to 90%, the alloy was composed of solid-solution phases, a Ti-rich phase, a W-rich phase, and a C15 Laves phase, which yielded various types of solid-solution-strengthening effects. The hardness and yield strength were greatly improved in this system, reaching 768 HV and 2265 MPa, respectively. Since there are many types of alloying elements, it is cumbersome to use the traditional trial and error method to screen alloying elements for alloy development. In addition, multiple experiments are carried out at the same time, and other variables are easily introduced, which is inconsistent with the principle of experimental control variables.
High-throughput manufacturing, also known as combinatorial manufacturing, prepares a combination of samples with different parameters in one experiment to screen a variety of compositions to find samples with specific performance parameters, which provides a new solution for the development of HEAs. In a combined sputtering, different aspects of the material’s properties, such as the phase structure, surface morphology, hardness, corrosion resistance, and vitrification ability, can be studied at the same time, greatly reducing the workload [14,15,16,17,18,19]. A high-throughput research method commonly used at the present stage is to select multiple targets for co-deposition on a substrate at the same time. For example, in the Ti-Al-(Cr, Fe, Ni) [20] system, Ti targets, Al targets, and CrFeNi alloy targets are selected for magnetron-sputtering deposition, and 144 independent samples can be prepared at one time. In this experiment, a channel was reserved on a Si substrate to distinguish different samples, and Ti targets, Al targets, and CrFeNi alloy targets were selected for magnetron-sputtering deposition, which can prepare 144 independent samples in one combined deposition.
However, this type of method also has some limitations. First, based on the principle of the thin-film growth by magnetron sputtering, two targets are selected for co-deposition, which makes it easy for the sputtered atoms to affect each other before deposition, intermetallic compounds or mesophases are more easily formed. The film grown by this method is inferior to that deposited by a single target in terms of adhesion, hardness, uniformity, etc. Second, in a combination deposition strategy, although multiple samples can be prepared at one time, due to the cocktail effect of HEAs, in most combination deposition strategies, the performance gap between adjacent groups of samples is not large. Moreover, magnetron sputtering has an extremely high cooling rate during alloying, which makes the film more inclined to form an amorphous structure [21].
As a research method, although high-throughput manufacturing significantly reduces the workload and eliminates the interference of other variables, HEAs films do not fully reflect the true performance of HEAs. First, when preparing an HEAs block, it is easy to segregate and form an enriched phase, and when preparing a thin film, alloying is more efficient in forming a two-dimensional structure, having a higher strength and modulus than the bulk material. Second, compared with the traditional thin-film preparation method, the composition and thickness of the thin film prepared by combined sputtering are uneven and uncontrollable, which adds difficulties to further analysis. Therefore, it is necessary to select specific parameters for further experiments.
In this group of experiments, a number of low-activation metal elements were selected, namely, Ti, V, Cr, Ta, and W, and powder metallurgy was used to prepare TaW and TiCrV intermediate alloy targets, by the ball-milling and mechanical alloying (MA) method. By adjusting the current ratio of the two targets, the gradient of the elemental composition in the (TiCrV)-(TaW) binary system was realized. The properties of the material phase structure, surface morphology, and radiation damage were studied. In combination with the idea of high-throughput manufacturing, a multi-gradient material test scheme was designed to find a balance between the quality of the thin film and the experimental efficiency.

2. Materials and Methods

In the experiment, closed-field non-equilibrium magnetron-sputtering ion-plating equipment from the German Teer company (Teer, Worcestershire, UK) was used to prepare HEA thin films, and TaW and TiVCr alloy targets were selected. The alloy elements of each alloy target were equimolar. The choice of alloying elements was based on two considerations. First, metal elements of the lowest possible activation level must be selected to meet the requirements of the nuclear reactor service [22,23,24]; Second, under normal circumstances, face-centered-cubic (FCC) structural materials are more prone to radiation swelling than BCC materials [25,26,27]. Therefore, the alloy elements selected should avoid the FCC-phase structure as much as possible. High-purity metal powders with a purity of 99.95 atomic percent (at.%) were selected to make up each target, and were prepared by ball milling and mechanical alloying (MA), The content of each metal element in a target was less than 2 at.%, and the target size was 345 mm × 145 mm × 10 mm. In the selection of target metal elements, metal elements with similar atomic sizes, similar physical properties, and similar sputtering rates were placed in the same target in order to achieve regulation of the film-forming elemental content through the current adjustment. Thus, Ta and W powders were selected to prepare one target, while Ti, V, and Cr powders were chosen to prepare the other target.
The film was grown on an N-type (111) Si substrate. Before deposition, the Si substrate was first ultrasonically cleaned with the ethanol and acetone for 10 min, and cleaned with an ion cleaner for 15 min to sufficiently remove the oxide layer and impurities on the surface of the Si substrate after drying. In the chamber, two alloy targets were placed opposite each other to avoid mutual influence. The parameters were determined through preliminary experiments, and the total current of the two targets was determined to be 3A, while the bias voltage was −50V. Before deposition, the cavity was evacuated to 1.5 × 10⁻³ Pa, and then argon gas was deposited at a flow rate of 20 standard cubic centimeters per minute (sccm) to perform deposition with a working pressure of 8.0 × 10⁻² Pa in DC power. There was no additional prefabricated interface layer before deposition, no additional heating was performed during deposition, and the distance between the Si substrate and the target was 15 cm during the deposition process. The ratio was adjusted to realize the gradient change of the elemental composition, and 13 groups were divided according to the component gradient. To avoid more than variable effects, all samples were continuously prepared with current changes and had the same starting pressure, working pressure, and cooling time. Three repeated experiments were performed to exclude randomness.
The Bruker D8 Advance X-ray diffractometer (XRD, Bruker, Billerica, MA, USA) was used to analyze the phase structure of the film (CuKα, 40 kV, 40 mA). The scanning step was set to 0.01°, the scanning speed was 4° per minute, and the scanning range was set as 20–80°. A Hitachi S3400N scanning electron microscope (SEM, Hitachi, Tokyo, Japan) was used for the surface-morphology observation, and an EDAX Apollo XP energy dispersive X-ray (EDX) analysis attached to the device was used for the elemental content determination. The surface morphology of the film was observed with a Bruker MultiMode 8 SPM atomic force microscope (AFM, Bruker, Billerica, MA, USA). In the nanoindentation experiment, the NANO Indenter G200 nanoindentation device (KLA-Tencor, Milpitas, CA, USA) was used for measurement. The Berkovich indenter was used in the experiment, was set to an indentation depth of 100 nm, which was less than 1/10 of the film thickness, in order to eliminate the interference of the substrate material on the experimental results. The CETR UMT-3 multifunctional micromechanical testing machine (CETR, Campbell, CA, USA) was employed to analyze the abrasion experiments of materials. The reciprocating wear test was performed using a chrome steel ball with a diameter of 2 mm (surface roughness not greater than 0.05 μm, hardness 63 HRC). In the wear test, the wear distance was 5 mm, the rate was 1 mm·s−1, the load was 500 mN, and the wear time was 3600 s. The ZEISS Smart proof 5 turntable Confocal Laser Scanning Microscope (CLSM, ZEISS, Jena, Germany) was used to observe the wear scars and measure the wear volume. In order to study the radiation damage performance of the material, a 70 KeV He+ irradiation experiment was performed on a 100 KeV electromagnetic isotope separator of the Shanghai Institute of Applied Physics, and the implantation dose was set to 1.0 × 10¹⁶ ions/cm2. The radiation damage was calculated using the structural reaction injection molding (SRIM) software [28]. At this dose, the damage peak appeared at 400~500 nm. A Tecnai G28-Twin transmission electron microscope (TEM, FEI, Hillsboro, OR, USA) was used to analyze the internal crystal structure and radiation damage of the film.

3. Results

3.1. Elemental Composition Distribution

Table 1 shows the content of each element of the coating under different deposition processes. The sputtering rate of the thin film was positively correlated with the deposition current. Hence, the elemental composition of the thin film could be controlled by adjusting the current ratio between the TaW and TiVCr alloy targets. Applying a bias during the deposition process can enhance the strength of the coating and make it denser [29]. At the same time, the bias voltage was liable to cause reverse sputtering of light elements, affect the quality of the films potentially reducing the content of the light elements, Ti, V, and Cr, in the coating. After comprehensive consideration, a bias value of −50 V was chosen for the deposition. Based on the results of the coating alloy element content, a certain process parameter gradient was designed to linearly change the proportion of each element to between 5% and 35%. In the EDX test, five points were selected for each group of samples for repeated experiments, and the average value was calculated as the final result. Eventually, as the current ratio changed, the metal contents of Ti, V, and Cr increased from 8.00 at.% to 26.70 at.%, 27.67 at.%, and 32.44 at.%, respectively.
Figure 1 shows the changes in the proportions of the five elements in the coating. The difference in the contents of Ta and W elements in each group was relatively small, being less than 1 at.%, while the difference among Ti, V, and Cr elements was much larger than Ta and W. The reason for this was that the deposition rates of the three Ti, V, and Cr elements had different responses to the deposition current. The deposition rate of Cr was larger than those of Ti and V with the current. Therefore, under the large current ratio, the Cr content was greater than those of Ti and V. Under the Sample M, the content difference reached 5.74 at.%. On the other hand, subject to the conditions of the powder metallurgy, the metal elements in each target cwere not able to achieve an equimolar ratio, and there was a certain difference in the content. With the change in the deposition current ratio, the coating elemental composition changed linearly, with the result that it was feasible to achieve the gradient change of the coating elemental composition by adjusting the current ratio.

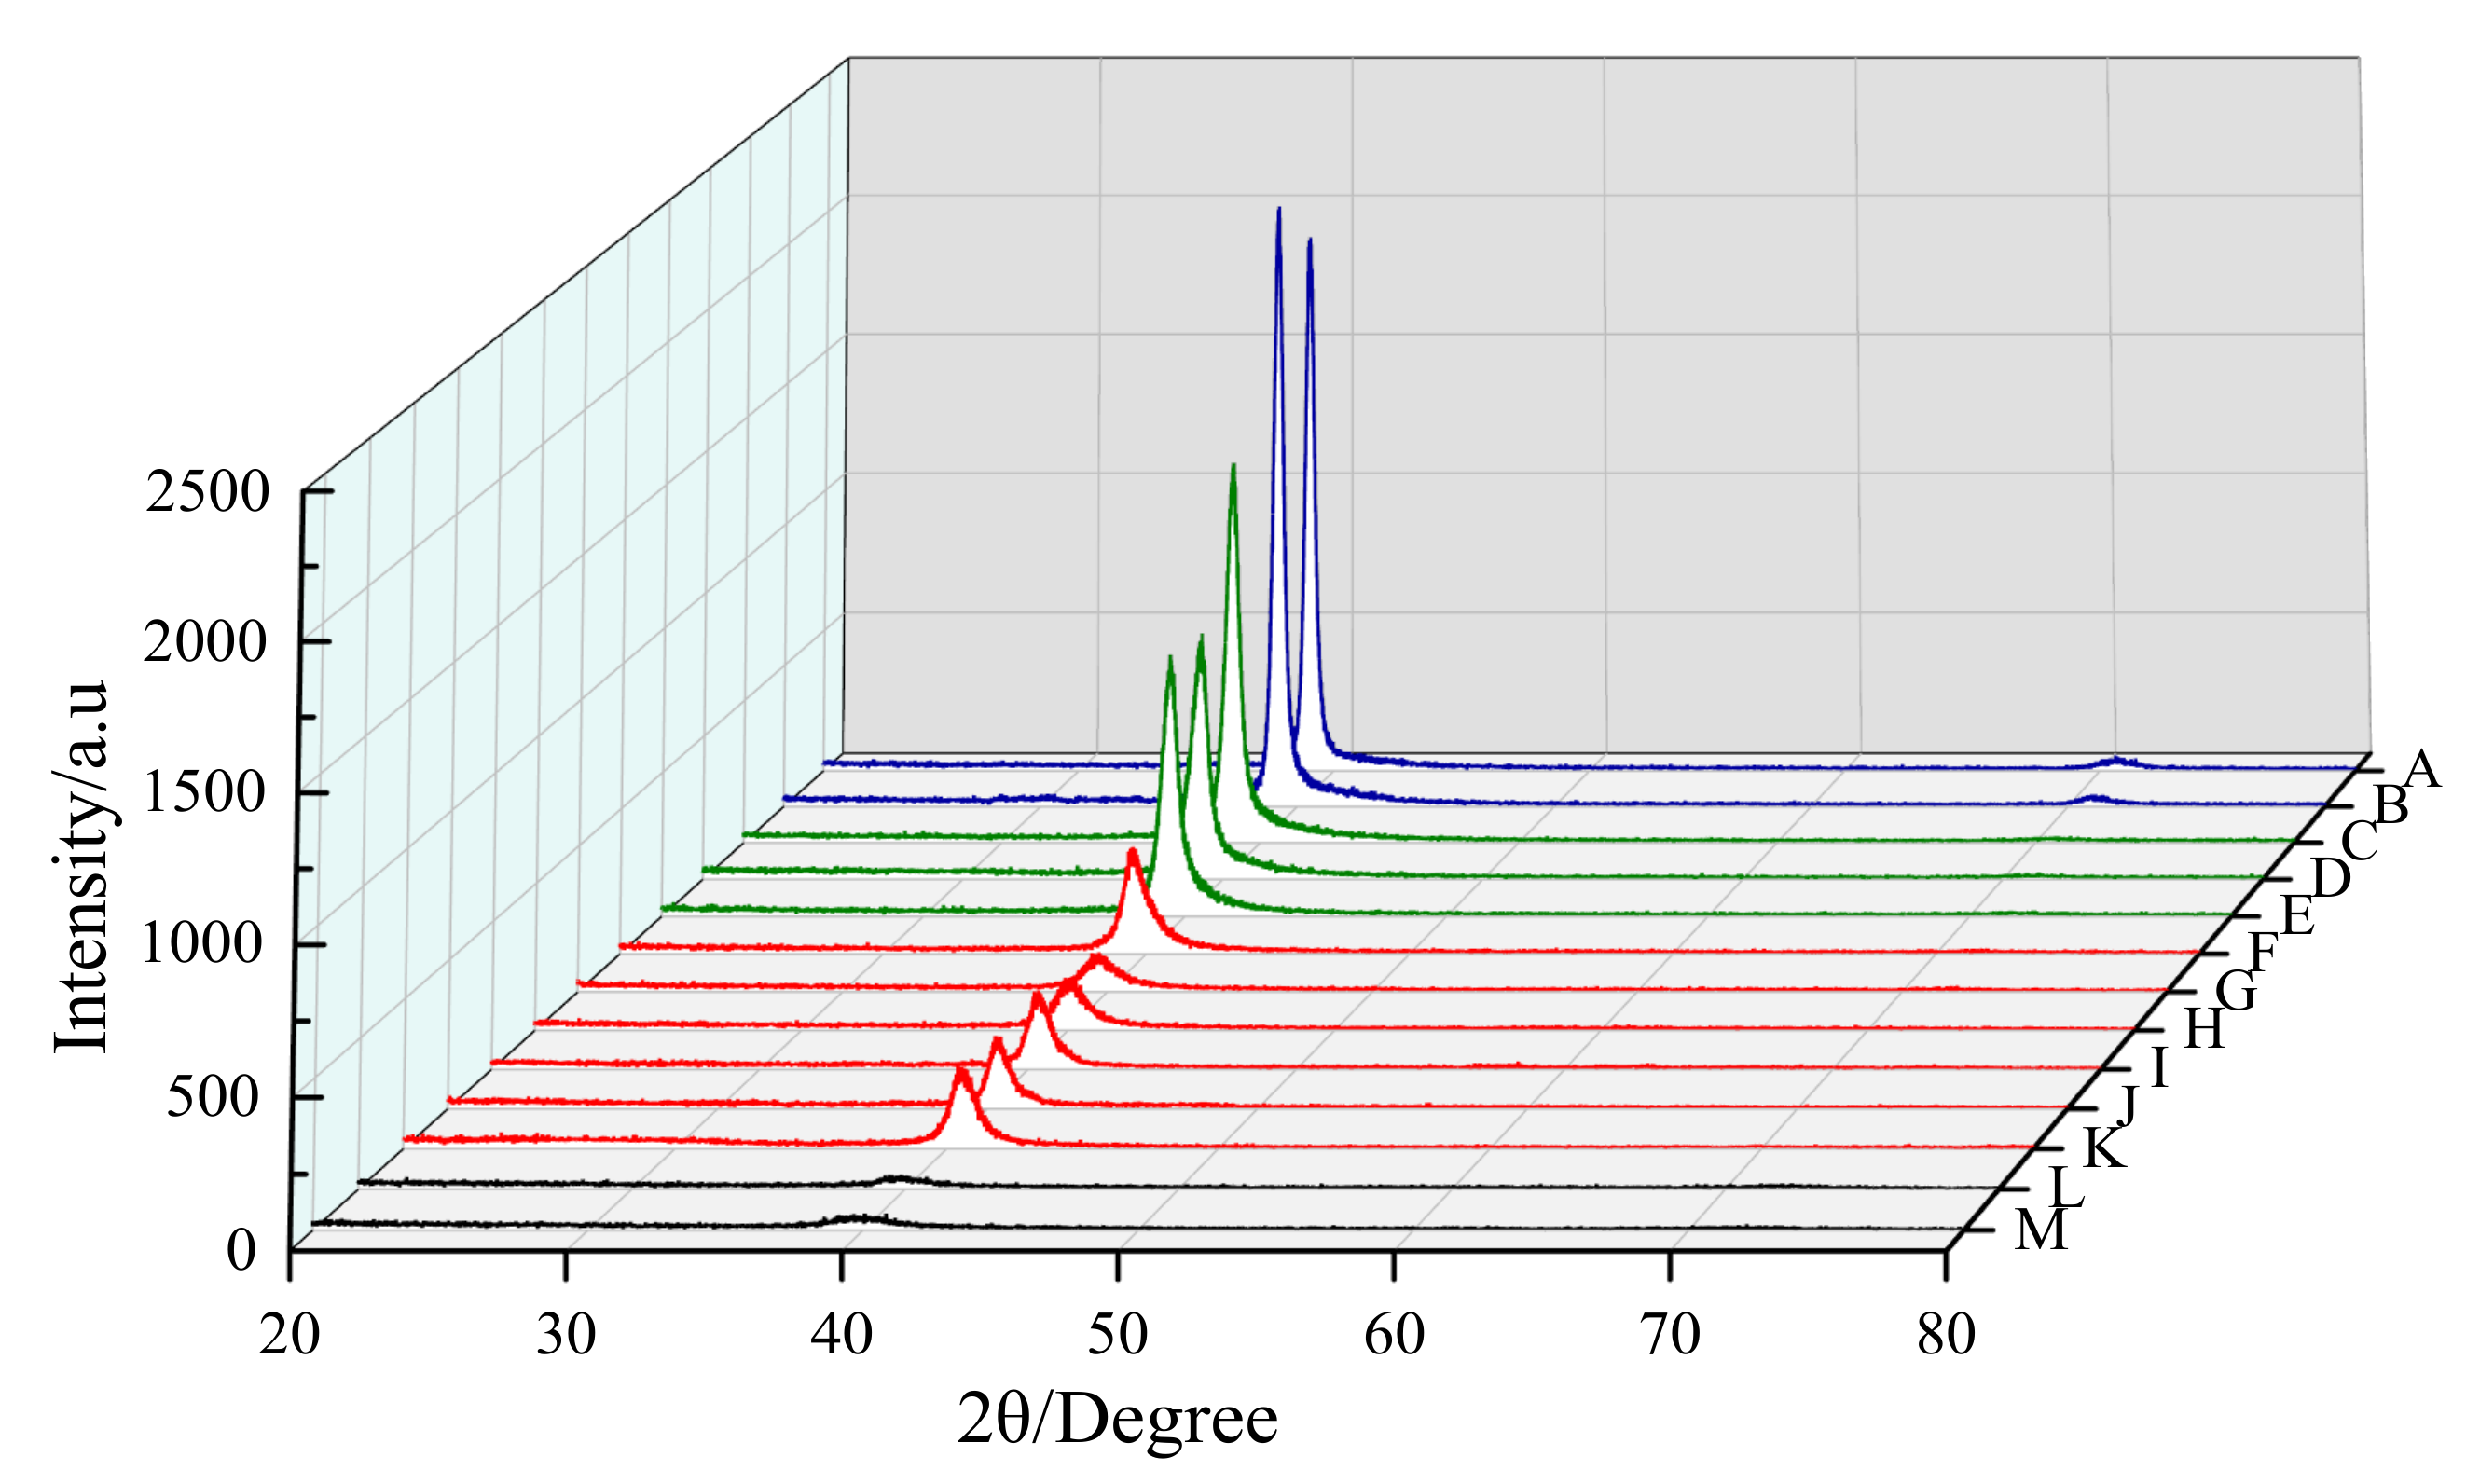
3.2. Structural Analysis

By adjusting the coating composition, the phase structure of the HEA was changed. Figure 2 shows the XRD patterns of all samples. With the change in the current ratio, the HEA coating showed a transition from the BCC to amorphous structures. At the same time, the positions of the crystalline peak and the amorphous peak gradually shifted to a larger angle. Combined with the crystalline peak-diffraction intensity values, it can be roughly divided into crystalline regions (labeled in blue), transition regions (labeled in green), semi-amorphous regions (labeled in red), and amorphous regions (labeled in black). The coating presented a BCC structure in the crystalline region, forming two diffraction peaks of the BCC structure at 38° and 71°. In the amorphous region, the coating exhibited an obvious amorphous structure between 38° and 42°.
In the crystalline region, the formation of the BCC crystal structure is mainly due to the absolute advantage of Ta and W contents, which formed a TaW solid solution during the coating-deposition process. The TaW solid solution formed (110), (200), and (211) diffraction peaks at 38°, 56°, and 71° in the range of 20–80°, respectively. In practice, due to the influence of the remaining dispersed metal elements, the diffraction peak at the 56° position was extremely weak and almost invisible, and the diffraction peak intensity at the 71° position was also weaker than 38°. The content of the remaining metal elements in this group of coatings was low. It is speculated that the dispersed light metal elements may had a certain orientation effect on the formation of the crystalline phase of the TaW solid solution, which made it more inclined to form the (110) crystalline BCC structure. In sample B, the content of light metal elements in the coating was grater than that in sample A, but the crystalline peak intensity had increased, which can be proved to a certain extent.
In the amorphous region, the coating exhibited an obvious amorphous structure between 38° and 42°. Ti, V, and Cr in this group occupied an absolute majority, and an amorphous solid solution was formed at near-equiatomic compositions. In the transition region, the coating still exhibited a BCC structure, but the sub-diffraction peak at the 71° position disappeareds, and the intensity of the main peak also decreasds.
In the semi-amorphous region, due to the dominance of light-metal elements, the peak intensity has dropped sharply and remained at a certain level, producing HEAs from an amorphous structure. However, Ta and W still occupied a certain proportion, and it remained possible to form intermetallic compounds. It is speculated that in this region, a mixed BCC polycrystalline structure wrapped with an amorphous phase was formed. It is worth mentioning that the intensities of diffraction peaks of Samples G and H in the semi-amorphous region were slightly lower than those of the other samples, and the amorphous characteristics were more obvious. The reason for this was that in the two groups of samples, the difference in the contents of the three light-metal elements, especially V and Cr, was the smallest and close to equal, and a lower alloy-mixing entropy between V and Cr helped form an amorphous structure.
The phase structure of HEAs was affected by two aspects. First, the metal elements that can form an amorphous alloy must occupy a major position in the elemental composition. Second, the metal elements with the ability to form amorphous structures should also be configured according to certain rules. In equal-atomic HEA systems, changes in elemental compositions creat variations in the alloy-mixing entropy, (ΔSmix), mixing enthalpy, (ΔHmix), theoretical alloy melting point, (Tm), atomic-size difference, (δ), and their related entropy-enthalpy ratio, (Ω). These parameters can help understand and analyze the formation and change law of the HEA phase structure of the system, and these parameters are discussed in the next section [30].

3.3. Phase-Formation Rule

In this experiment, a (TiVCr)x-(TaW)1-x binary system film was designed, and a change in the x values from 0.26 to 0.87 was achieved by adjusting the change in the current ratio. With the increases in the Ti, V, and Cr elemental contents, the phase structure of the thin film gradually changed from BCC to amorphous structures. When x < 0.36, the thin film mainly formed a BCC structure; when x > 0.79, the thin film is mainly an amorphous structure; when 0.36 < x < 0.79, the thin film has both a BCC and amorphous structure.
By calculating the entropy enthalpy ratio, Ω and the atomic-radius difference, δ, the phase-formation law of HEAs can be analyzed. They are calculated as follows:
Ω = T m S mix H mix
δ = i = n n 1 d i / j = n n x j d j 2
T m = i = 1 N x i T m i
S mix = R i = 1 n x i   lnx i
H mix = i = n , i j n H AB mix   x i x j
where Tm is the theoretical melting point of the alloy calculated under the ideal mixing rule, where (Tm)i is the melting point of the i component in the alloy, ΔSmix is the mixing entropy of the alloy, ΔHmix is the mixing enthalpy of the alloy, Xi in the above formula is the mole fraction of the ith component in the alloy, and di is the atomic radius of the ith component in the alloy. Through the above five formulas, the corresponding thermodynamic parameters can be calculated, and the calculation results are shown in Table 2. According to calculations, the range of Ω is from 5.53 to 7.29, and the range of δ is from 4.16 to 6.55, togather meeting the conditions for forming a solid solution [31].

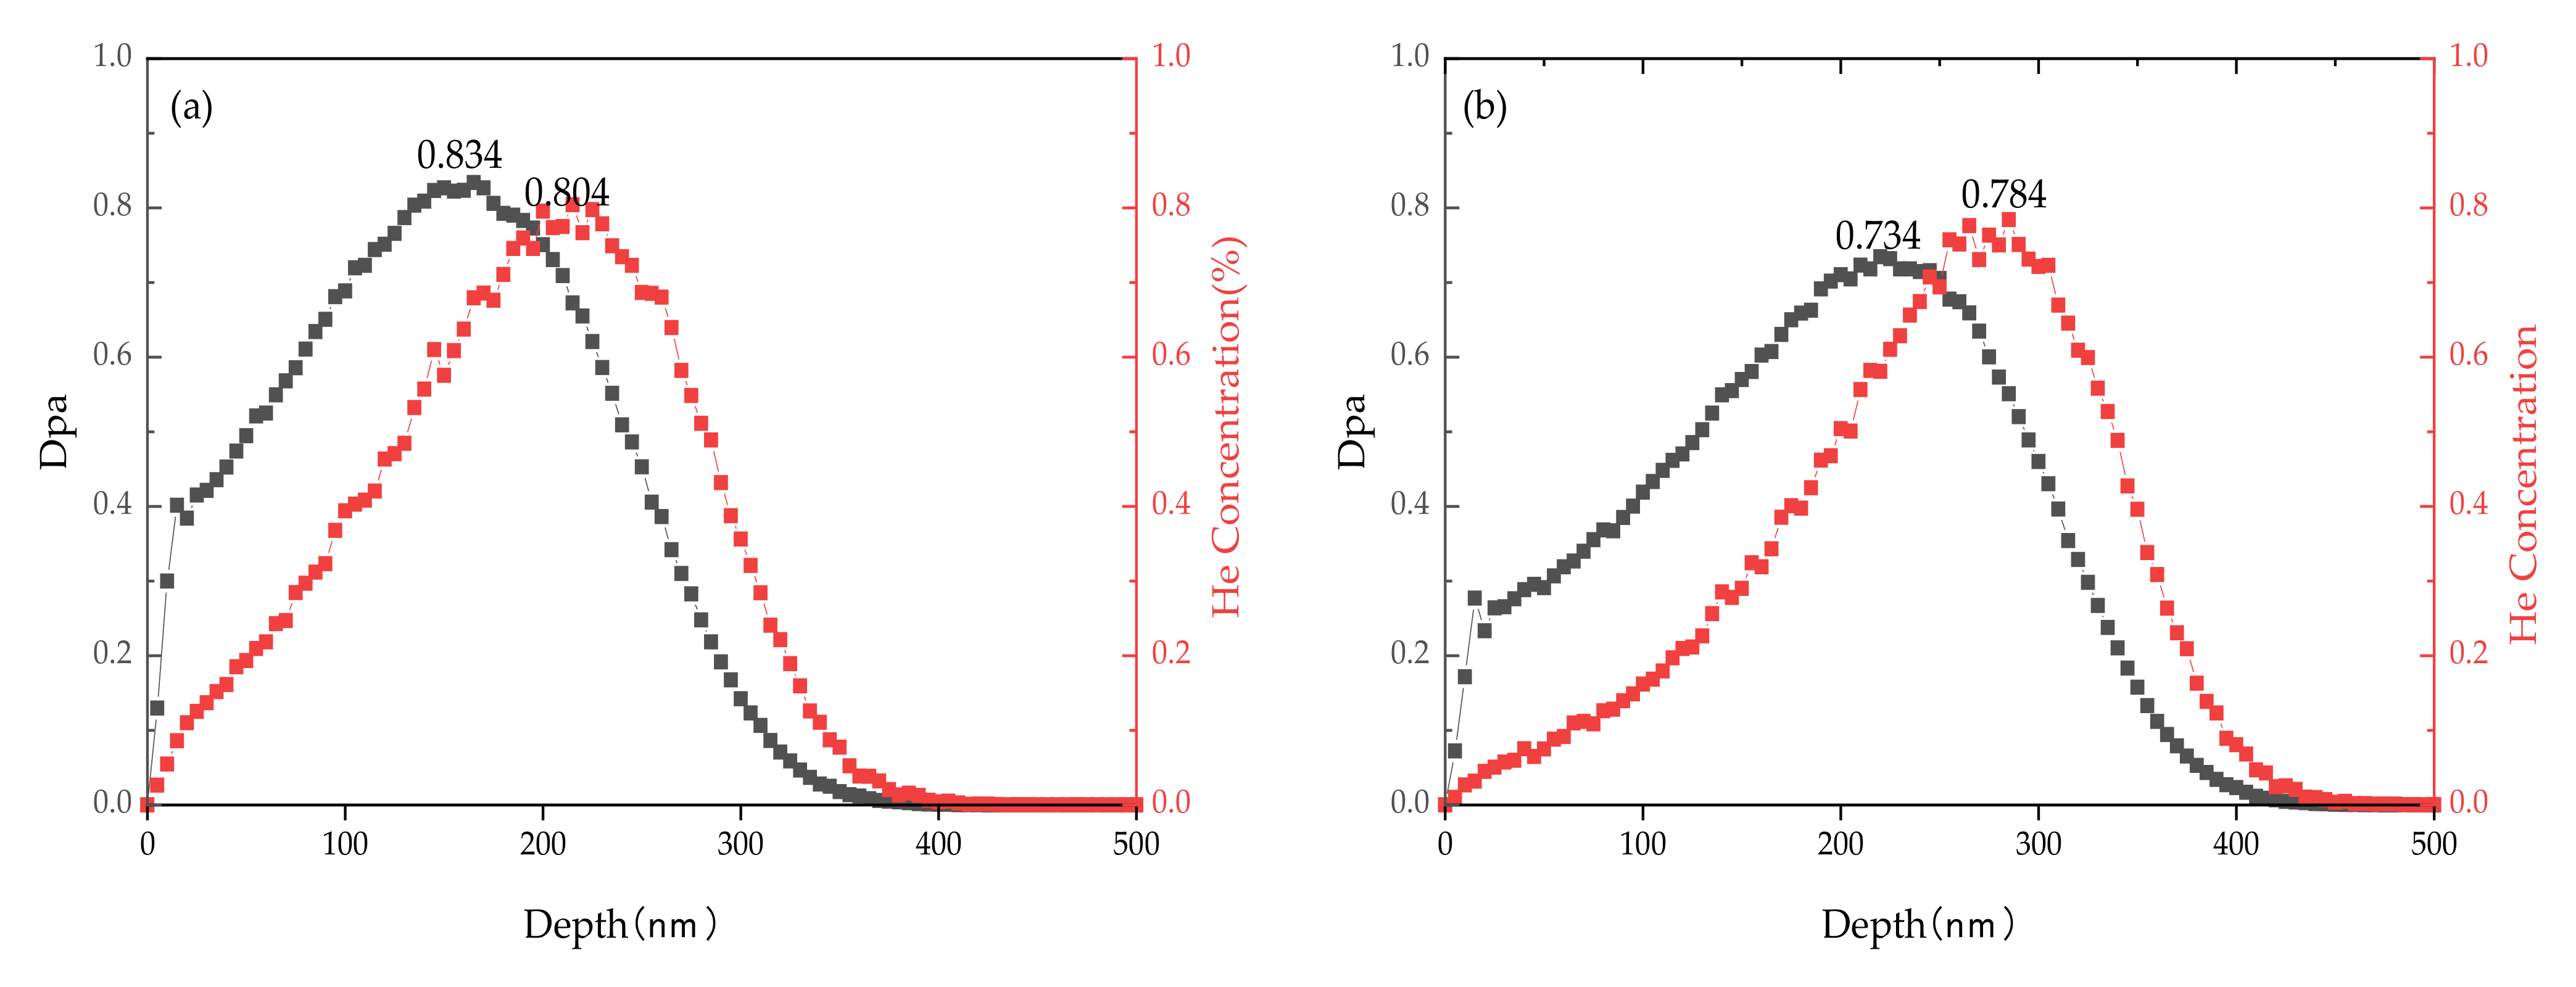
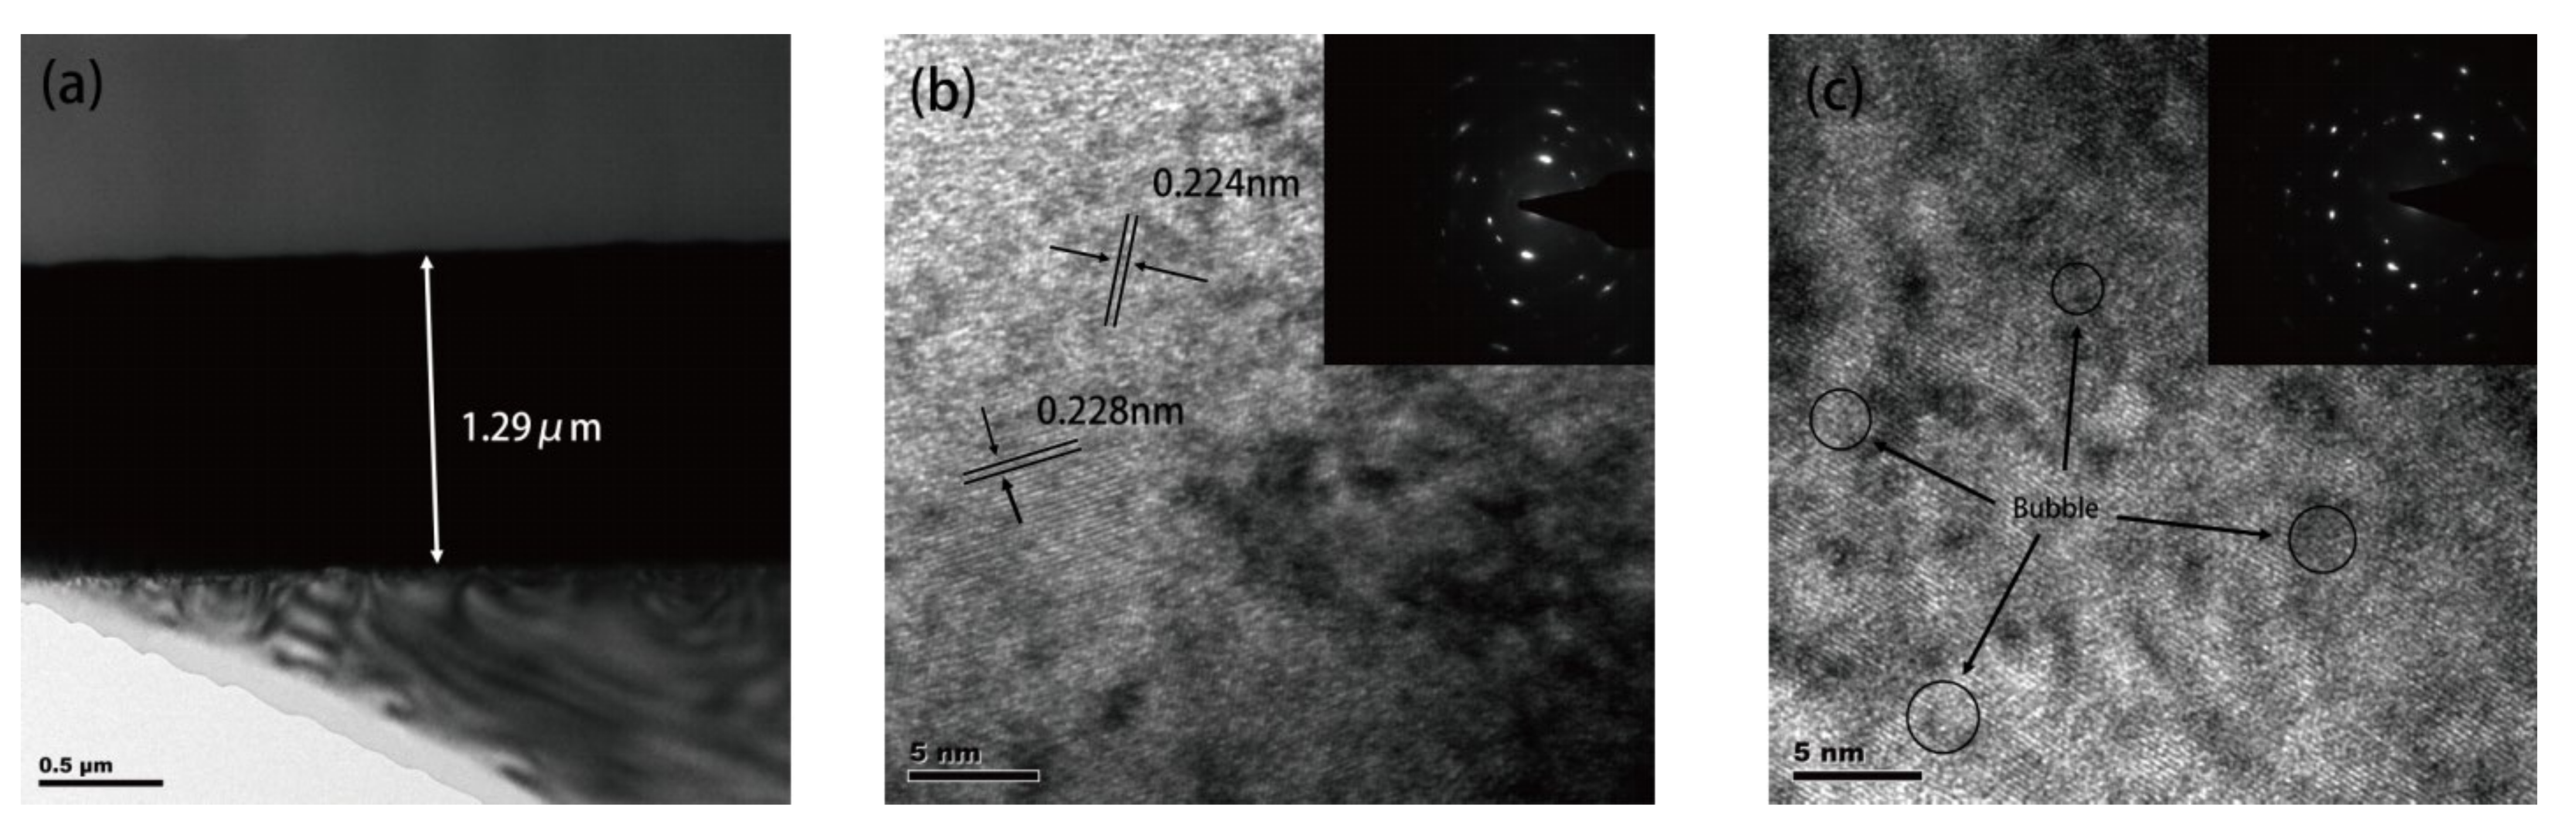
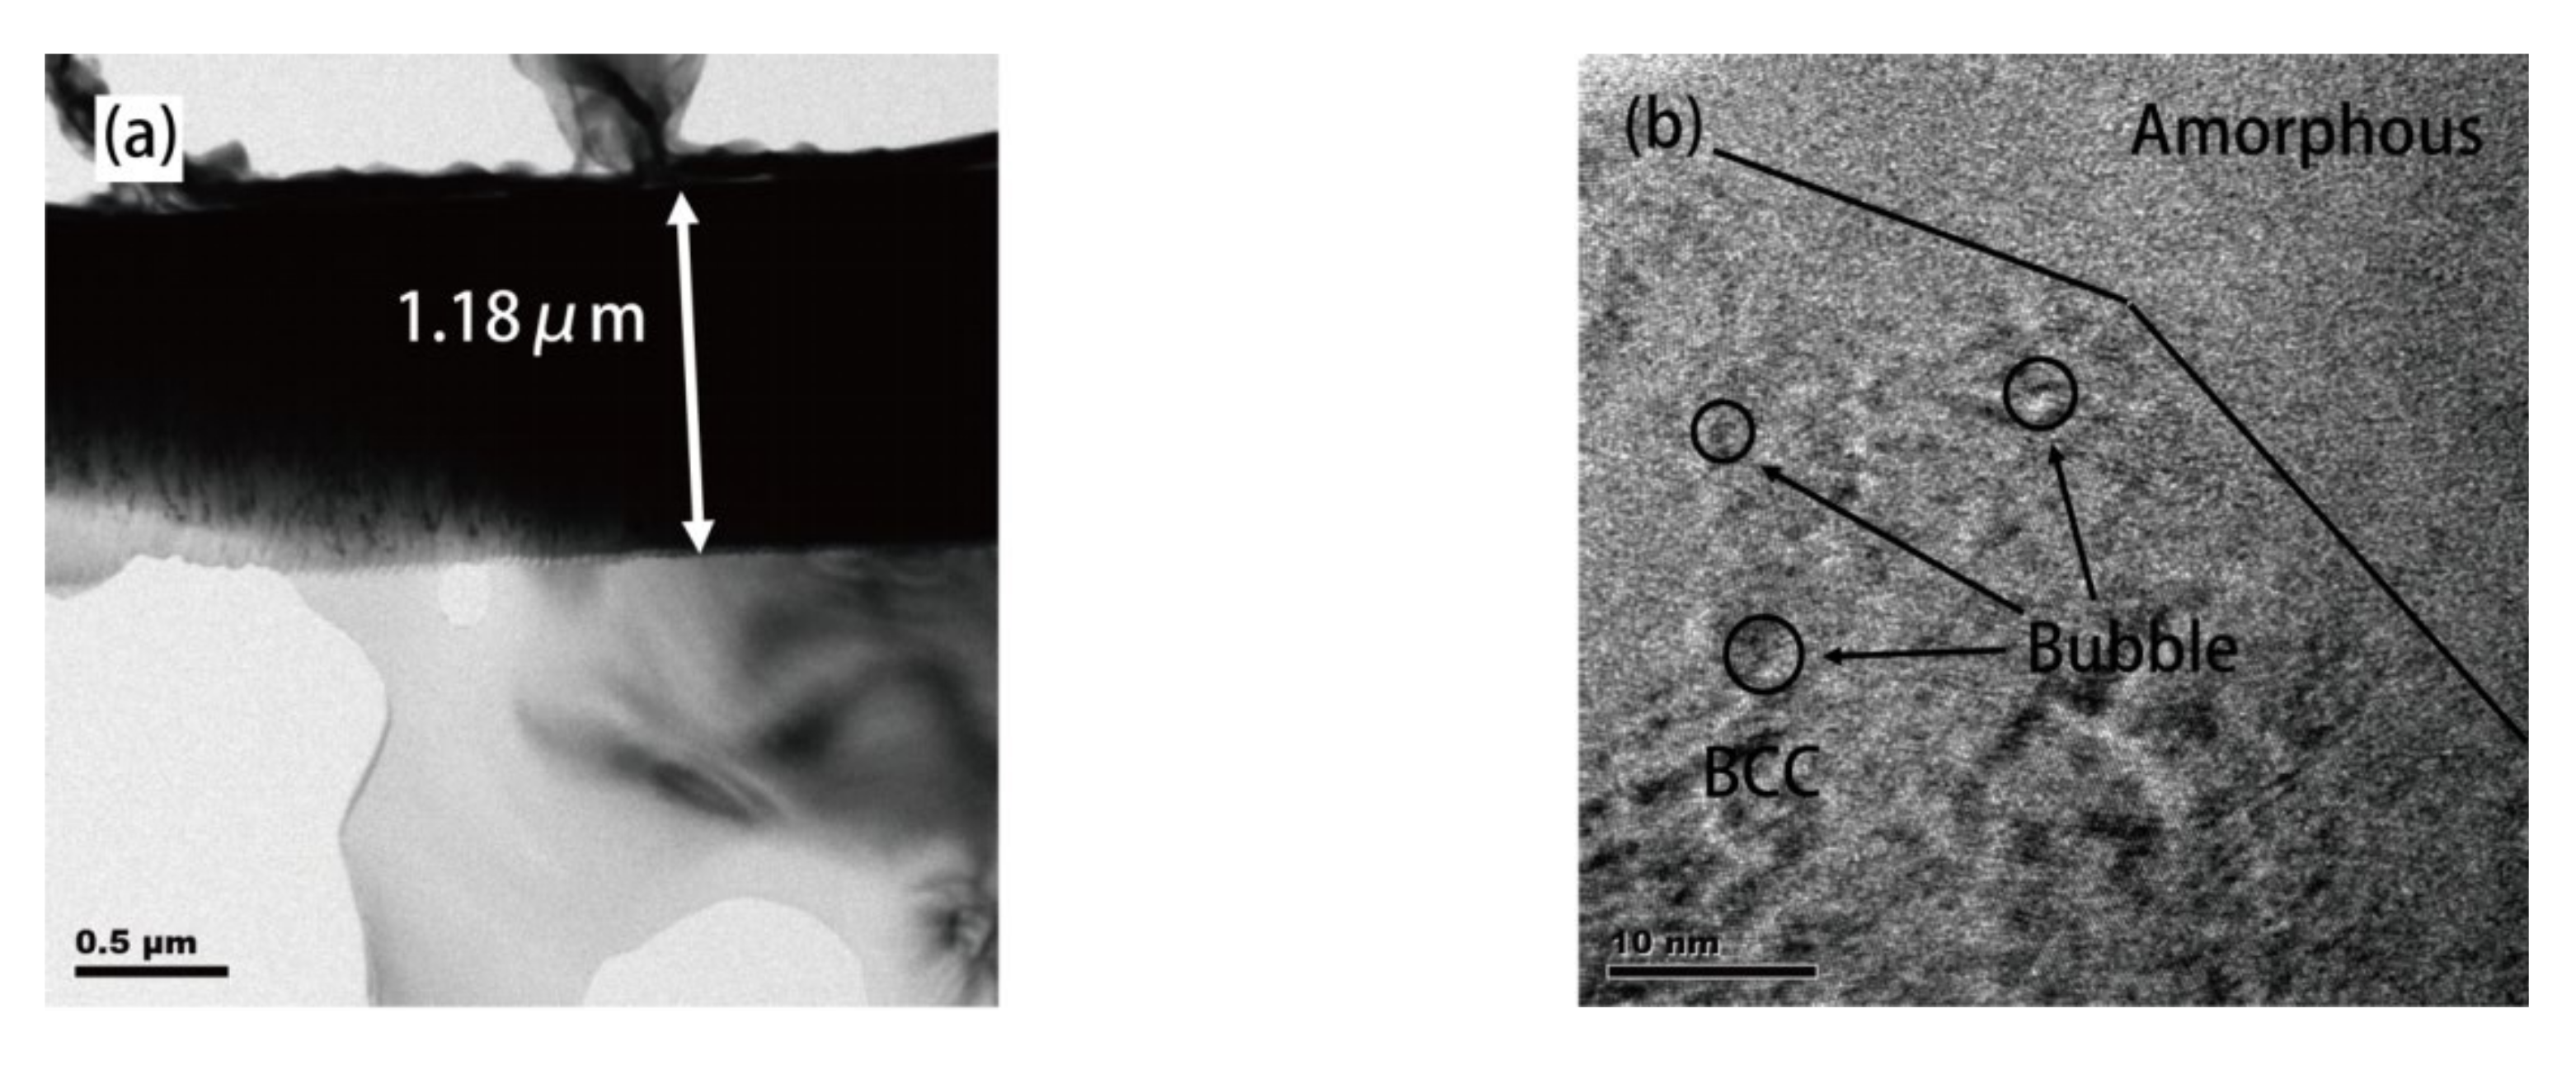
3.4. TEM and Radiation-Damage Analysis

Drawing on the research in the previous two sections, it can be concluded that as the alloy composition changes, the film varies from a BCC to an amorphous structures. In the entire phase-transition process, there is no mesophase formation, which belongs to a simple linear phase-transition relationship. Therefore, two typical samples were selected sample C (x = 0.398) and sample K (x = 0.759), which represent the BCC structure and the amorphous structure, respectively. TEM analysis and irradiation experiments were executed for these two samples. Before the irradiation experiment, SRIM was used to simulate the damage calculation. The calculation results are shown in Figure 3.
Comparing Figure 4a and Figure 5a, under the same total deposition current, the sample thicknesses of Samples C and K were 1.29 μm and 1.18 μm, respectively. This shows that the deposition rates of Ta and W were faster than those of Ti, V, and Cr, but the difference in thickness among the group of film samples was not obvious. The reason for this is that the application of bias voltage can change the deposition rates of elements, making the film denser and more uniform, which is beneficial for the analysis of gradient material systems.
Compared with the results of SRIM calculations, under the same irradiation dose, when the contents of Ti, V, and Cr were high, the damage value of the material was smaller, the damage range was wider, and the injected particles were wider in the depth direction. The imnges in Figure 4b,c show the high-resolution transmission electron microscopy (HRTEM), and selected area electron diffraction (SAED) images of Sample C (x = 0.398) before and after the He+ irradiation with a dose of 1 × 10¹⁶ ions/cm2. Before the TEM analysis, the XRD analysis showed no significant change in any of the samples in the XRD pattern after irradiation, and no significant phase structure change. In SAED, the diffracted light spot was a ring-like light spot, signified a polycrystalline structure. Upon analysis of the ratio of the diffraction-ring radius, Ri, Sample C was found to belong to a BCC polycrystalline structure mainly composed of TaW solid solutions and wrapped with Ta and W simple substances. When analyzing the HRTEM image, two crystal structures with a crystal plane spacing of 0.228 nm and 0.224 nm could be observed, representing the TaW solid solution, and the Ta and W metal simplex, respectively. A large range of Ti, V, and Cr metal elemental solid crystals and the characteristic crystal structure of intermetallic compounds were not observed. It is speculated that Ti, V, and Cr entered the Ta and W structure to form a replacement solid solution.
Figure 5 presents the HRTEM and SAED images of Sample K (x = 0.759) before and after irradiation. Compared with Figure 4, Sample K has a more complex polycrystalline structure in these images. The SAED pattern exhibits a typical polycrystalline diffraction ring with a small diffuse reflection halo, showing a BCC polycrystalline and amorphous mixed structure. Through the HRTEM images, a variety of BCC structure crystals with different interplanar spacings can be observed, as well as obvious amorphous regions. A variety of crystal structures with different interplanar spacings can be observed in the crystalline region, corresponding to intermetallic compounds and solid solutions formed by different metal elements. The relevant parameters of different crystal structures are listed in Table 3. With increases in the Ti, V, and Cr elemental contents, many different crystal structures formed among themr, so that the material tended to form polycrystalline and amorphous structures. These phase-structure changes are consistent with the calculation results of the thermodynamic parameters in Table 2.

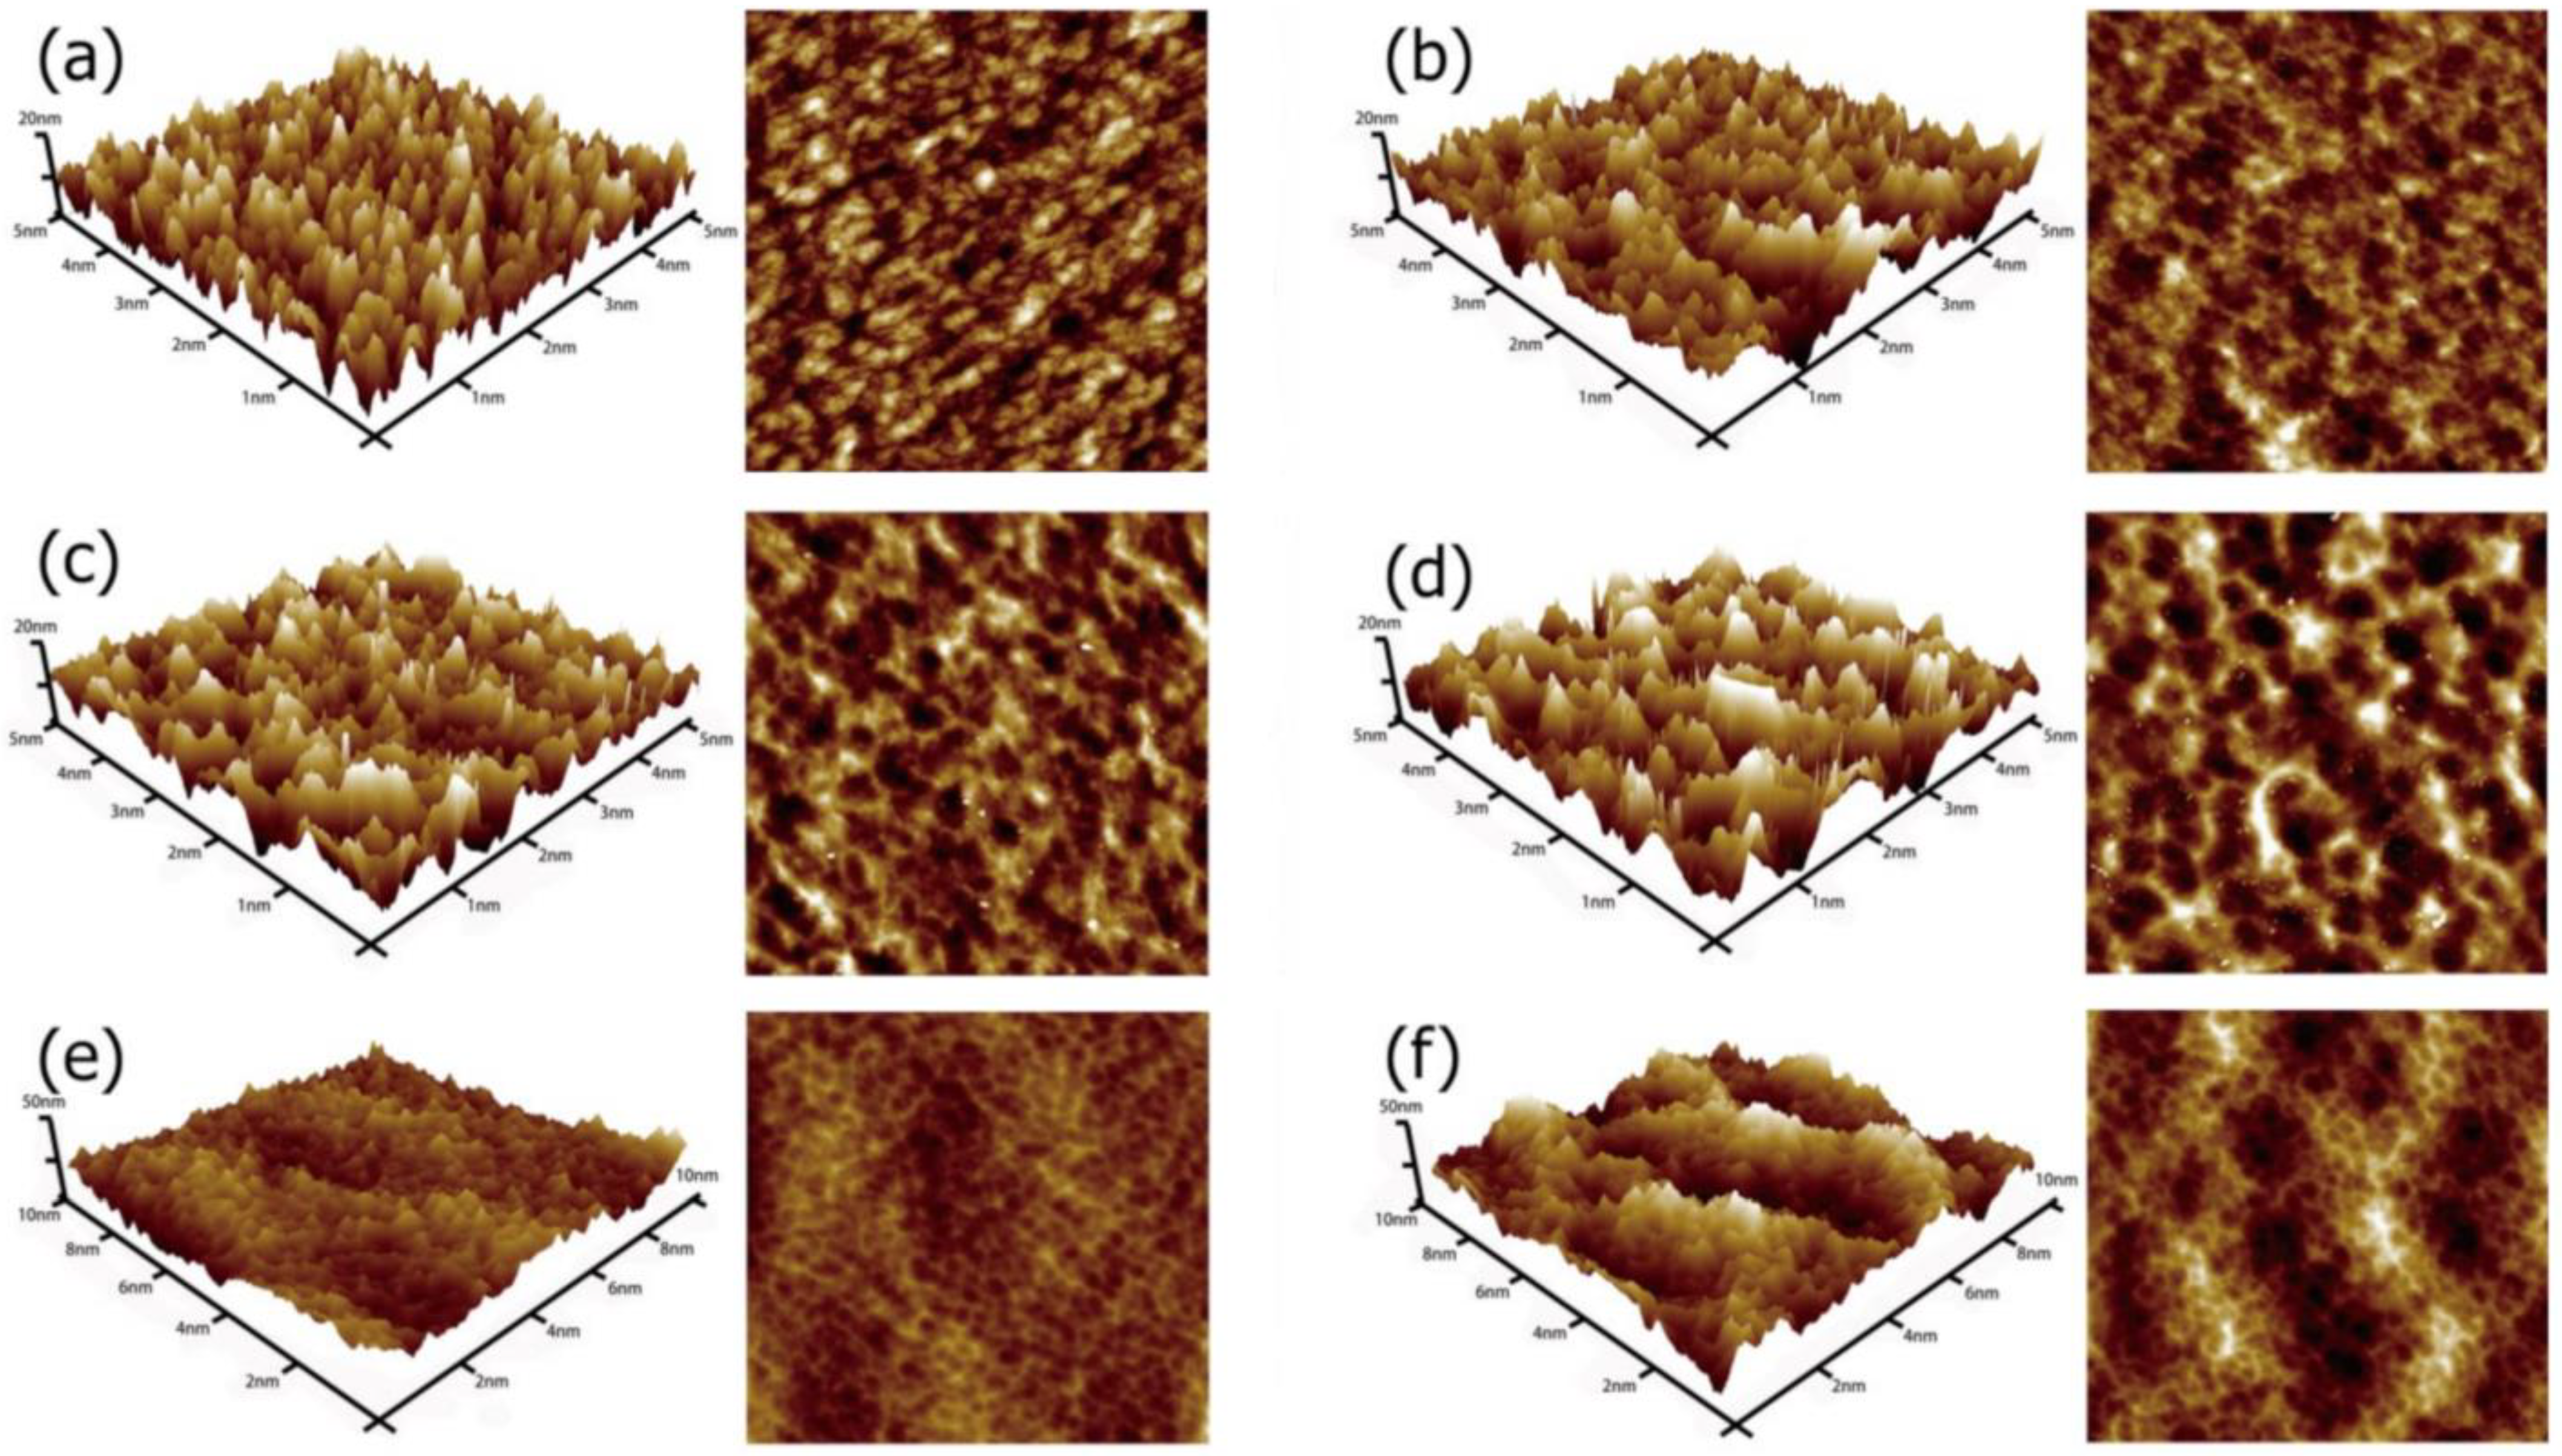
3.5. Surface Topography

The surface morphology of the coating and its roughness were analyzed by atomic force microscopy (AFM) at room temperature. It was observed that with the increases in the Ti, V, and Cr elemental contents, the phase structure and surface morphology changed accordingly. Several distinct topographical characteristics are given in Figure 6. The images in Figure 6a–f correspond to Samples B, D, F, H, J, and L, respectively in Table 1 and Table 2, and the corresponding x values are 0.36, 0.47, 0.56, 0.66, 0.74, and 0.81. The corresponding samples in Figure 6a–d are smaller and flatter than in Figure 6e,f. Therefore, a 40 nm vertical scale was used, and the scanning range is set to 5 μm to display more details. The samples of Figure 6d,e are relatively coarse. In order to better observe the whole picture, a vertical scale of 100 nm was selected, and the scanning range was also enlarged to 10 μm.
The surface topography of each group of samples was collected by AFM, and the roughness was calculated. The results are shown in Figure 7. When x < 0.66, the roughness of the coating was relatively low, and the average roughness was Ra < 7.0. Subsequently, as the value of x increased, the roughness rapidly rose and eventually stabilizes, which was roughly maintained at 12.0–13.5.
Correspondingly, the surface morphology also changed in stages. When x = 0.36, the main components of the film were Ta and W components, which had a BCC structure, and a relatively regular column-like crystal structure was formed on the surface. The film was delaminated, columnar crystals were aggregated into blocks on the surface, and there are tiny gaps between the aggregated blocks (Figure 6a). At x = 0.47, the phase structure of the film changed to an amorphous structure, the BCC columnar crystal structure disappeared, the surface was wrinkled, a small number of irregularly-shaped pits began to appear, and a small number of precipitated phases also appeared on the film surface (Figure 6b). Figure 6b,c, shows that with the increases in the Ti, V, and Cr elemental contents, the surface wrinkles of the film gradually decrease, and the surface pits and precipitation phases gradually increase. Hence, the roughness increases slightly. Figure 6e, shows Ti, V, and Cr as the main components in the film. A certain regular distribution of peak and valley structures formed on the surface of the film, and elliptical pits are evenly distributed, The precipitated phase disappeared rapidly. Due to the obvious peak and valley structures, the roughness increased rapidly, and a white mist structure began to form. In Figure 6f, the surface morphology of the film is basically consistent with that of Figure 6e, although less prominent, and a clear white haze structure is visible.

3.6. Mechanical Properties

The mechanical properties of the material were analyzed through nanoindentation and abrasion experiments, and the hardness and modulus values of the deposited films with different current ratios are shown in Figure 8a. It can be seen from the comparison that the hardness and modulus increase from 25.36 GPa and 261.47 GPa to 27.54 GPa and 274.39 GPa with the increases in the Ti, V, and Cr elemental contents, and then decreased to 19.74 GPa and 225.45 GPa. When x = 0.513, the hardness and modulus of the film reached their maximums, which were 27.54 GPa and 274.39 GPa, respectively. The film’s mechanical properties showed a clear correlation with its elemental composition.
The H/E value and H3/E*2 value of the film were two important indicators for analyzing the fracture toughness of the film. The fracture toughness of nanocrystalline films increases with the increase in H/E (resistance to elastic deformation) and H3/E*2 (resistance to plastic deformation) [32]. The H/E and H3/E*2 values calculated from the results of the nanoindentation experiment are shown in Figure 8. According to the results shown in the figure, with the increases in the Ti, V, and Cr elemental contents, the values of H/E and H3/E*2 increased rapidly at x = 0.47, and then decrease rapidly at x = 0.56. When 0.47 < x < 0.56, due to the influence of various strengthening mechanisms, a strong and tough area appeared. The value of H/E was 0.95–0.1, and the value of H3/E*2 was 0.25–0.3. The experimental results indicate that the film exhibited excellent strength and toughness under the specific alloying elemental ratio.

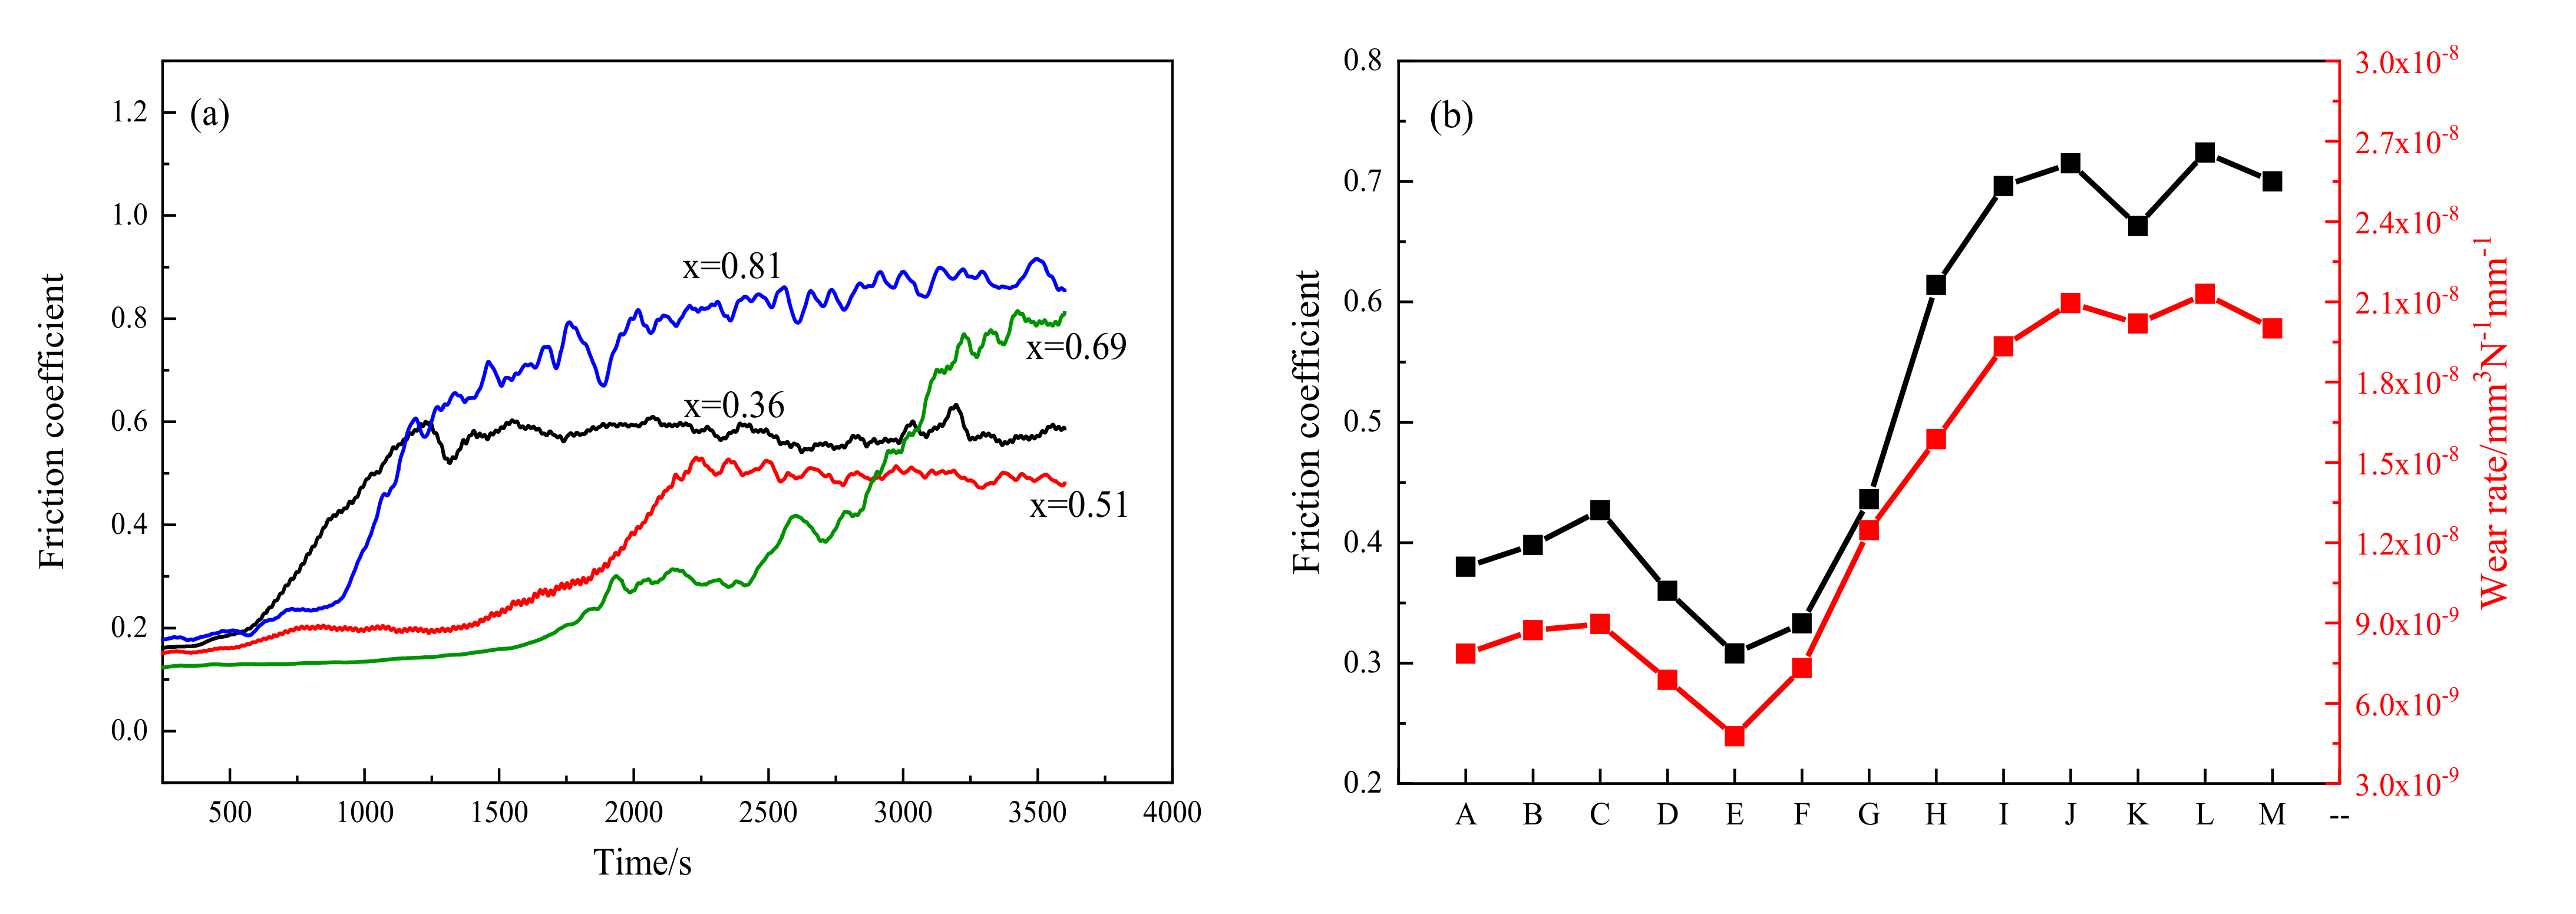
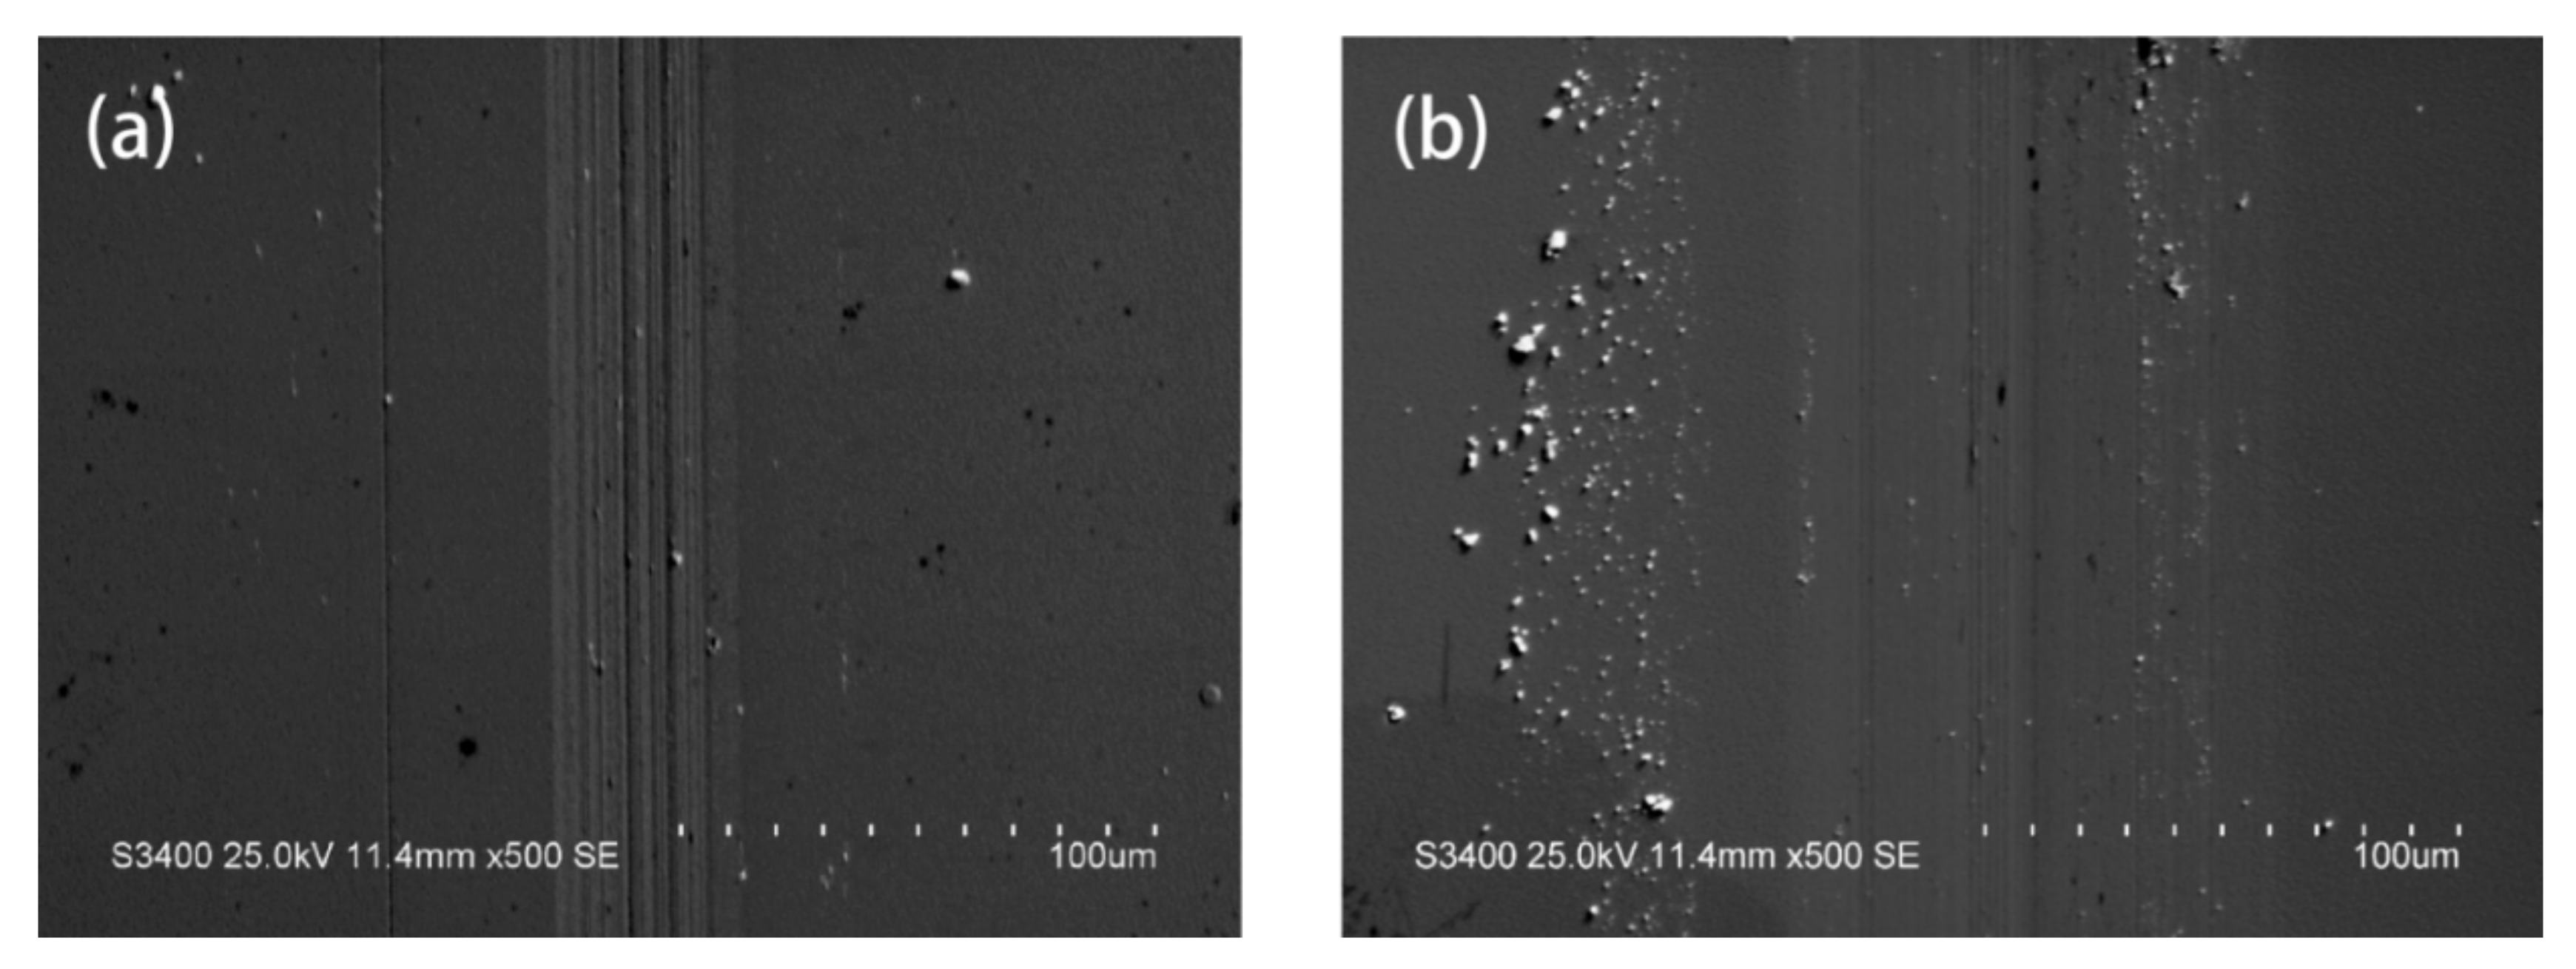
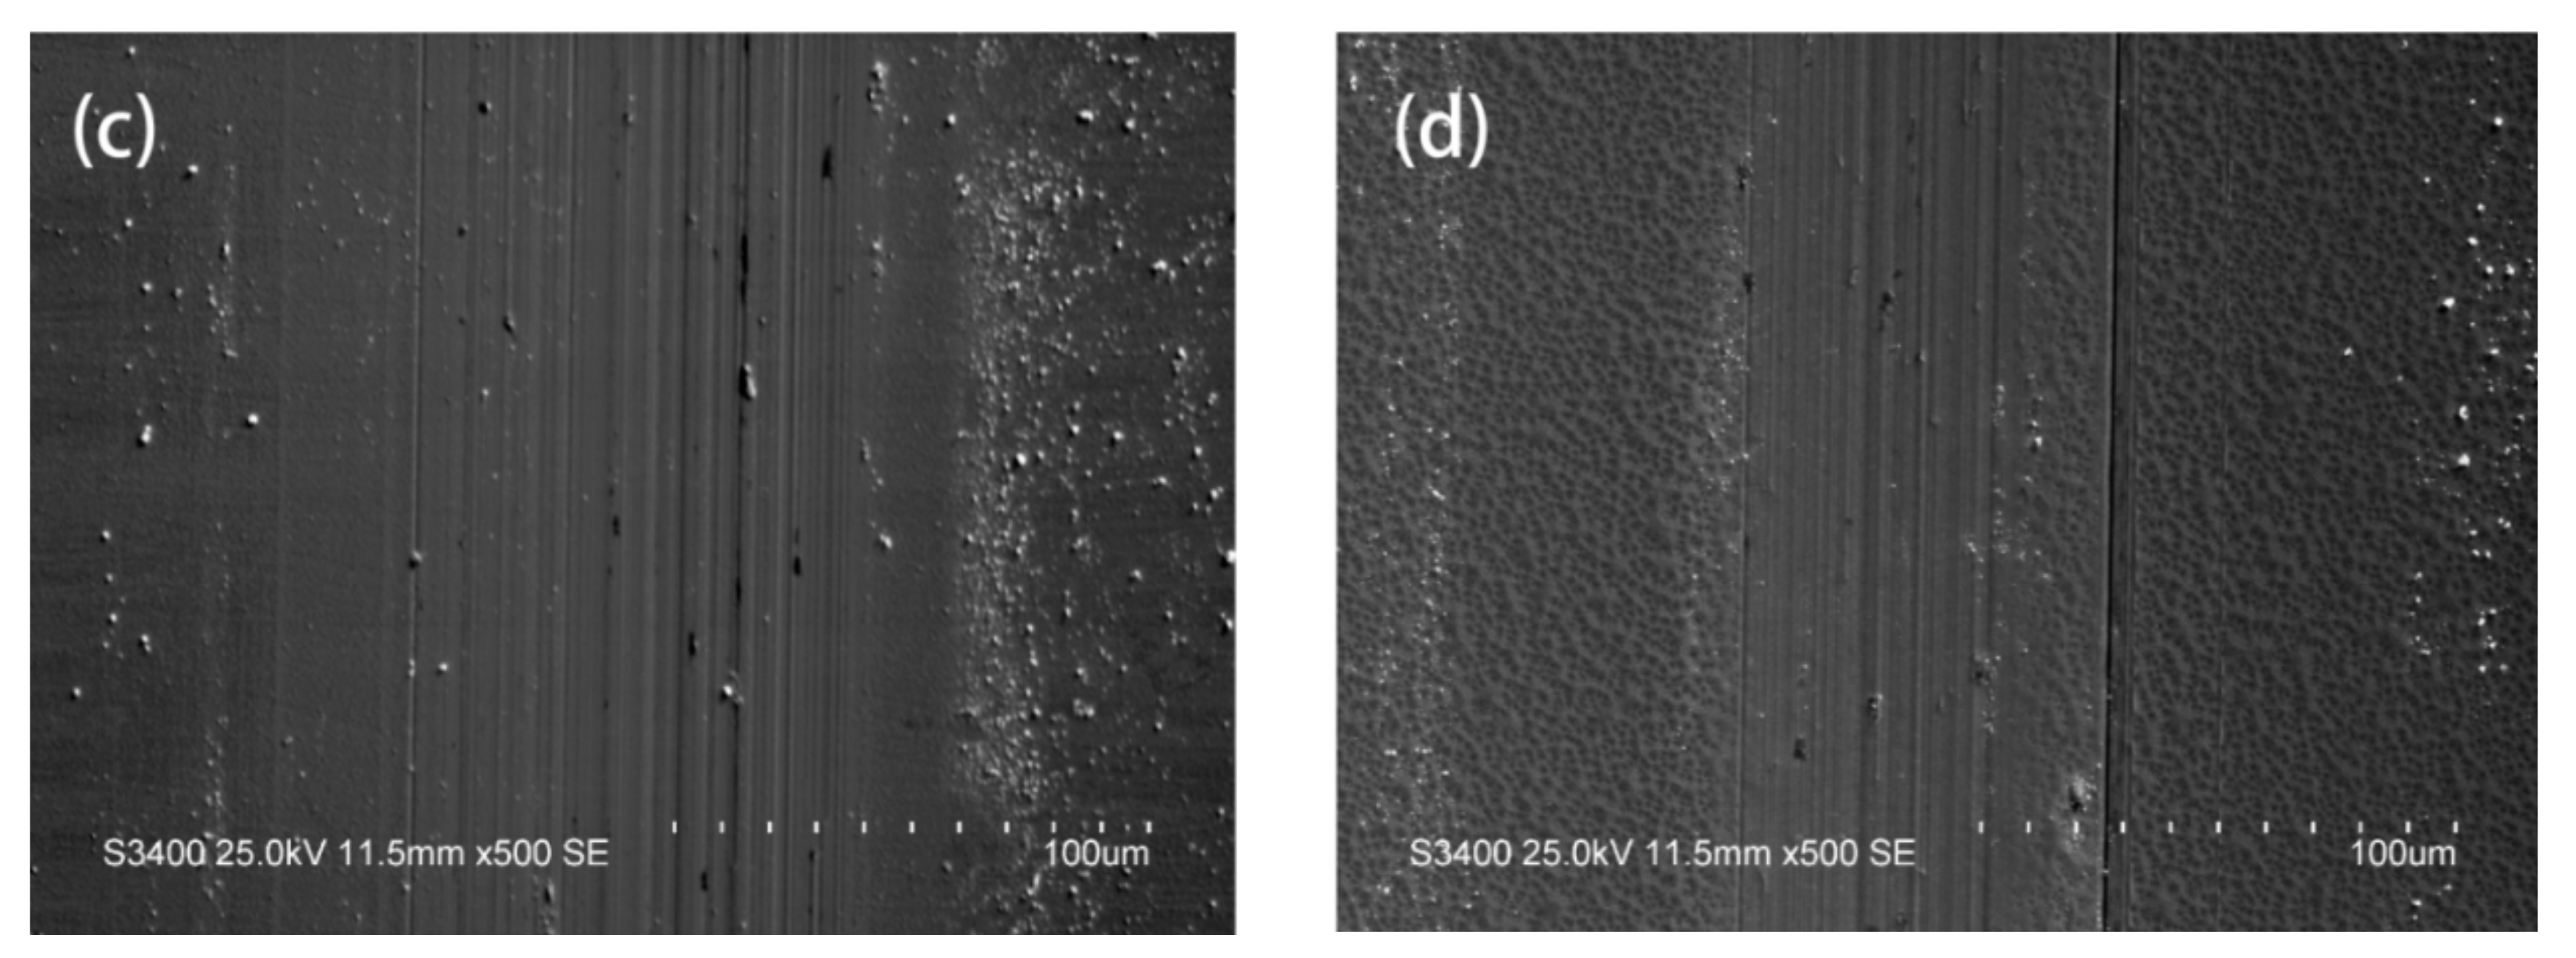
3.7. Tribological Properties

Figure 9 shows the changes in friction coefficients for four typical film friction experiments under different process parameters. Generally, the friction curve includes an initial wear phase and a stable wear phase. During the initial wear phase, the friction coefficient of the material will rise rapidly in a relatively short period of time, and then remain stable. The wear performance of the film is affected by many factors, such as hardness, strength, toughness, internal defects, surface roughness, and the bonding force of the film to the substrate. In this experiment, due to the multiple strengthening mechanisms unique to HEAs, the films i exhibited unique wear behavior, with a longer friction coefficient rising stage. Under specific processing parameters, the friction coefficient will change after 30 min of wear, presenting a certain abrasion resistance.
As shown in Figure 9a, when x = 0.36, the friction coefficient of the film increased during 500–1000 s abrasion, and then fluctuated continuously at about 0.6. When x = 0.51, the friction coefficient of the film increased after 1500–2000 s abrasion, and fluctuateds around 0.5. When x = 0.69, the film had a long friction coefficient rising process during 1500–3500 s abrasion, and after nearly 1 h of wear, the friction coefficient was stable at 0.8. When x = 0.81, the friction coefficient quickly rose to 0.8 during 1000–1250 s abrasion, and rose slightly futher in the subsequent wear process. The response of most samples to the wear behavior was not obvious, and they showed good wear resistance. Comprehensive analysis shows that when x = 0.51, the film showed the best wear resistance. The wear track morphologies were examined with CLSM, and the wear rate (Wr) of the films were calculated using Equation (6):
W r = C × S F × L
where C is the perimeter of the wear crack (mm), S is the wear crack area (mm2), F is the normal load (N) and L is the sliding length. Figure 9b presents the changes in the average friction coefficient and wear rate of different films under different deposition-process parameters. With the increases in the Ti, V, and Cr elemental contents, the average coefficient of friction and wear rate rose slightly from 0.381 and 7.85 × 10⁻⁹ mm3N−1 mm−1, and then decreased rapidly. When x = 0.51, the minimum value was obtained, and the average friction coefficient and wear rate were 0.308 and 4.77 × 10⁻⁹ mm3N−1 mm−1, respectively. Then, with the increases in the Ti, V, and Cr elemental contents, the average friction coefficient and wear rate increase significantly. When x = 0.69, it is basically stable at 0.7 and 2.0 × 10⁻⁸ mm3N−1 mm−1.
Figure 10 shows several typical types of surface morphologies after abrasion. After the abrasion test at 3600 s, the film samples maintained their integrity without surface peeling, indicating that the film had a good bond with the silicon substrate. The films both exhibited particle abrasion and adhesion-wear behavior. As presented in Figure 10b, when x = 0.51 (Sample E), due to the higher hardness and modulus, the film had better wear resistance. Compared with other samples, Sample E suffered less damage, and the wear scars and channels were shallower. As shown in Figure 10d, at x = 0.79 (Sample K), the hardness and modulus of the film were relatively low, and a clear particle morphology is formed on the surface. In the early stage of the wear test, it has a certain effected on the frictional response of the film. The particle morphology is destroyed, the surface characteristics no longer affect the wear behavior of the film, and the wear test truly reflected the characteristics of the material. Therefore, it was inferred that the good abrasion resistance of the material is the result of the combined effect of the surface effect and material characteristics, in which the hardness and modulus of the material had a decisive influence.

4. Discussion

By adjusting the coating composition, the phase structure of the HEA was changed. Previous studies have shown that when Ω > 1.1, δ < 6.6%, ΔHmix < 3.2 KJmol−1, HEAs tend to form solid solutions [33]. According to calculations, the range of Ω was from 5.53 to 7.29, and the range of δ was from 4.16 to 6.55, which meet the conditions for forming a solid solution. The calculation results were consistent with the experimental data. ΔHmix reflected the tendency of the compound formation of the alloy, and ΔSmix represented the degree of chaos of each component in the alloy. Moreover, magnetron-sputtering deposition has a very high cooling rate when preparing thin films, and the higher cooling rate makes it tend to form amorphous structures. Hence, the film becomes amorphous under the combined effect of variations in the elemental composition and high cooling rate. Therefore, the characteristics of HEAs cannot be fully reflected by HEA films. Compared with the dual-target combined co-sputtered film, the thin film prepared by adding a biased co-sputtering method in this paper has a more uniform element distribution. Combining the calculation of the thermodynamic parameters, it can be considered that the thin alloy film prepared by this method was closer to the characteristics of the alloy material, achieving a balance between accuracy and experimental efficiency.
Comparing Figure 4 and Figure 5, it can be seen taht no obvious phase-structure change occurred in the samples after the two groups of irradiation experiments, and no significant holes and dislocation rings appeared after the irradiation, which means that samples showed good radiation resistance. The effect of He+ ion irradiation on the sample consisted mainly in the He bubble left at the damage peak position, which is marked in Figure 4c and Figure 5b,c. It can be observed that He bubbles were concentrated in the BCC structure and hardly appeared in the amorphous region. At the same time, the He bubbles in Sample K were relatively small.
Based on the previous research [34,35,36], it is known that among crystal structures, a BCC structure has better resistance to radiation damage than an FCC structure. On the other hand, an amorphous structure does not have a lattice, so there are no inter-lattice dislocations and defects, and it has better radiation resistance than a crystal structure. In this experiment, the selected alloy elements had a lower activation energy. After alloying, the samples showed a variety of different BCC crystal structures and amorphous structures. A large number of phase interfaces are generated between different structures, which helps the absorption of defects and greatly improves the radiation resistance of the HEA [37].
All samples had the same deposition process (bias voltage, working pressure, and Argon flow), and the only variable was the change in the deposition current ratio and the composition of the thin-film elements that it generated. In the experimental design of this paper, all samples had the same total current. Because different elements respond differently to current excitation and reverse sputtering, the deposition rates of Ta and W were faster, while the deposition rates of Ti, V and Cr were slower. Therefore, in order to achieve the predetermined composition effect, when the contents of Ti, V, and Cr are high, the current of I(TiVCr) was higher than that of I(TaW). The greater single target deposition current produced a certain anti-sputtering effect, and the film surface was bombarded with sputtering-atomic groups, forming the peak-to-valley morphology unique to Figure 6e,f, which led to an increase in roughness [38]. In Figure 6a–d, the currents difference between the two targets is relatively small, and the change in the surface morphology was mainly affected by the elemental composition.
In all samples, with the increases in the Ti, V, and Cr elemental contents, the δ, ΔHmix, and ΔSmix showed trends of first increase and then decrease. As the compositions of the Ta and W alloys decreased, Tm gradually decreased, and finally the associated entropy-enthalpy ratio, Ω, also presented a trend of first increase and then decrease. When the components of the coating approached an equimolar ratio, the entropy enthalpy ratio, Ω, and ΔSmix, reached the maximum value, showing similar x values, and when ΔHmix reached the maximum value position, the x value was relatively larger. With the increase in atomic-size difference, δ, the alloy produced a larger lattice-distortion effect, which intensified the internal stress of the film to a certain extent, leading to the generation of precipitated phases. Therefore, as shown in Figure 6a–d, with the increases in the Ti, V, and Cr elemental contents, the surface morphology changed accordingly, from the pleated-shape morphology to pits. On the other hand, when x = 0.74, ΔHmix achieved a maximum value, and with a higher ΔHmix, the alloy tended to form intermetallic compounds, which promoted the formation of precipitated phases. In Figure 6e,f, the peak-valley structure on the surface of the film effectively absorbed the internal stress generated by the effect of the lattice distortion due to the increase in the sputtering current. Thus, the precipitate phase disappeared, but the pit shape was retained.
With the increases in the Ti, V, and Cr elemental contents, the hardness and modulus first increased and then decreased. The changes in the mechanical properties of HEA films can be attributed to the following three factor [39,40,41]. The first factor is the influence of the characteristics of the alloying elements in the coating. Compared with Ti, V, and Cr, Ta and W have higher hardness, and each element in the HEA forms a solid solution. Due to the cocktail effect, the original properties of the alloy elements were retained and reflected in the alloy. Therefore, Sample A had higher hardness and modulus than Sample M. The second factor is the phase-structure change caused by the change in the alloy element ratio and the effect of solid-solution strengthening. Ta and W form a typical BCC structure of a TaW solid solution, and the hardness is greater than the amorphous structure formed when Ti, V, and Cr elements were dominant. With the increases in the Ti, V, and Cr elemental contents, the film changed from a BCC structure to an amorphous structure. Due to the higher hardness of the BCC structure, the grain refinement caused by the alloy-phase transformation and the solid-solution strengthening worked together to obtain the best mechanical properties in the transition zone. Subsequently, with the further increase in the Ti, V, and Cr elemental contents, the film completely changed to an amorphous structure, the phase-structure characteristics changed, and no longer had the conditions of solid-solution strengthening, and the mechanical properties of the material decreased significantly. The third factor is the influence of the thermodynamic calculation. Comparing the results of the mechanical properties of the film with the calculated parameters of the thermodynamics, it was found that the entropy-enthalpy ratio, Ω, was related to hardness and modulus. When the alloy element were close to the equimolar ratio, Ta and W, with smaller atomic radii, entered the original lattice of Ti, V, and Cr to form a replacement solid solution, which produced a solid-solution strengthening effect. At the same time, with the introduction of multiple elemental compositions, more complex mixing entropy and mixing enthalpy relationships were generated between each elemental composition. The phase was analyzed in the formation part, which produced a pinning effect and fixed the grain structure, further improving the mechanical properties of the material [42].
The wear resistance of the film was affected by the following factors [43,44,45,46]. The first factor was the change in the hardness and modulus caused by the proportion of different alloy elements. The second factor was the influence of the change in the film-surface roughness on the wear response. In the analysis shown in Figure 6, the hardness of the film and the wear performance of the film show a clear correlation. When the value of x was small, the roughness of the film did not change significantly, and the wear resistance was mainly affected by the hardness, and was jointly affected by multiple strengthening mechanisms. When x = 0.51, the film hardness was the highest, and the greater hardness largely improved the wear resistance of the material. The third factor, was the effect of different alloying elements on the surface, as exhibited in Figure 6. When x = 0.56 and x = 0.66, a large number of fine particles formed on the surface of the film, and the morphology also tended to form a regular pit structure, which played a self-lubricating role and contributed to the high wear resistance of the material. Corresponding to the wear curve of x = 0.51 in Figure 9, as the wear time increased, the effect of the film surface on the wear behavior of the material disappeared. In the stable wear stage, the friction coefficient of the film was mainly affected by the material hardness and modulus. Through the calculation of thermodynamic parameters, the properties of materials could be predicted to a certain extent.

5. Conclusions

The (TiCrV)x-(TaW)1-x binary system HEA thin films were prepared by double-target co-deposition, and the current ratio between the two targets was adjusted to make the elemental composition in the film change linearly with it. With the increases in Ti, V, and Cr contents, the thin film changed from a BCC single-crystal structure to BCC polycrystalline + amorphous structure, and finally became an amorphous structure. The calculation of a series of thermodynamic parameters could effectively predict the phase-structure change of the alloy, and the analysis predictions agreed with the results of XRD and HRTEM.
The radiation-damage analysis of two typical samples was performed using He ions. The materials showed good radiation resistance without obvious holes and dislocation rings. He bubbles caused by the He-ion irradiation were concentrated in the BCC crystal structure region. By comparison, it was found that by forming a BCC polycrystalline + amorphous hybrid structure, the material’s radiation resistance could be effectively improved. Nanoindentation and abrasion experiments were performed on the film material. When x = 0.51, because of the joint action of multiple strengthening mechanisms, the film had the best mechanical properties, with the hardness and modulus reaching 27.54 GPa and 274.39 GPa, respectively. At the same time, the film had excellent wear resistance. The average friction coefficient and wear rate were 0.308 and 4.77 × 10⁻⁹ mm3N−1 mm−1, respectively.

Author Contributions

R.L.: study design, data analysis, data interpretation, manuscript revision; T.H.: literature search, data collection, data analysis, data interpretation, writing; J.Z.: literature search, figures, study design; C.J.: figures, data collection, data analysis, writing; Y.Z. and P.K.L.: study design, manuscript revision. All authors have read and agreed to the published version of the manuscript.

Funding

This study was supported financially by Capacity Building Project of Local Colleges and Universities of Shanghai (No. 21010500900) and Shanghai Engineering Research Center of Large Piece Hot Manufacturing (18DZ2253400).

Institutional Review Board Statement

Not applicable.

Informed Consent Statement

Not applicable.

Data Availability Statement

Not applicable.

Conflicts of Interest

The authors declare no conflict of interest.

References

  1. Guérin, Y.; Was, G.S.; Zinkle, S.J. Materials challenges for advanced nuclear energy systems. MRS Bull. 2009, 34, 10–14. [Google Scholar]
  2. Global Nuclear Energy Partnership Technical Integration Office. Global Nuclear Energy Partnership Technology Development Plan; GNEP-TECH-TR-PP-2007-00020, rev. 0; Idaho National Laboratory: Idaho Falls, ID, USA, 2007. [Google Scholar]
  3. Odette, G.R.; Alinger, M.J.; Wirth, B.D. Recent Developments in Irradiation-Resistant Steels. Annu. Rev. Mater. Res. 2008, 38, 471–503. [Google Scholar] [CrossRef]
  4. Qiu, X.-W.; Zhang, Y.-P.; He, L.; Liu, C.-G. Microstructure and corrosion resistance of AlCrFeCuCo high entropy alloy. J. Alloys Compd. 2013, 549, 195–199. [Google Scholar] [CrossRef]
  5. Varalakshmi, S.; Rao, G.A.; Kamaraj, M.; Murty, B.S. Hot consolidation and mechanical properties of nanocrystalline equiatomic AlFeTiCrZnCu high entropy alloy after mechanical alloying. J. Mater. Sci. 2010, 45, 5158–5163. [Google Scholar] [CrossRef]
  6. Singh, S.; Wanderka, N.; Kiefer, K.; Siemensmeyer, K.; Banhart, J. Effect of decomposition of the Cr–Fe–Co rich phase of Al-CoCrCuFeNi highentropy alloy on magnetic properties. Ultramicroscopy 2011, 111, 619–622. [Google Scholar] [CrossRef]
  7. Lin, S.Y.; Chang, S.-Y.; Huang, Y.-C.; Shieu, F.-S.; Yeh, J.-W. Mechanical performance and nanoindenting deformation of (AlCrTaTiZr)NCy multi-component coatings co-sputtered with bias. Surf. Coat. Technol. 2012, 206, 5096–5102. [Google Scholar] [CrossRef]
  8. Dong, Y.; Zhou, K.; Lu, Y.; Gao, X.; Wang, T.; Li, T. Effect of vanadium addition on the micro-structure and properties of AlCoCrFeNi high entropy alloy. Mater. Des. 2014, 57, 67–72. [Google Scholar] [CrossRef]
  9. Otto, F.; Dlouhý, A.; Somsen, C.; Bei, H.; Eggeler, G.; George, E.P. The influences of temperature and microstructure on the tensile properties of a CoCrFeMnNi high-entropy alloy. Acta Mater. 2013, 61, 5743–5755. [Google Scholar] [CrossRef] [Green Version]
  10. Senkov, O.N.; Wilks, G.B.; Scott, J.M.; Miracle, D.B. Mechanical properties of Nb25Mo25Ta25W25 and V20Nb20Mo20Ta20W20 refractory high entropy alloys. Intermetallics 2011, 19, 698–706. [Google Scholar] [CrossRef]
  11. Chang, Y.-J.; Yeh, A.-C. The evolution of microstructures and high temperature properties of AlxCo1.5CrFeNi1.5Tiy high entropy alloys. J. Alloys Compd. 2015, 653, 379–385. [Google Scholar] [CrossRef]
  12. Zheng, R.; Chen, J.; Xiao, W.; Ma, C. Microstructure and tensile properties of nanocrystalline (FeNiCo-Cu)1-xTixAlx high entropy alloys processed by high pressure torsion. Intermetallics 2016, 74, 38–45. [Google Scholar] [CrossRef]
  13. Waseem, O.A.; Ryu, H.J. Powder Metallurgy Processing of a WxTaTiVCr High-Entropy Alloy and Its Derivative Alloys for Fusion Material Applications. Sci. Rep. 2017, 7, 1–14. [Google Scholar] [CrossRef] [PubMed]
  14. Liu, Y.; Padmanabhan, J.; Cheung, B.; Liu, J.; Chen, Z.; Scanley, B.E.; Wesolowski, D.; Pressley, M.; Broadbridge, C.C.; Altman, S.; et al. Combinatorial development of antibacterial Zr-Cu-Al-Ag thin film metallic glasses. Sci. Rep. 2016, 6, 26950. [Google Scholar] [CrossRef] [PubMed] [Green Version]
  15. Koltunowicz, T.N.; Zhukowski, P.; Bondariev, V.; Saad, A.; Fedotova, J.A.; Fedotov, A.K.; Milosavljevic, M.V.; Kasiuk, J. En-hancement of negative capacitance effect in (CoFeZr)x(CaF2)(100-x) nanocomposite films deposited by ion beam sputtering in argon and oxygen atmosphere. J. Alloys Compd. 2014, 615, 361–365. [Google Scholar] [CrossRef]
  16. Ivashchenko, V.; Veprek, S.; Pogrebnjak, A.; Postolnyi, B. First-principles quantum molecular dynamics study of TixZr1−xN(111)/SiNy heterostructures and comparison with experimental results. Sci. Technol. Adv. Mater. 2014, 15, 025007. [Google Scholar] [CrossRef]
  17. Svito, I.; Fedotova, J.A.; Milosavljevic, M.; Zhukowski, P.; Koltunowicz, T.N.; Saad, A.; Kierczynski, K.; Fedotov, A.K. Influence of sputtering atmosphere on hopping conductance in granular nanocomposite (FeCoZr)x(Al2O3)1-x films. J. Alloys Compd. 2014, 615, 344–347. [Google Scholar] [CrossRef]
  18. Li, J.; Gittleson, F.S.; Liu, Y.; Liu, J.; Loye, A.M.; McMillon-Brown, L.; Kyriakides, T.R.; Schroers, J.; Taylora, A.D. Exploring a wider range of Mg-Ca-Zn metallic glass as biocompatible alloys using combinatorial sputtering. Chem. Commun. 2017, 53, 8288–8291. [Google Scholar] [CrossRef]
  19. Hou, H.; Hamilton, R.F.; Horn, M.W.; Jin, Y. NiTi thin films prepared by biased target ion beam deposition co-sputtering from elemental Ni and Ti targets. Thin Solid Films 2014, 570, 1–6. [Google Scholar] [CrossRef]
  20. Zhang, Y.; Yan, X.; Ma, J.; Lu, Z. Compositional gradient films constructed by sputtering in a multicom-ponent Ti-Al-(Cr, Fe, Ni) system. J. Mater. Res. 2018, 33, 3330–3338. [Google Scholar] [CrossRef] [Green Version]
  21. Yabuta, H.; Sano, M.; Abe, K.; Aiba, T.; Den, T.; Kumomi, H.; Nomura, K.; Kamiya, T.; Hosono, H. High-mobility thin-film transistor with amorphous InGaZnO4 channel fabricated by room temperature rf-magnetron sputtering. Appl. Phys. Lett. 2006, 89, 112123. [Google Scholar] [CrossRef]
  22. Schneider, H.C.; Dafferner, B.; Aktaa, J. Embrittlement behaviour of different international low activation alloys after neutron irradiation. J. Nucl. Mater. 2001, 295, 16–20. [Google Scholar] [CrossRef]
  23. Kohno, Y.; Kohyama, A.; Hirose, T.; Hamilton, M.L.; Naruid, M. Mechanical property changes of low activation ferritic/martensitic steels after neutron irradiation. J. Nucl. Mater. 1999, 271, 145–150. [Google Scholar] [CrossRef]
  24. Kimura, A.; Matsui, H. Neutron irradiation effects on the microstructure of low-activation ferritic alloys. J. Nucl. Mater. 1994, 212–215, 701–706. [Google Scholar] [CrossRef]
  25. Samaras, M.; Derlet, P.; Van Swygenhoven, H.; Victoria, M. Atomic scale modelling of the primary damage state of irradiated fcc and bcc nanocrystalline metals. J. Nucl. Mater. 2006, 351, 47–55. [Google Scholar] [CrossRef]
  26. Yao, Z.; Baluc, N.; Victoria, M. Irradiation-induced stacking fault tetrahedra in fcc metals. Philos. Mag. 2005, 85, 769–777. [Google Scholar] [CrossRef]
  27. Garner, F.A.; Toloczko, M.B.; Sencer, B.H. Comparison of swelling and irradiation creep behavior of fcc-austenitic and bcc-ferritic/martensitic alloys at high neutron exposure. J. Nucl. Mater. 2000, 276, 123–142. [Google Scholar] [CrossRef]
  28. Chang, W.; Kikuchi, N. Analysis of non-isothermal mold filling process in resin transfer molding (RTM) and structural reaction injection molding (SRIM). Comput. Mech. Vol. 1995, 16, 22–35. [Google Scholar] [CrossRef]
  29. Medjani, F.; Sanjinés, R.; Allidi, G.; Karimi, A. Effect of substrate temperature and bias voltage on the crystallite orientation in RF magnetron sputtered AlN thin films. Thin Solid Films 2006, 515, 260–265. [Google Scholar] [CrossRef]
  30. Gao, M.C.; Alman, D.E. Searching for Next Single-Phase High-Entropy Alloy Compositions. Entropy 2013, 15, 4504–4519. [Google Scholar] [CrossRef] [Green Version]
  31. Zhou, Z.; Zhou, Y.; He, Q.; Ding, Z.; Li, F.; Yang, Y. Machine learning guided appraisal and exploration of phase design for high entropy alloys. Comput. Mater. 2019, 5, 128. [Google Scholar] [CrossRef] [Green Version]
  32. Xu, J.; Luo, H.; Ju, H.; Yu, L.; Zhou, G. Microstructure, mechanical and tribological properties of TaWN composite films. Vacuum 2017, 146, 246–251. [Google Scholar] [CrossRef]
  33. Guo, S.; Hu, Q.; Ng, C.; Liu, C.T. More than entropy in high-entropy alloys: Forming solid solutions or amorphous phase. Intermetallics 2013, 41, 96–103. [Google Scholar] [CrossRef]
  34. Song, P.; Sun, J.; Wang, Z.; Cui, M.; Shen, T.; Li, Y.; Pang, L.; Zhu, Y.; Huang, Q.; Lü, J. Irradiation resistance properties studies on helium ions irradiated MAX phase Ti3AlC2. Nucl. Instrum. Methods Phys. Res. Sect. B Beam Interact. Mater. At. 2014, 326, 332–336. [Google Scholar] [CrossRef]
  35. Xia, S.; Gao, M.C.; Yang, T.; Liaw, P.K.; Zhang, Y. Phase stability and microstructures of high entropy alloys ion irradiated to high doses. J. Nucl. Mater. 2016, 480, 100–108. [Google Scholar] [CrossRef] [Green Version]
  36. Chen, E.Y.; Deo, C.; Dingreville, R. Irradiation resistance of nanostructured interfaces in Zr–Nb metallic multilayers. J. Mater. Res. 2019, 34, 2239–2251. [Google Scholar] [CrossRef] [Green Version]
  37. Huang, L.; Chen, Z.; Liu, W.; Huang, P.; Meng, X.; Xu, K.; Wang, F.; Lu, T. Enhanced irradiation resistance of amorphous alloys by introducing amorphous/amorphous interfaces. Intermetallics 2019, 107, 39–46. [Google Scholar] [CrossRef]
  38. Jiang, S.X.; Qin, W.F.; Guo, R.H.; Zhang, L. Surface functionalization of nanostructured silver-coated polyester fabric by mag-netron sputtering. Surf. Coat. Technol. 2010, 204, 3662–3667. [Google Scholar] [CrossRef]
  39. Ding, Y.; Muñiz-Lerma, J.A.; Trask, M.; Chou, S. Microstructure and mechanical property considerations in additive manufacturing of aluminum alloys. MRS Bull. 2016, 41, 745–751. [Google Scholar] [CrossRef]
  40. Li, C.Q.; Xu, D.K.; Zeng, Z.R.; Wang, B.J.; Sheng, L.Y.; Chen, X.B.; Han, E.H. Effect of volume fraction of LPSO phases on corrosion and mechanical properties of Mg-Zn-Y alloys. Mater. Des. 2017, 121, 430–441. [Google Scholar] [CrossRef]
  41. Arfat, Y.A.; Ahmed, J.; Jacob, H. Preparation and characterization of agar-based nanocomposite films reinforced with bimetallic (Ag-Cu) alloy nanoparticles. Carbohydr. Polym. 2017, 155, 382–390. [Google Scholar] [CrossRef]
  42. Zhang, H.; Zhu, H.; Nie, X.; Yin, J.; Hu, Z.; Zeng, X. Effect of Zirconium addition on crack, micro-structure and mechanical behavior of selective laser melted Al-Cu-Mg alloy. Scr. Mater. 2017, 134, 6–10. [Google Scholar] [CrossRef]
  43. Rahmati, B.; Sarhan, A.A.; Basirun, W.J.; Abas, W. Ceramic tantalum oxide thin film coating to enhance the corrosion and wear characteristics of Ti 6Al 4V alloy. J. Alloys Compd. 2016, 676, 369–376. [Google Scholar] [CrossRef]
  44. Dang, C.; Surjadi, J.U.; Gao, L.; Lu, Y. Mechanical Properties of Nanostructured CoCrFeNiMn High-Entropy Alloy (HEA) Coating. Front. Mater. 2018, 5, 41. [Google Scholar] [CrossRef] [Green Version]
  45. Feng, X.; Zhang, K.; Zheng, Y.; Zhou, H.; Wan, Z. Effect of Zr content on structure and mechanical properties of (CrTaNbMoV)Zrx high-entropy alloy films. Nucl. Instrum. Methods Phys. Res. Sect. B Beam Interact. Mater. At. 2019, 457, 56–62. [Google Scholar] [CrossRef]
  46. Yu, L.; Luo, H.; Bian, J.; Ju, H.; Xu, J. Research on Microstructure, Mechanical and Tribological Properties of Cr-Ti-B-N Films. Coatings 2017, 7, 137. [Google Scholar] [CrossRef] [Green Version]
Figure 1. Variations in alloy compositions of (TiVCr)x-(TaW)1-x (A-M) binary system HEA films.
Metals 12 00772 g001
Figure 2. XRD patterns of (TiVCr)x-(TaW)1-x (A-M) binary system HEA films.
Metals 12 00772 g002
Figure 3. SRIM-simulation calculation of the (TiCrV)x-(TaW)1-x (A-M) binary system HEA films. The implanted particles were He+ ions, the energy was 70 KeV, and the dose was 1 × 10¹⁶ ions/cm2. The black line is the radiation damage, and the red line is the deposited He+ ion concentration: (a) Sample C, Ta30W30Ti12V15Cr13, and (b) Sample K, Ta10W10Ti24V26Cr29.
Metals 12 00772 g003
Figure 4. HRTEM and SAED images of sample C (Ta30W30Ti12V15Cr13): (a) cross-sectional view of the film; (b) before irradiation, and (c) at the peak damage depth after irradiation.
Metals 12 00772 g004
Figure 5. HRTEM and SAED images of Sample K (Ta10W10Ti24V26Cr29): (a) cross-sectional view of the film; (b) at the peak depth of damage after irradiation, the interface between the BCC phase and the amorphous phase; (c) before irradiation; and (d) the BCC polycrystalline structure after irradiation.
Metals 12 00772 g005aMetals 12 00772 g005b
Figure 6. 3D and 2D diagrams of (TiCrV)x-(TaW)1-x (A-M) binary system HEA films: (a) Sample B, (b) Sample D; (c) Sample F; (d) Sample H; (e) Sample J; and (f) Sample L.
Metals 12 00772 g006
Figure 7. Average roughness (Ra) change in the (TiCrV)x-(TaW)1-x (A-M) binary system HEA films.
Metals 12 00772 g007
Figure 8. Room temperature mechanical properties of the (TiCrV)x-(TaW)1-x (A-M) binary system HEA films: (a) hardness (black-line segment) and modulus (red-line segment), (b) H/E (black-line segment) and H3/E*2 (red-line segment) calculation results.
Metals 12 00772 g008
Figure 9. Room-temperature wear experiments on the (TiCrV)x-(TaW)1-x (A-M) binary system HEA films: (a) friction-coefficient curves of Samples B, E, H, K; (b) average friction coefficient (black line) and wear rate (red line).
Metals 12 00772 g009
Figure 10. SEM pictures of several types of typical wear scars: (a) Sample B, (b) Sample E, (c) Sample H, and (d) Sample K.
Metals 12 00772 g010aMetals 12 00772 g010b
Table 1. (TiVCr)x-(TaW)1-x (A-M) binary system HEA film-deposition process parameters and alloy elemental composition.
SeriesI(TiVCr), AI(TaW), AConcentration, at.%
TiVCrTaWx
A1.41.67.9210.638.0837.0736.300.266
B1.51.510.8813.5411.6731.3732.550.361
C1.61.412.1514.7312.9429.5630.630.398
D1.71.314.6916.9715.4925.9226.930.472
E1.81.215.8318.4916.9824.1724.530.513
F1.91.116.8920.0819.0521.9822.010.560
G2.01.018.9021.8321.5718.9218.780.623
H2.10.920.1422.9222.9617.0316.950.660
I2.20.821.6123.5624.4715.0915.270.696
J2.30.722.2625.0226.5913.0813.050.739
K2.40.623.9226.2729.3510.2910.160.795
L2.50.524.8826.5230.149.279.200.815
M2.60.426.7027.6732.446.726.470.868
Table 2. Thermodynamic-parameter calculations and phase-structure predictions of the (TiCrV)x-(TaW)1-x (A-M) binary system HEA film.
SERIESSmixHmixTm (K)ΩδPhase
A11.46−5.693103.876.254.16BCC
B12.40−5.392975.716.854.68BCC
C12.68−5.292923.287.014.85BCC
D13.09−5.112820.117.225.17BCC
E13.24−5.022761.267.285.34BCC
F13.34−4.932695.567.295.53BCC + MG
G13.36−4.862607.167.165.77BCC + MG
H13.31−4.832555.067.045.89BCC + MG
I13.21−4.832504.186.856.02BCC + MG
J13.01−4.792446.146.646.15BCC + MG
K12.63−4.802366.556.226.33BCC + MG
L12.47−4.852337.636.006.41MG
M11.91−4.872263.565.536.55MG
Table 3. Crystal structures and interplanar spacings of several types of elemental and mesophases present in (TiCrV)x-(TaW)1-x (A-M) binary system HEA thin films.
TaWTaWVWTiCrTaVCrTi4TiV
Cubicbcc
d (110)0.224 nm0.224 nm0.228 nm0.219 nm0.221 nm0.225 nm0.227 nm0.222 nm
d (220)0.165 nm0.158 nm0.162 nm0.155 nm0.156 nm0.159 nm0.161 nm0.157 nm
d (211)0.135 nm0.129 nm0.132 nm0.126 nm0.127 nm0.130 nm0.131 nm0.128 nm
Publisher’s Note: MDPI stays neutral with regard to jurisdictional claims in published maps and institutional affiliations.

