
Microstructure and Corrosion Resistance of Fusion Welding Zone for Duplextubes Welded with Q345R Tube Sheet under Different Welding Currents


Abstract
:1. Introduction
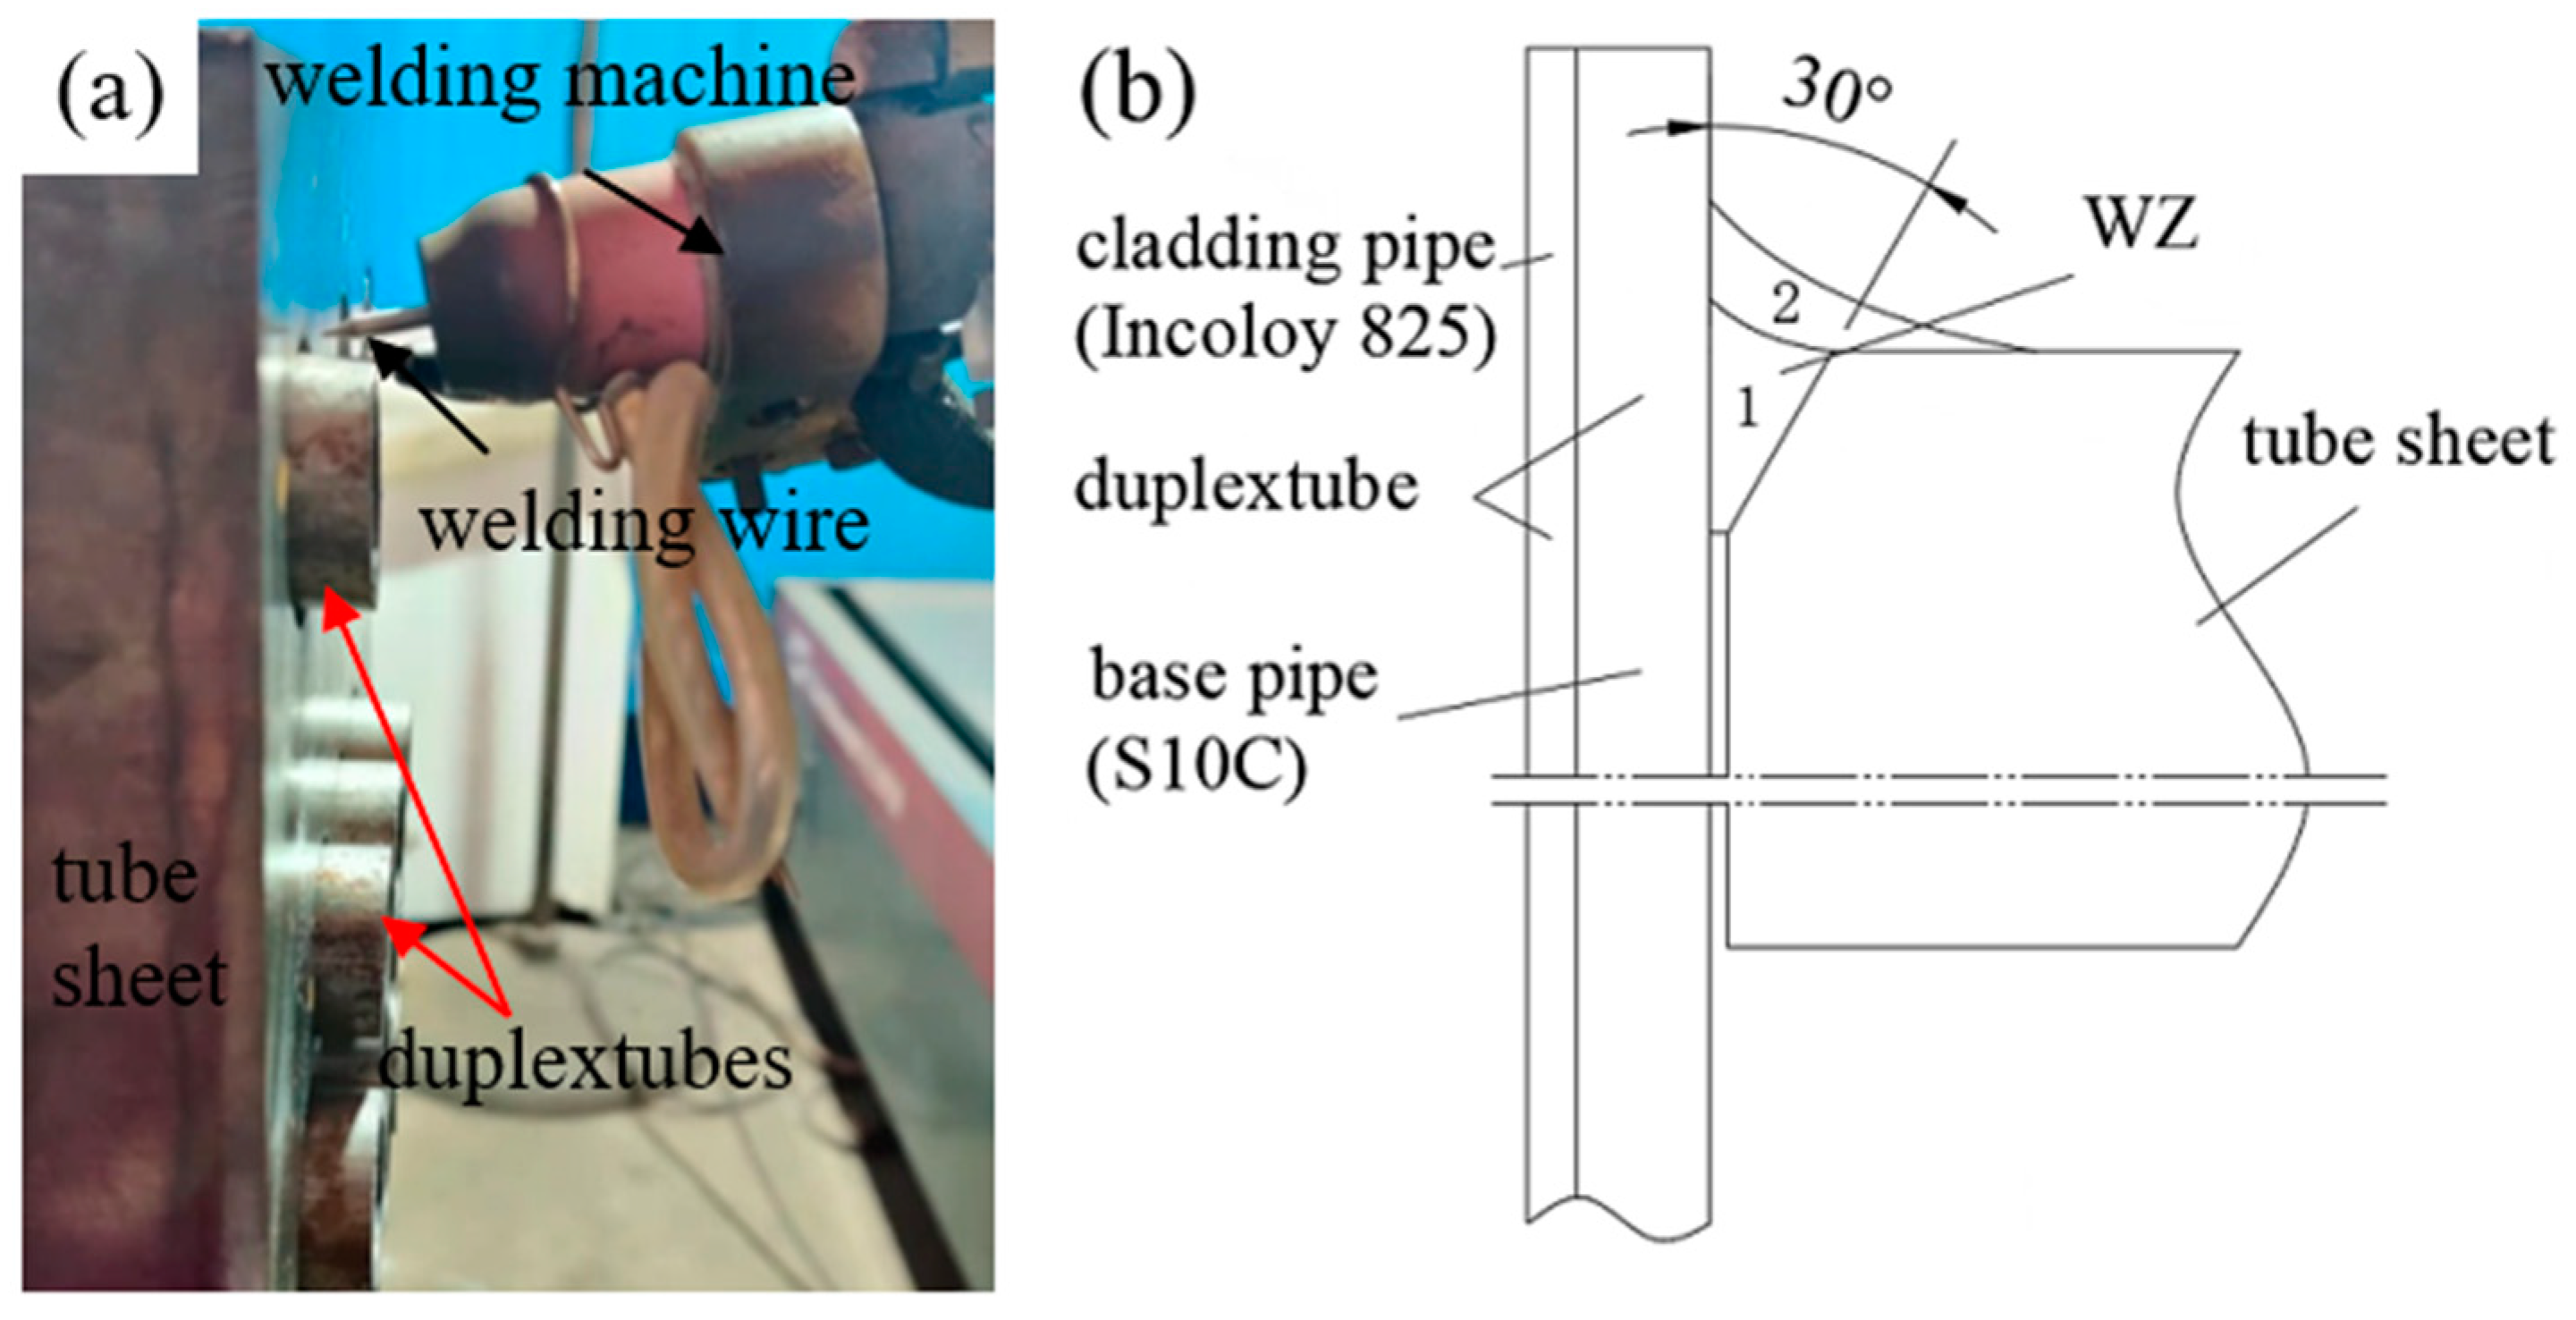
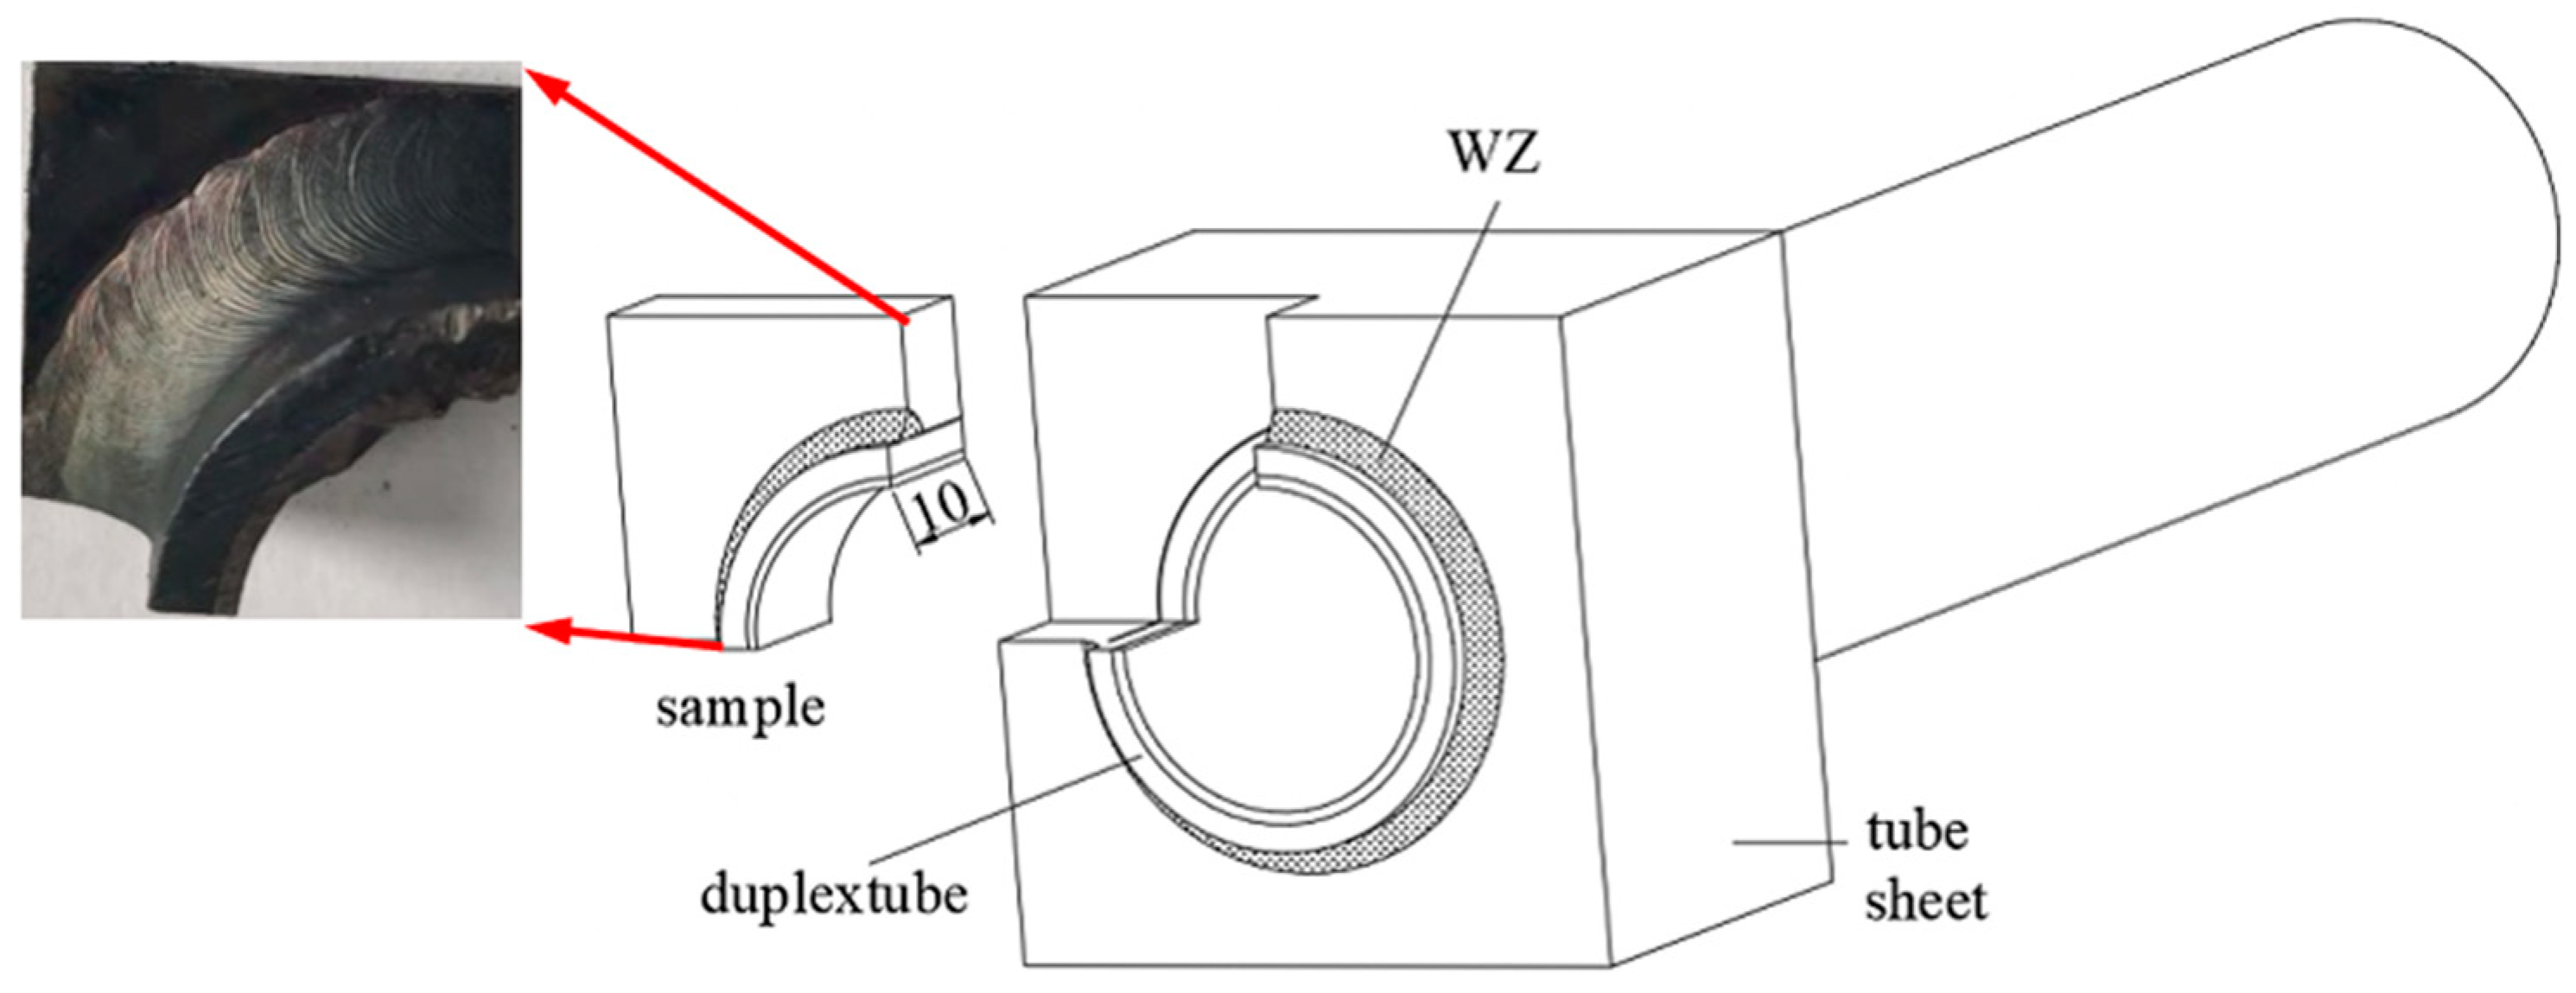
2. Experimental
3. Results and Discussion
3.1. Surface Morphology
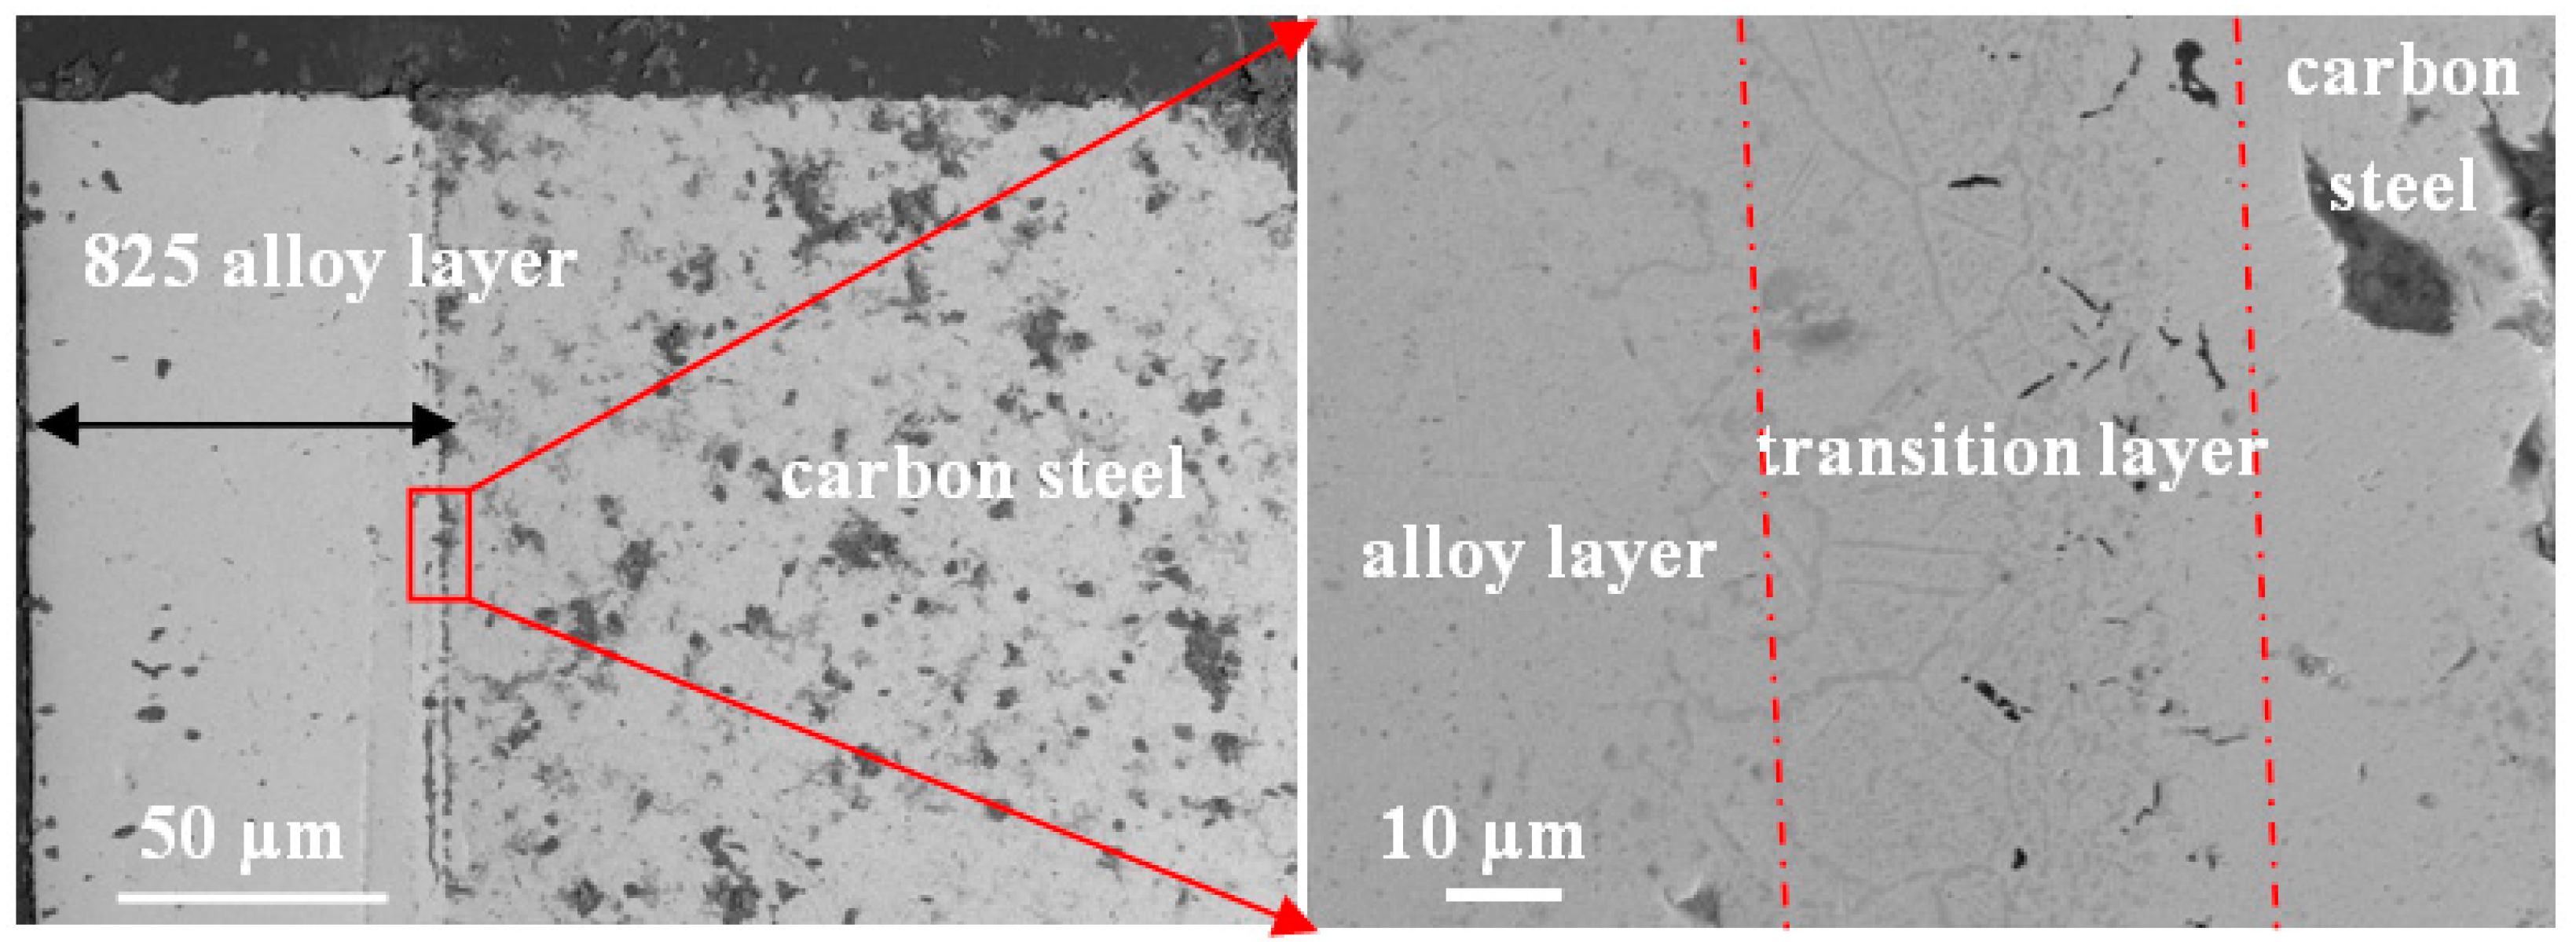
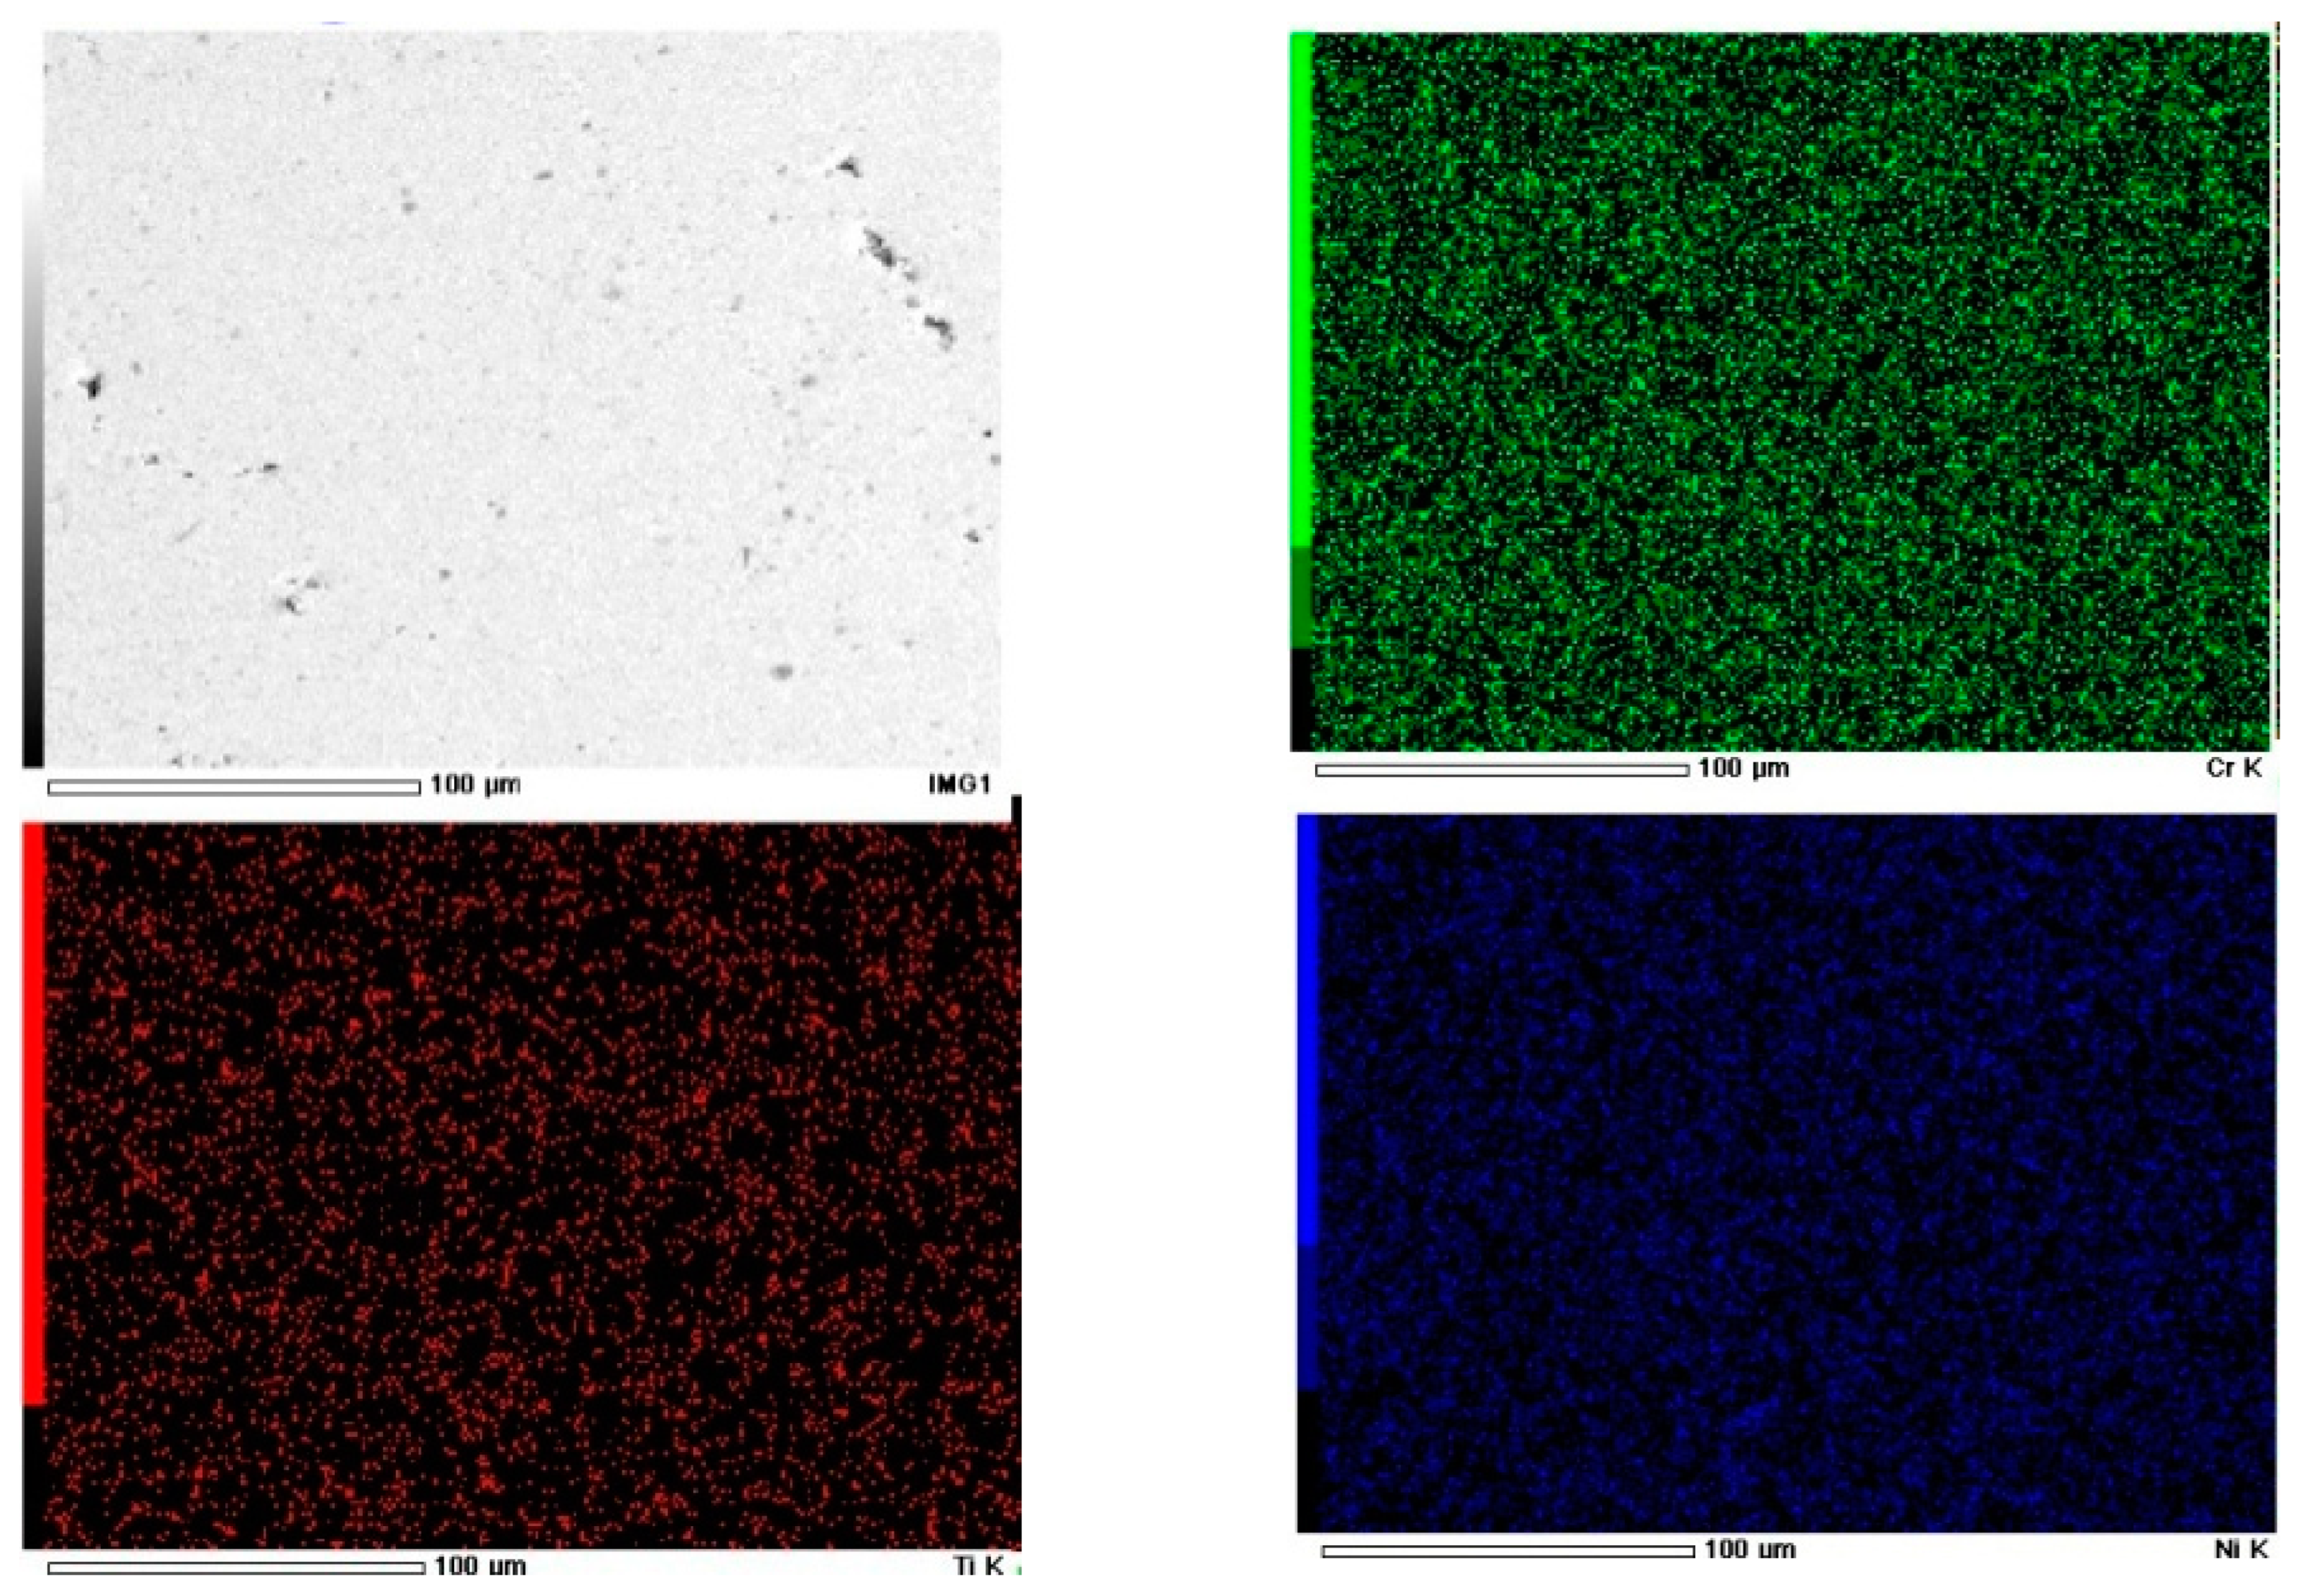
3.2. Metallurgical Characterization
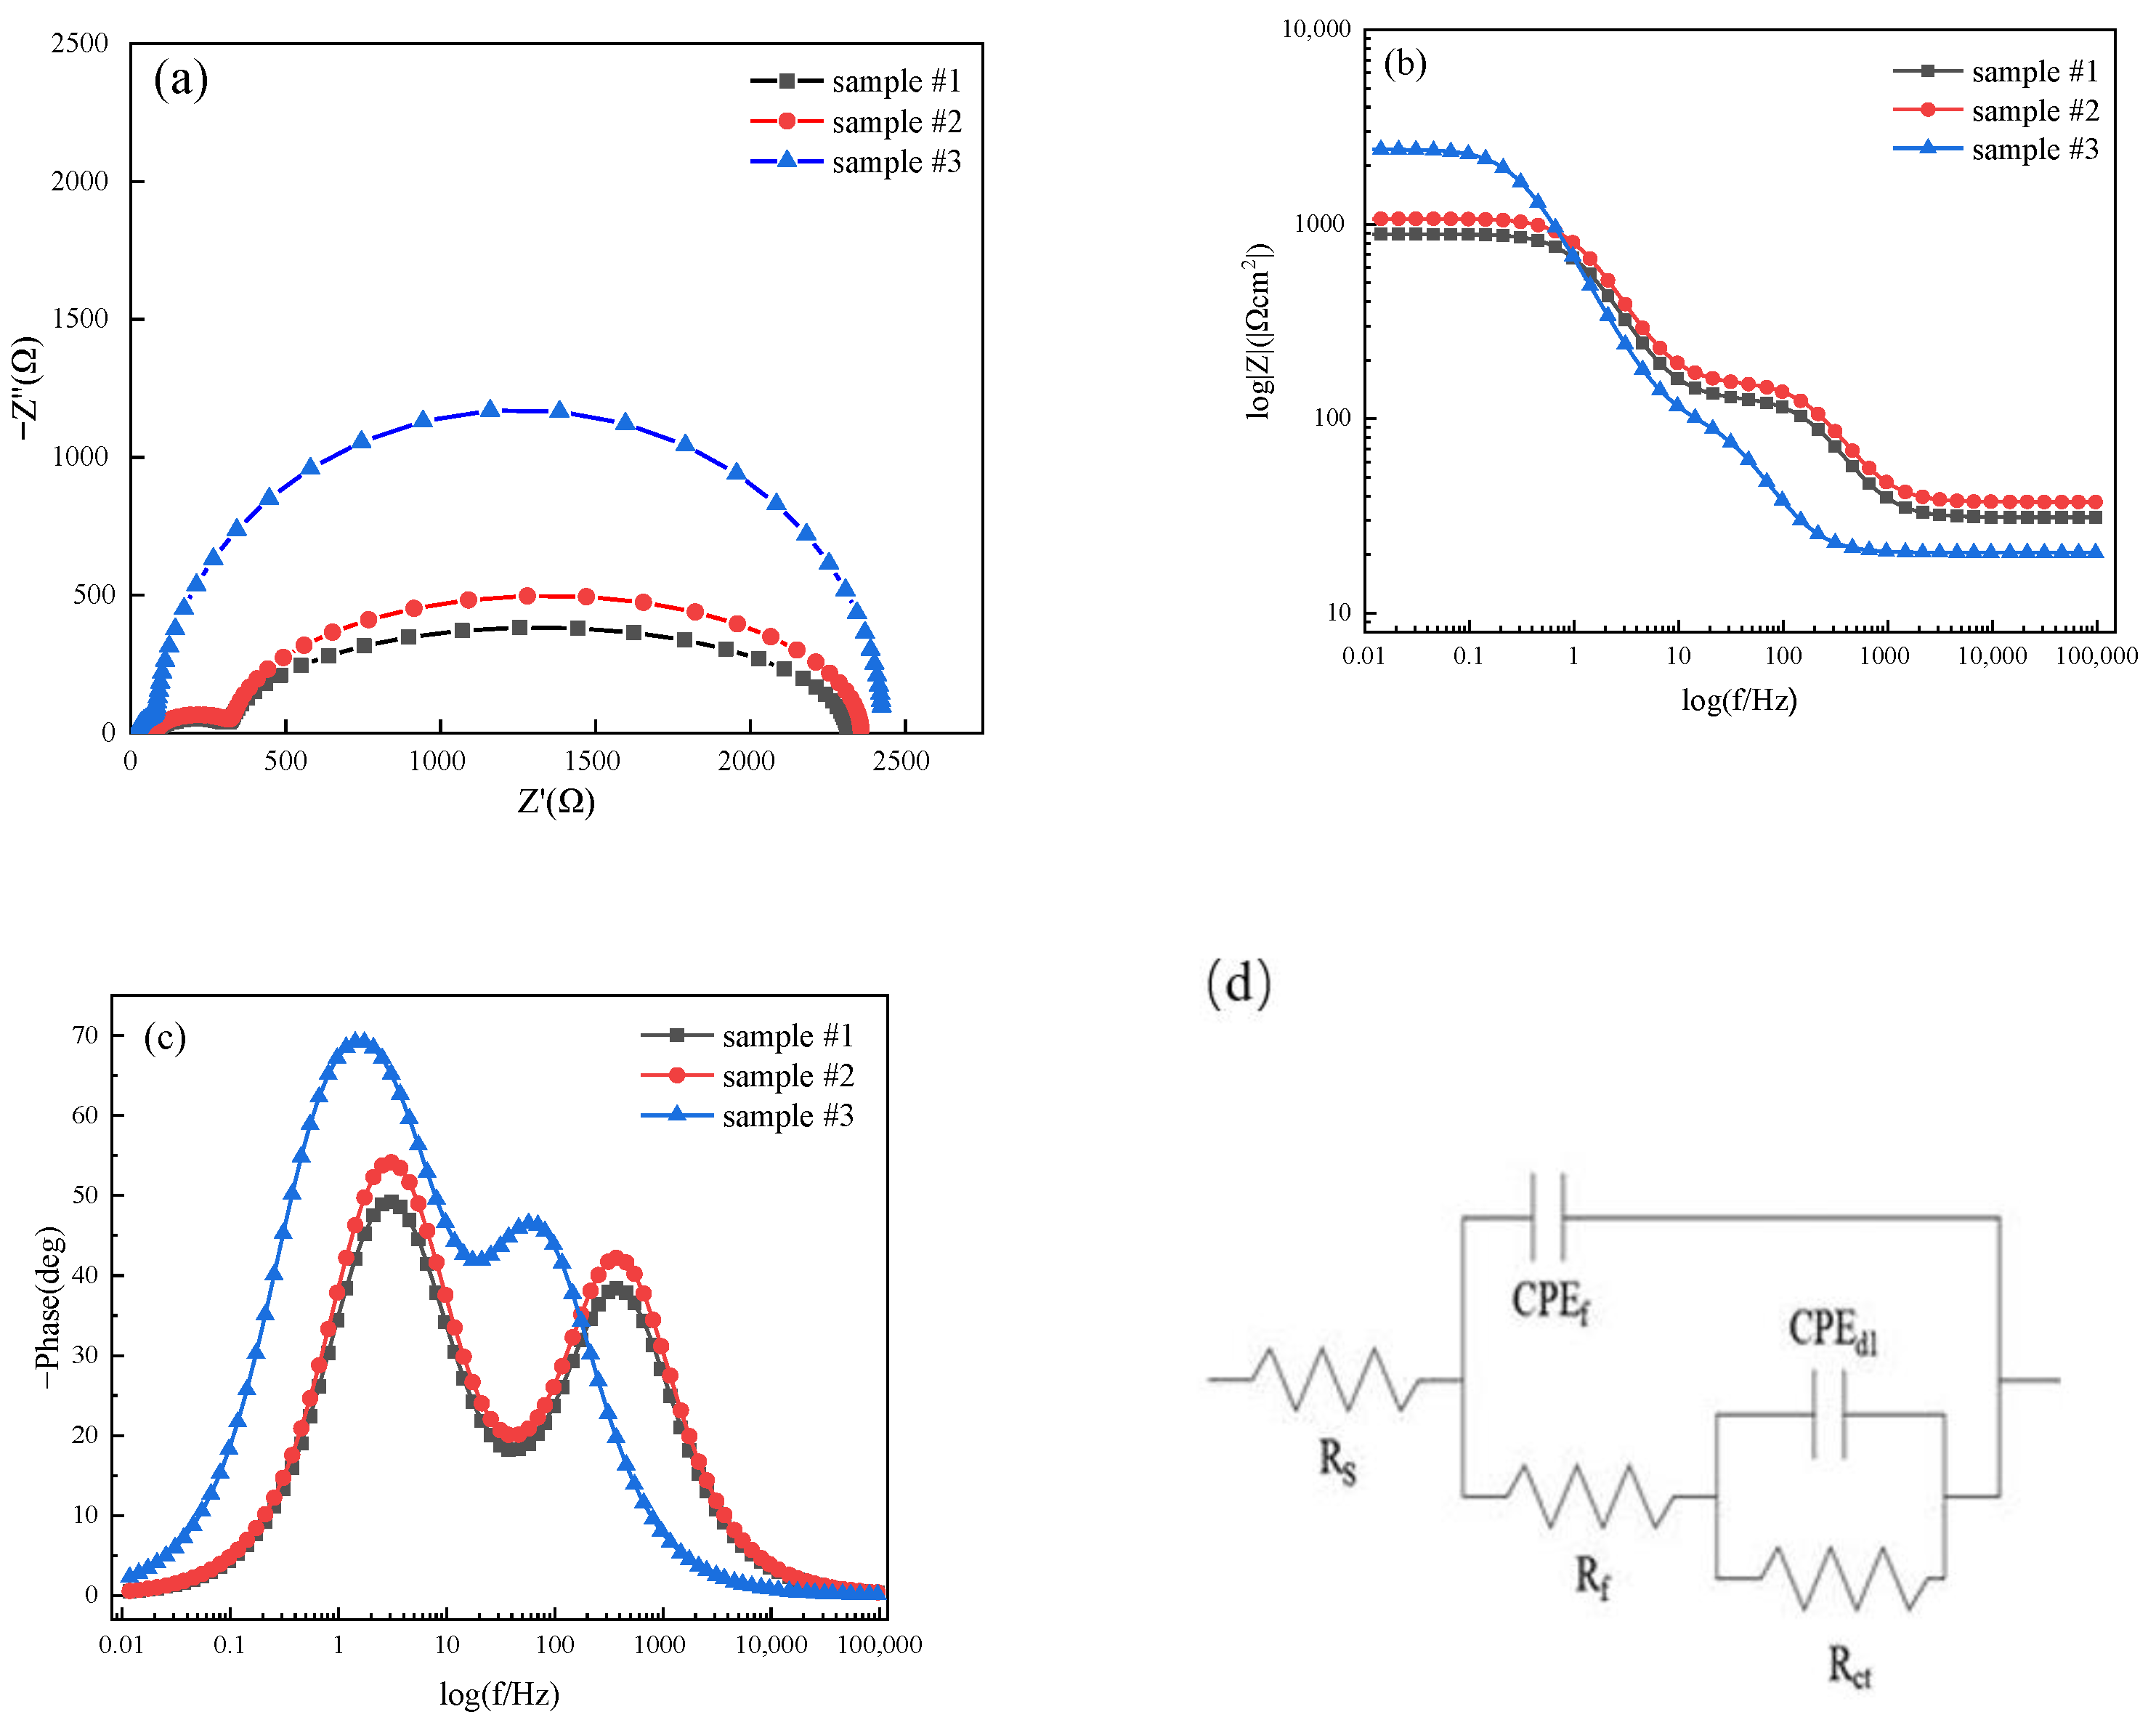
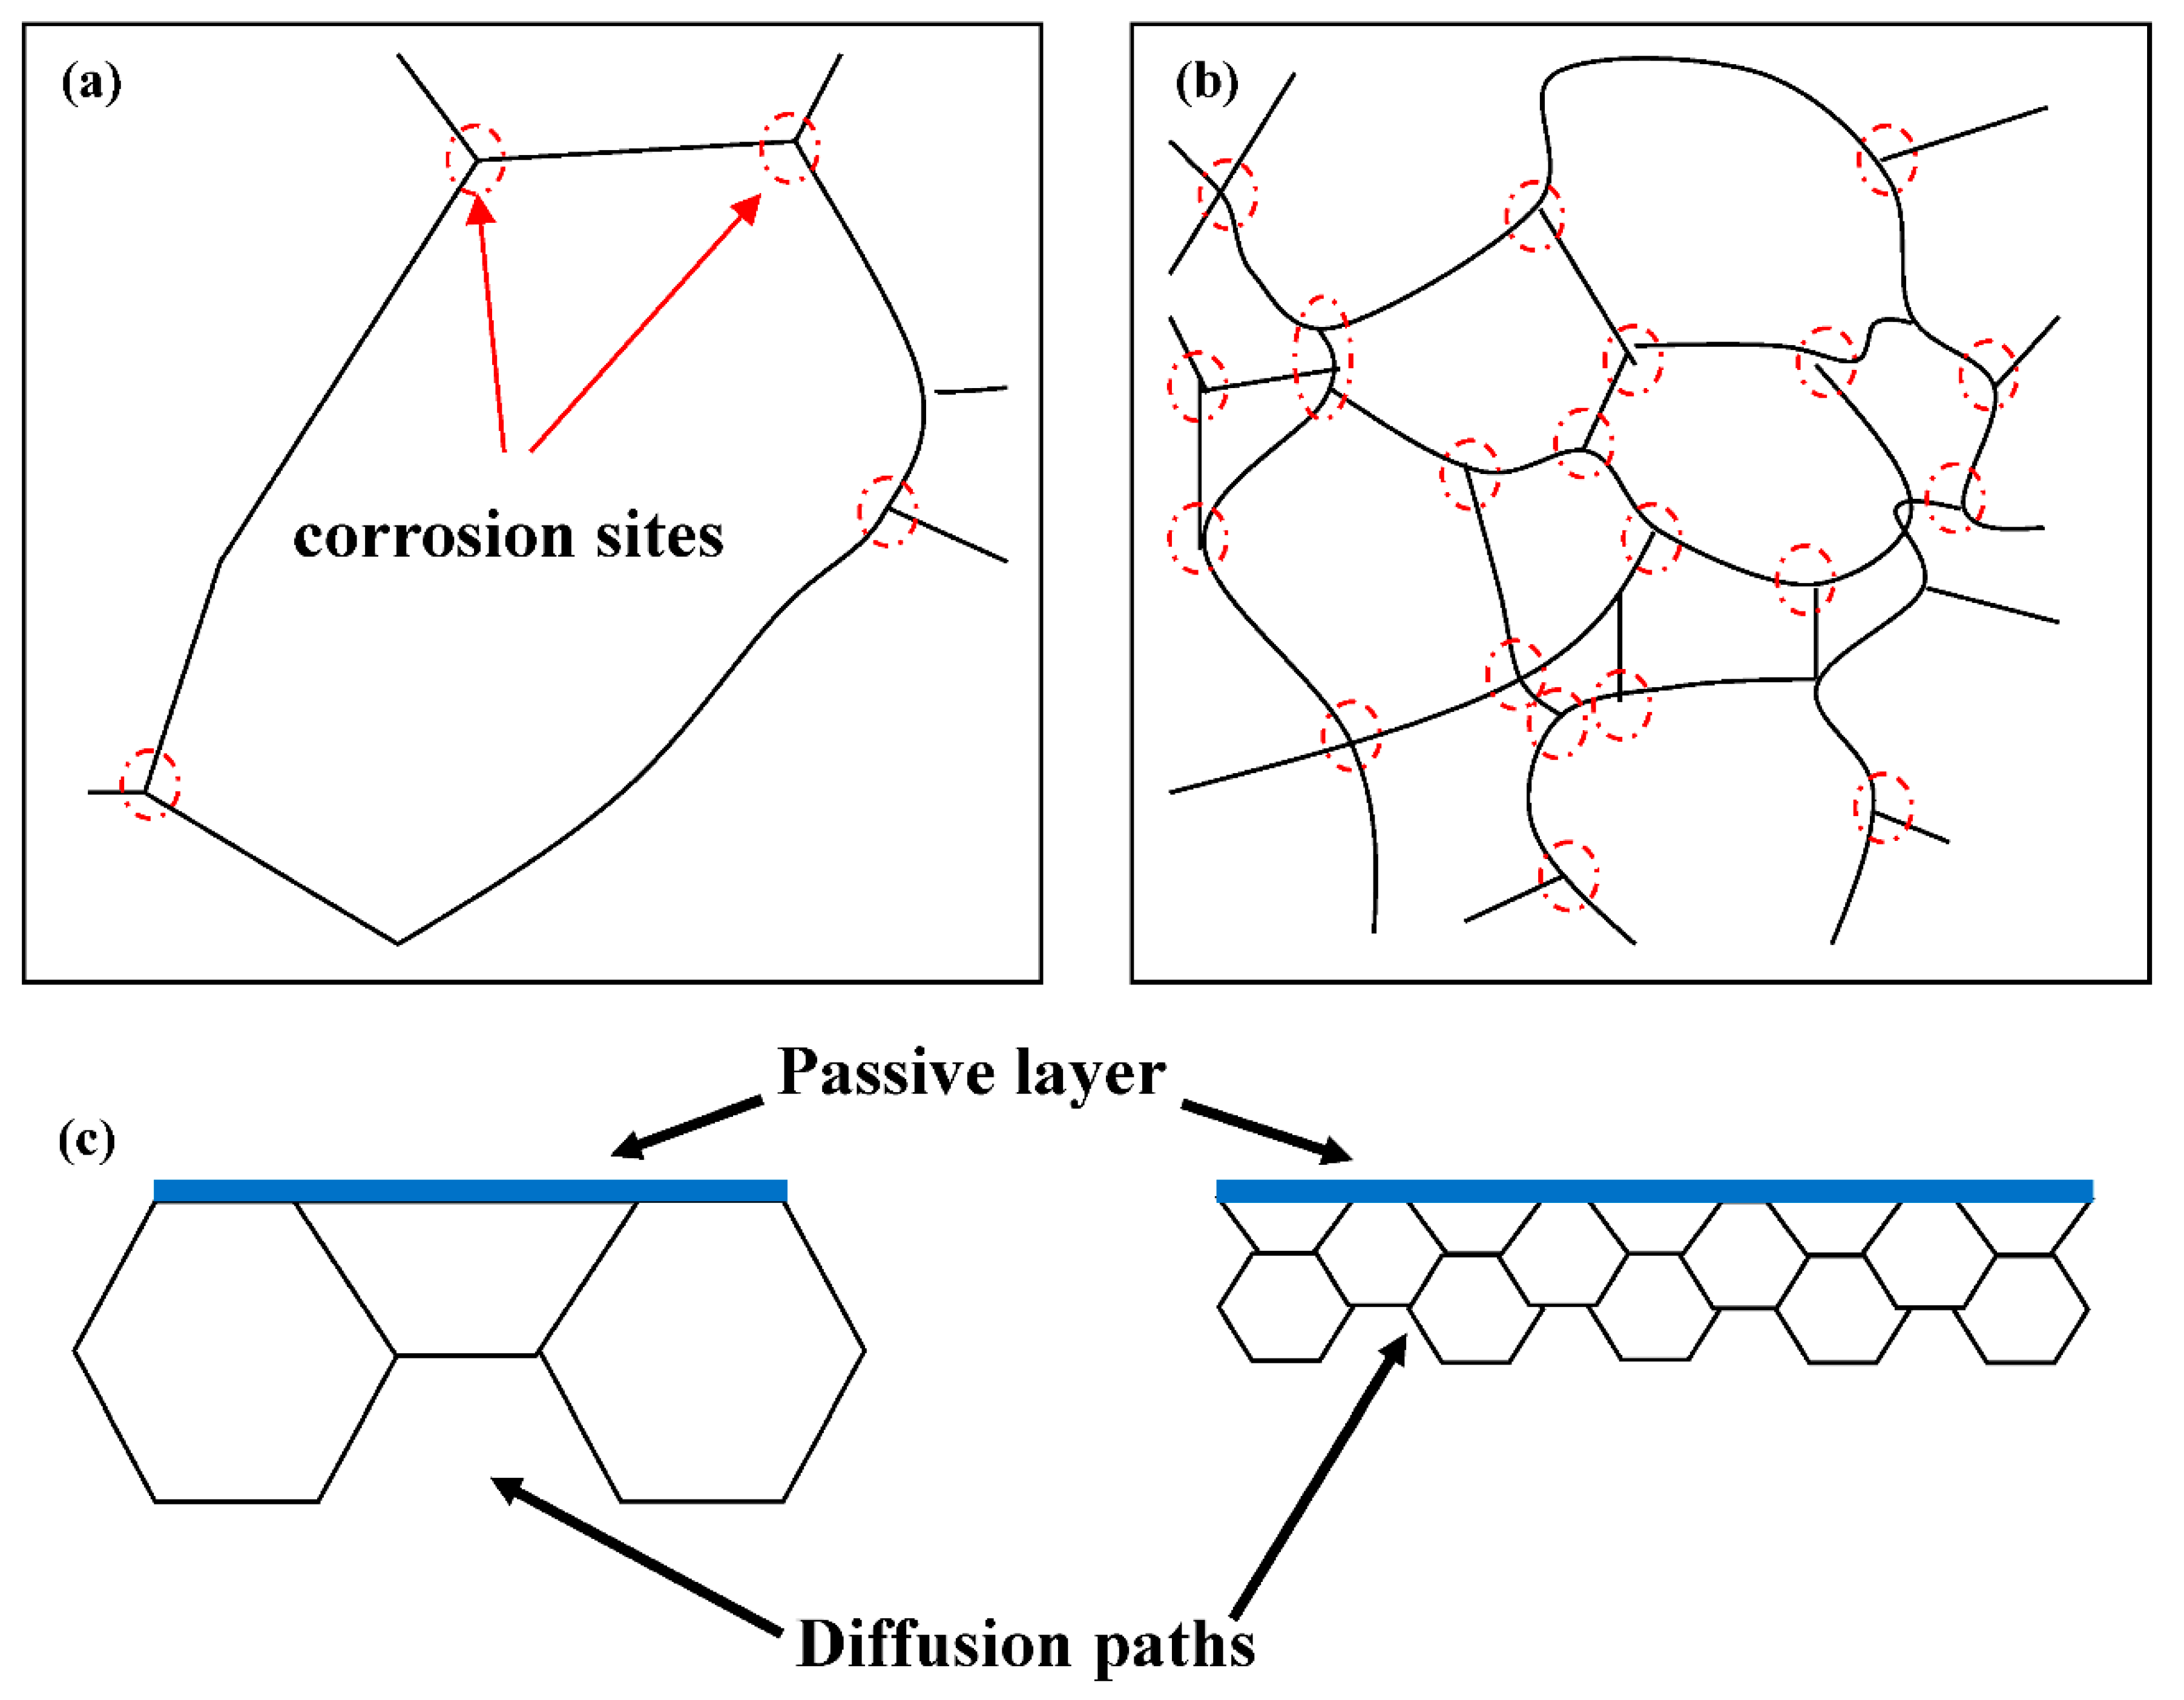
3.3. Corrosion Resistance
4. Conclusions
- (1)
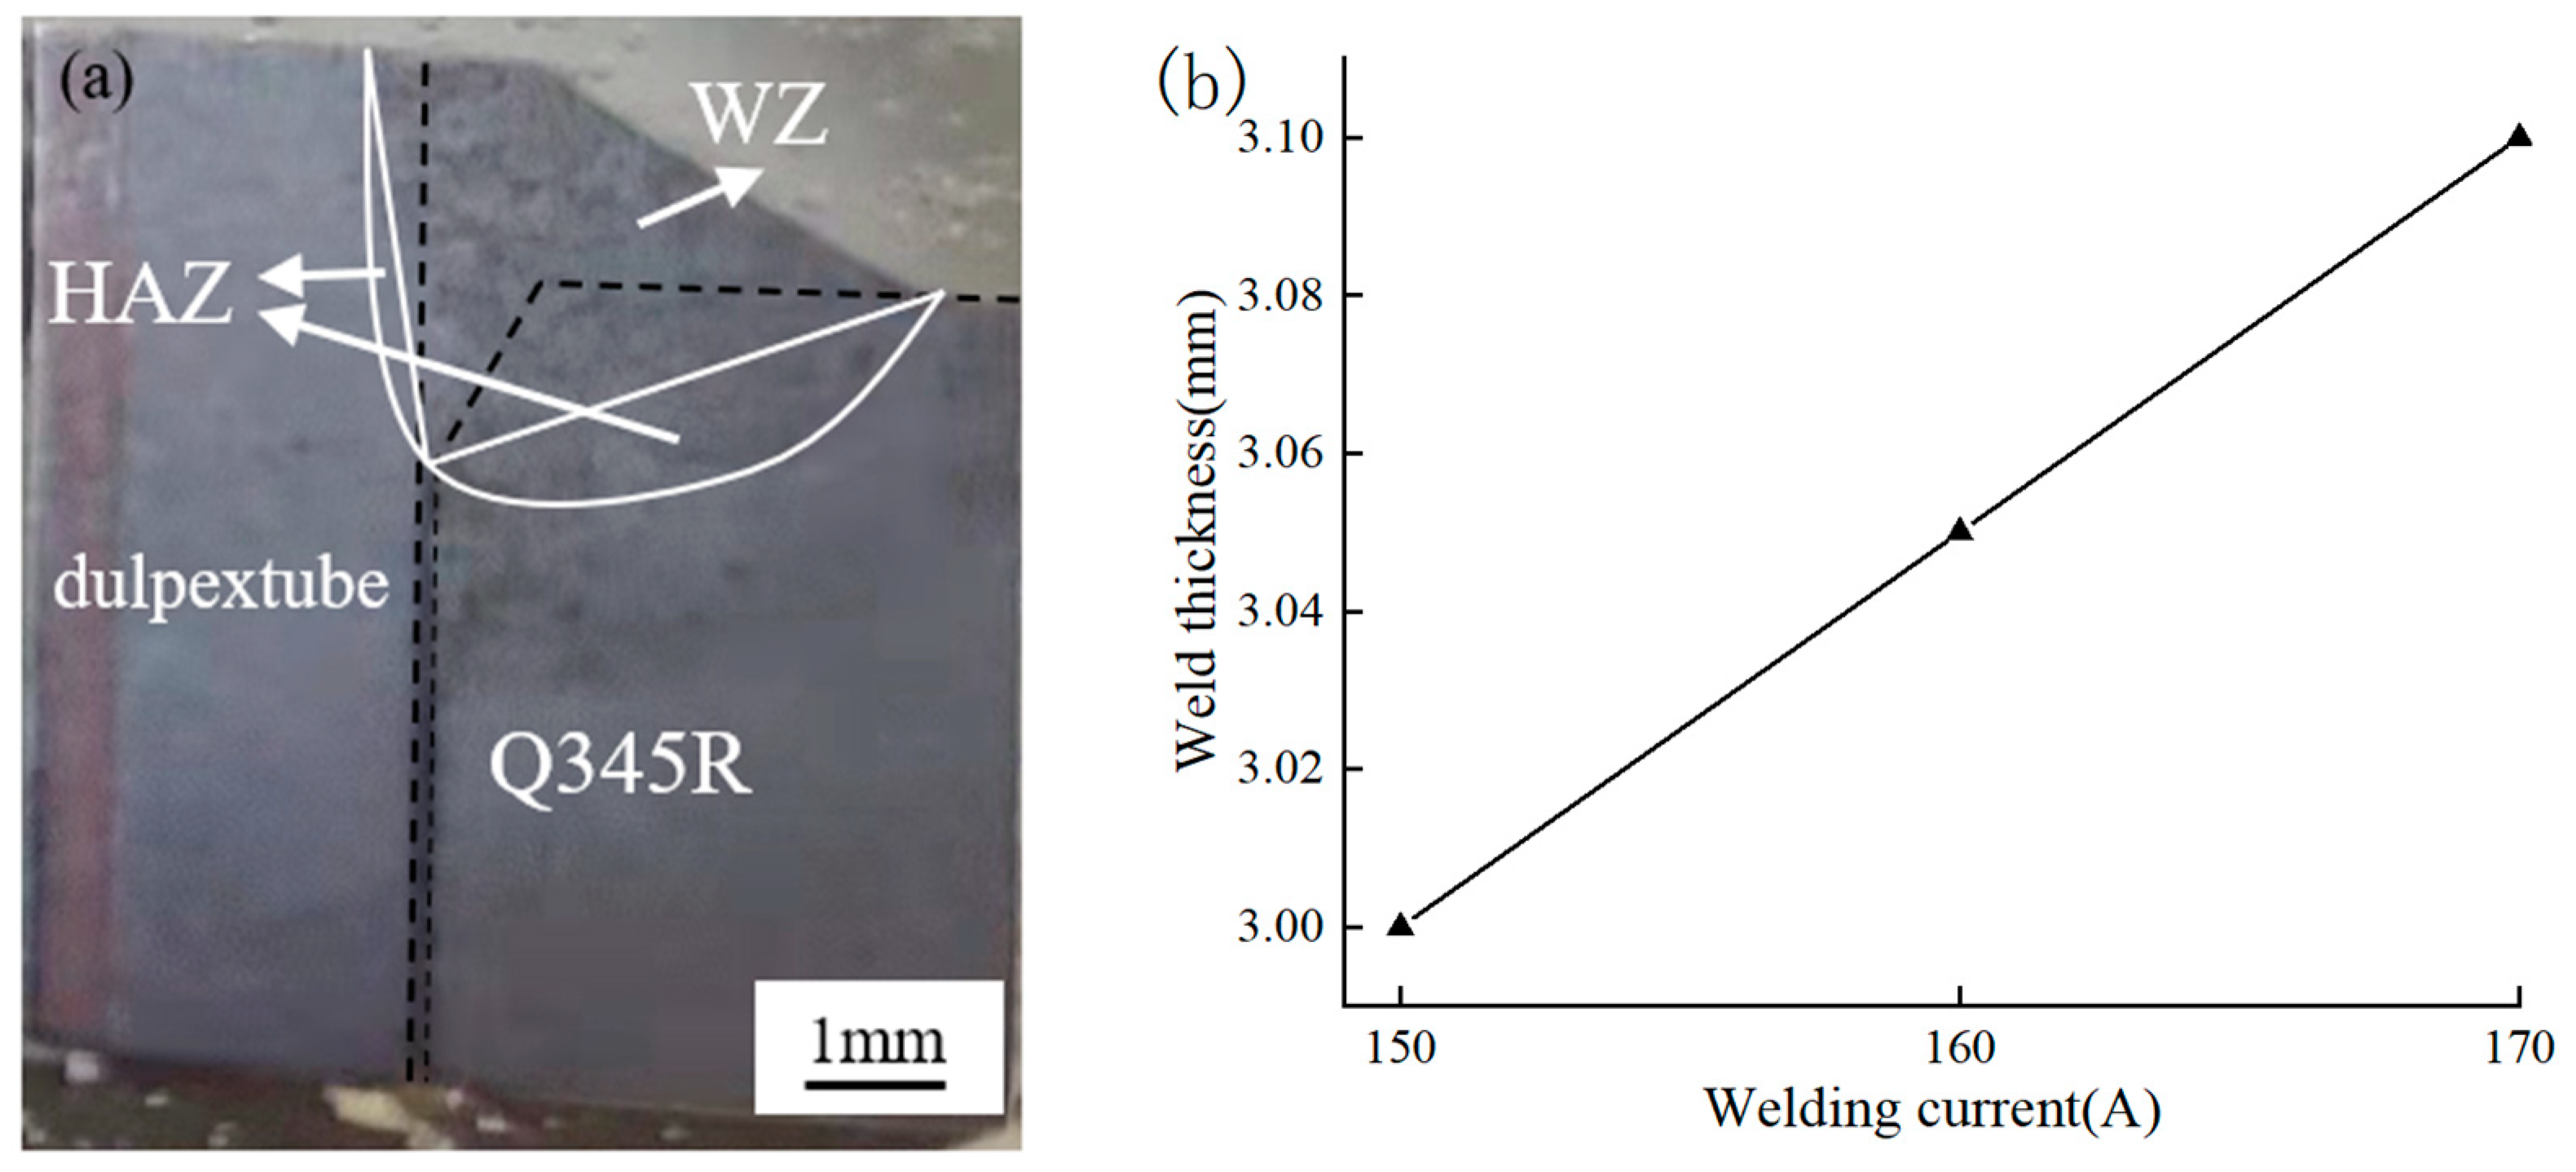
- When the welding current is 150 A, 160 A, 170 A, the voltage is 14 V and the welding speed is 2 mm/s, the welded joints without obvious cracks and pores can be obtained, and the weld width increases slightly with the increase of welding current.
- (2)
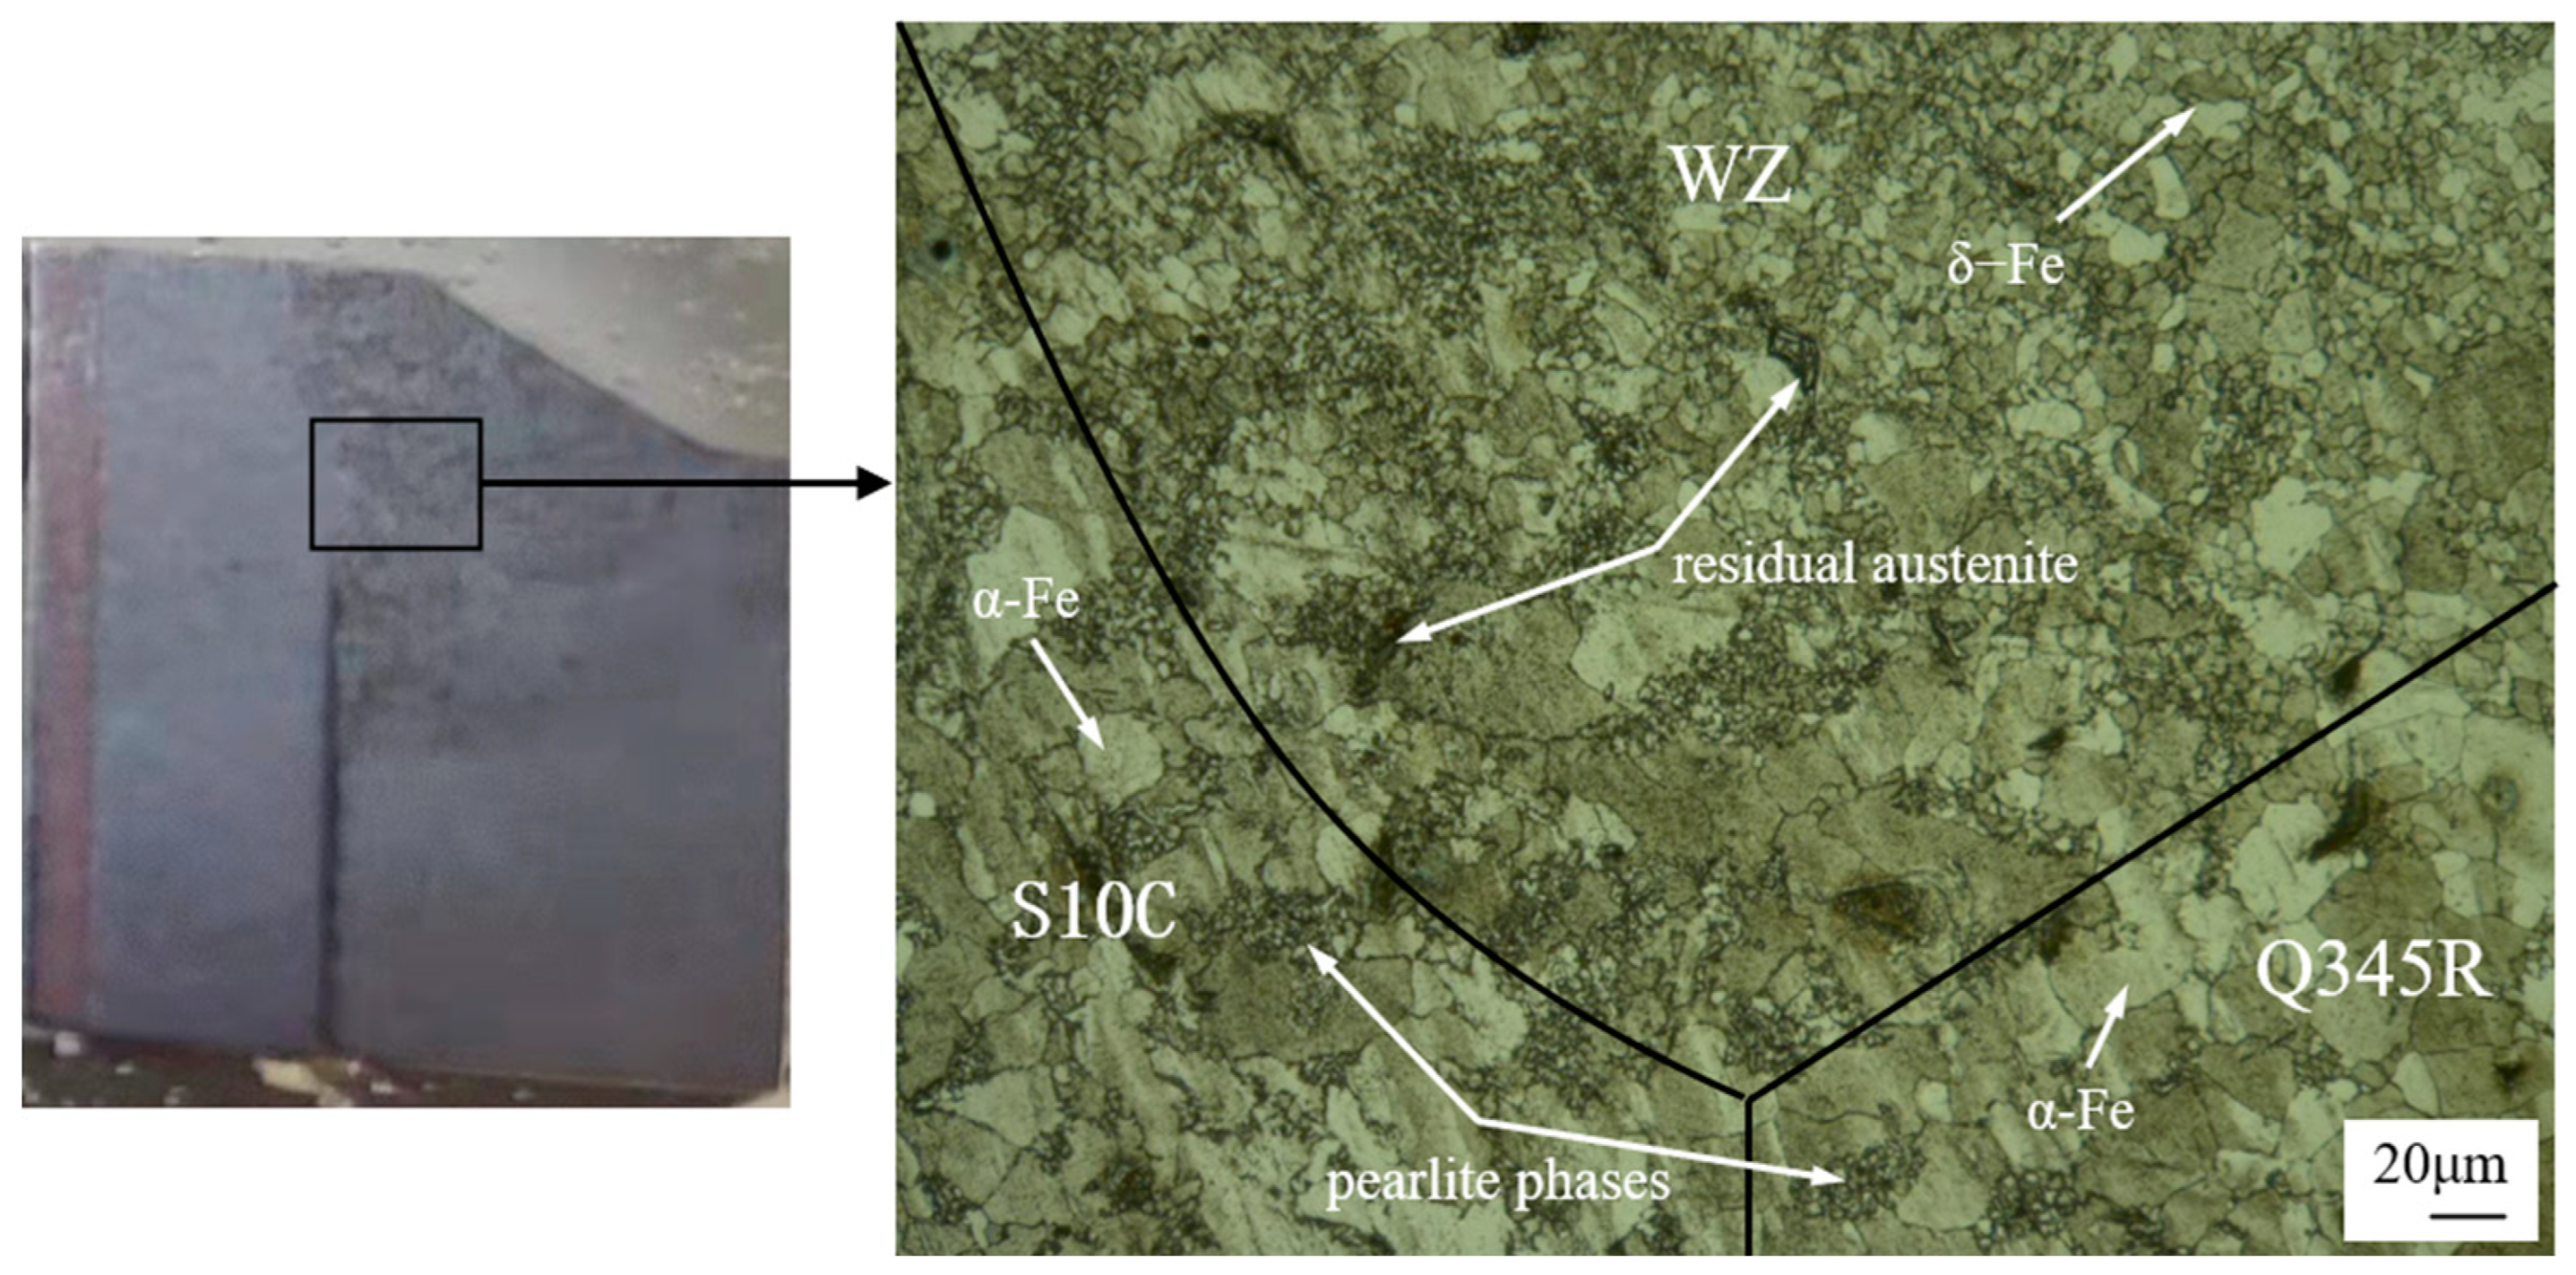
- The input heat influenced the balance of ferrite and austenite, which could further the performance of the weld joints. The phases of the weld zone are composed of −Fe and residual austenite phases. The weld joint has better grain refinement than the parent material, and the grain size of the weld joint increases with the increase of the welding current.
- (3)
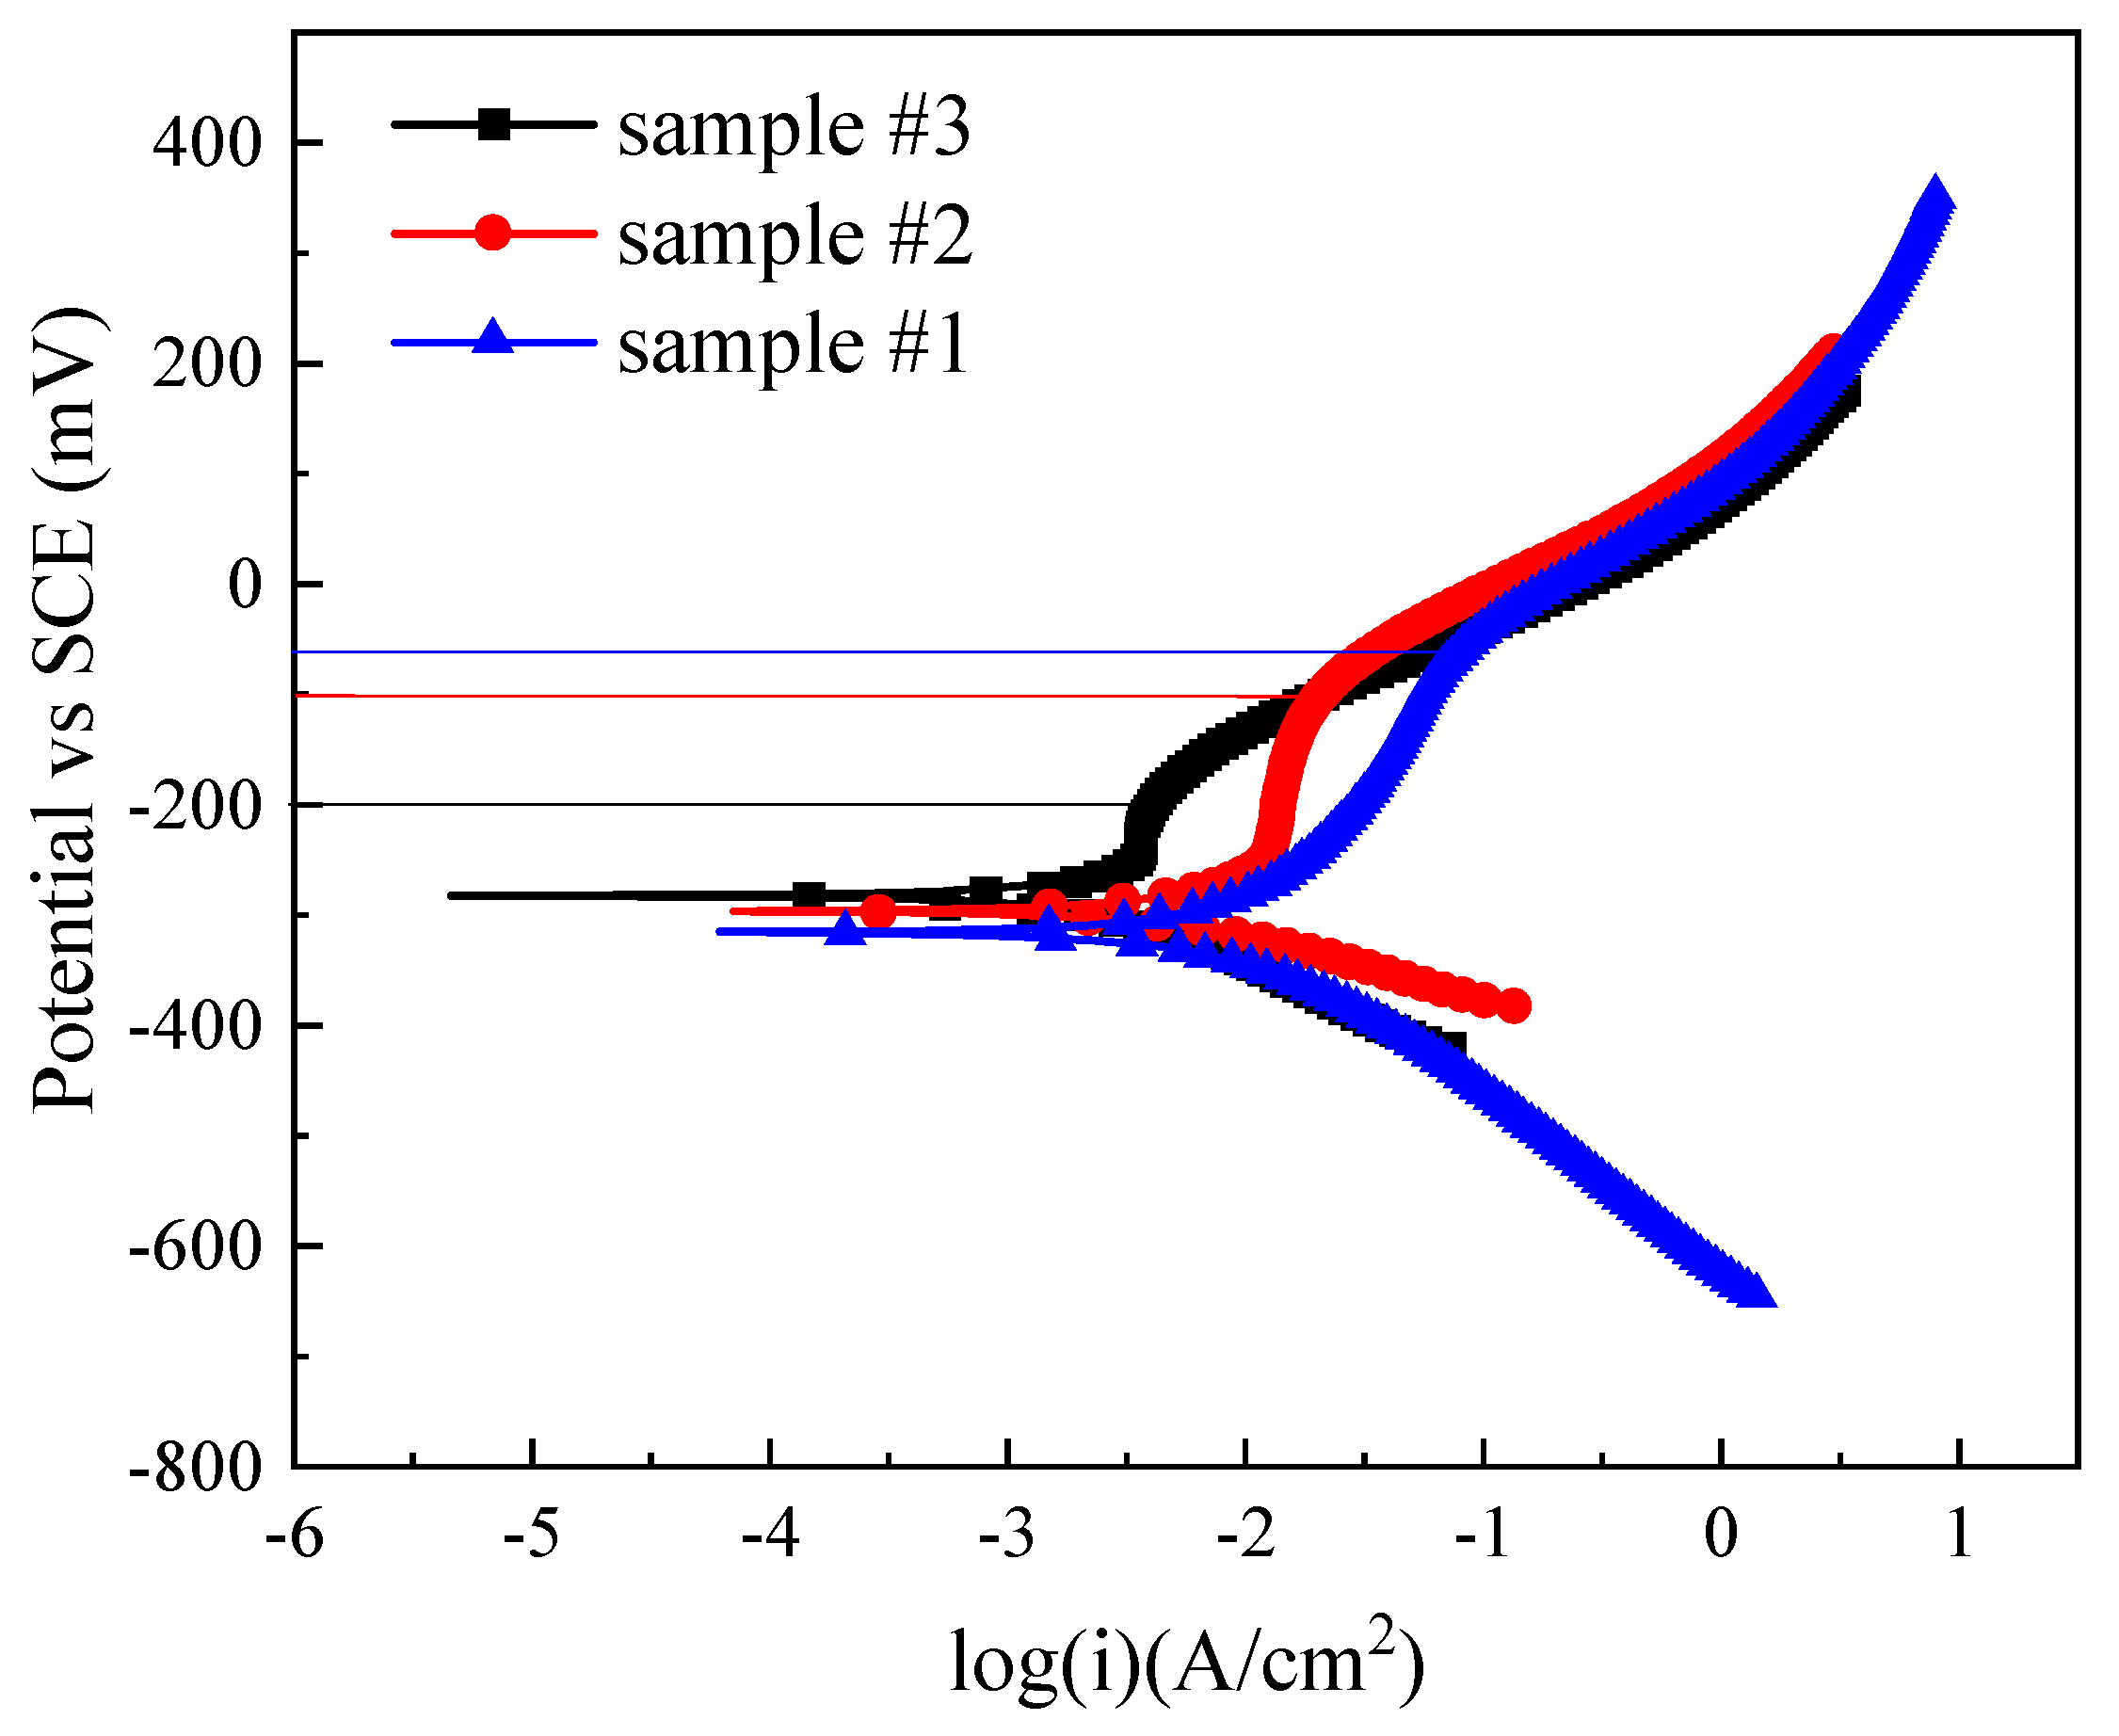
- Welding current has significant influence on the corrosion resistance of welded joints in 3.5 wt.% NaCl solution. The corrosion resistance of sample #3 welded with the highest welding current of 170A was better than that of samples #1 and #2. However, the pitting corrosion potential values of sample #1, #2, and #3 are −62 mV, −101 mV, and −200 mV, respectively. The pitting corrosion resistance of sample #1 with the lowest welding current of 150A is better than that of samples #2 and #3. The residual stress in the samples will be further investigated in future.
Author Contributions
Funding
Data Availability Statement
Acknowledgments
Conflicts of Interest
References
- Ou, G.F.; Zhu, Z.C.; Yang, J.; Wang, L.Q. Corrosion mechanism for hydrogenation system effluent air coolers. J. Chin. Soc. Corros. Prot. 2005, 1, 62–65. [Google Scholar]
- Ou, G.F.; Xu, X.F.; Lu, W.C.; Jin, H.Z.; Zhang, L. Numerical simulation of flow parameter distribution characteristics in inlet pipes of high pressure air-coolers. Acta Pet. Sinica 2019, 35, 111–118. [Google Scholar]
- Lv, Y.R. Analysis on failure of high-pressure air cooler for residue hydrodesulfurization unit. Press. Vessel Technol. 2008, 7, 32–37. [Google Scholar]
- Liu, X.F.; Duan, A.Q.; Quan, J.Q.; Jin, H.Z.; Wang, C. A study on the corrosion failure induced by the ammonium chloride deposition in a high-pressure air cooler system. Eng. Fail. Anal. 2020, 112, 104529. [Google Scholar] [CrossRef]
- Ardali, A.M.; Lotfi, B. Failure analysis of secondary reformer burner nozzles made from Incoloy 825 in an ammonia production plant. Eng. Fail. Anal. 2020, 118, 104860. [Google Scholar] [CrossRef]
- Sayyar, N.; Shamanian, M.; Niroumand, B. Arc weldability of Incoloy 825 to AISI 321 stainless steel welds. J. Mater. Process. Technol. 2018, 262, 562–570. [Google Scholar] [CrossRef]
- Lv, S.X.; Wang, T.; Feng, J.C. Microstructure and mechanical properties of TIG welded 20G/316L clad pipe joint. Trans. China Weld. Inst. 2009, 30, 93–96. [Google Scholar]
- Lu, X.F.; Zheng, X. Optimization of drawing parameters for 20/316L bimetal-lined pipe based on FEM simulation. Chin. J. Nonferrous Met. 2011, 21, 205–213. [Google Scholar]
- Xue, X.J. Study on corrosion resistance of clad steel pipe made of explosive welded clad steel plate. Press. Vessel Technol. 2021, 38, 68–74. [Google Scholar]
- Shui, Z.W.; Yang, Y.; Yang, X.; Xiao, J.A.; Li, S.R. Analysis of microstructure and properties of welded joint of L245NCS/316L bimetal pipe. Mater. Rep. 2016, 30, 499–503. [Google Scholar]
- Zhang, N.; Wang, W.X.; Cao, X.Q.; Wu, J.Q. The effect of annealing on the interface microstructure and mechanical characteristics of AZ31B/AA6061 composite plates fabricated by explosive welding. Mater. Des. 2015, 65, 1100–1109. [Google Scholar] [CrossRef]
- Maurya, A.K.; Pandey, C.; Chhibber, R. Dissimilar welding of duplex stainless steel with Ni alloys: A review. Int. J. Pres. Vessel. Pip. 2021, 192, 104439. [Google Scholar] [CrossRef]
- Kumar, S.; Yadav, V.K.; Sharma, S.K.; Pandey, C.; Goyal, A.; Kumar, P. Role of dissimilar Ni-based ERNiCrMo-3 filler on the microstructure, mechanical properties and weld induced residual stresses of the ferritic/martensitic P91 steel welds joint. Int. J. Pres. Vessel. Pip. 2021, 193, 104443. [Google Scholar] [CrossRef]
- Jafarzadegan, M.; Taghiabadi, R.; Mofid, M.A. Using double ellipsoid heat source model for prediction of HAZ grain growth in GTAW of stainless steel 304. Mater. Today Commun. 2022, 31, 103411. [Google Scholar] [CrossRef]
- Baghjari, S.H.; Akbari Mousavi, S.A.A. Effects of pulsed Nd:YAG laser welding parameters and subsequent post-weld heat treatment on microstructure and hardness of AISI 420 stainless steel. Mater. Des. 2013, 43, 1–9. [Google Scholar] [CrossRef]
- Cristobal, M.; San-Martin, D.; Capdevila, C.; Jiménez, J.A. Rapid fabrication and characterization of AISI 304 stainless steels modified with Cu additions by additive alloy melting (ADAM). J. Mater. Res. Technol. 2018, 7, 450–460. [Google Scholar] [CrossRef]
- Abioye, T.E.; Ariwoola, O.E.; Ogedengbe, T.I.; Farayibi, P.K.; Gbadeyan, O.O. Effects of welding speed on the microstructure and corrosion behavior of dissimilar gas metal arc weld joints of AISI 304 stainless steel and low carbon steel. Mater. Today: Proc. 2019, 17, 871–877. [Google Scholar] [CrossRef]
- Abioye, T.E. Electrochemical corrosion study of Inconel 625 laser coatings by wire and powder feedstock. Int. J. Mater. Eng. Innov. 2017, 8, 173. [Google Scholar] [CrossRef]
- Huang, Y.Q.; Huang, J.K.; Zhang, J.X.; Yu, X.Q.; Li, Q.; Wang, Z.; Fan, D. Microstructure and corrosion characterization of weld metal in stainless steel and low carbon steel joint under different heat input. Mater. Today Commun. 2021, 29, 102948. [Google Scholar] [CrossRef]
- Huang, B.S.; Chen, Q.; Zhao, X.; Zhang, R.F.; Zhu, Y. Microstructure, properties and corrosion characterization of welded joint for composite pipe using a novel welding process. Trans. Indian Inst. Met. 2018, 71, 2933–2944. [Google Scholar] [CrossRef]
- Zhang, H.; Wang, D.; Xue, P.; Wu, L.H.; Ni, D.R.; Ma, Z.Y. Microstructural evolution and pitting corrosion behavior of friction stir welded joint of high nitrogen stainless steel. Mater. Des. 2016, 110, 802–810. [Google Scholar] [CrossRef]


| Element | Fe | C | Cr | Ni | Mn | Si | P | S | Mo |
|---|---|---|---|---|---|---|---|---|---|
| S10C | 99.188 | 0.09 | 0.03 | 0.01 | 0.44 | 0.22 | 0.014 | 0.007 | 0.001 |
| Q345R | 97.842 | 0.19 | 0.02 | 0.01 | 1.51 | 0.41 | 0.012 | 0.003 | 0.003 |
| ER50-6 | 97.411 | 0.078 | 0.025 | 0.019 | 1.55 | 0.87 | 0.025 | 0.012 | 0.01 |
| Parameters | Current (A) | Weld Heat Input (kJ/mm) |
|---|---|---|
| #1 | 150 | 0.788 |
| #2 | 160 | 0.840 |
| #3 | 170 | 0.893 |
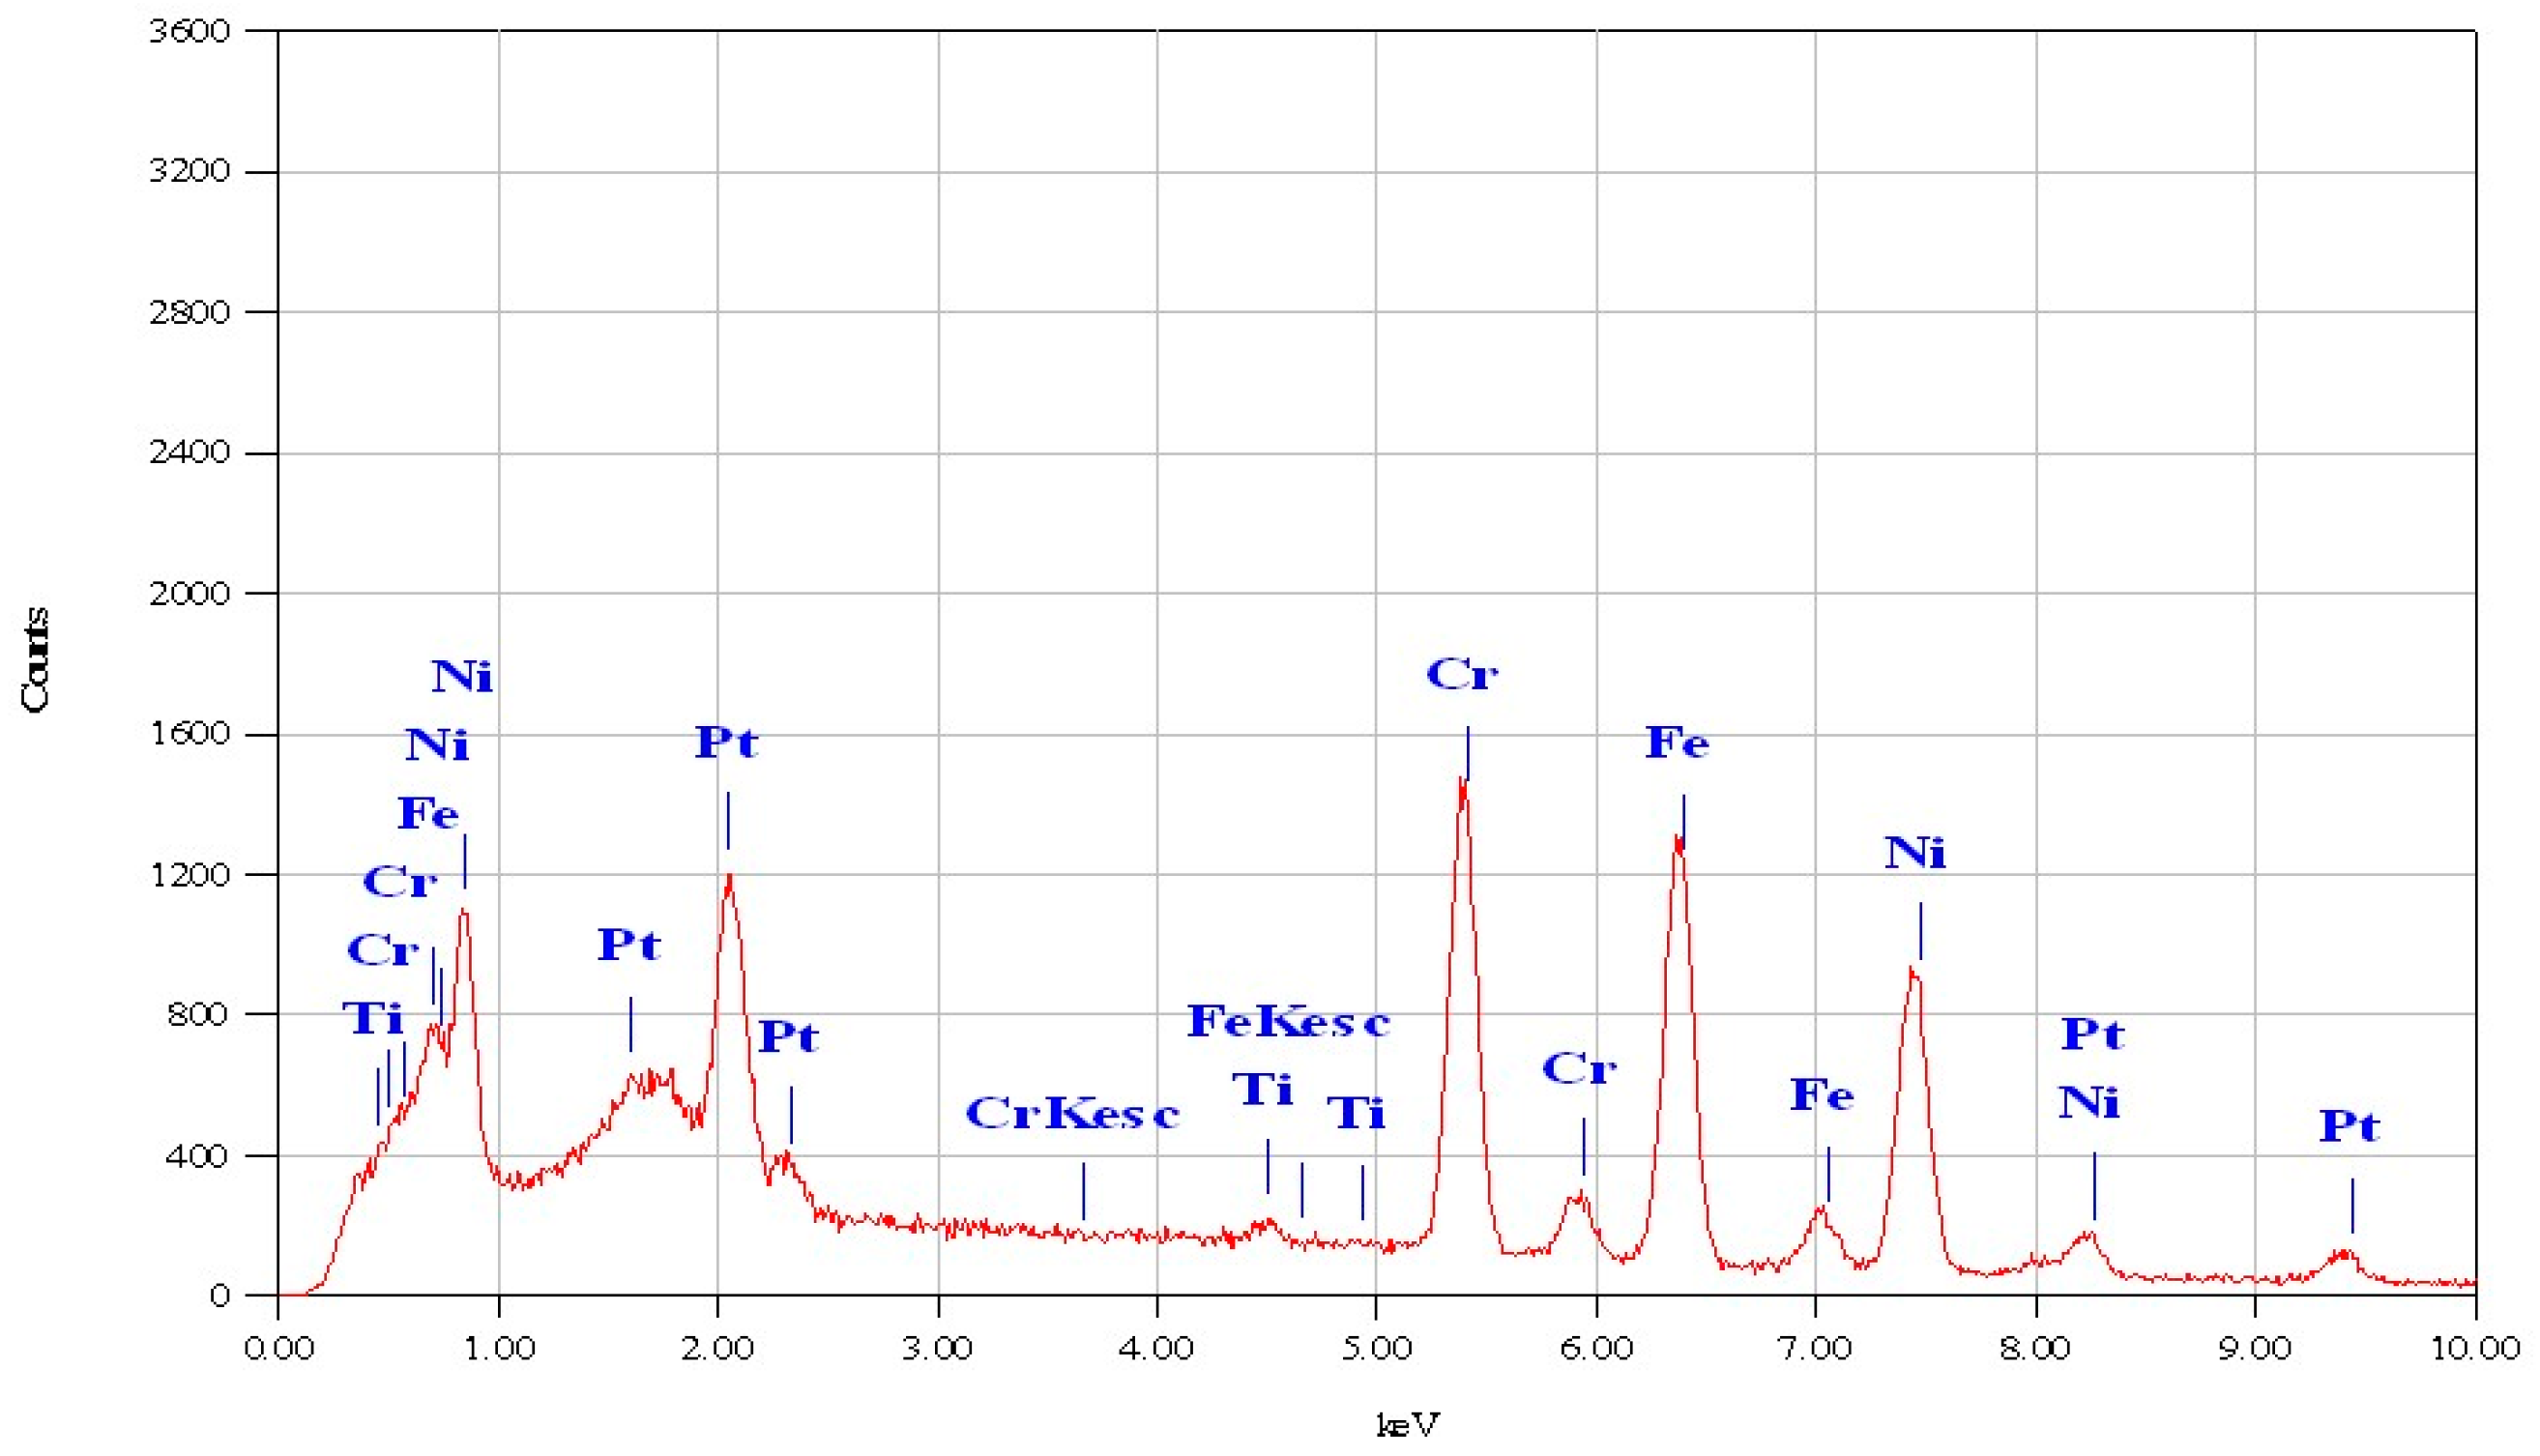
| Element | Mass % | Error % | At % |
|---|---|---|---|
| Ti | 0.73 | 0.3 | 0.85 |
| Cr | 23 | 0.48 | 24.76 |
| Fe | 34.96 | 0.68 | 35.03 |
| Ni | 41.3 | 1.23 | 39.36 |
| Total | 100 | 100 |
| Sample | Ecorr (mV) | Icorr (mA/cm2) | Rp (Ω/cm2) | CR (mm/a) |
|---|---|---|---|---|
| #1 | −307 | 0.093 | 28.36 | 1.47 |
| #2 | −297 | 0.065 | 42.61 | 1.02 |
| #3 | −286 | 0.041 | 54.87 | 0.64 |
| Heat input of 95J/cm * | −339 | 0.00571 | / | / |
| Heat input of 80J/cm * | −773 | 0.0132 | / | / |
| Heat input of 66J/cm * | −412 | 0.0115 | / | / |
| Sample | #1 | #2 | #3 |
|---|---|---|---|
| Rs (Ω·cm2) | 31.09 | 26.73 | 20.49 |
| CPEf (F·cm2) | 8.48 × 10⁻⁶ | 9.59 × 10⁻⁵ | 5.66 × 10⁻⁵ |
| Rf (Ω·cm2) | 101.7 | 104.7 | 106.4 |
| CPEd (F·cm2) | 1.81 × 10⁻⁴ | 1.83 × 10⁻⁴ | 1.86 × 10⁻⁴ |
| Rct (Ω·cm2) | 756.7 | 593.6 | 230.1 |
Publisher’s Note: MDPI stays neutral with regard to jurisdictional claims in published maps and institutional affiliations. |
© 2022 by the authors. Licensee MDPI, Basel, Switzerland. This article is an open access article distributed under the terms and conditions of the Creative Commons Attribution (CC BY) license (https://creativecommons.org/licenses/by/4.0/).
Share and Cite
Ou, G.; Qian, G.; Jin, H.; Wu, W.; Li, Q. Microstructure and Corrosion Resistance of Fusion Welding Zone for Duplextubes Welded with Q345R Tube Sheet under Different Welding Currents. Metals 2022, 12, 705. https://doi.org/10.3390/met12050705
Ou G, Qian G, Jin H, Wu W, Li Q. Microstructure and Corrosion Resistance of Fusion Welding Zone for Duplextubes Welded with Q345R Tube Sheet under Different Welding Currents. Metals. 2022; 12(5):705. https://doi.org/10.3390/met12050705
Chicago/Turabian StyleOu, Guofu, Guangwei Qian, Haozhe Jin, Wangping Wu, and Qianqian Li. 2022. "Microstructure and Corrosion Resistance of Fusion Welding Zone for Duplextubes Welded with Q345R Tube Sheet under Different Welding Currents" Metals 12, no. 5: 705. https://doi.org/10.3390/met12050705
APA StyleOu, G., Qian, G., Jin, H., Wu, W., & Li, Q. (2022). Microstructure and Corrosion Resistance of Fusion Welding Zone for Duplextubes Welded with Q345R Tube Sheet under Different Welding Currents. Metals, 12(5), 705. https://doi.org/10.3390/met12050705