Article

Constitutive Modeling on the Ti-6Al-4V Alloy during Air Cooling and Application

1
State Key Laboratory of Solidification Processing, Northwestern Polytechnical University, Xi’an 710072, China
2
School of Mechanical Engineering, Northwestern Polytechnical University, Xi’an 710072, China
3
Chongqing Innovation Center, Northwestern Polytechnical University, Chongqing 401135, China
*
Authors to whom correspondence should be addressed.
Metals 2022, 12(3), 513; https://doi.org/10.3390/met12030513
Submission received: 24 January 2022 / Revised: 11 March 2022 / Accepted: 14 March 2022 / Published: 17 March 2022
(This article belongs to the Special Issue Innovative and Flexible Sheet Forming Technologies)

Abstract

:
The flow behavior of a Ti-6Al-4V alloy has been investigated and modeled, with the aim of exploring the damage mechanism and distortion of a sandwich structure during the air cooling process after superplastic forming (SPF). The selected temperature range was 930–700 °C, and the strain rates were 10−2, 10−3, and 10−4/s. An Arrhenius model was employed to describe the yield stress at a strain of 0.1, and a simple generalized reduced gradient refinement was applied to optimize the parameters for a constitutive model. The mean error between the predicted and experimental flow stress was 65% and 16% before and after parameter optimization, respectively. The effects of strain on flow stress showed a linear relationship, so a strain compensation method was proposed. The modified Arrhenius model developed in this paper provided a good agreement between the predicted stresses and the experimental data. Finally, a finite element analysis (FEA) with a “UHARD” subroutine was employed, and the results indicated that the inner plate of the sandwich structure was the most vulnerable location during the air cooling process, and that the engineering strain due to a non-uniform temperature was calculated as 0.37%.

1. Introduction

Owing to its excellent comprehensive mechanical properties, Ti-6Al-4V has been successfully applied in aerospace, petrochemical, shipbuilding, automotive, pharmaceutical, and other industries [1]. For parts with complex structures, superplastic forming/diffusion bonding (SPF/DB) is currently a common method [2]. However, during the SPF process, local wrinkles can appear in the parts, which seriously affects the forming quality. To explore the reasons for this phenomenon, this work investigates the flow behavior of a titanium alloy during the air cooling process after SPF.
For Ti-6Al-4V alloy, the hexagonal close-packed structure α-phase (3 slip systems) is more difficult to deform than the body-centered cubic β-phase (12 slip systems). The phase content changes significantly with temperature according to the formula, f β = ( T / 1270 ) 10 , where f β and T are the fraction of β-phase and the temperature in Kelvin, respectively [3]. Research on superplastic forming has focused on the following: (i) accommodated mechanisms of grain boundary sliding [4]; (ii) constitutive modeling on flow behavior [5]; (iii) forming process optimization [6]. However, our knowledge of the flow behavior and microstructure evolution during cooling after SPF is lacking. First, a brief overview of the cooling process for titanium alloys will be given. Nursyifaulkhair et al. [7] proposed the effects of the cooling rate on the volume fraction of the α massive phase of a Ti-6Al-4V alloy fabricated by directed energy deposition (DED). Luo et al. [8] established a finite element model (FEM) to simulate the distribution and evolution of titanium forged parts influenced by the process of hot forging and air cooling. In our previous research [9], the cooling paths during the cooling process are the main factors that control material deformation. This especially applies to structurally complex parts, so it is important to focus on the deformation due to the stress field during the cooling process. However, there is a gap in our understanding of the deformation of structural components during air cooling.
Since cooling deformation is related to temperature and the strain rate, the superiority of the Arrhenius model is immediately obvious [10]. However, this model also has two obvious shortcomings: (i) the formula does not include strain-related variables; (ii) the errors caused by repeated linear fittings are relatively large. Bodunrin et al. [11] and Yang et al. [12] experimented with optimizing the parameters of the Arrhenius model with a simple generalized reduced gradient refinement and a genetic algorithm (GA), respectively. As for strain compensation, polynomial fitting and the Cingara equation [13] have been applied, where the essence of these methods is to characterize the hardening laws of the materials. Therefore, it is necessary to develop a simple form equation to predict the evolution of yield strength with strain.
The aim of this paper was to explore the deformation law during the air cooling process after superplastic forming by studying a typical sandwich SPF/DB structure. Firstly, the mechanical behavior of the Ti-6Al-4V alloy during the air cooling process after SPF was determined with high-temperature tensile tests. Secondly, a simple constitutive model was established based on hyperbolic-sine equations. Thirdly, we considered the effect of strain on flow behavior, and a modified constitutive model with strain compensation was devised. Finally, a FEM analysis was applied to the sandwich structure in Figure 1, focusing on the deformation due to a heterogeneous field of temperature. This three-layer hollow structure was fabricated by SPF/DB with two faceplates and one inner plate. The maximum dimensions for the model were 140 mm for the length and 5 mm for the height. A summary of the nomenclature used in this paper is shown in Table 1.

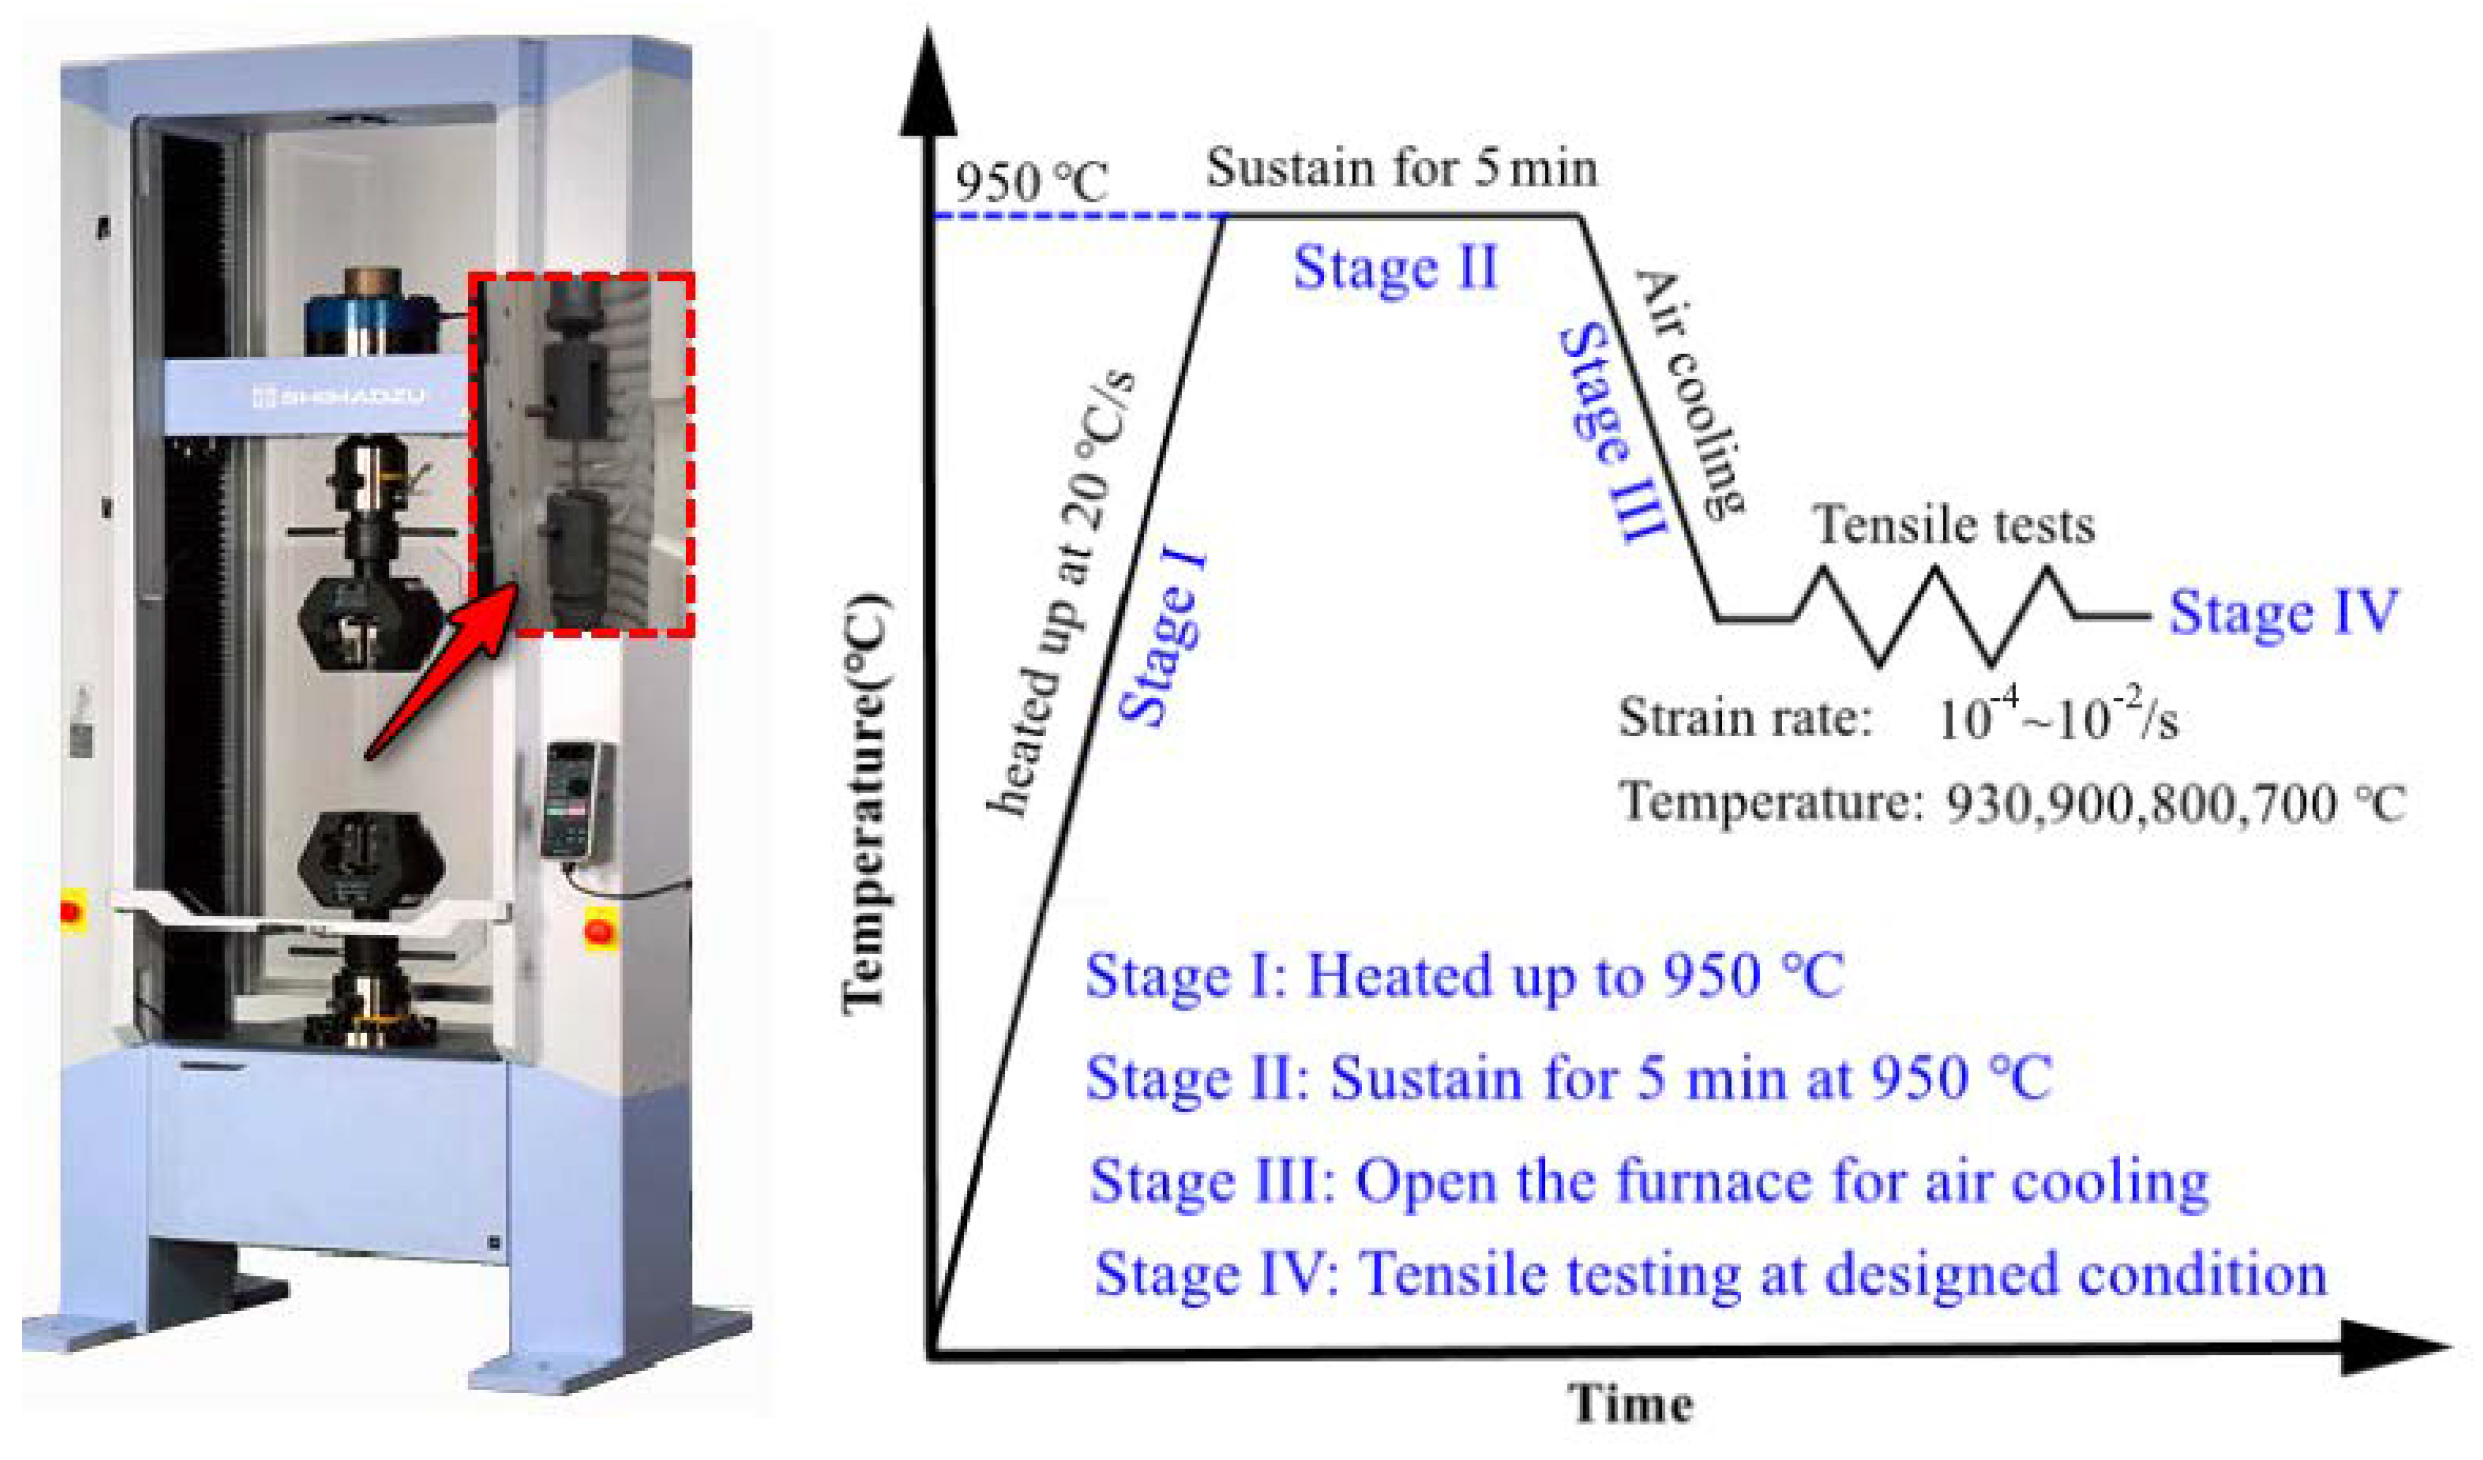
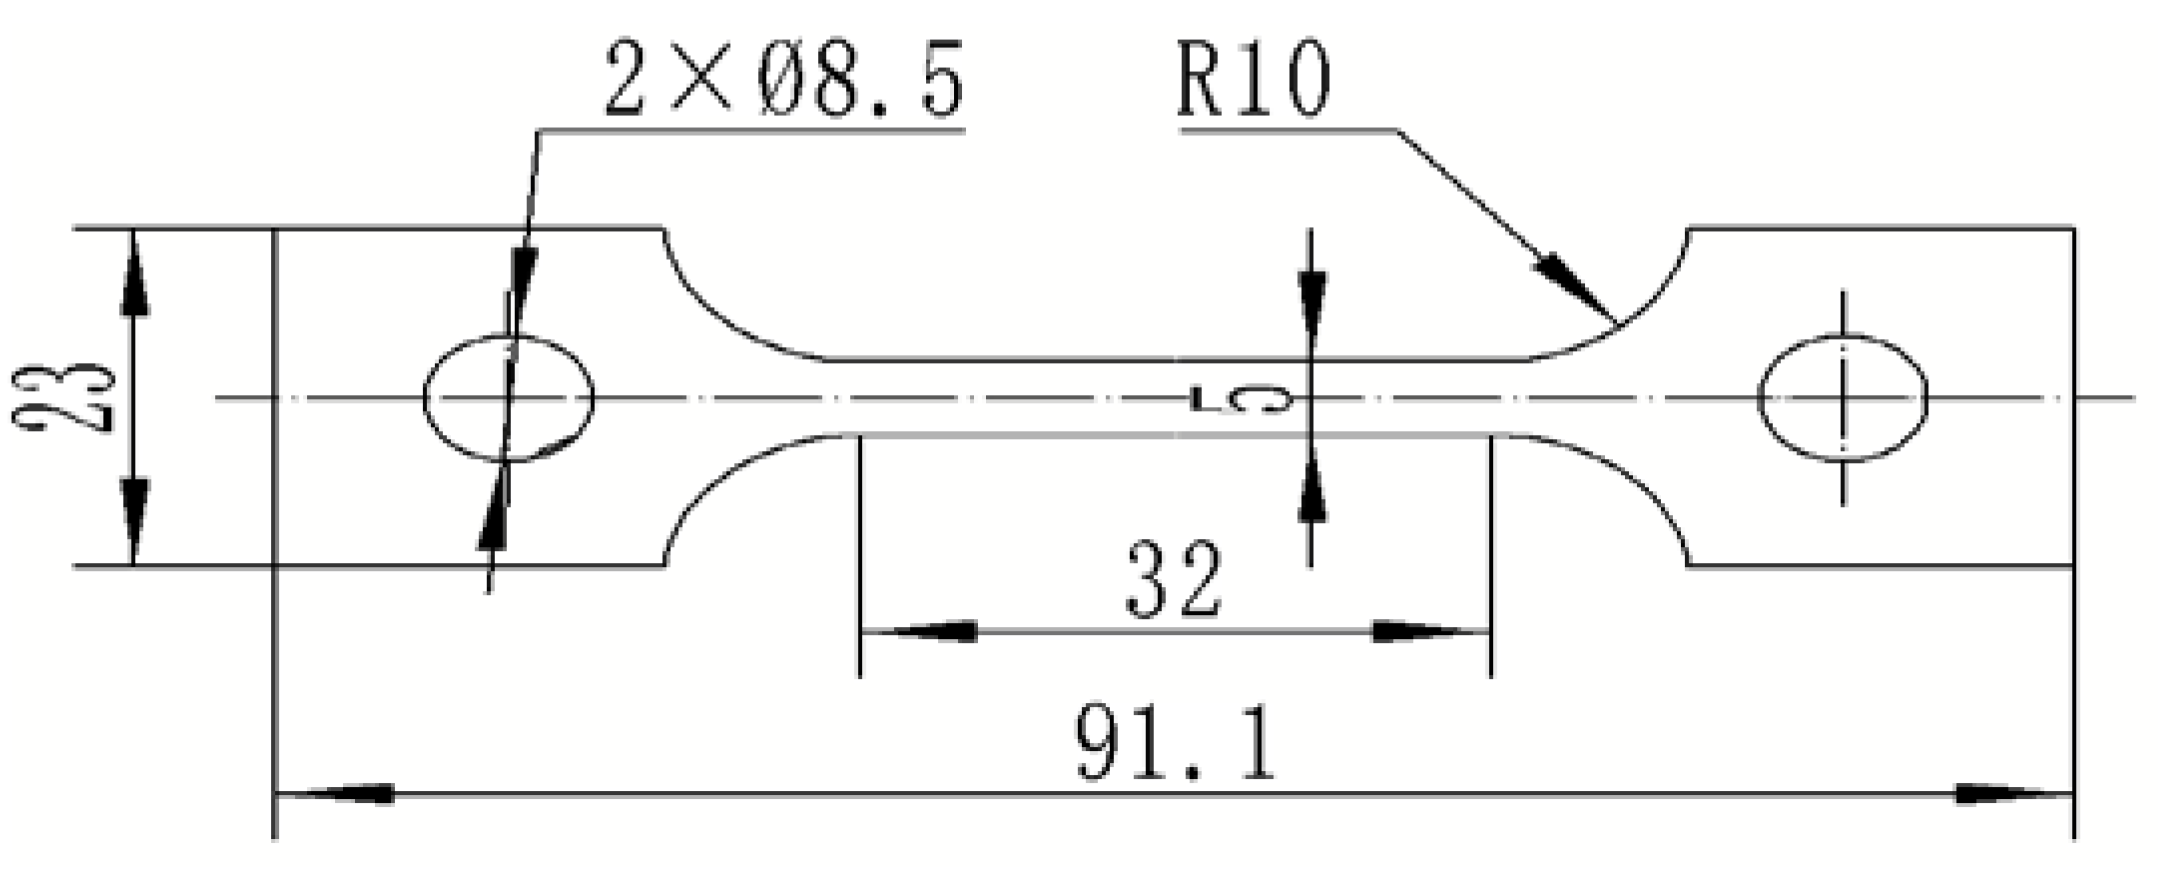
2. Materials and Methods

The Ti-6Al-4V alloy used in this work was cut from a 1 mm thick rolled plate. The as-received material consisted of equiaxed grains, and the chemical composition is listed in Table 2. The specimens for the hot temperature tensile tests were prepared by a wire electrical discharge machining method with the dimensions as detailed in Figure 2.
Before the high-temperature tensile test was commenced, the specimen was polished with fine sandpaper (1500#, Bingyang Grinding Technology Co., LTD, Shandong, China) to ensure that the thermocouples could make good contact with the sample. The details of the constant strain rate high-temperature tensile test are shown in Figure 3. The tensile test was carried out using a Shimadzu Electronic universal testing machine (Shimadzu, Kyoto, Japan) with three thermocouples applied to control the furnace temperature. Firstly, the specimen was heated up to 950 °C at 20 °C/s; this temperature was determined by the maximum temperature for superplastic deformation [14]. Secondly, the temperature was sustained for 5 min to obtain uniform microstructures. Thirdly, the furnace was opened to let the temperature cool down to 930, 900, 800, or 700 °C. Finally, the high-temperature tensile test was performed at the designated temperature with a selected strain rate of 10−2, 10−3, or 10−4/s. Due to the lengthy time requirements for the high temperature tensile test, the experiments at each designated temperature and strain rate were only performed once. The recorded force-displacement curves were employed to calculate the true strain and true stress data with the following equations [15]:
σ = F A 0 ( 1 + Δ L L 0 ) ε = l n ( 1 + Δ L L 0 )
where F is the loading force; A 0 is the initial cross-sectional area; L 0 is the initial gauge length; Δ L is the elongation. In addition, the microstructure of each specimen was analyzed by electron backscattered diffraction (EBSD, Oxford Instrument Technology (Shanghai) Co., Ltd., Shanghai, China), and the results were analyzed with Channel 5 software.

3. Flow Behavior of Ti-6Al-4V Alloy during Air Cooling

Figure 4 shows the results of the high-temperature tensile tests, where the black, red, and green lines represent the strain rates of 10−2, 10−3, 10−4/s, respectively. The main characteristics of the stress-strain curves for the Ti-6Al-4V alloy during cooling are listed as follows:
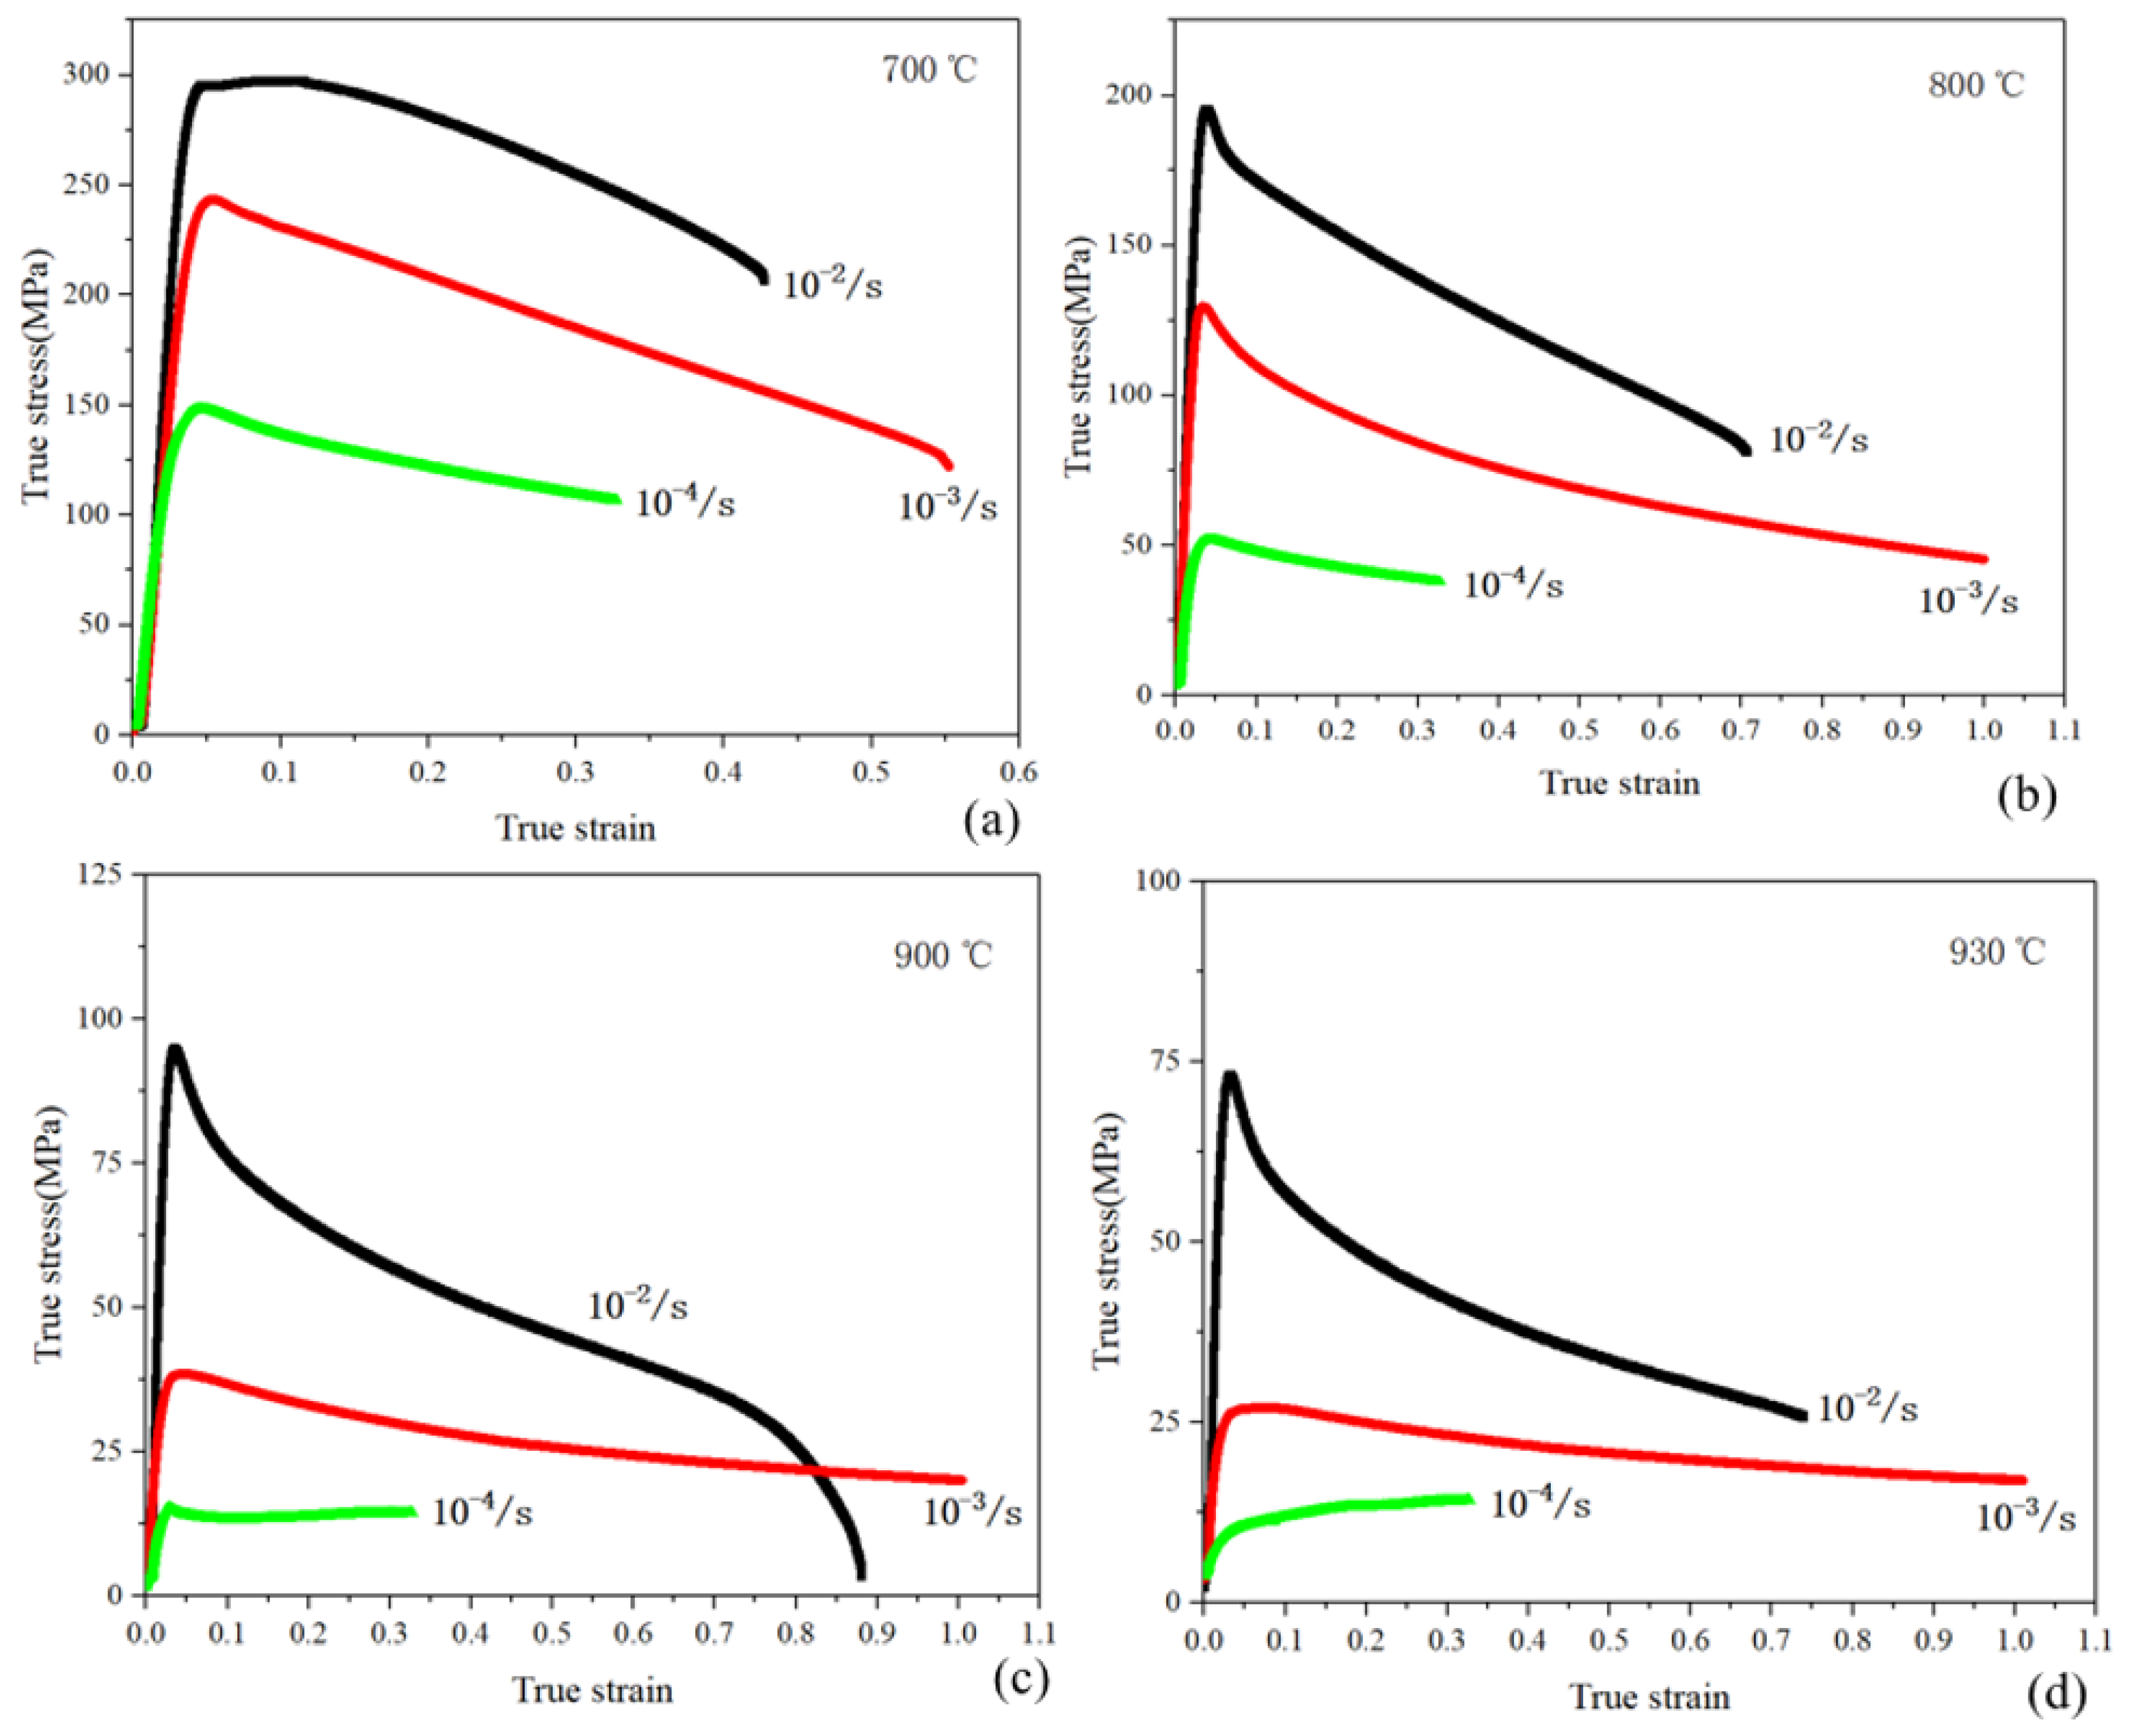
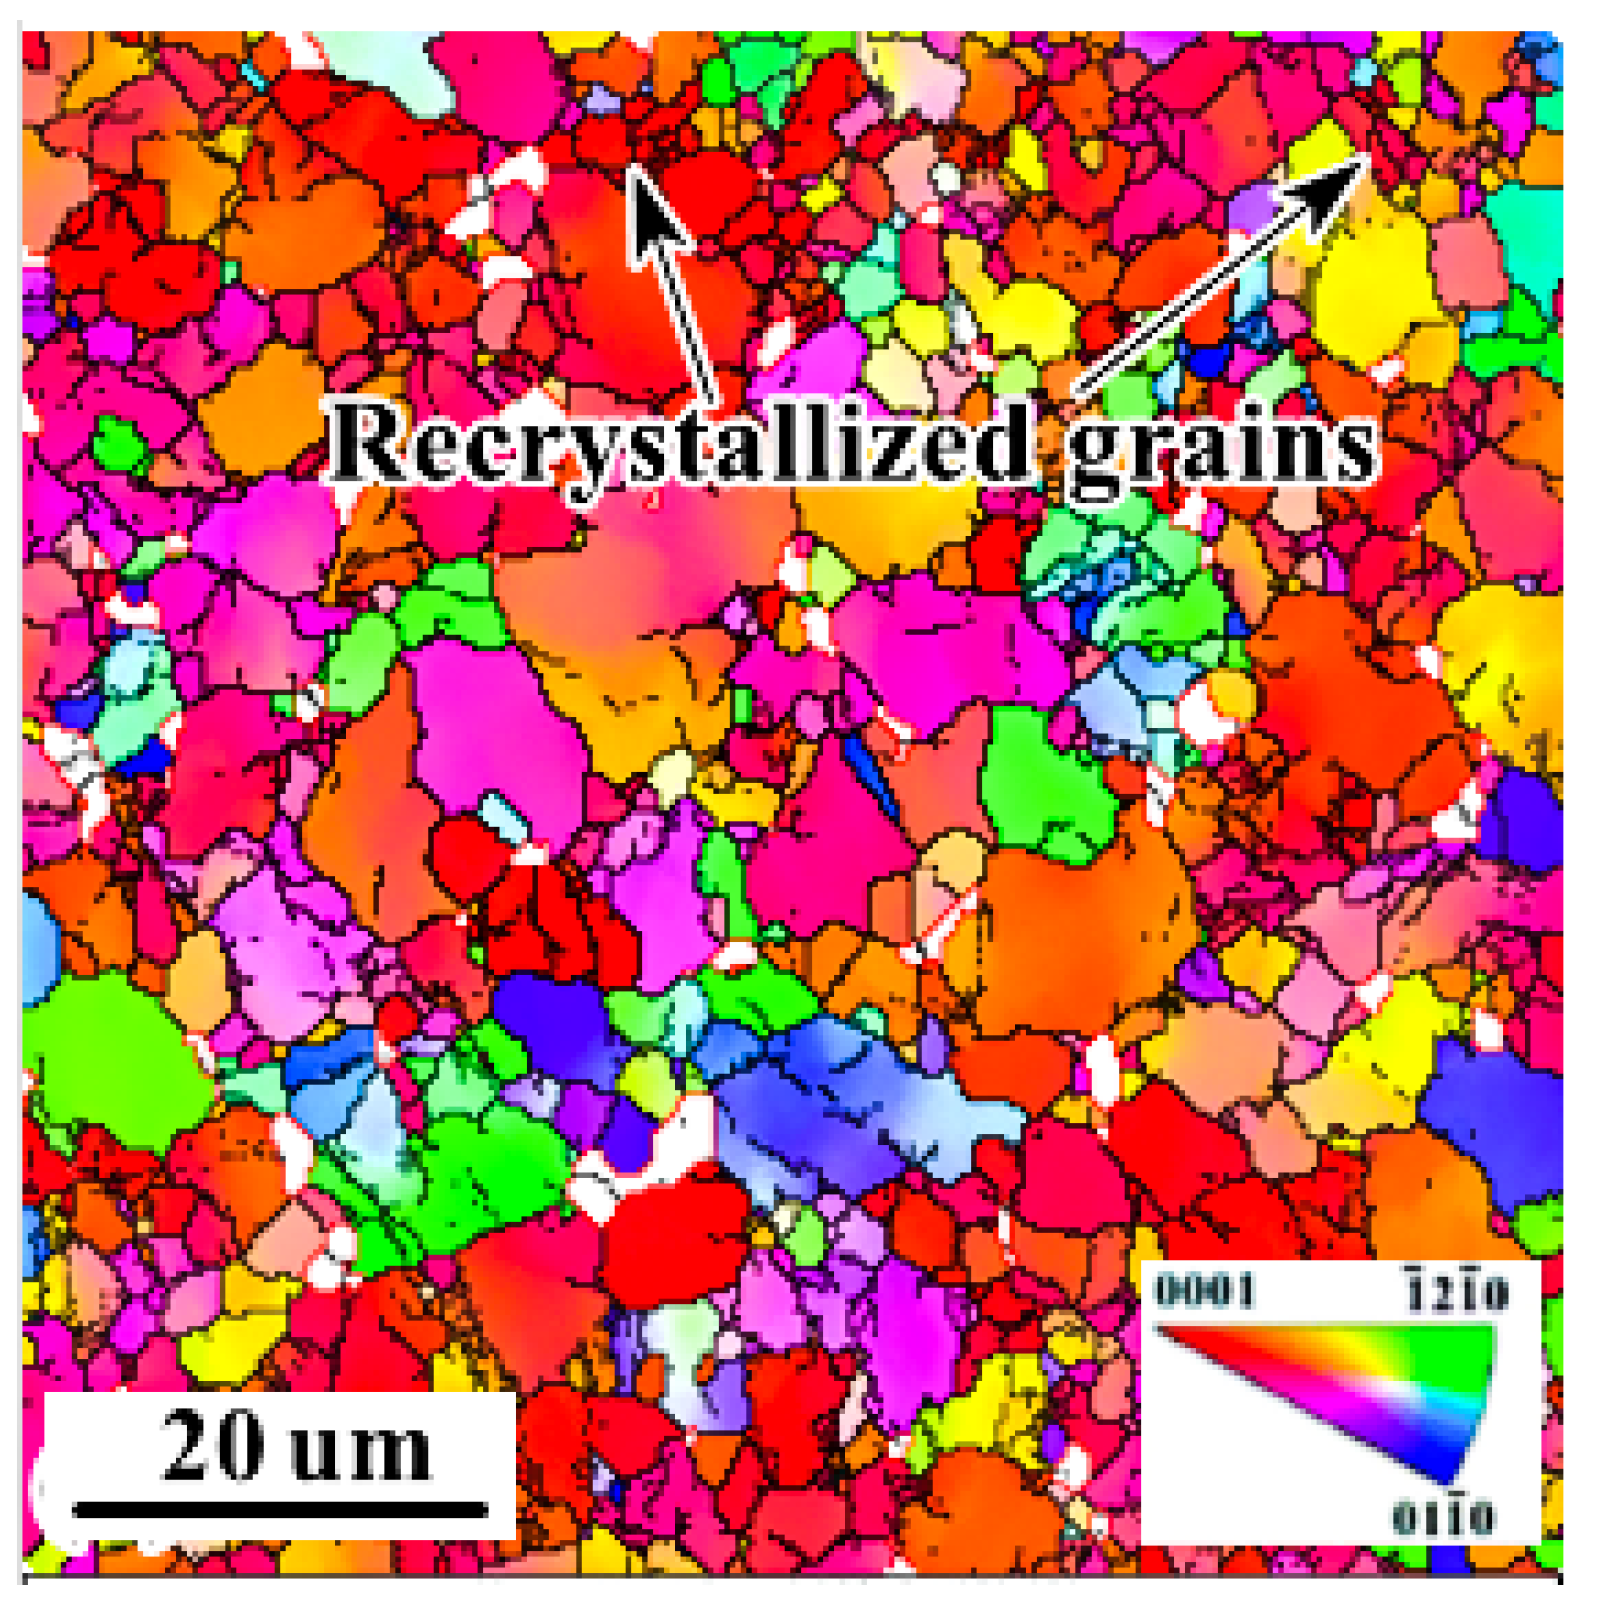
  • During the initial stage of deformation, flow stress increased rapidly, which was caused by dislocation multiplication. Dislocations are mainly affected by dislocation multiplication, dynamic recovery (DRV), and dynamic recrystallization (DRX). The latter two are mechanisms of dislocation annihilation. As the deformation progresses, the annihilation mechanism gradually strengthens, gradually weakening the impact of dislocation multiplication.
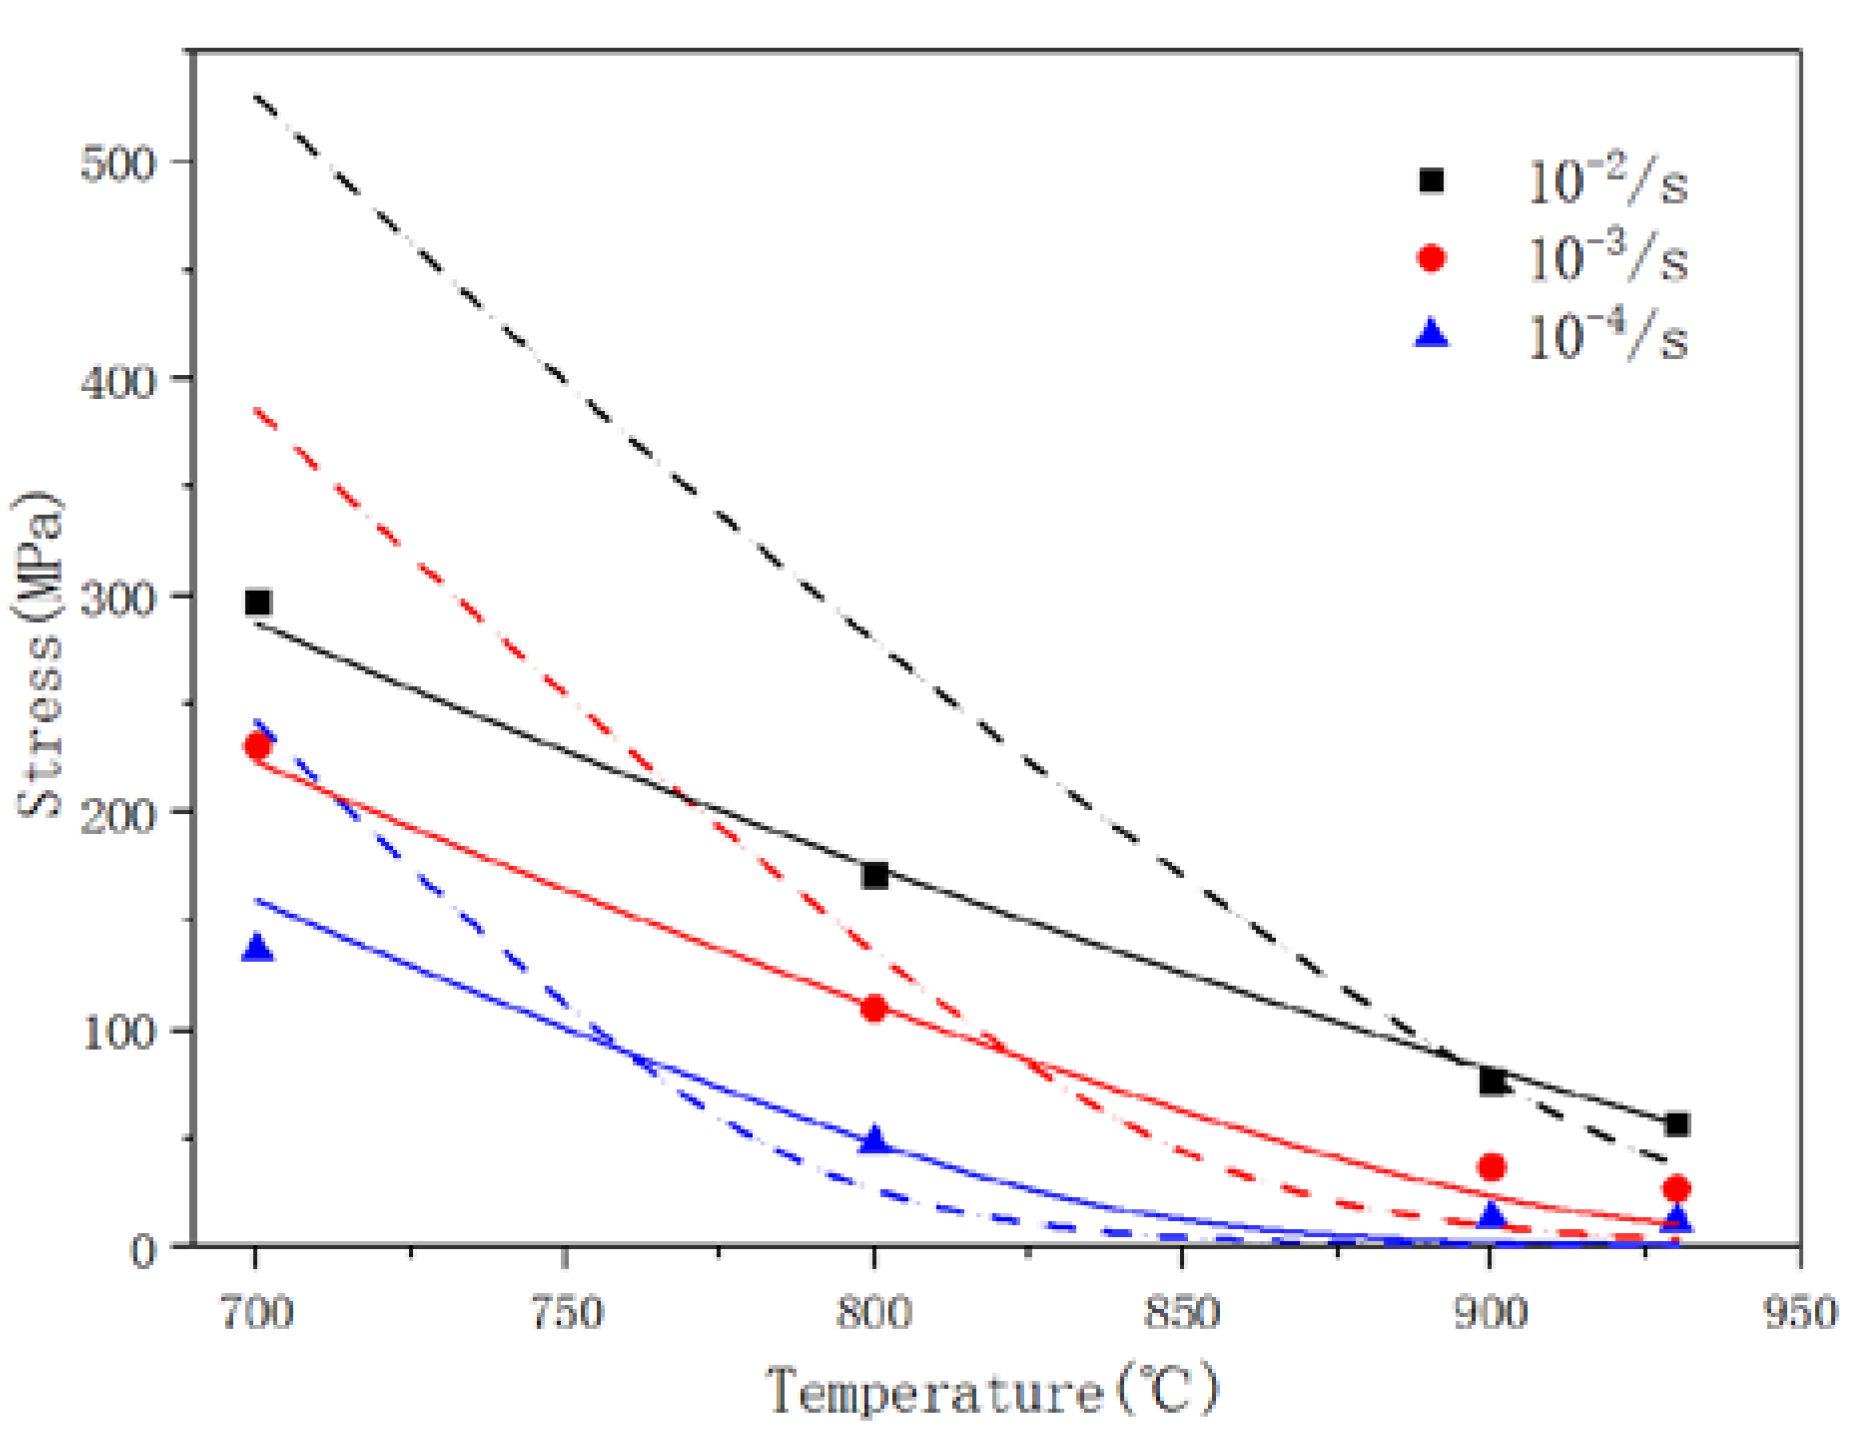
  • For large strains, a stress softening phenomenon appears after the stress reaches a peak. When the strain rate was 10−2/s, such softening behavior was continuous, which may be caused by the effects of voids at high strain rates. Previous research has demonstrated that obvious dynamic recrystallization can occur, resulting in significant void growth [9]. In contrast, the stress was able to maintain a stable state after softening at 10−3/s, which is similar to the SPF process [16,17,18].
  • For the low strain rate of 10−4/s, the flow behavior was directly related to the temperature. When T < 900 °C, stress softening also occurred. However, flow stress gradually increased with strain at high temperatures, indicating that the softening mechanism for titanium is not sufficient to eliminate the effects of dislocation multiplication.
The flow behavior at ε = 0.2 of the Ti-6Al-4V alloy during the air cooling process after superplastic deformation is presented in Figure 5. As is shown in Figure 5a, the maximum true stress occurs at 700 °C with a strain rate of 10−2/s. Thus, it will be increasingly difficult for plastic deformation during air cooling. The strain-rate sensitivity parameter provides an estimate for the ability of a material to undergo continuous plastic deformation, which is given as m = ln σ / ln ε ˙ . The values for the strain-rate sensitivity parameter were lower at low temperatures, inferring the possibility that flow localization increased during the air cooling process.

4. Constitutive Modeling Based on an Arrhenius Model

4.1. Arrhenius Model

Considering that the above process is related to temperature and strain rate, an Arrhenius model can be used to describe the rheological behavior, and the constitutive model equation is as follows [19]:
{ Z = ε ˙ exp ( Q / R T ) ε ˙ = A F ( σ ) exp ( Q / R T ) F ( σ ) = { σ n α σ < 0.8 exp ( β σ ) α σ > 1.2 [ sin h ( α σ ) ] η f o r   a l l   s t r e s s e s
where Z is the Zener–Hollomon parameter, which represents the comprehensive influence of temperature and strain rate [20]. ε ˙ , Q , σ , and T are the strain rate, deformation active energy, stress, and temperature, respectively. R is the gas constant, where R = 8.315 J/(mol·K). A, α, β, n and η are material constants.
A hyperbolic-sine model does not include strain-related quantities. Therefore, the material constants must be determined under constant strain. In contrast to the method of applying peak stress [21], we selected the test data for flow stress at ε = 0.1 for this paper, as shown in Table 3.

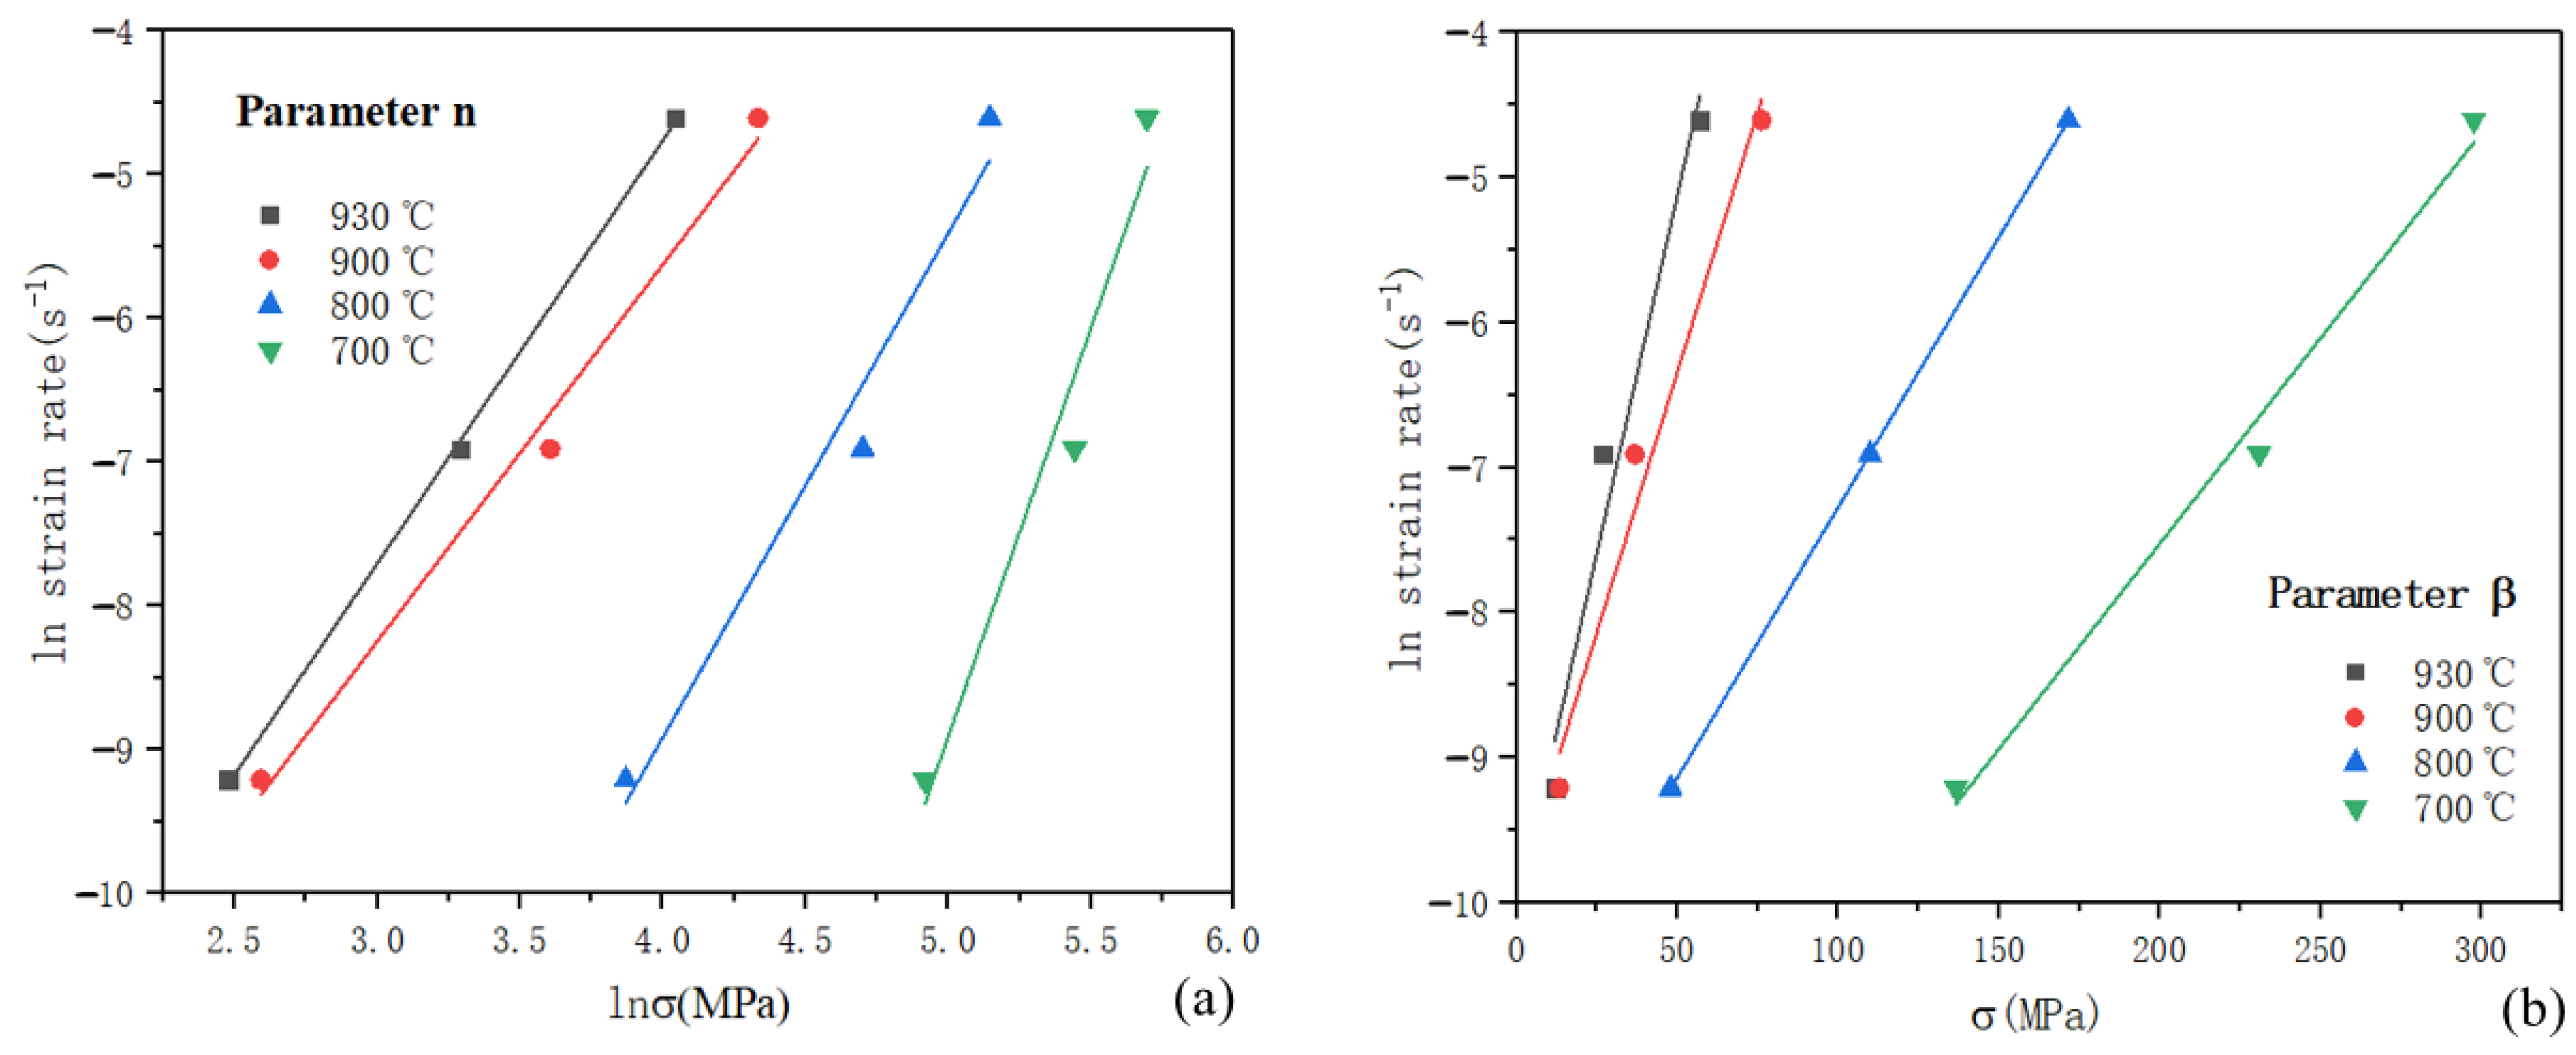
4.2. Determine the Constants of the Constitutive Model

Equation (3) can be deduced by sorting F ( σ ) in Equation (2) as follows:
{ ε ˙ = A 1 σ n exp ( Q / R T ) α σ < 0.8 ε ˙ = A 2 exp ( β σ ) exp ( Q / R T ) α σ > 1.2 ε ˙ = A 3 [ sin h ( α σ ) ] η exp ( Q / R T ) f o r   a l l   s t r e s s e s
The parameters of the Arrhenius equation are functions of the strain rate and temperature, so mean values for the material constants are always employed [11,13,22,23,24]. The formula to obtain n and β are given by taking the logarithm of Equation (3), as shown in Equation (4) and Equation (5), respectively.
l n ε ˙ = l n A 1 + n l n σ Q / R T
l n ε ˙ = l n A 2 + β σ Q / R T
For a certain temperature, T ˙ = 0, n = ln ε ˙ / lnσ and β = ln ε ˙ / σ can be obtained. Thus, the material constants n and β can be determined from the slope of the curve for ln ε ˙ -ln σ and ln ε ˙ - σ , respectively. The fitting results are presented in Figure 6, where it can be seen that the slope of each linear fit varies with a change in the deformation temperature. The mean values for n and β were calculated as 3.69 and 0.059, respectively. In addition, α is a stress multiplier that can be calculated with the expression α = β / n as 0.016. The results and mean values for n , β and α are listed in Table 4.
Moreover, by taking the logarithm of the expression for all stresses in Equation (3), a function for calculating parameter η can be obtained as follows:
l n ε ˙ = l n A 3 + η l n [ sin h ( α σ ) ] Q / R T
Differentiating Equation (6) concerning ln [ sin h ( α σ ) ] , it holds that η = ln ε ˙ / { ln [ sin h ( α σ ) ] } , where η is the slope of the linear fitting curve for ln ε ˙ ln [ sin h ( α σ ) ] . The fitting results for ln ε ˙ and ln [ sin h ( α σ ) ] are presented in Figure 7, and the slope values for η at different temperatures are listed in Table 5. Similarly, averaging the fitted value for each temperature gives η   = 2.22.
The most important characteristic of high-temperature deformation is that the deformation is controlled by a thermally activated process. The deformation activation energy is defined by the ability to overcome energy barriers through dislocation movement, such as dislocation slip and climb. The deformation activation energy Q is given as follows [22,25,26,27]:
Q = R η   l n [ sin h ( α σ ) ] ( 1 / T )  
The parameter K is introduced to describe the slope for the points l n [ sin h ( α σ ) ] - 1 / T , which are shown in Figure 8. The results for the values for K are listed in Table 6, where mean value K was 18,796.54. The activation energy is strongly influenced by the temperature and strain rates during superplastic deformation [24]; thus, the mean deformation activation energy can be calculated as Q = 347.39 KJ/mol. It is proved that the deformation activation energy Q is much larger than the self-diffusion activation energy of α -Ti (150 KJ/mol) and β -Ti (153 KJ/mol); therefore, dislocation climbing is not sufficient for stress softening, so the dominant softening mechanism is dynamic recrystallization [28]. Since a difference in the initial microstructure might account for the calculated results for the deformation activation energy, the calculation results can be considered reasonable.
Figure 9 presents the results of EBSD during air cooling deformation at 700 °C and 10−4/s. The white area corresponds to β-phase grains, while the red, green, and blue colors represent the <0001>, < 1 ¯ 2 1 ¯ 0>, and <10 1 ¯ 0> crystallographic directions of the α-phase grains, respectively. There are many fine grains distributed around the initial grains, which is caused by dynamic recrystallization. Dynamic recrystallization occurs in the dislocation density gathering area with high energy, and the nucleation of recrystallized grains will reduce the dislocation density. When combined with the stress-strain curves from Figure 4a, dynamic recrystallization is the dominant mechanism for stress softening.
Similarly, the values for A 3 can be determined by Equation (6). The calculation results for l n A 3   at different temperatures and strain rates are listed in Table 7, where the mean value was 29.77. To sum up, the values for the material constants of the Arrhenius model for a Ti-6Al-4V alloy during air cooling at ε = 0.1 are listed in Table 8.
Equation (8) can be derived from the third expression of Equation (2) as follows:
σ = 1 α s i n h 1 [ ε ˙ exp ( Q / R T ) A ] 1 η
After introducing the parameters from Table 8 into Equation (8), a comparison between the calculated flow stresses and the experimental data can be made, as shown in Figure 10. The dotted lines represent the predicted results, while the scattered points are the experimental data. The predictive ability of the constitutive model can be estimated by the mean relative error for the flow stresses, which was 65% in this instance. The large distinction between the predicted results and the experimental data for the flow stress was the result of averaging the values of the linear fitting results for the different deformation conditions. Therefore, a simple generalized reduced gradient refinement method was used to optimize the independent parameters α , η , Q , and A 3 [11], which are shown in Table 9. After optimization, the mean relative error for the constitutive model was significantly improved at 16% and provided a better fit with the experimental data, as shown by the solid lines in Figure 10.

5. Effect of the Strain on Flow Stress

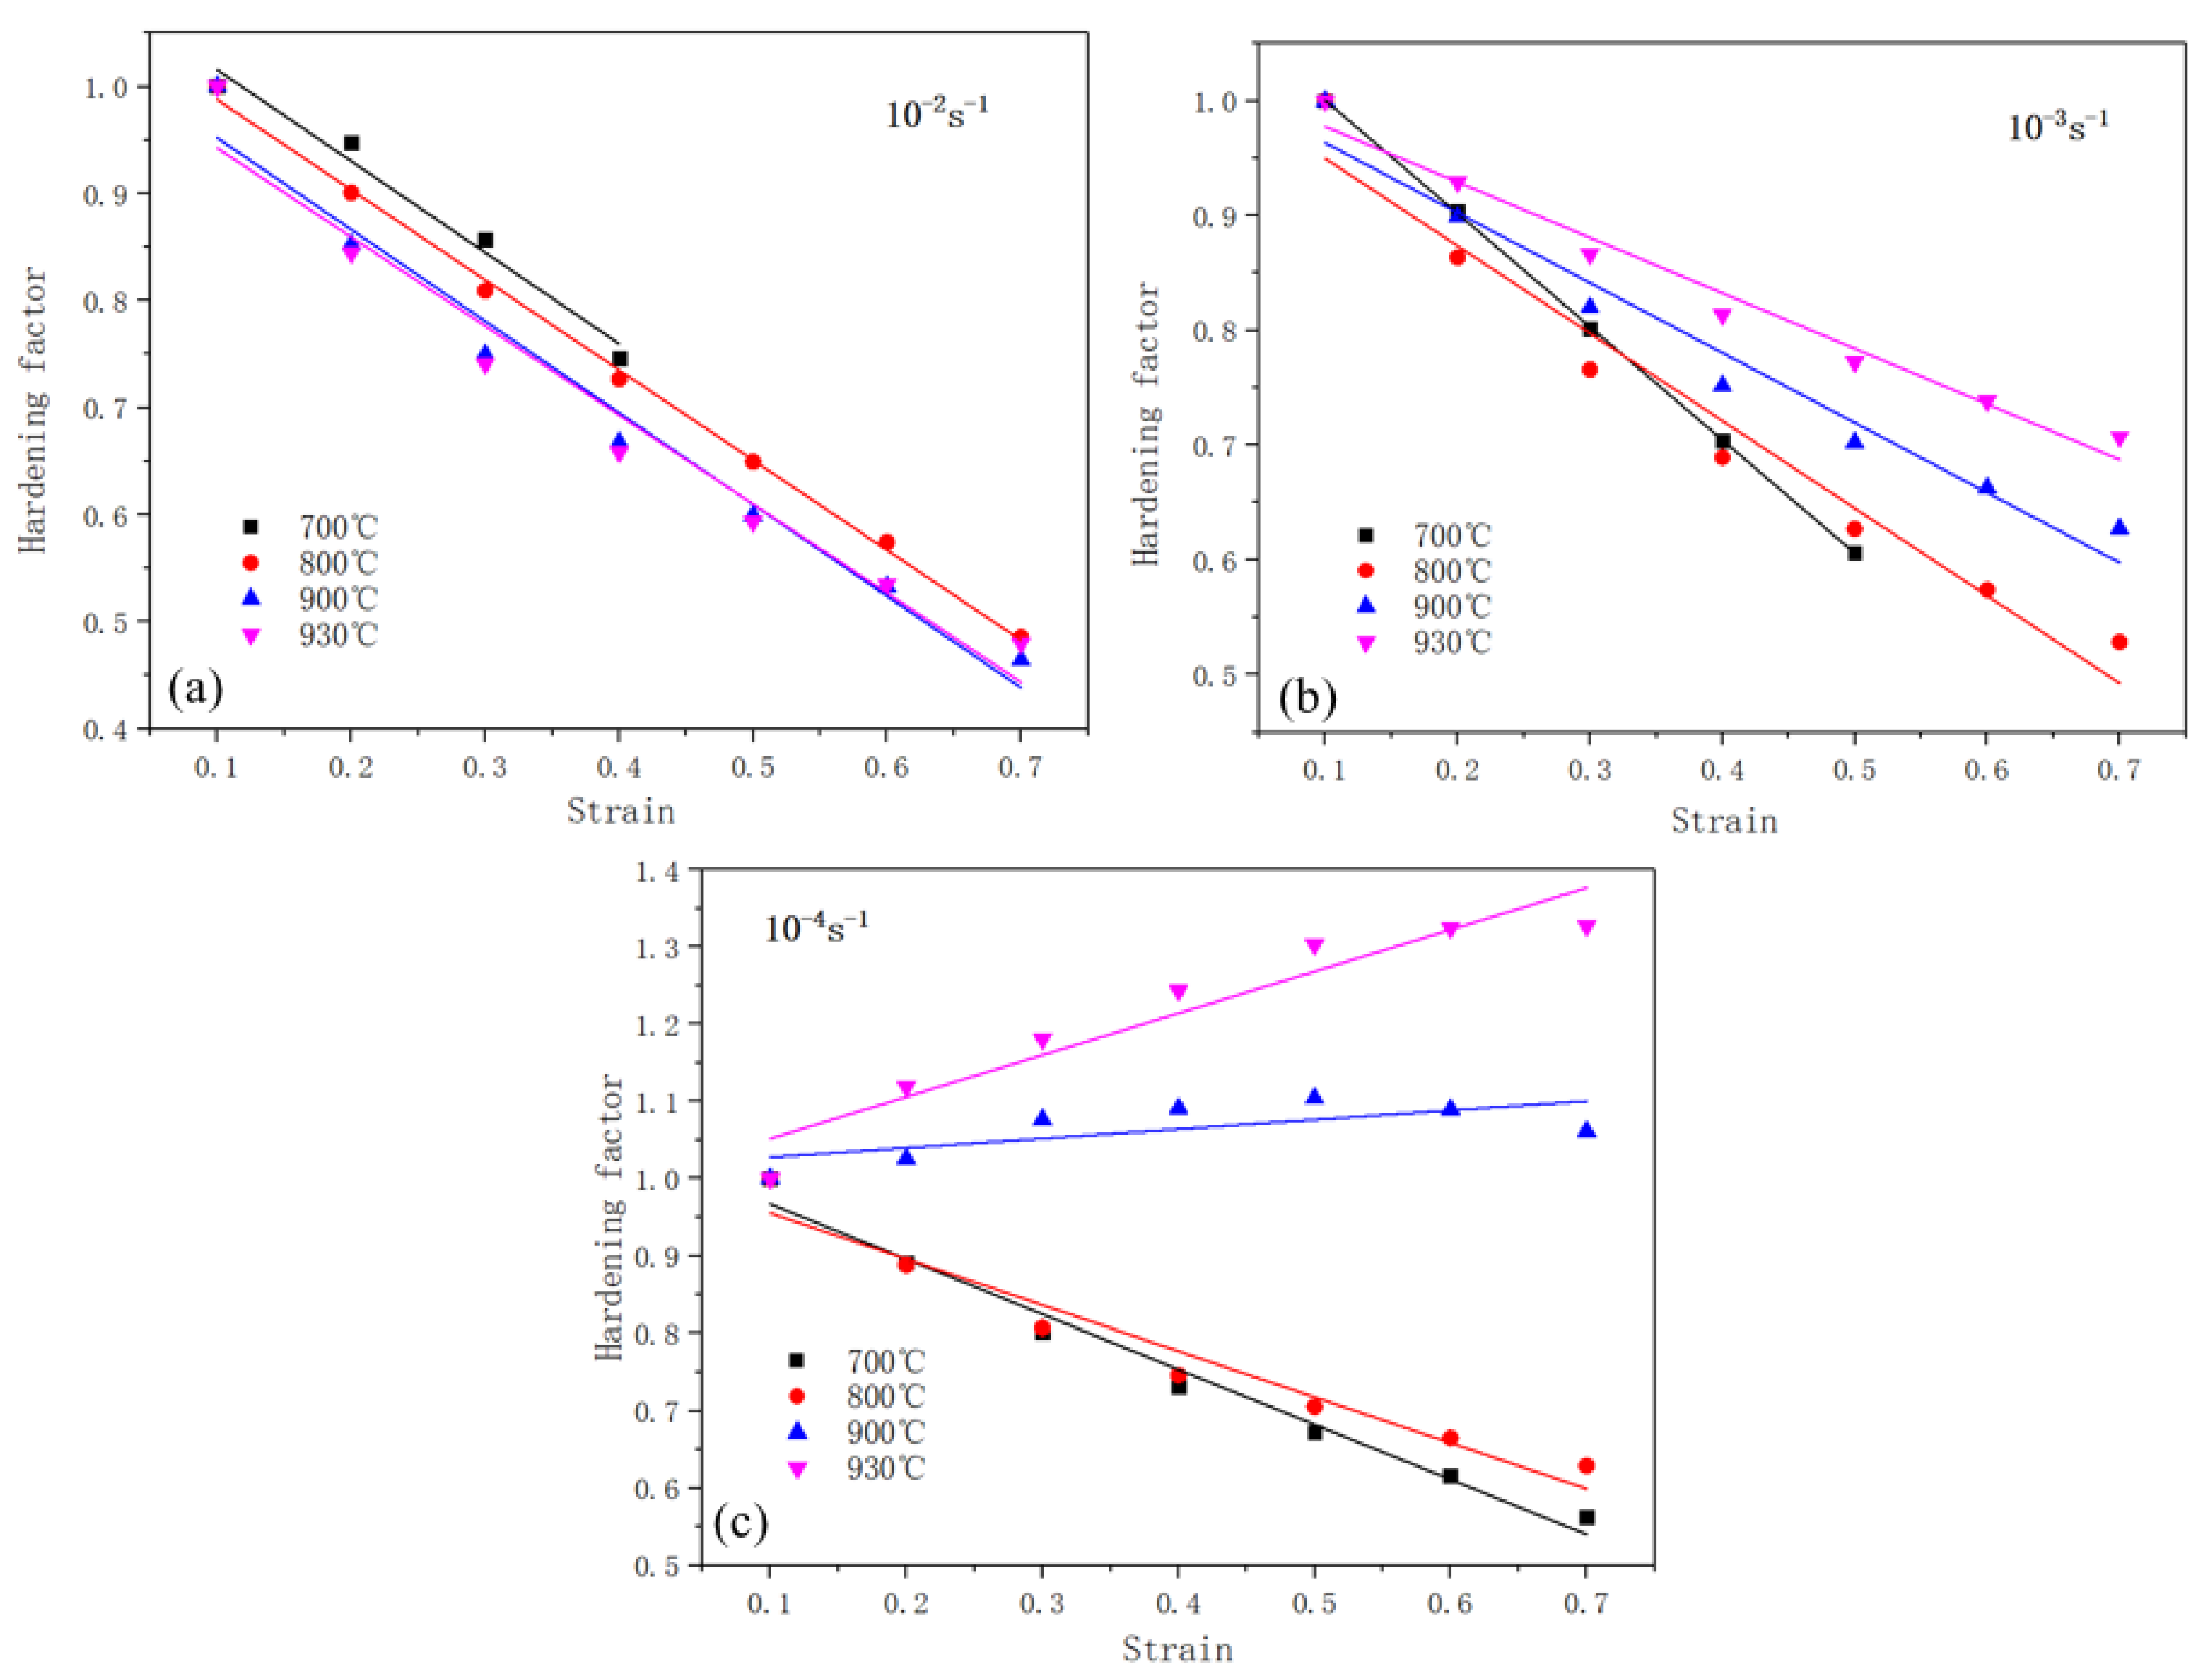
5.1. Strain Hardening Law

Considering that the Arrhenius model cannot describe the evolution of flow stress with strain, this section of this paper aims to establish a set of simple strain compensation equations. First, the strain stress ratio n h is defined as follows:
n h = σ σ 0.1
where the σ and σ 0.1 are the flow stress for a given strain value and a strain of 0.1, respectively. A similar approach was previously proposed by Yang et al. [12] for describing the rheological behavior of superplastic deformation with an Arrhenius model. In this paper, the strain stress ratio n h is modified based on the properties of the flow behavior from Figure 4. The calculation results for n h are shown in Figure 11, which shows a linear relationship with strain. It is characterized by a linear fit between the n h and strain according to the expression given as Equation (10). The mean values for k and b at different strain rates are provided in Table 10 and Table 11.
n h ( ε ) = k ε + b
The mean values for k and b are a function of the strain rate, which is expressed in Equation (11). The fitting results are shown in Figure 12 and the values for the coefficients of k k , b k , k b , and b b are listed in Table 12.
{ k ( ε ˙ ) = k k l n ε ˙ + b k b ( ε ˙ ) = k b l n ε ˙ + b b

5.2. Constitutive Model with Strain Compensation

To sum up, a modified Arrhenius model for a Ti-6Al-4V alloy during air cooling after superplastic forming is given as follows:
{ σ = k ( ε ˙ ) ε + b ( ε ˙ ) α s i n h 1 [ ε ˙ exp ( Q / R T ) A ] 1 η k ( ε ˙ ) = 0.15 l n ε ˙ 1.59 b ( ε ˙ ) = 0.0092 l n ε ˙ + 1.10
Figure 13 provides a comparison between the predicted stresses from the constitutive model with strain compensation and the experimental data. The dotted line represents where the calculated results are equal to the experimental data. The closer the scatter points are to the dotted line, the better the predictive ability of the established constitutive model. Thus, the constitutive model developed in this paper can describe the flow behavior for a Ti-6Al-4V alloy during air cooling after superplastic deformation. The predicted errors of the constitutive model mainly depend on the accuracy of the calculations at a constant strain, so the optimization of the parameters performed in Section 4.2 was essential in this study.

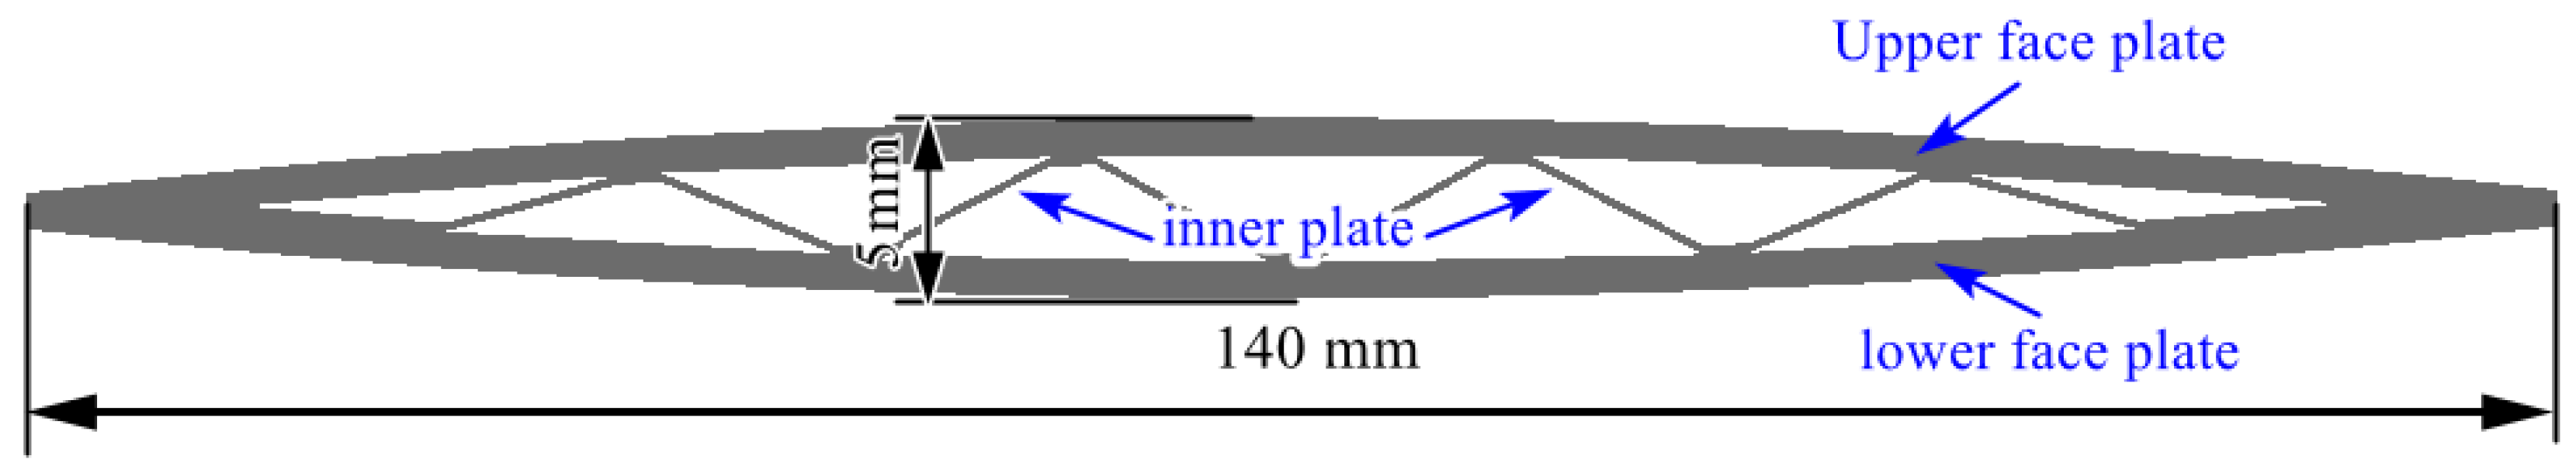
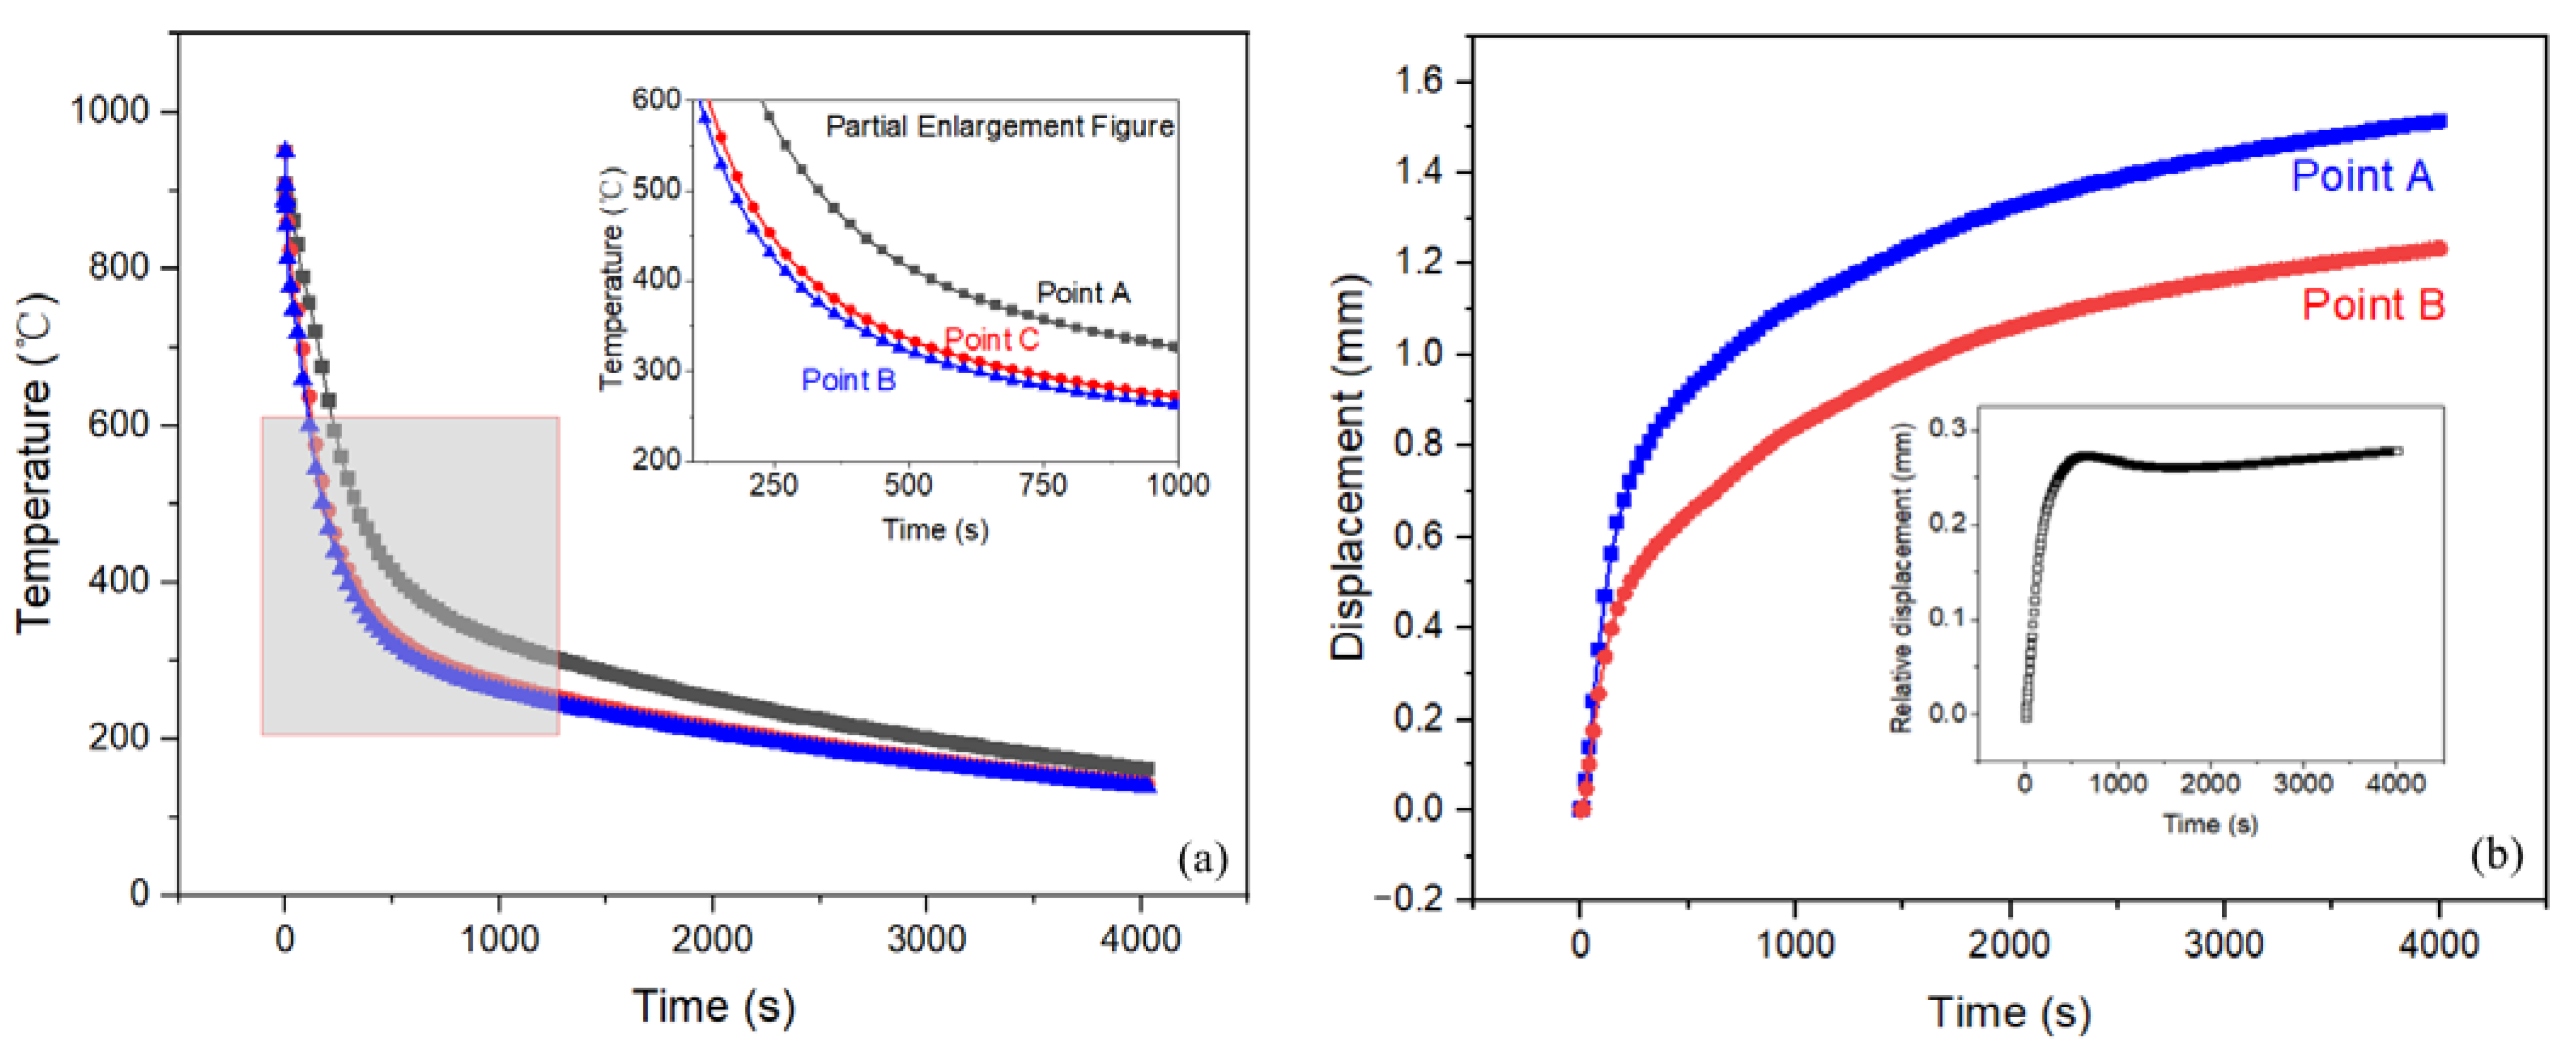
6. Application of the Constitutive Model to a Sandwich Structure

To illustrate the deformation law during the air cooling process after SPF, the established constitutive model was applied to a FEM analysis of a sandwich structure. ABAQUS software (ABAQUS6.14, SIMULIA, La Celle-Saint-Cloud, France) was employed for this simulation, with a “UHARD” subroutine to define the flow behavior of the Ti-6Al-4V alloy. This subroutine was used for every increment cycle during the FEM analysis [29].
Figure 14 shows the simulation results for temperature, equivalent strain, and displacement during the air cooling process for the sandwich structure. As is shown in Figure 14a, the distribution of the temperature fields mainly depended on structural features. Three points (A–C) were selected to analyze temperature changes over time, which are presented in Figure 15a. Point A has the slowest cooling rate since it was 40 mm thick and continuous heat transfer occurred during air cooling. In our previous research [9], it was demonstrated that material flow stability is excellent when the cooling rate is low. Owing to relatively high cooling rates, Points B and C are susceptible to failure due to the air cooling process. Thus, the inner plate might be the first location where damage occurs since it is relatively thin.
The equivalent strain and displacement distribution for the sandwich structure are given in Figure 14b and Figure 14c, respectively. The equivalent strain values were small, which was caused by boundary conditions that were set without fixture restrictions. The strains in this simulation were all caused by non-uniform temperature fields. However, the displacement was not negligible due to the additive effect of the equivalent strain. To illustrate the extent of the deformation of the structural elements, displacement results for points A and B (as in Figure 14c) are presented in Figure 15b. The relative displacement between the two selected points amounted to 0.26 mm, which is equivalent to an engineering strain of 0.37%. Considering the small dimensions of the model in this study, it is reasonable to deduce that deformation of a larger sandwich structure due air cooling after SPF will be considerable.

7. Conclusions

(1)
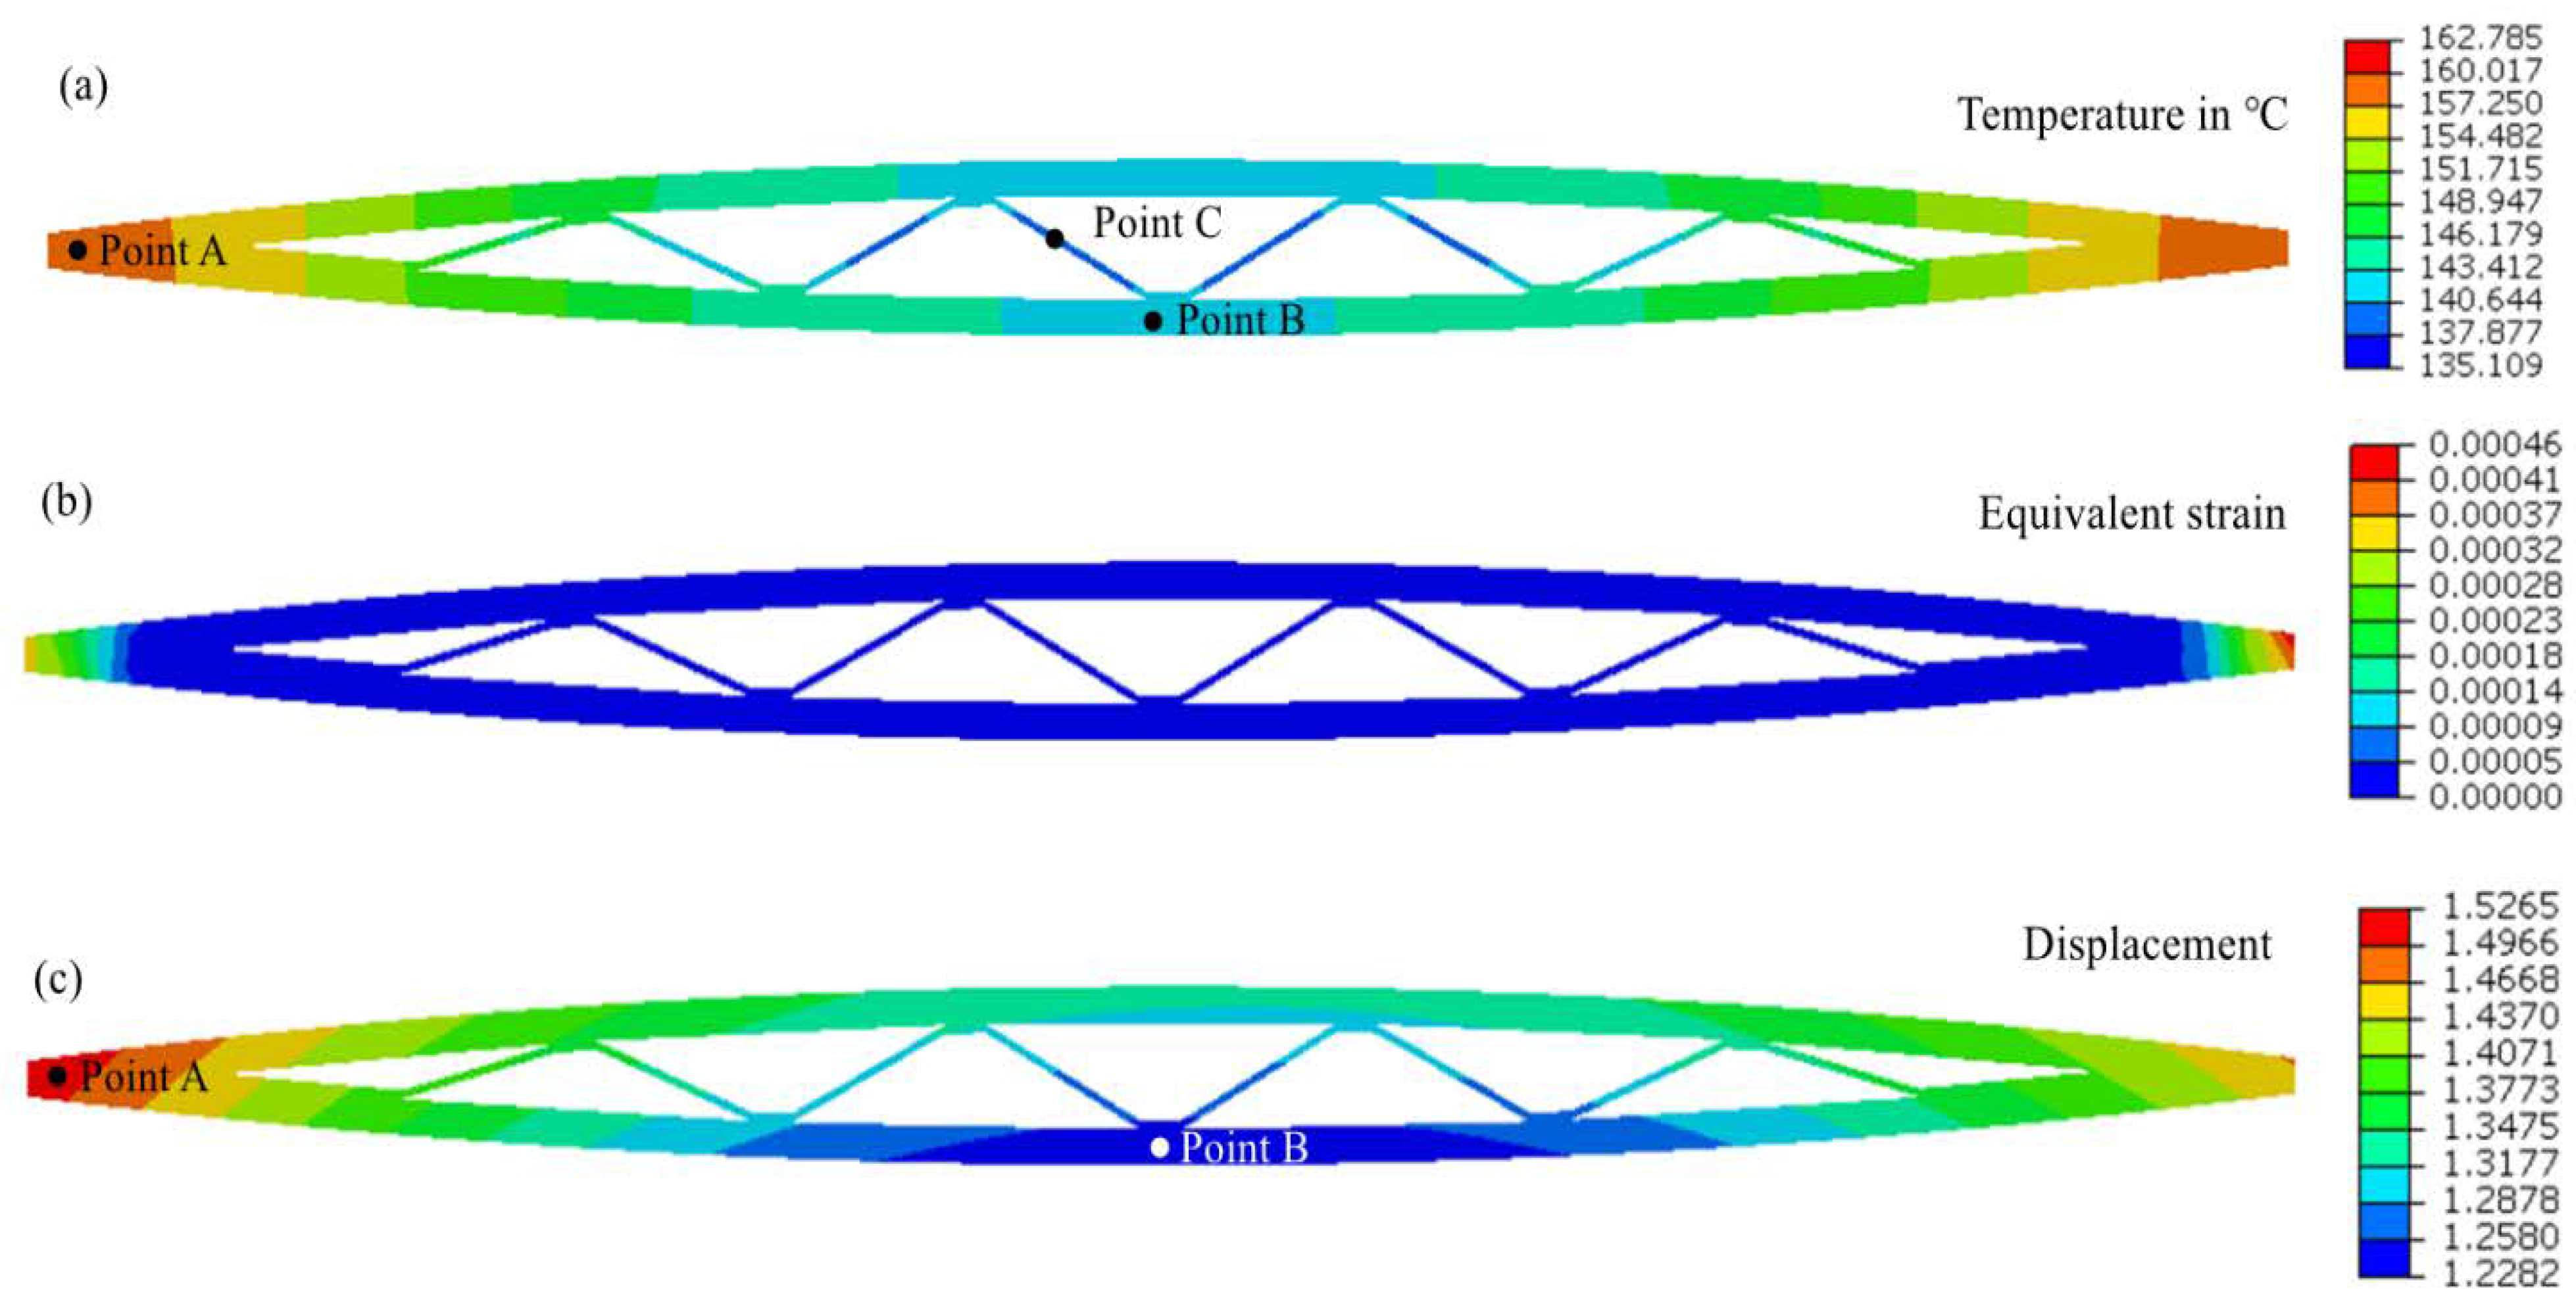
Owing to a high cooling rate and a small thickness value, the inner plate might be the first location where damage occurs during the air cooling process;
(2)
The engineering strain for the sandwich structure due to the temperature gradient was 0.37%, and distortions in the sandwich structure were caused by the temperature gradient;
(3)
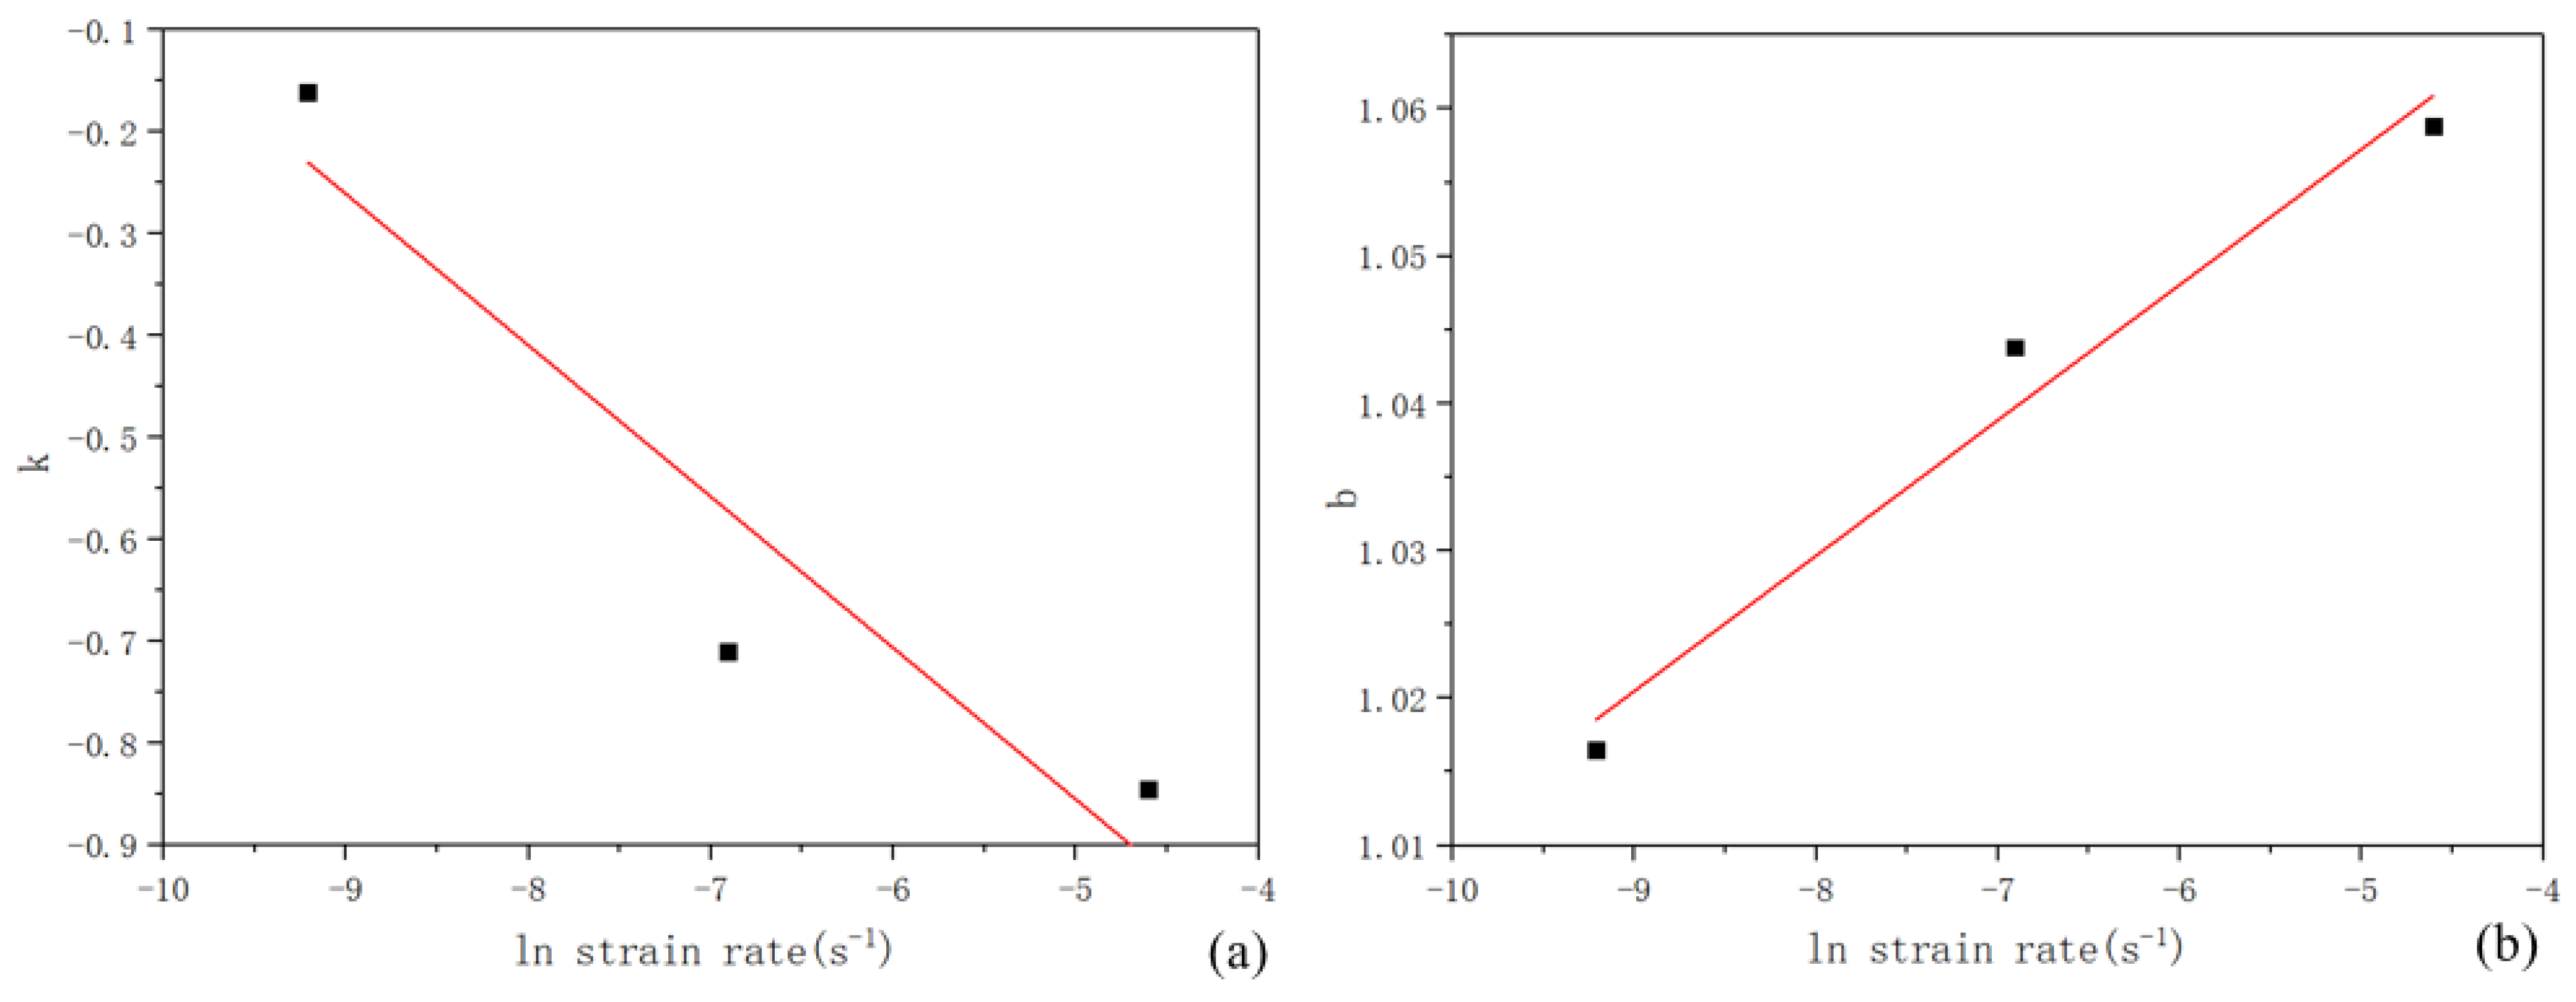
The strain stress ratio nh was shown to have a linear relationship with strain, so a strain compensation method based on a linear function is proposed;
(4)
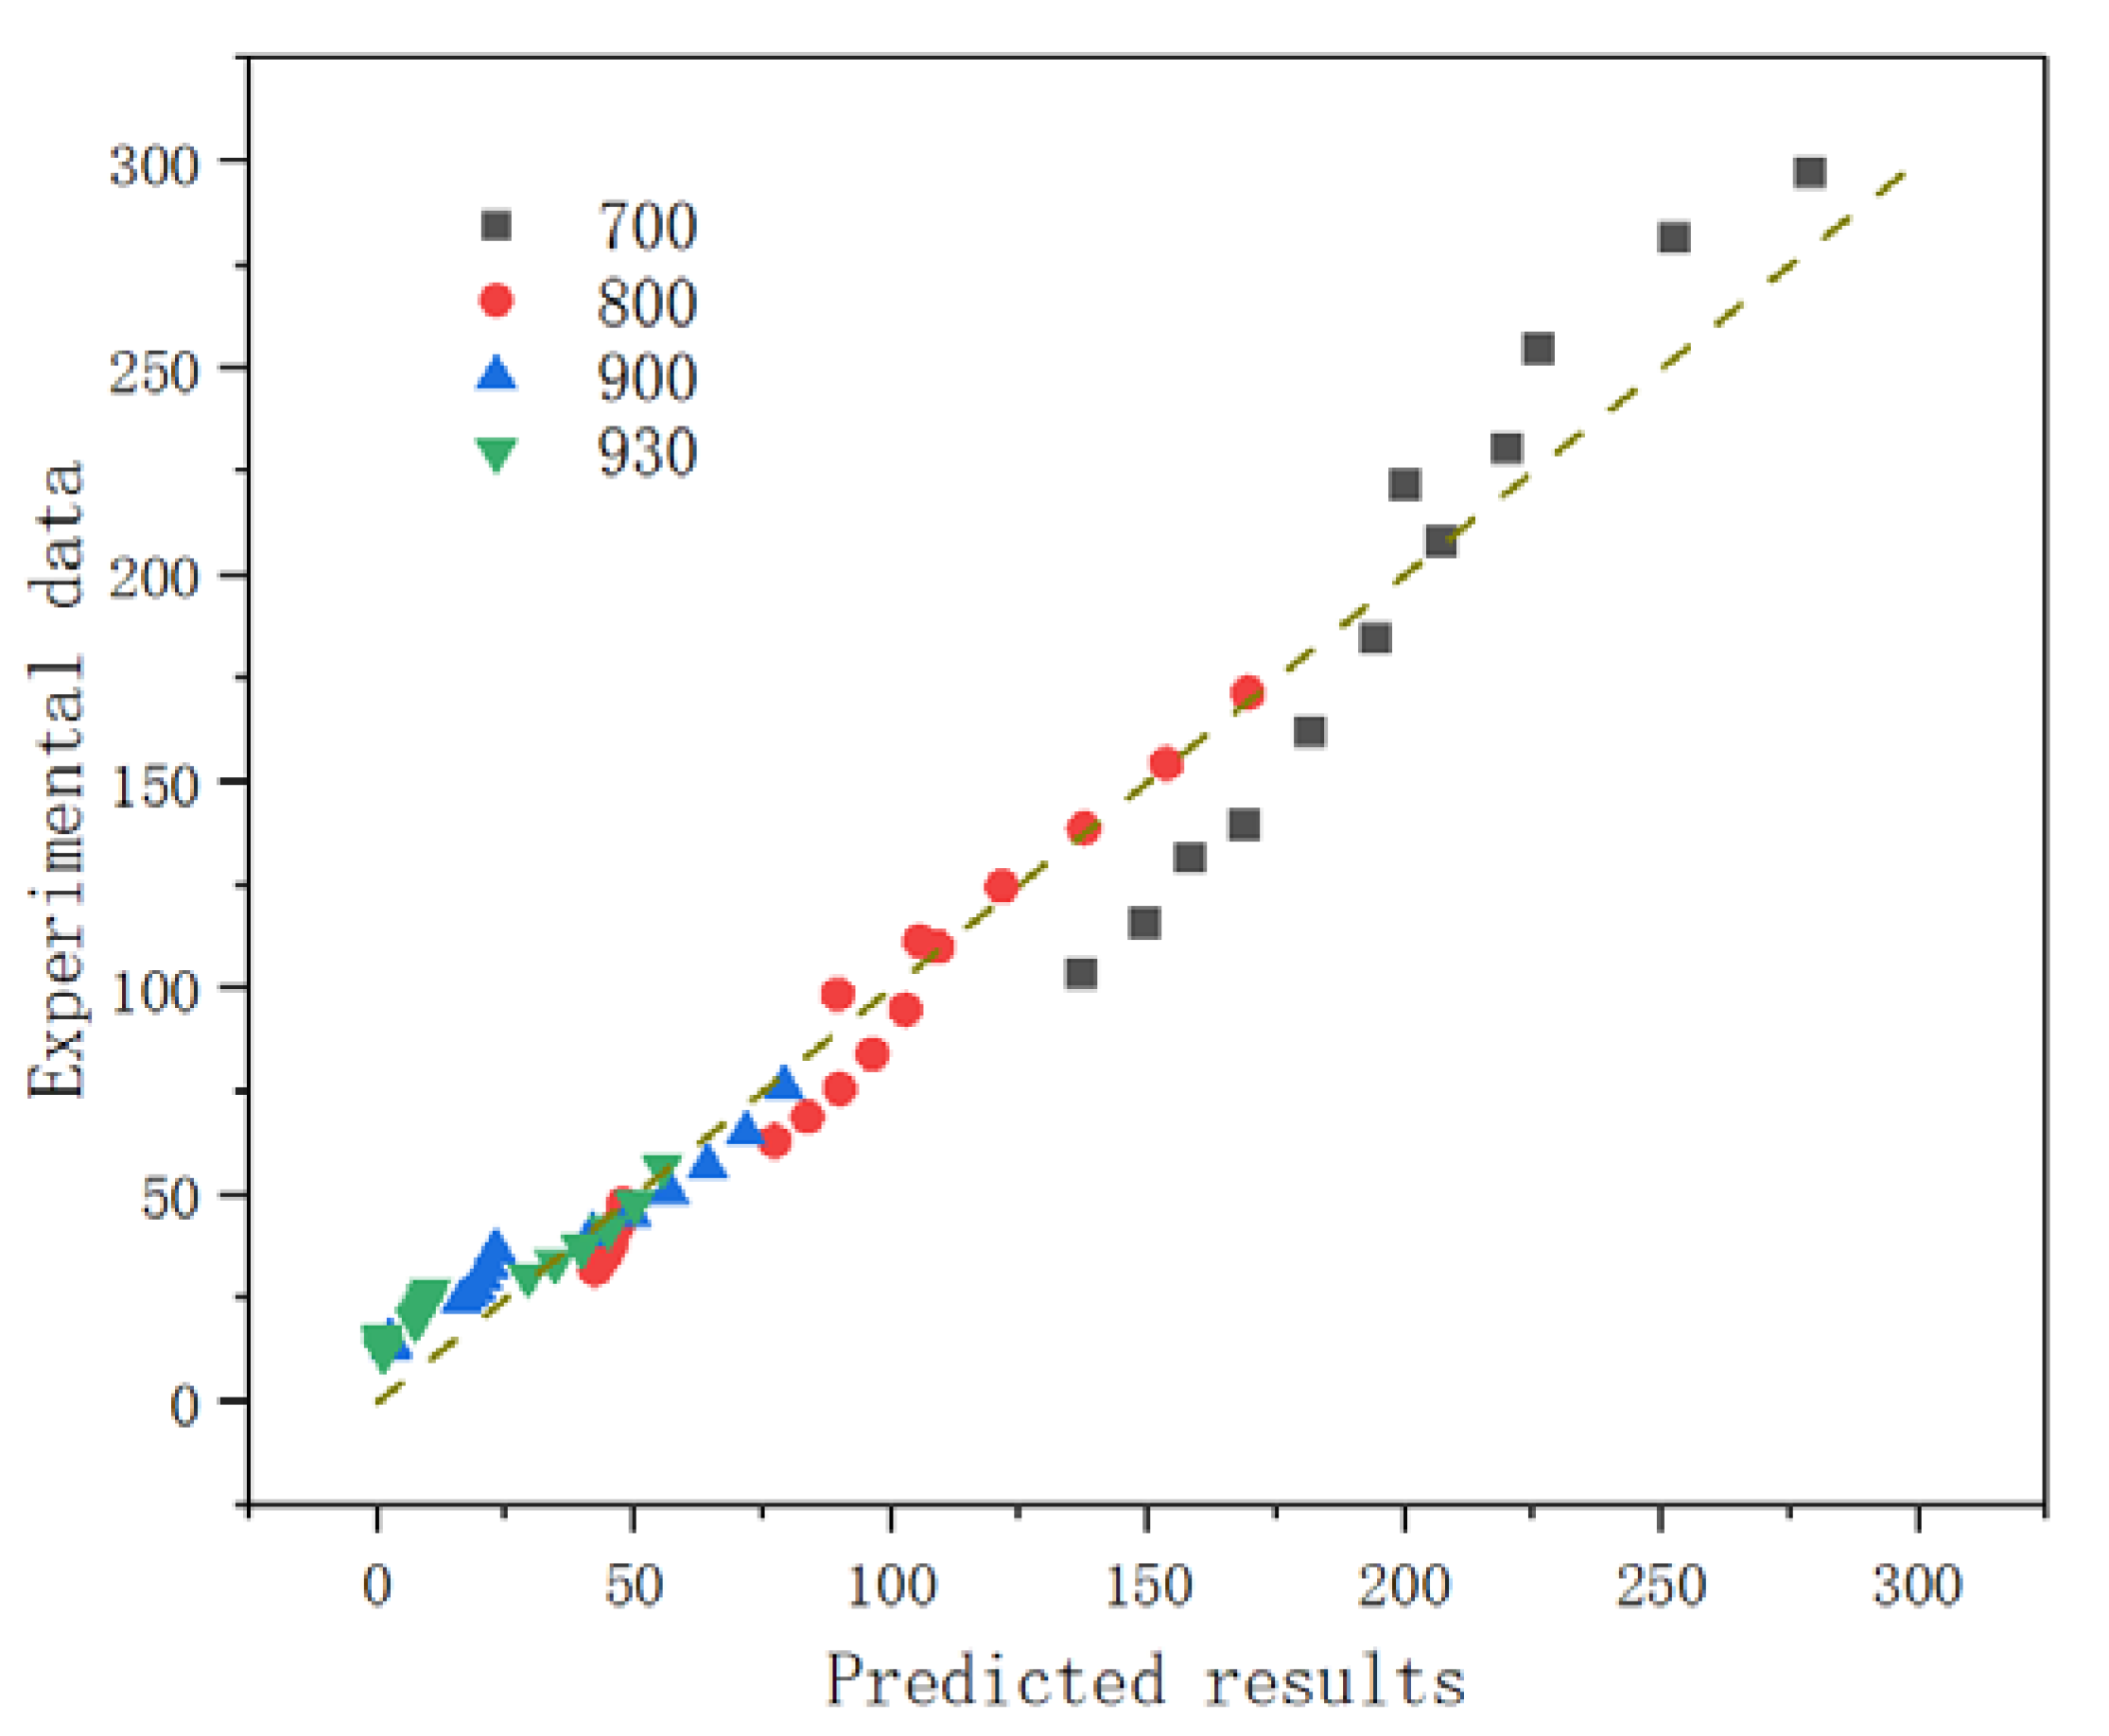
Parameter optimization for the Arrhenius model for flow stress was indispensable, since it reduced the mean error from 65% to 16% for the difference between the predicted results and the experimental data.

Author Contributions

X.H.: conceptualization, experimental investigations, programing, theoretical calculations, analysis, and writing-original draft. J.Y.: experimental investigations, discussion & review. J.L.: analysis, writing-review & editing, and supervision. J.W.: experimental investigations, discussion & review. All authors have read and agreed to the published version of the manuscript.

Funding

No funding supported this research.

Institutional Review Board Statement

Not applicable.

Informed Consent Statement

Not applicable.

Data Availability Statement

Not applicable.

Acknowledgments

The authors thank Northwestern Polytechnical University for providing its research infrastructure.

Conflicts of Interest

We declare that we have no financial and personal relationships with other people or organizations that can inappropriately influence our work, there is no professional or other personal interest of any nature or kind in any product, service, and/or company that could be construed as influencing the position presented in, or the review of, the manuscript entitled, “The effect of the grain sizes on the micro-cracks during the diffusion bonding process”.

References

  1. Rojas-Arias, N.; Aguilar-Sanchéz, M.; Barrales-Guadarrama, V.R.; Barrales-Guadarrama, R.; Silva, D.D.S.; Medrano-Rivera, L.A. Microstructural and electrical influence of Ti-6Al-4V-modified copper alloy. Mater. Lett. 2021, 285, 129183. [Google Scholar] [CrossRef]
  2. Wang, J.; Xu, Y.; Zhang, W.; Wang, W. A finite-strain thermomechanical model for severe superplastic deformation of Ti-6Al-4V at elevated temperature. J. Alloys Compd. 2019, 787, 1336–1344. [Google Scholar] [CrossRef]
  3. Picu, R.C.; Majorell, A. Mechanical behavior of Ti-6Al-4V at high and moderate temperatures-Part II: Constitutive modeling. Mater. Sci. Eng. A 2002, 326, 306–316. [Google Scholar] [CrossRef]
  4. Chuvil’deev, V.N.; Gryaznov, M.Y.; Shotin, S.V.; Kopylov, V.I.; Nokhrin, A.V.; Likhnitskii, C.V.; Murashov, A.A.; Bobrov, A.A.; Tabachkova, N.Y.; Pirozhnikova, O.E. Investigation of superplasticity and dynamic grain growth in ultrafine-grained Al–0.5%Mg–Sc alloys. J. Alloys Compd. 2021, 877, 160099. [Google Scholar] [CrossRef]
  5. Mosleh, A.O.; Mikhaylovskaya, A.V.; Kotov, A.D.; Kwame, J.S. Experimental, modelling and simulation of an approach for optimizing the superplastic forming of Ti-6%Al-4%V titanium alloy. J. Manuf. Process. 2019, 45, 262–272. [Google Scholar] [CrossRef]
  6. Sorgente, D.; Lombardi, A.; Coviello, D.; Scintilla, L.D.; Fontana, M. A strain-dependent model for the coefficient of friction in the tool-blank interaction in superplastic forming. J. Manuf. Process. 2022, 73, 791–798. [Google Scholar] [CrossRef]
  7. Nursyifaulkhair, D.; Park, N.; Baek, E.R.; Kim, S. Influence of cooling rate on volume fraction of α massive phase in a Ti-6Al-4V alloy fabricated using directed energy deposition. Mater. Lett. 2019, 257, 126671. [Google Scholar] [CrossRef]
  8. Luo, S.; Yao, J.; Zou, G.; Li, J.; Jiang, J.; Yu, F. Transformation characteristics of temperature and phases within Ti-6Al-4V aeroengine drum in hot forging and air cooling procedures. J. Mater. Res. Technol. 2020, 9, 8235–8244. [Google Scholar] [CrossRef]
  9. Han, X.; Yang, J.; Li, J.; Wu, J. Investigation of the Flow Behavior of Air-Cooling Ti-6Al-4V Alloy after Superplastic Forming. Crystals 2022, 12, 294. [Google Scholar] [CrossRef]
  10. Wu, J.; Guo, R. Constitutive behavior for quenching of Al-Cu-Mg alloy with consideration of precipitation. J. Eng. Mater. Technol. Trans. ASME 2018, 140, 041009. [Google Scholar] [CrossRef]
  11. Bodunrin, M.O. Flow stress prediction using hyperbolic-sine Arrhenius constants optimised by simple generalised reduced gradient refinement. J. Mater. Res. Technol. 2020, 9, 2376–2386. [Google Scholar] [CrossRef]
  12. Yang, J.; Wu, J.; Zhang, Q.; Han, R.; Wang, K. The simple hyperbolic-sine equation for superplastic deformation and parameters optimization. J. Mater. Res. Technol. 2020, 9, 10819–10829. [Google Scholar] [CrossRef]
  13. Yang, J.; Wu, J.; Zhang, Q.; Ren, Y.; Ruolan, H.; Wang, K. Linear analysis of parameters in Arrhenius model for Ti-6Al-4V at superplastic forming. Eng. Comput. 2020, 38, 2528–2551. [Google Scholar] [CrossRef]
  14. Alabort, E.; Putman, D.; Reed, R.C. Superplasticity in Ti-6Al-4V: Characterisation, modelling and applications. Acta Mater. 2015, 95, 428–442. [Google Scholar] [CrossRef] [Green Version]
  15. Yasmeen, T.; Zhao, B.; Zheng, J.H.; Tian, F.; Lin, J.; Jiang, J. The study of flow behavior and governing mechanisms of a titanium alloy during superplastic forming. Mater. Sci. Eng. A 2020, 788, 139482. [Google Scholar] [CrossRef]
  16. TAYLOR, S.; WEST, G.D.; MOGIRE, E.; TANG, F.; KOTADIA, H.R. Superplastic forming characteristics of AZ41 magnesium alloy. Trans. Nonferrous Met. Soc. China 2021, 31, 648–654. [Google Scholar] [CrossRef]
  17. Chandrappa, K.; Sumukha, C.S.; Sankarsh, B.B.; Gowda, R. Superplastic forming with diffusion bonding of titanium alloys. Mater. Today Proc. 2019, 27, 2909–2913. [Google Scholar] [CrossRef]
  18. Yasmeen, T.; Shao, Z.; Zhao, L.; Gao, P.; Lin, J.; Jiang, J. Constitutive modeling for the simulation of the superplastic forming of TA15 titanium alloy. Int. J. Mech. Sci. 2019, 164, 105178. [Google Scholar] [CrossRef]
  19. Lin, Y.C.; Chen, M.S.; Zhong, J. Constitutive modeling for elevated temperature flow behavior of 42CrMo steel. Comput. Mater. Sci. 2008, 42, 470–477. [Google Scholar] [CrossRef]
  20. Hollomon, H.; Zener, C. Effect of Strain Rate Upon Plastic Flow of Steel. J. Appl. Phys. 1944, 15, 22–32. [Google Scholar]
  21. Sellars, C.M.; McTegart, W.J. On the mechanism of hot deformation. Acta Metall. 1966, 14, 1136–1138. [Google Scholar] [CrossRef]
  22. Peng, W.; Zeng, W.; Wang, Q.; Yu, H. Comparative study on constitutive relationship of as-cast Ti60 titanium alloy during hot deformation based on Arrhenius-type and artificial neural network models. Mater. Des. 2013, 51, 95–104. [Google Scholar] [CrossRef]
  23. Mosleh, A.; Mikhaylovskaya, A.; Kotov, A.; Pourcelot, T.; Aksenov, S.; Kwame, J.; Portnoy, V. Modelling of the superplastic deformation of the near-a titanium alloy (Ti-2.5AL-1.8MN) using arrhenius-type constitutive model and artificial neural network. Metals 2017, 7, 568. [Google Scholar] [CrossRef] [Green Version]
  24. Yang, P.; Liu, C.; Guo, Q.; Liu, Y. Variation of activation energy determined by a modified Arrhenius approach: Roles of dynamic recrystallization on the hot deformation of Ni-based superalloy. J. Mater. Sci. Technol. 2021, 72, 162–171. [Google Scholar] [CrossRef]
  25. Velay, V.; Matsumoto, H.; Vidal, V.; Chiba, A. Behavior modeling and microstructural evolutions of Ti-6Al-4V alloy under hot forming conditions. Int. J. Mech. Sci. 2016, 108–109, 1–13. [Google Scholar] [CrossRef] [Green Version]
  26. Peng, X.; Guo, H.; Shi, Z.; Qin, C.; Zhao, Z. Constitutive equations for high temperature flow stress of TC4-DT alloy incorporating strain, strain rate and temperature. Mater. Des. 2013, 50, 198–206. [Google Scholar] [CrossRef]
  27. Qu, Y.; Wang, M.; Lei, L.; Huang, X.; Wang, L.; Qin, J.; Lu, W.; Zhang, D. Behavior and modeling of high temperature deformation of an α + β titanium alloy. Mater. Sci. Eng. A 2012, 555, 99–105. [Google Scholar] [CrossRef]
  28. Khaleel, M.A.; Zbib, H.M.; Nyberg, E.A. Constitutive modeling of deformation and damage in superplastic materials. Int. J. Plast. 2001, 17, 277–296. [Google Scholar] [CrossRef]
  29. Hu, L.; Lang, M.; Shi, L.; Li, M.; Zhou, T.; Bao, C.; Yang, M. Study on hot deformation behavior of homogenized Mg-8.5Gd-4.5Y-0.8Zn-0.4Zr alloy using a combination of strain-compensated Arrhenius constitutive model and finite element simulation method. J. Magnes. Alloy. 2021. [Google Scholar] [CrossRef]
Figure 1. Schematic diagram of the sandwich structure used for FEM analysis.
Metals 12 00513 g001
Figure 2. Dimensions of the high-temperature tensile test specimen (mm).
Metals 12 00513 g002
Figure 3. A flow chart for the constant strain-rate tensile test.
Metals 12 00513 g003
Figure 4. The flow behavior of a Ti-6Al-4V alloy during air cooling at the following temperatures: (a) 700 °C; (b) 800 °C; (c) 900 °C; (d) 930 °C.
Metals 12 00513 g004
Figure 5. The flow behavior of a Ti-6Al-4V alloy at ε = 0.2 during the air cooling process after superplastic deformation: (a) true stress; (b) strain-rate sensitivity parameter.
Metals 12 00513 g005
Figure 6. Relationship between (a) ln ε ˙ and ln σ , and (b) ln ε ˙ and   σ .
Metals 12 00513 g006
Figure 7. Relationship between l n ε ˙ and   l n [ sin h ( α σ ) ] .
Metals 12 00513 g007
Figure 8. Relationship between l n [ sin h ( α σ ) ] and 1/T.
Metals 12 00513 g008
Figure 9. Dynamic recrystallization during air cooling deformation as measured by EBSD at 700 °C and 10−4/s.
Metals 12 00513 g009
Figure 10. Comparison of the predicted stress with the experimental data at ε = 0.1 before (dotted lines) and after (solid lines) optimization.
Metals 12 00513 g010
Figure 11. The hardening law for a Ti-6Al-4V alloy at a strain rate of: (a) 10−2/s; (b) 10−3/s; (c) 10−4/s.
Metals 12 00513 g011
Figure 12. Fitting results for (a) k; (b) b.
Metals 12 00513 g012
Figure 13. Comparison between the experimental data and the predicted stresses from the constitutive model with strain compensation.
Metals 12 00513 g013
Figure 14. The results of an FEM analysis for the air cooling process with respect to: (a) temperature; (b) equivalent strain; (c) displacement.
Metals 12 00513 g014
Figure 15. The evolution of selected points by FEM analysis: (a) temperature at points A–C; (b) displacement at points A and B.
Metals 12 00513 g015
Table 1. Summary of nomenclature.
NomenclatureDescriptionsNomenclatureDescriptions
SPF/DBSuperplastic forming/diffusion bonding σ True stress
ε ˙ Strain rate ε True strain
F Loading force A 0 Initial cross-sectional area
L 0 Initial gauge length Δ L Elongation
m Strain-rate sensitivity parameters Z Zener–Hollomon parameter
Q Deformation active energy T Temperature
RGas constant n h Strain stress ratio
Table 2. Chemical composition of the Ti-6Al-4V alloy.
Chemistry (wt.%)TiAlVC
Ti-6Al-4V88.315.594.851.25
Table 3. Flow stress data from the tensile tests at ε = 0.1 .
Temperature (°C) ε ˙ ( s 1 )
10 2 10 3 10 4
93056.9226.8411.91
90076.1736.7813.35
800171.49109.8647.96
700297.58230.84136.6
Table 4. Determination results for n, β and α .
Parameter930 °C900 °C800 °C700 °CMean Value
n 2.942.623.515.693.69
β 0.0990.0720.0370.0280.059
α = β / n 0.016
Table 5. Calculated results for η .
Parameter930 °C900 °C800 °C700 °CMean Value
η 2.722.332.071.762.22
Table 6. Determination results for K .
Parameter10−2 s−110−3 s−110−4 s−1Mean Value
K 20,534.8919,483.7716,370.9518,796.54
Table 7. Calculation results for l n A 3 .
Strain Rate (s−1)930 °C900 °C800 °C700 °C
10−230.0330.0529.7929.30
10−329.6329.7629.7329.37
10−429.1929.8230.1030.44
Mean value29.77
Table 8. Calculation results for the material constants of the constitutive model.
n β α η K Q l n A 3 A 3
3.690.0590.0162.2218,796.53347.3929.778.48 × 1012
Table 9. The optimized material constants for the constitutive model.
α η Q A 3
Before optimization0.0162.22347.398.48 × 1012
After optimization0.0360.44351.931.11 × 1013
Table 10. Values for k from Equation (10).
Strain Rate (s−1)700 °C800 °C900 °C930 °CMean Values
10−2−0.85 −0.84 −0.86 −0.83 −0.85
10−3−0.99 −0.76 −0.61 −0.48 −0.71
10−4−0.71 −0.59 0.12 0.54 −0.16
Table 11. Values for b from Equation (10).
Strain Rate (s−1)700 °C800 °C900 °C930 °CMean Values
10−21.10 1.07 1.04 1.03 1.06
10−31.10 1.03 1.02 1.03 1.04
10−41.04 1.01 1.02 1.00 1.02
Table 12. Values for the coefficients of kk, bk, kb, and bb.
k k b k k b b b
Values−0.15−1.590.00921.10
Publisher’s Note: MDPI stays neutral with regard to jurisdictional claims in published maps and institutional affiliations.

