Article

Thermal Stability of Microstructure of High-Entropy Alloys Based on Refractory Metals Hf, Nb, Ta, Ti, V, and Zr

1
Department of Low Temperature Physics, Charles University, V Holešovičkách 2, Prague 8, 180 00 Prague, Czech Republic
2
Institute of Plasma Physics CAS, Meterials Engineering Department, Za Slovankou 3, 182 00 Prague, Czech Republic
3
Department of Physics of Materials, Charles University, Ke Karlovu 5, 121 16 Prague, Czech Republic
4
Centrum Výzkumu Řež s.r.o., Hlavní 130, 250 68 Husinec, Czech Republic
*
Author to whom correspondence should be addressed.
Metals 2022, 12(3), 394; https://doi.org/10.3390/met12030394
Submission received: 30 January 2022 / Revised: 21 February 2022 / Accepted: 22 February 2022 / Published: 24 February 2022
(This article belongs to the Section Entropic Alloys and Meta-Metals)

Abstract

:
In the present work, a series of high-entropy alloys based on refractory metals Hf, Nb, Ta, Ti, V, and Zr with various compositions have been systematically investigated. Our study revealed that a bcc single-phase solid solution of a Hf-Nb-Ta-Ti-V-Zr system is thermodynamically stable only at high temperatures above 1000 °C. At lower temperatures, the phase separation into disordered bcc phases with slightly different chemical compositions occurs. Despite the phase separation, a single-phase random solid solution can be saved at room temperature as a metastable phase by rapid cooling of the sample from high temperature. The microstructure of a single-phase metastable random solid solution was characterized and compared with the microstructure of the as-cast state. Furthermore, the mechanical properties of annealed and as-cast alloys were compared. Interestingly, both states exhibit comparable mechanical properties. It indicates that from the point of view of practical applications, a mechanical mixture of disordered bcc solutions is as good as single-phase random solid solution.

1. Introduction

High-entropy alloys (HEAs) represent a new concept in the design of alloys focused on concentrated solid solutions of multiple elements [1,2]. HEAs are defined as solid solutions consisting of at least five alloying elements each with the concentration between 5 and 35 at % [3]. Conventional alloys are usually diluted solid solutions consisting of one or two principal elements with minor additions of other alloying elements in order to improve the alloy properties. In contrast, HEAs are concentrated solid solutions of multiple elements. The basic idea of the HEA approach is to explore the central region of a multi-component alloy phase space [4]. The majority of HEAs have a cubic structure (face cubic centered (fcc) or base cubic centered (bcc)) [1], although a few HEAs with hexagonal close packed (hcp) structures have been reported as well [5]. There are several HEA ‘families’ with similar structures: (i) 3d transition metal HEAs with fcc structures consisting of Al, Co, Cr, Cu, Fe, Mn, Ni, Ti, and V elements [3,4,6]; (ii) refractory metal HEAs with the bcc structure, containing Cr, Hf, Mo, Nb, Ta, Ti, V, W, and Zr with the possible addition of Al [7,8,9]; and (iii) lanthanide 4f HEAs with hcp structures consisting of Dy, Gd, Lu, Tb, Tm, and Y [5].
Atoms of alloying elements are distributed randomly over lattice sites of HEA. Such a random solid solution is characterized by a high value of configurational entropy, which represents a key feature of HEAs [1,2,3]. In addition, differences in the atomic radii of various elements lead to local distortions of HEAs crystalline lattice [1,2,3,6]. High configurational entropy and local distortions of crystalline lattice represent inherent features of HEAs and have a strong influence on their physical properties [1,2,3].
It has been reported that many HEAs exhibit excellent mechanical properties including enhanced strength [8,9,10,11,12,13], high ductility at low temperatures [14,15], or increased creep resistance [16]. In addition, HEAs are characterized by high-temperature stability [17] and excellent corrosion resistance [18]. These favorable properties make HEAs attractive materials for structural applications in particular at high temperatures [7]. Moreover, some HEAs exhibit unique functional properties such as superconductivity [19], giant magnetocaloric effect [20], or high hydrogen storage capacity [21,22,23]. In addition, recent investigations [24,25,26,27] revealed that HEAs exhibit very good resistance against radiation damage. Radiation-induced swelling [28] and irradiation-induced segregation near grain boundaries [29,30] was found to be significantly suppressed in ion-irradiated HEAs. Due to these reasons, HEAs represent promising materials for applications in a radioactive environment, e.g., in nuclear reactors [24].
More generally, concentrated solid solutions of multiple elements are called complex concentrated alloys (CCAs) [1]. The concept of CCAs is very flexible, and plenty of configurations with different physical properties can be developed. As a result of a huge number of possible combinations of alloying elements, it is definitely impossible to explore all CCAs experimentally. Therefore, large effort is put to finding some rules that can predict the properties of CCAs for specific composition.

2. Materials and Methods

Refractory metal CCAs are composed of elements from IV, V, and VI groups of the periodical element table [7,8,9,31]. Refractory metals exhibit high melting points, and most of them have good mutual miscibility. As a consequence, refractory metal CCAs represent attractive materials for use in harsh environments [32,33,34] and in high-temperature structural applications [1,7,8]. In addition, some refractory metal CCAs are considered for medical applications [35]. Refractory metal CCAs have usually a bcc structure, which is more open than a closely packed fcc or hcp structure. Recently, it was found that refractory metals CCAs could be excellent materials for hydrogen storage applications [21,22,23] and provide a cheaper alternative to AB5-type intermetallic compounds containing rare Earth elements, e.g., LaNi5.
Owning to their high melting point, refractory metal CCAs are usually prepared by vacuum arc melting, where the alloy ingot placed in a water-cooled crucible is melted by plasma in a protective atmosphere. This method of preparation enables casting relatively easily bulk ingots of refractory metal CCAs. However, the microstructure of cast alloys may be inhomogeneous due to the temperature gradient between the center of the ingot and its edges, which are in direct contact with the cold walls of crucible. As a consequence, the cooling rate in the center of the ingot is slower compared to its edges. Due to these reasons, alloys prepared by arc melting are often subjected to post-treatment consisting of high-temperature annealing in vacuum or in a protective gas atmosphere in order to achieve as homogeneous a microstructure as possible [1].
Nowadays, there is a big effort put into the development of refractory metal CCAs [7,8,9]. Alloys composed of many different combinations of refractory metals have been prepared, and their microstructures as well as physical properties were examined and reported in number of papers, see e.g., reviews [1,7,8] and references therein. Most of these alloys were prepared by arc melting. Some refractory metal CCAs have been investigated in the as-cast state [36,37,38], while other authors applied high-temperature annealing after casting [16,39,40,41]. The majority of refractory metal CCAs in the as-cast state exhibit a characteristic dendritic structure [36,38]. It has been shown that in some cases, high-temperature annealing resulted in the formation of single-phase solid solution [16,41]. However, a comparison of the annealed alloy and the as-cast state is often missing. Moreover, the effect of cooling rate on the microstructure is not known. Hence, there is a lack of systematic investigations of the influence of high-temperature annealing on the microstructure and physical properties of refractory metal CCAs.
In the present work, the microstructure and physical properties of equimolar CCAs based on refractory metals Hf, Nb, Ta, Ti, V, and Zr were investigated. The alloys were prepared by vacuum arc melting. The microstructure of the as-cast state of each alloy and the state after high-temperature annealing were compared.

3. Experimental Details

Refractory metal CCAs with compositions NbTaTiZr, HfNbTaTiZr, HfNbTiVZr, and HfNbTaTiVZr were prepared by vacuum arc melting from metals with purity of 99.99%. Casting was performed in an arc melting system AM200 (Edmund Bühler, Bodelshausen, Germany) equipped with a high-vacuum-pumping system (base pressure 10−7 mbar). Melting was performed in Ar (6.0) protective atmosphere (pressure of 400 mbar). Ingots were placed in a water-cooled copper mold. Each sample was 10 times re-melted and flipped between each re-melting using a vacuum manipulator to ensure good homogeneity. Cast ingots have dimensions approximately 100 × 10 × 5 mm3. Annealing of samples was performed at a temperature of 1200 °C for 2 h. The annealing temperature of 1200 °C was selected on the basis of thermodynamic calculations in Ref. [41]. Annealing was performed in a special vacuum quenching furnace Nabetherm (Nabetherm GMbH, Lilienthal, Germany) in a high vacuum (10−5 mbar). A ceramic vertical tube of the furnace is connected with an evacuated end cap filled with water. During annealing, the end cap is separated from the tube by a gate valve. When annealing is finished, the gate valve is opened, and the sample is dropped into water. The quenching of samples into water ensures a very fast cooling rate. It is important that samples are quenched in vacuum without exposing them to air, since the alloys studied rapidly oxidize at high temperatures.
The microstructure of alloys was examined using a scanning electron microscope (FEI Quanta 200F, FEI Deutschland GmbH, Munich, Germany) equipped with an energy-dispersive spectrometer (EDS) for space-resolved chemical analysis. Phase analysis was performed by X-ray diffraction (XRD) using a diffractometer D8 Discover (Bruker, Billerica, MA, USA) and CuKα radiation. The Rietveld refinement of the XRD pattern was performed by the TOPAS code (Version 7, Brisbane, Australia) [42]. Deformation tensile testing was performed at room temperature with the strain rate of 10−3 s−1 using an Instron 1186 testing machine (Instron, Norwood, MA, USA). Dog bone-shaped tensile test samples with a length of 10.5 mm and diameter of 2 mm were used. Tensile tests were made using three specimens for each sample to ensure good reproducibility of results. Vickers microhardness testing was carried out using an automated hardness tester Durascan (Struers Inc., Cleveland, OH, USA) applying a load of 0.5 kg for 10 s. Hardness was determined by averaging results for 15 indents made for each sample.

4. Results and Discussion
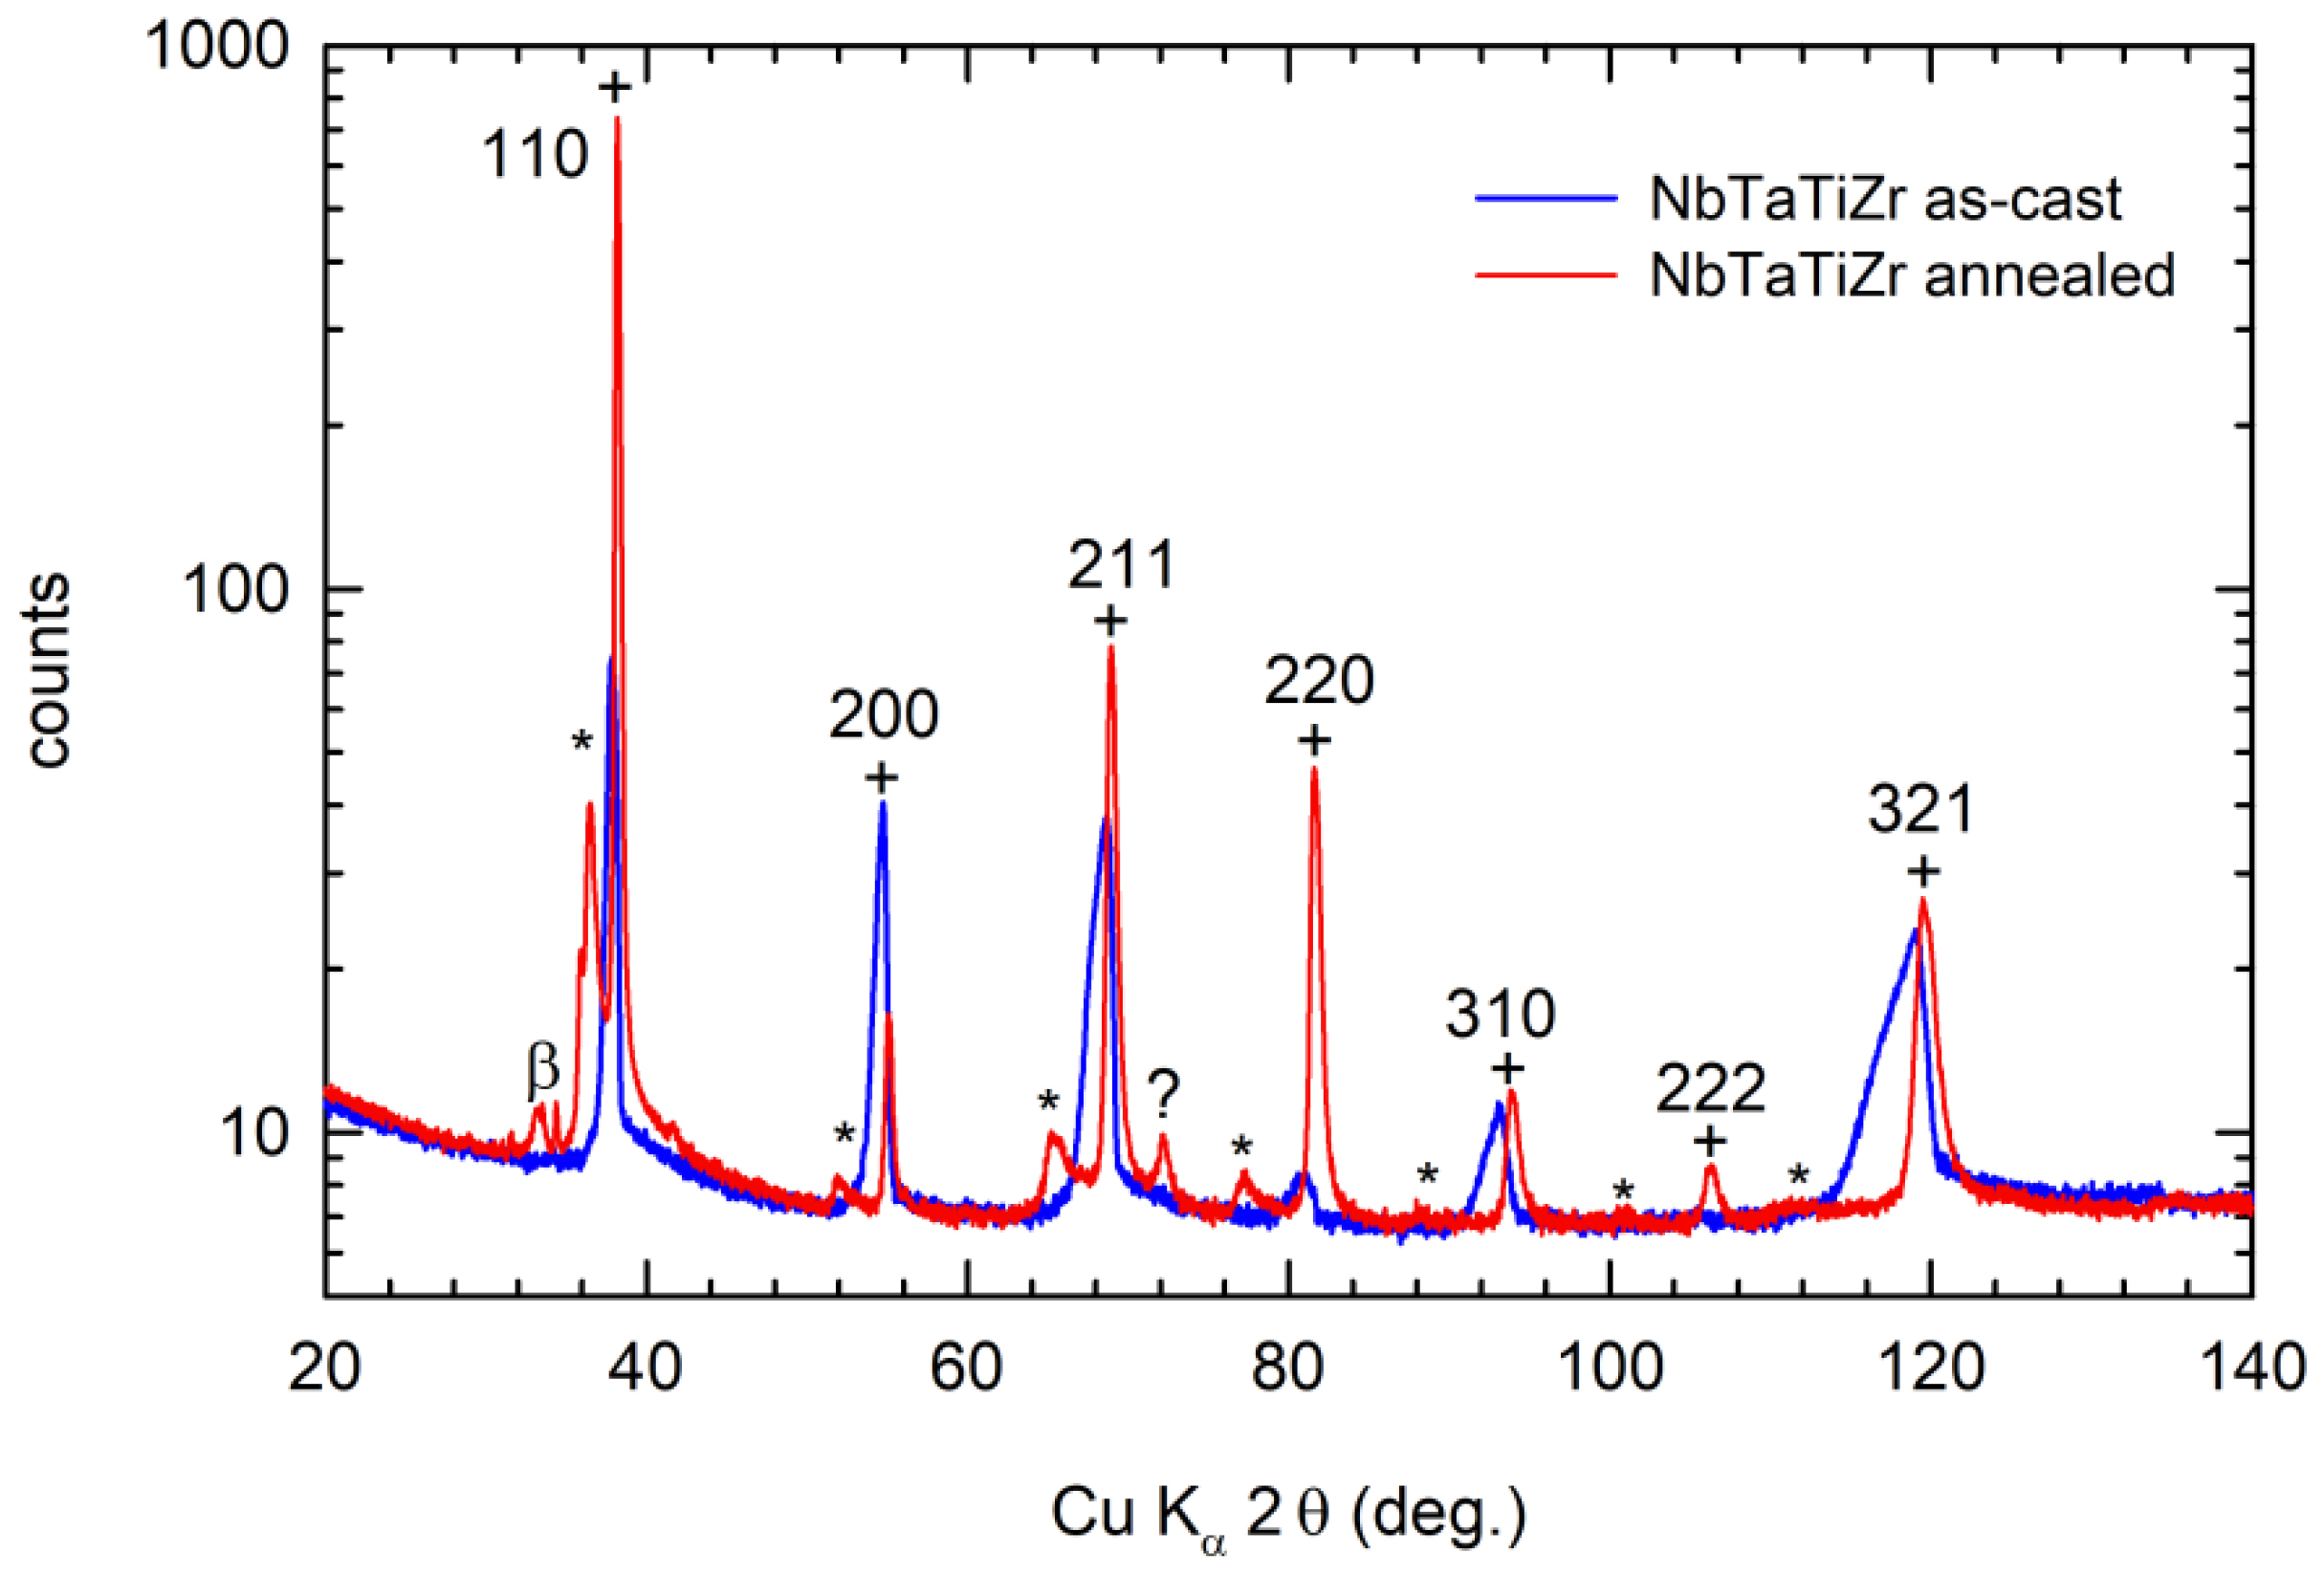
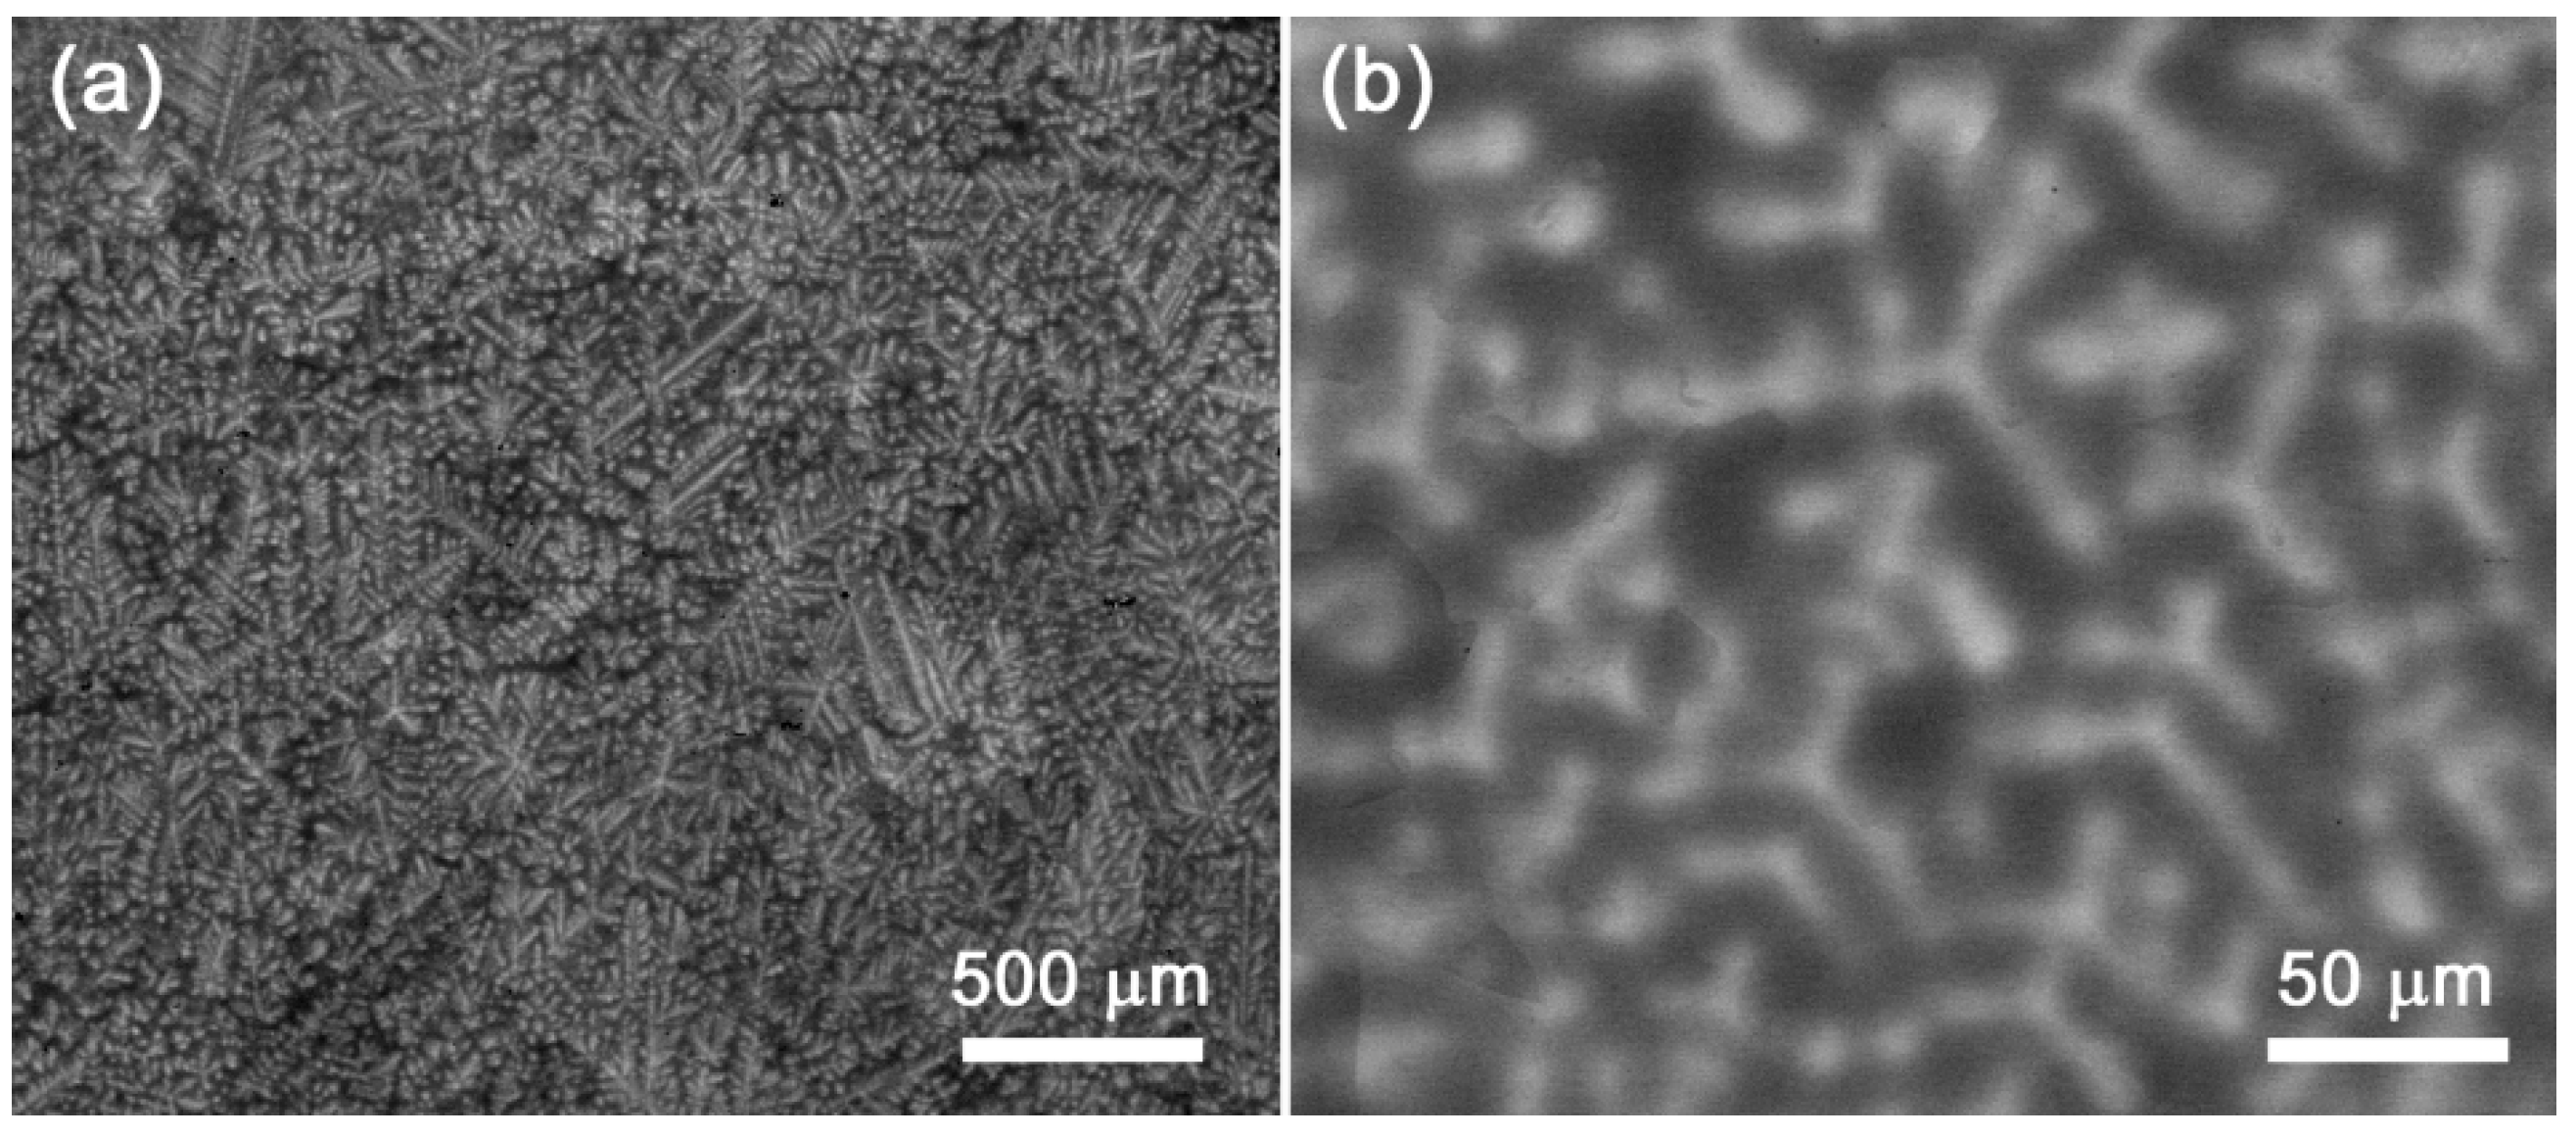
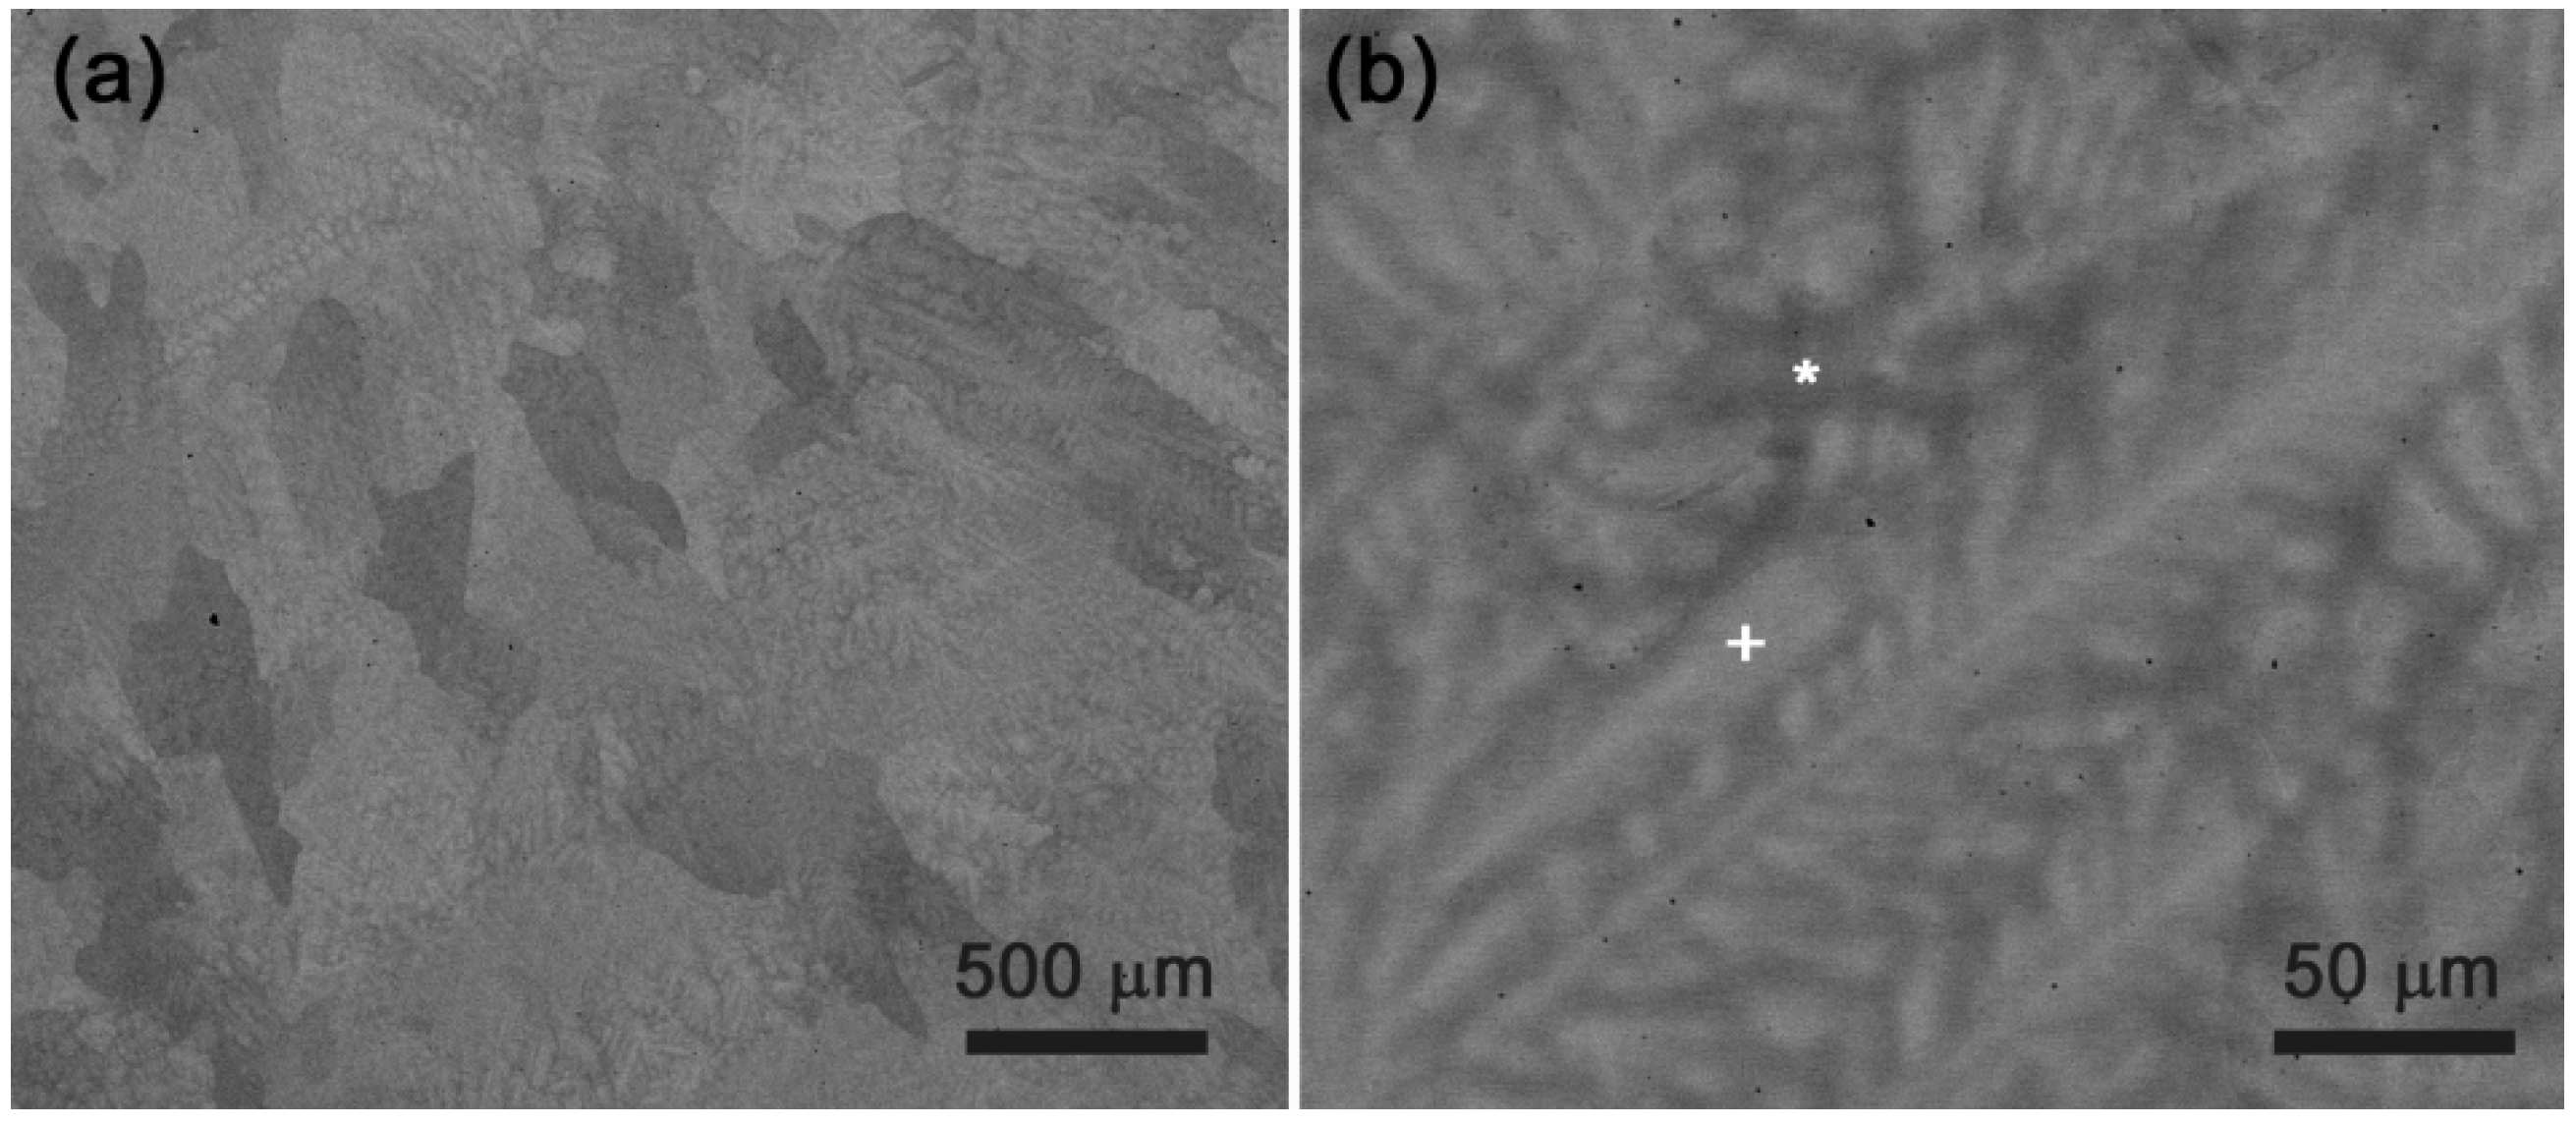
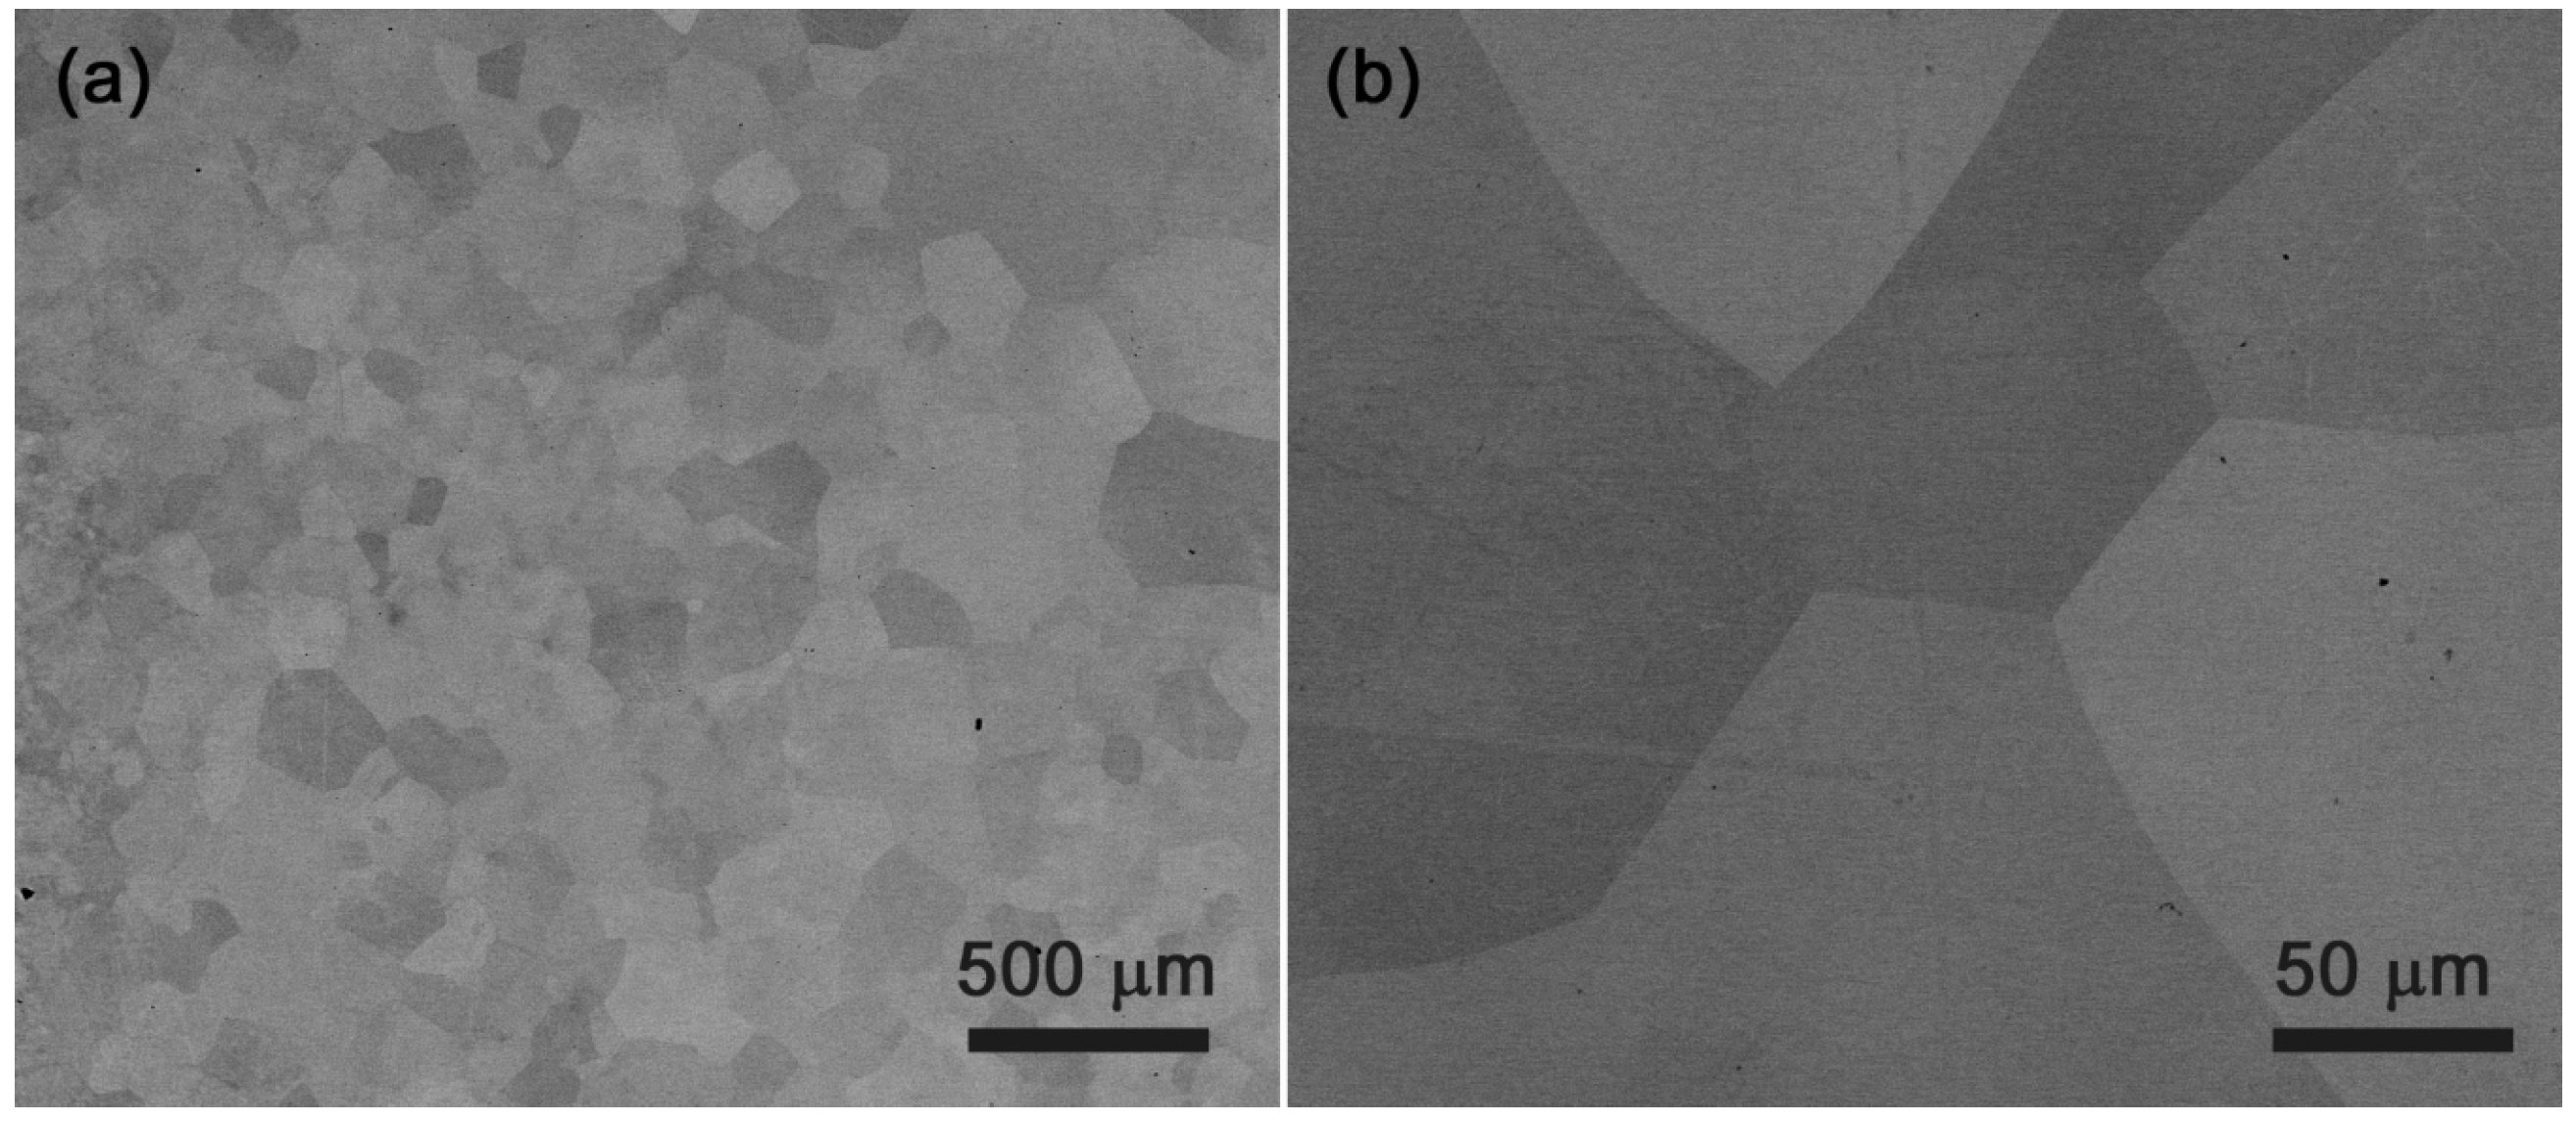
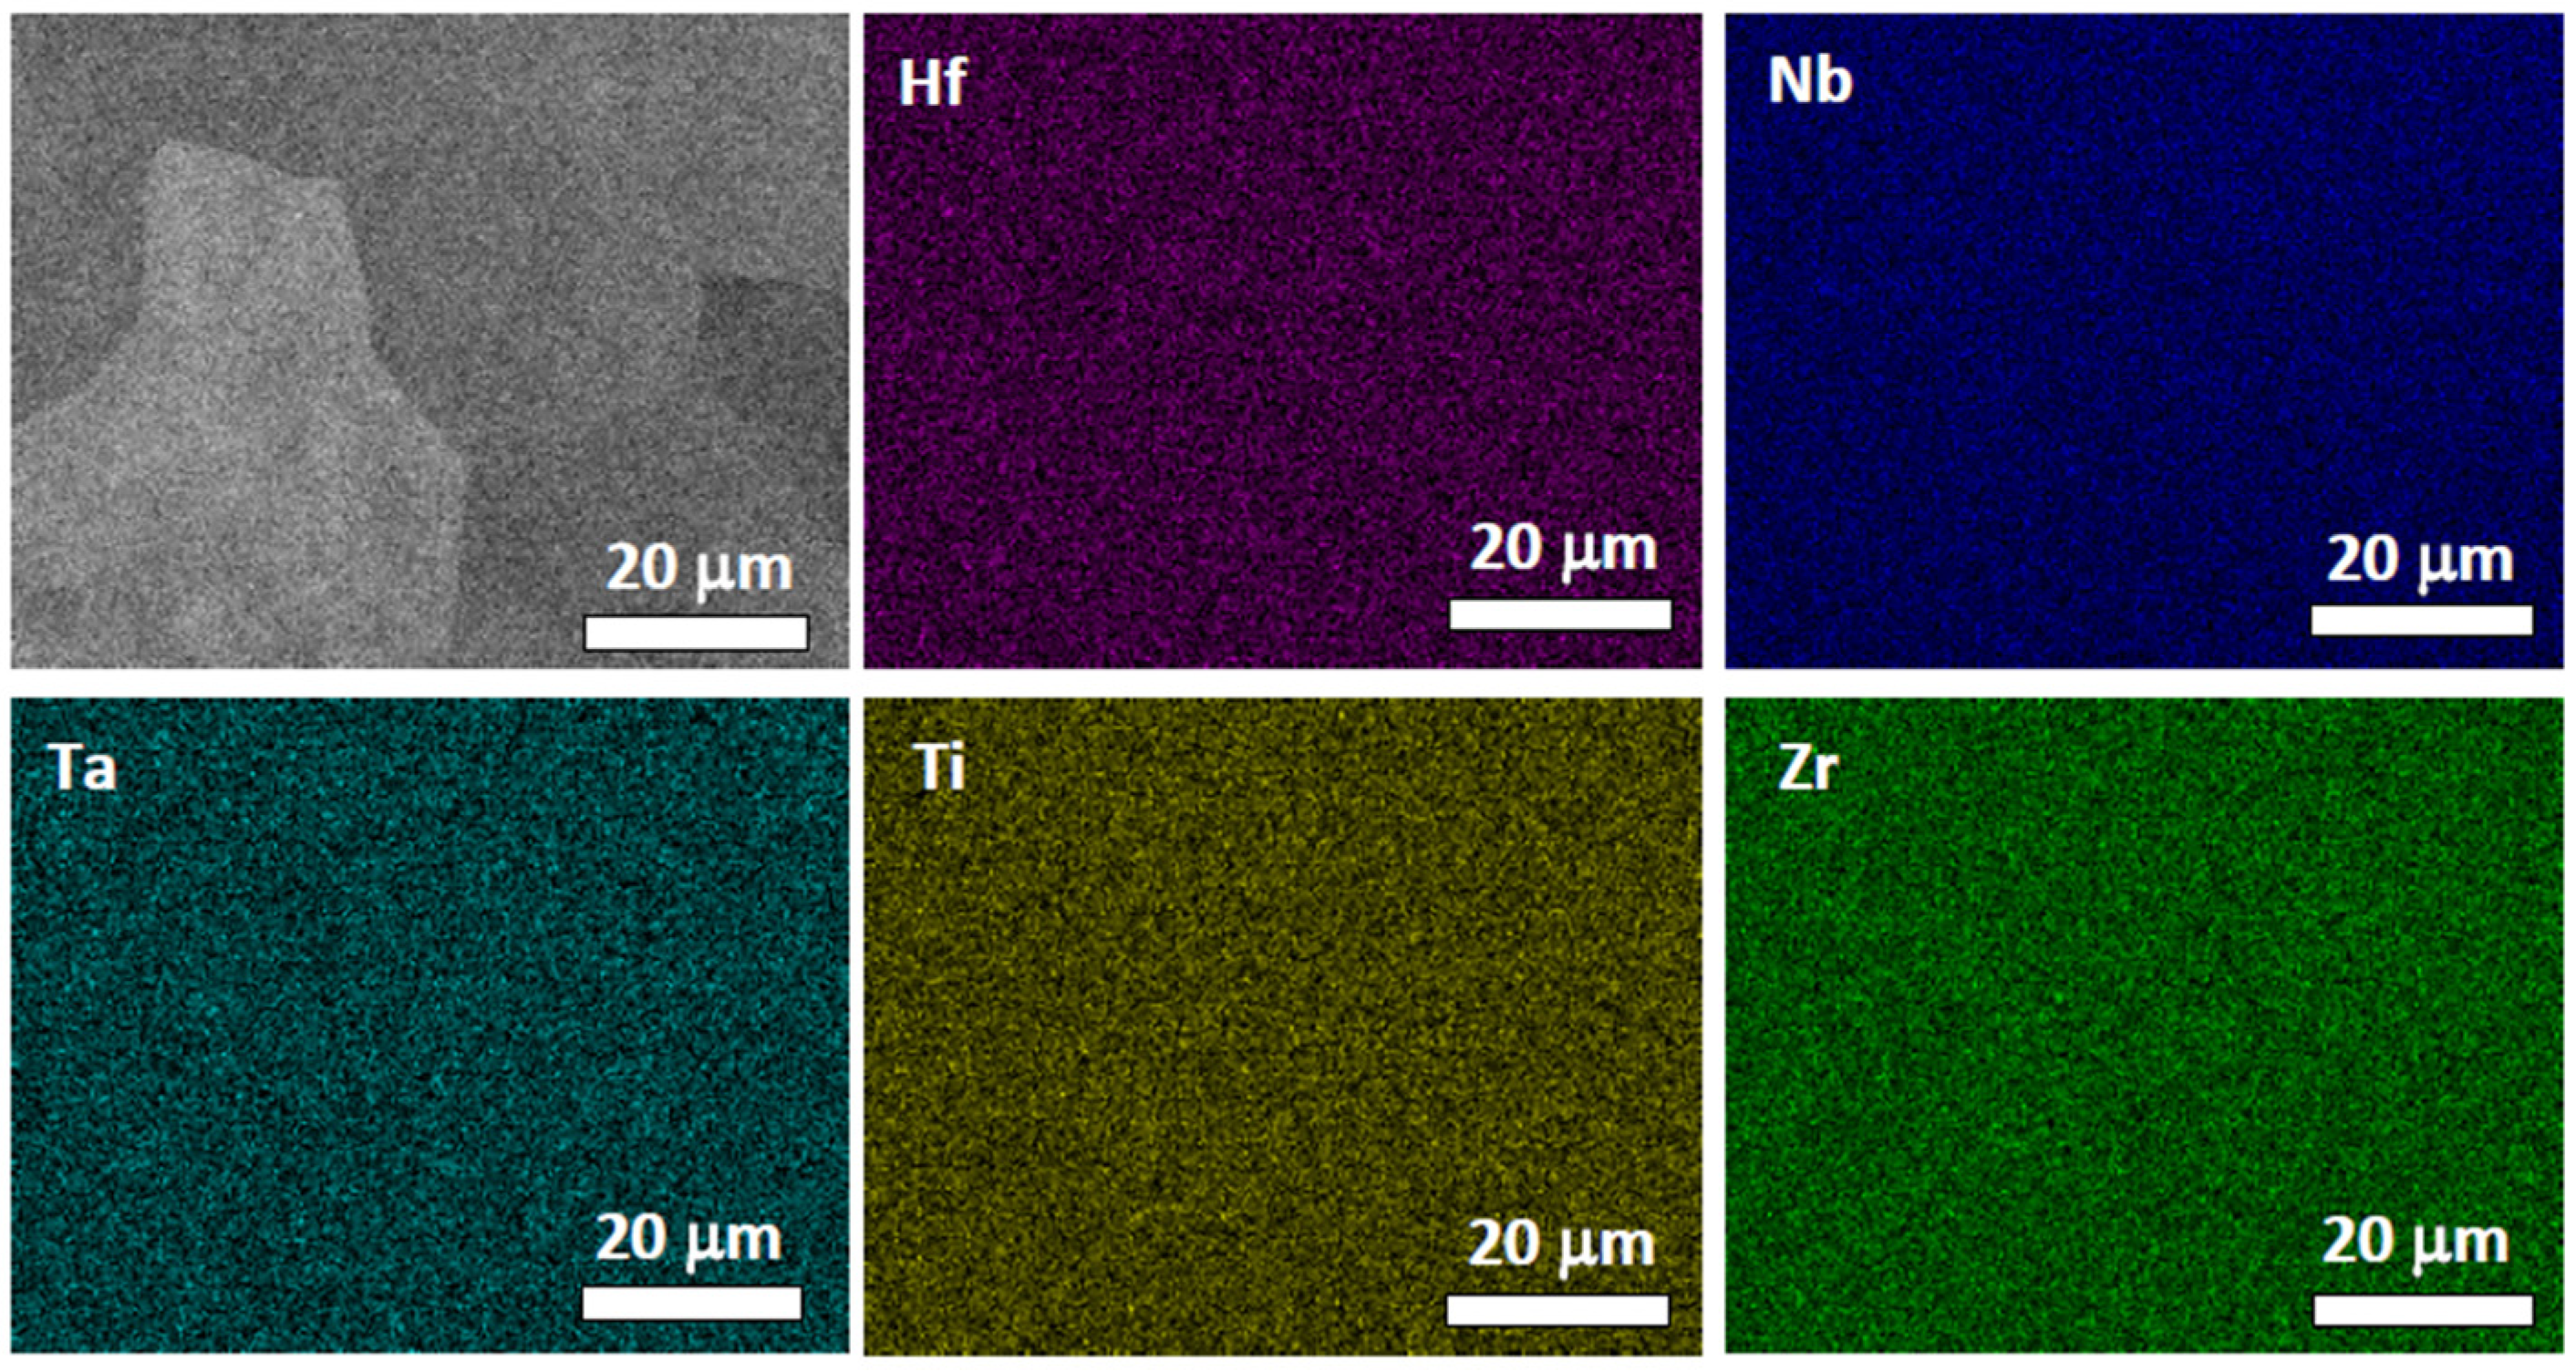
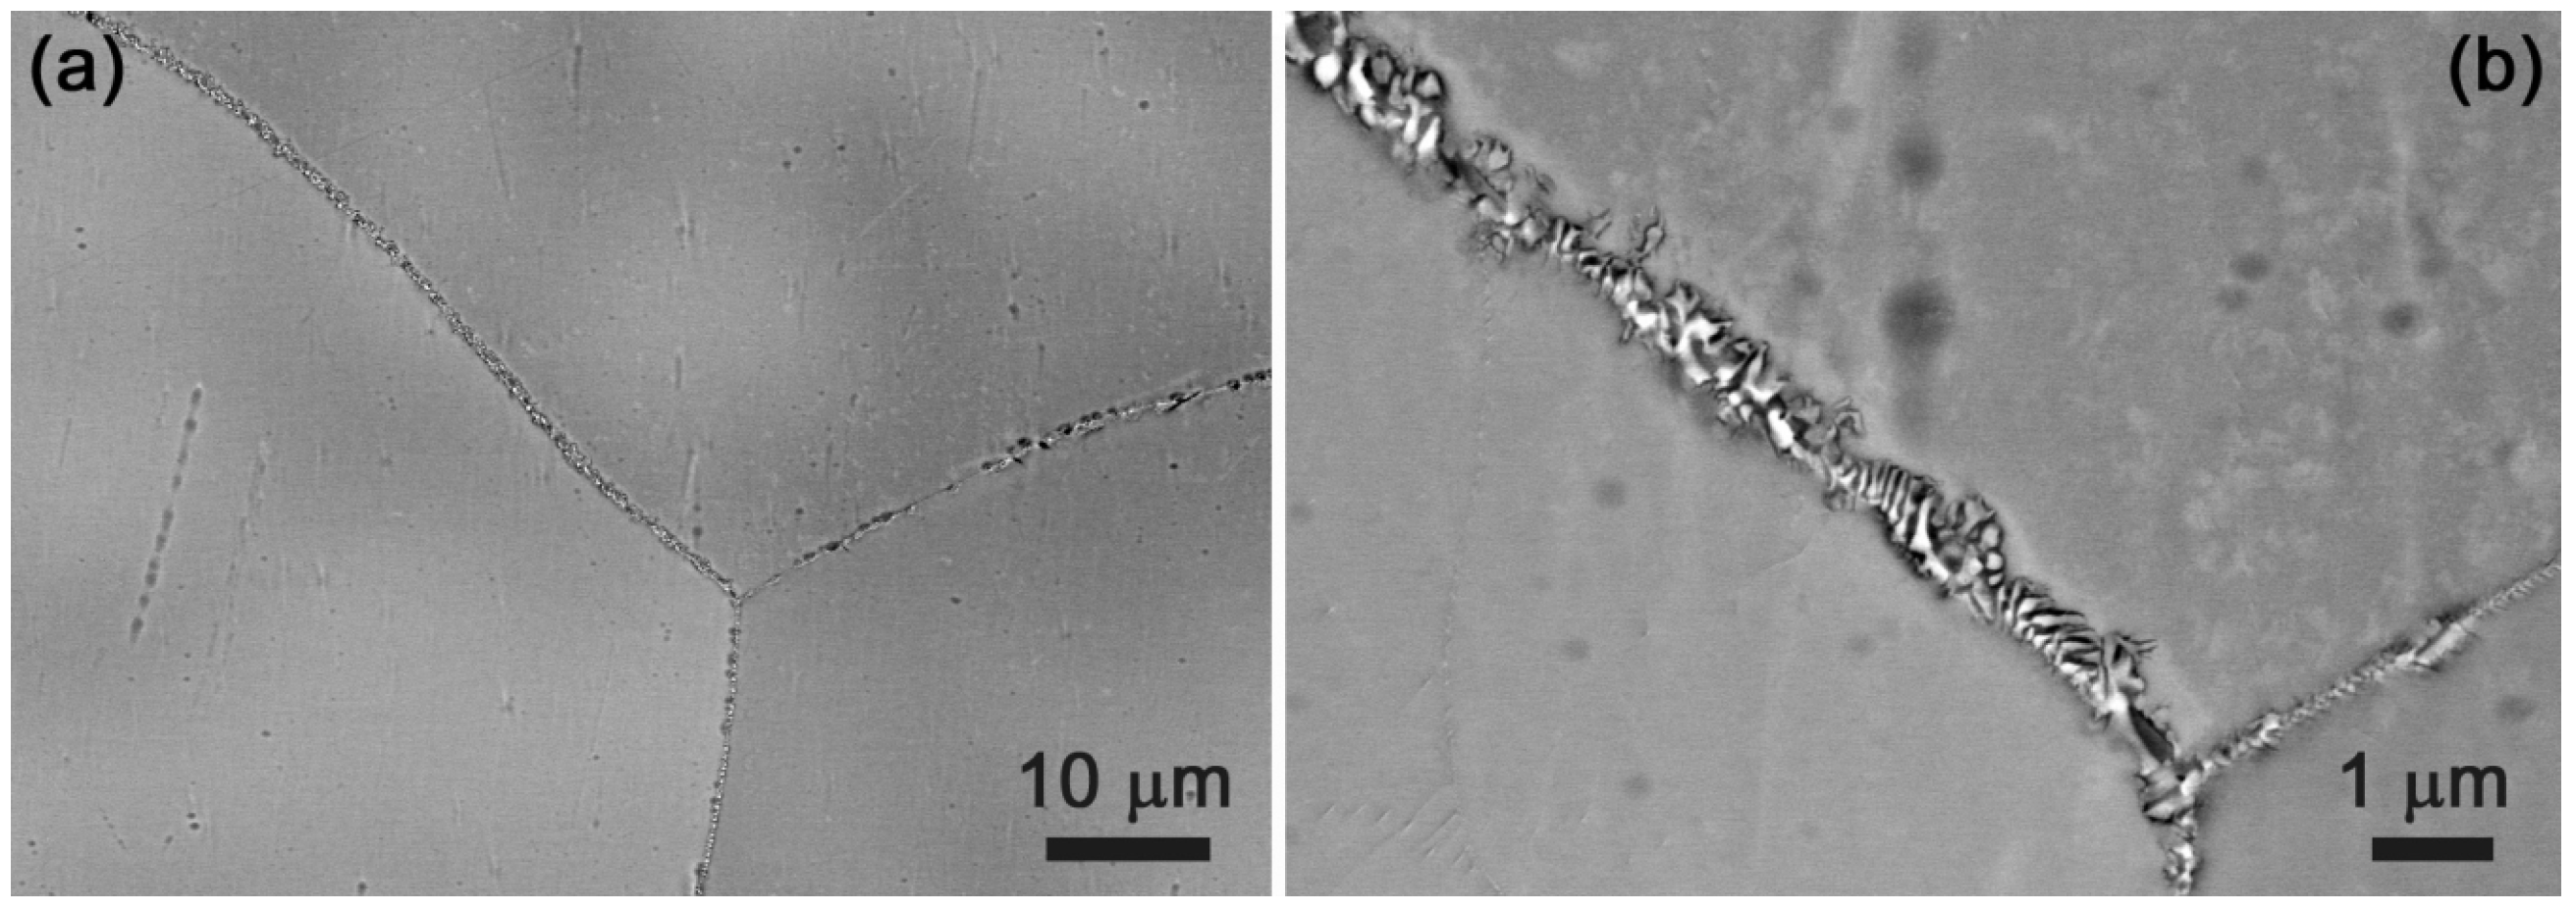
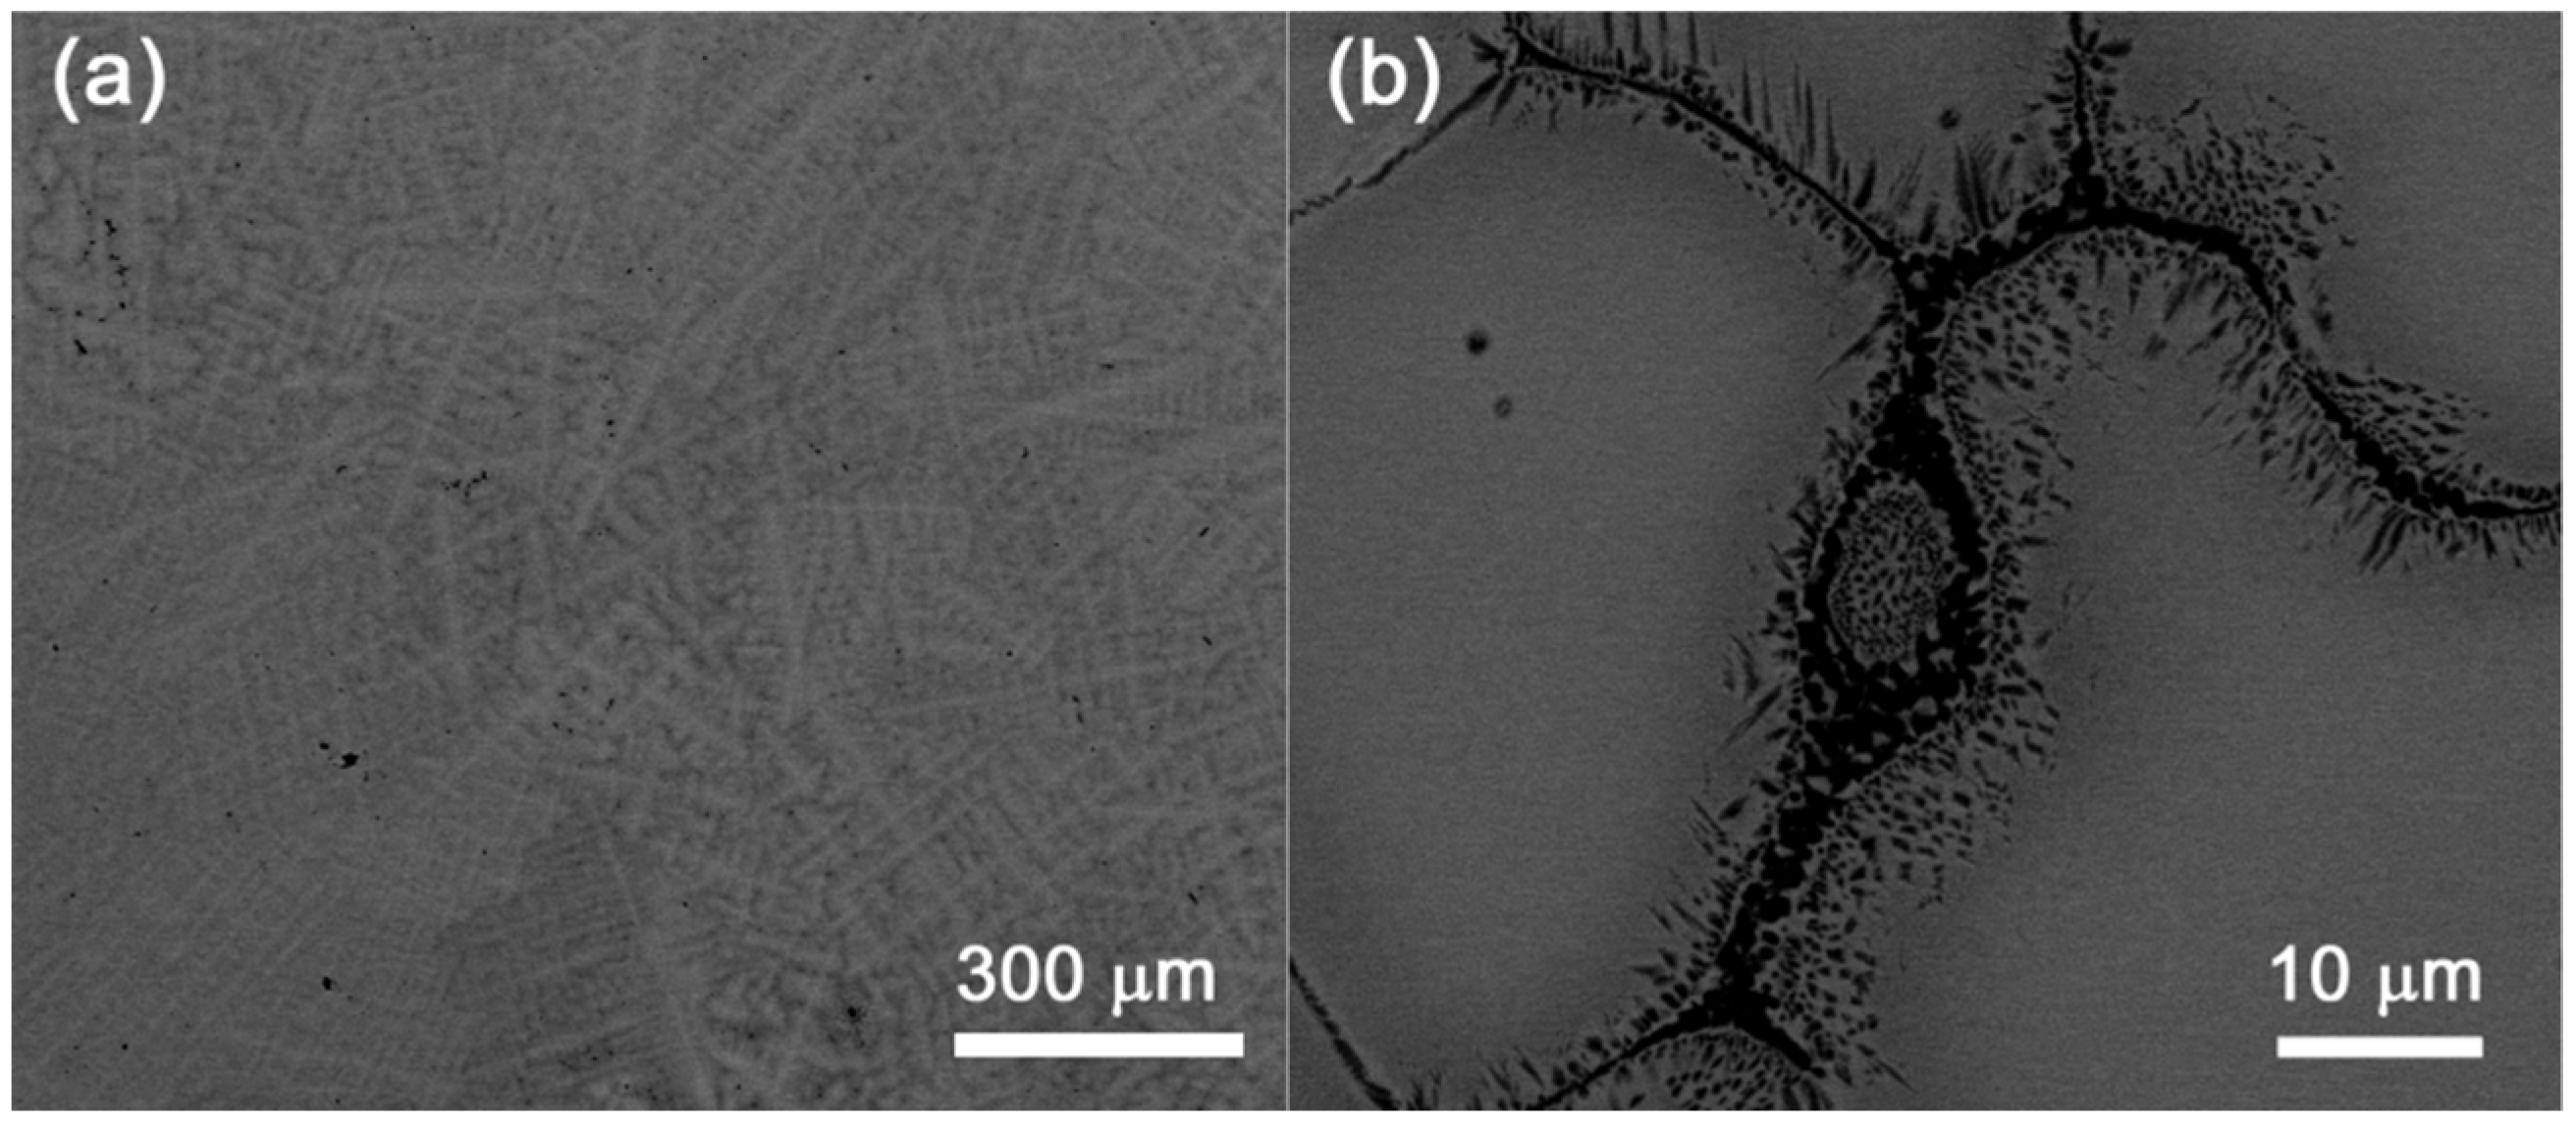
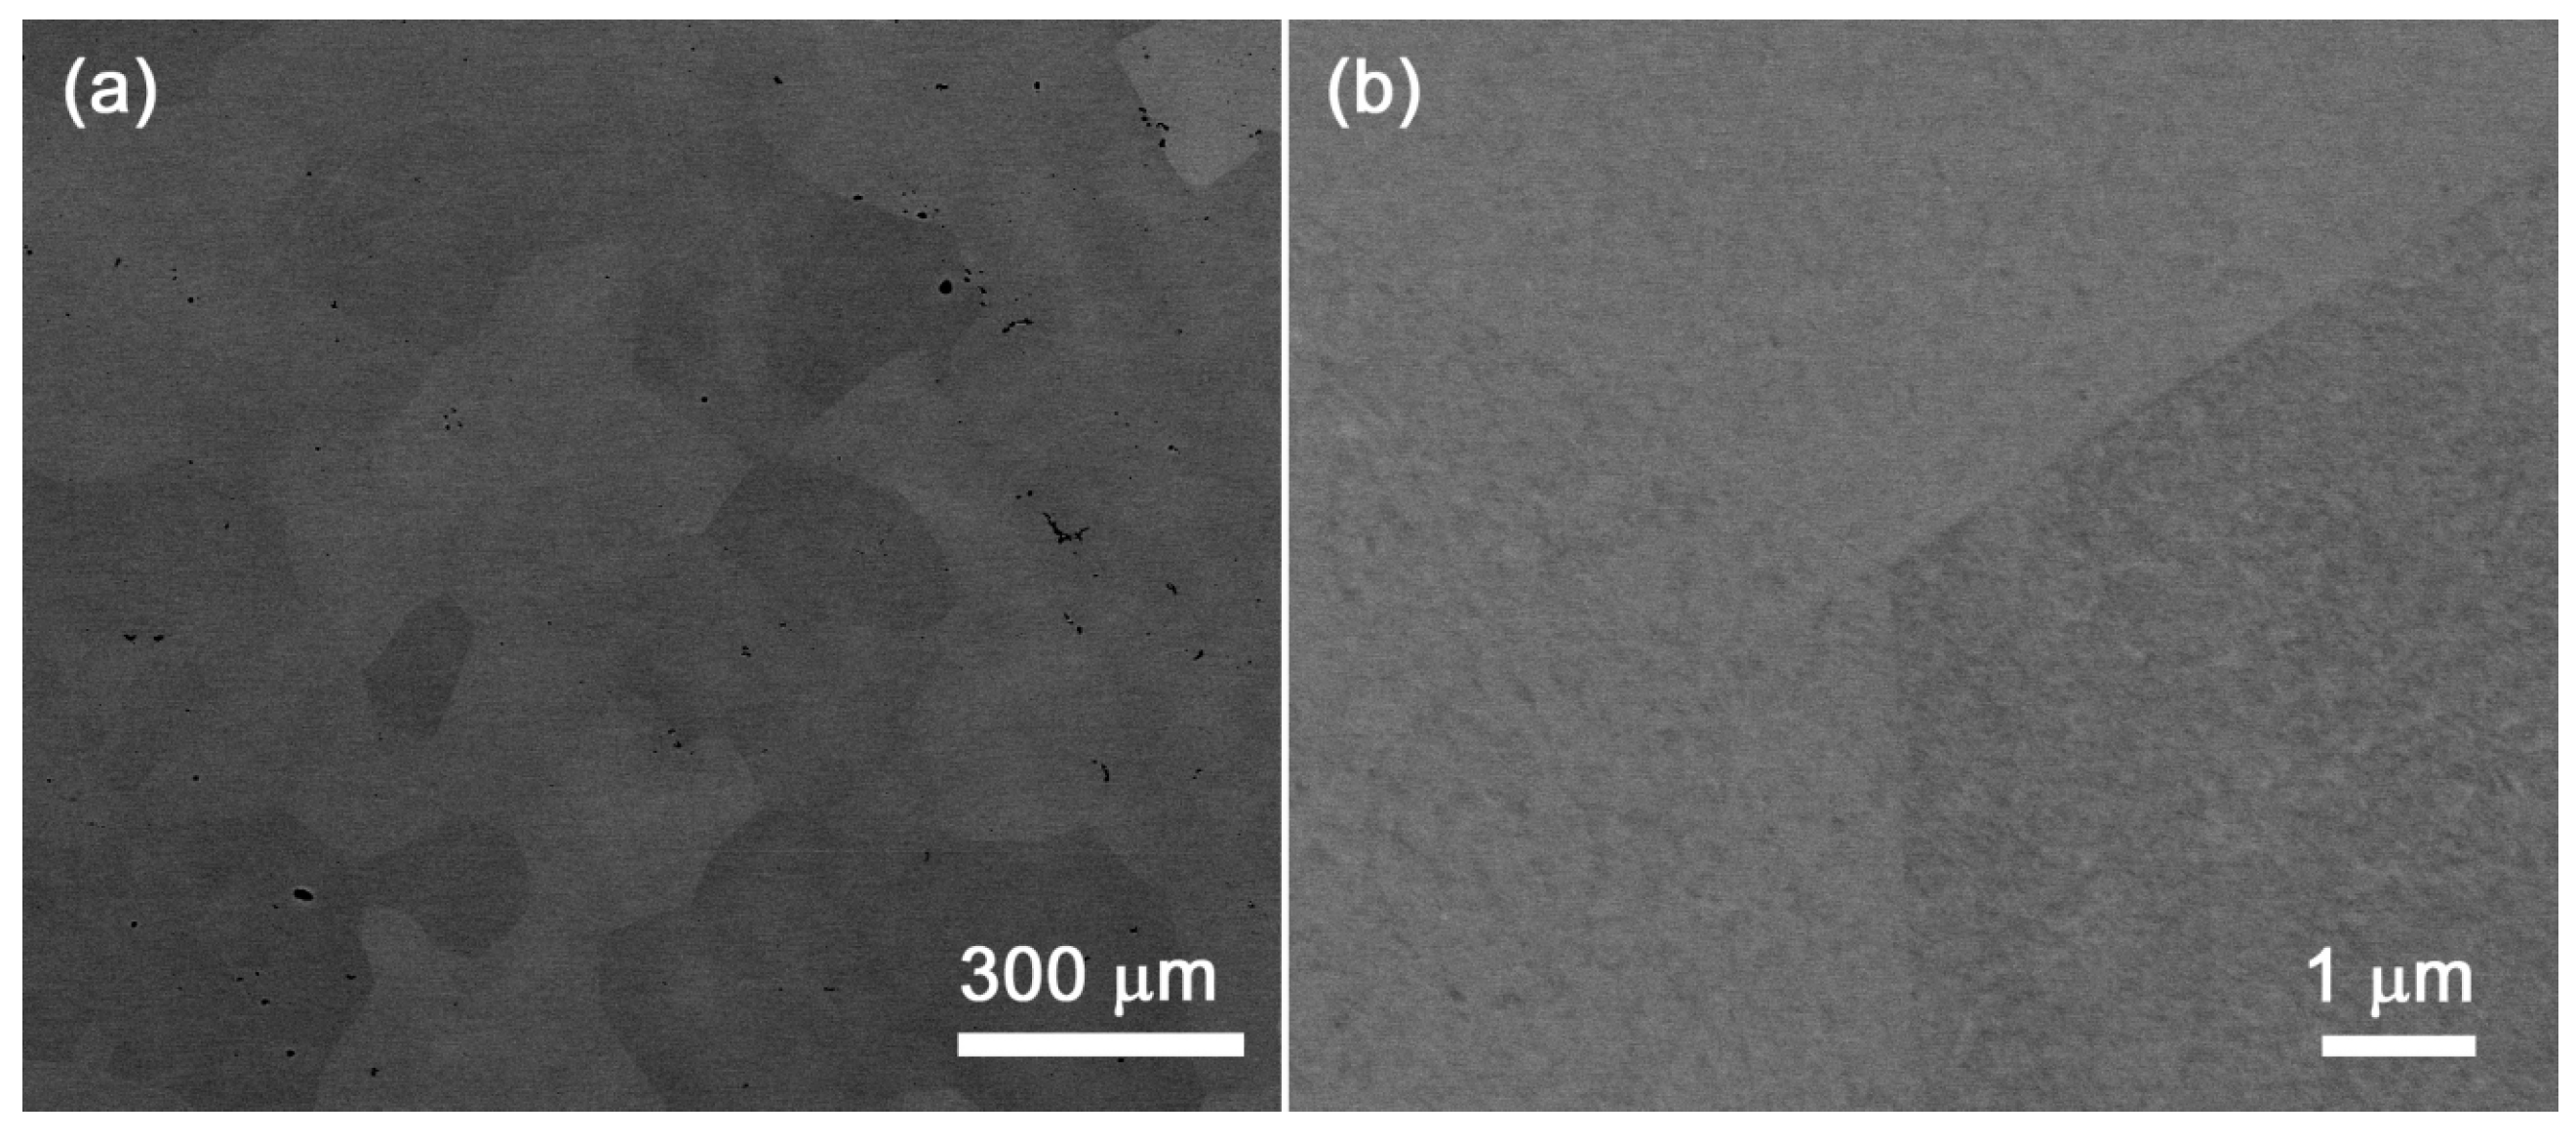
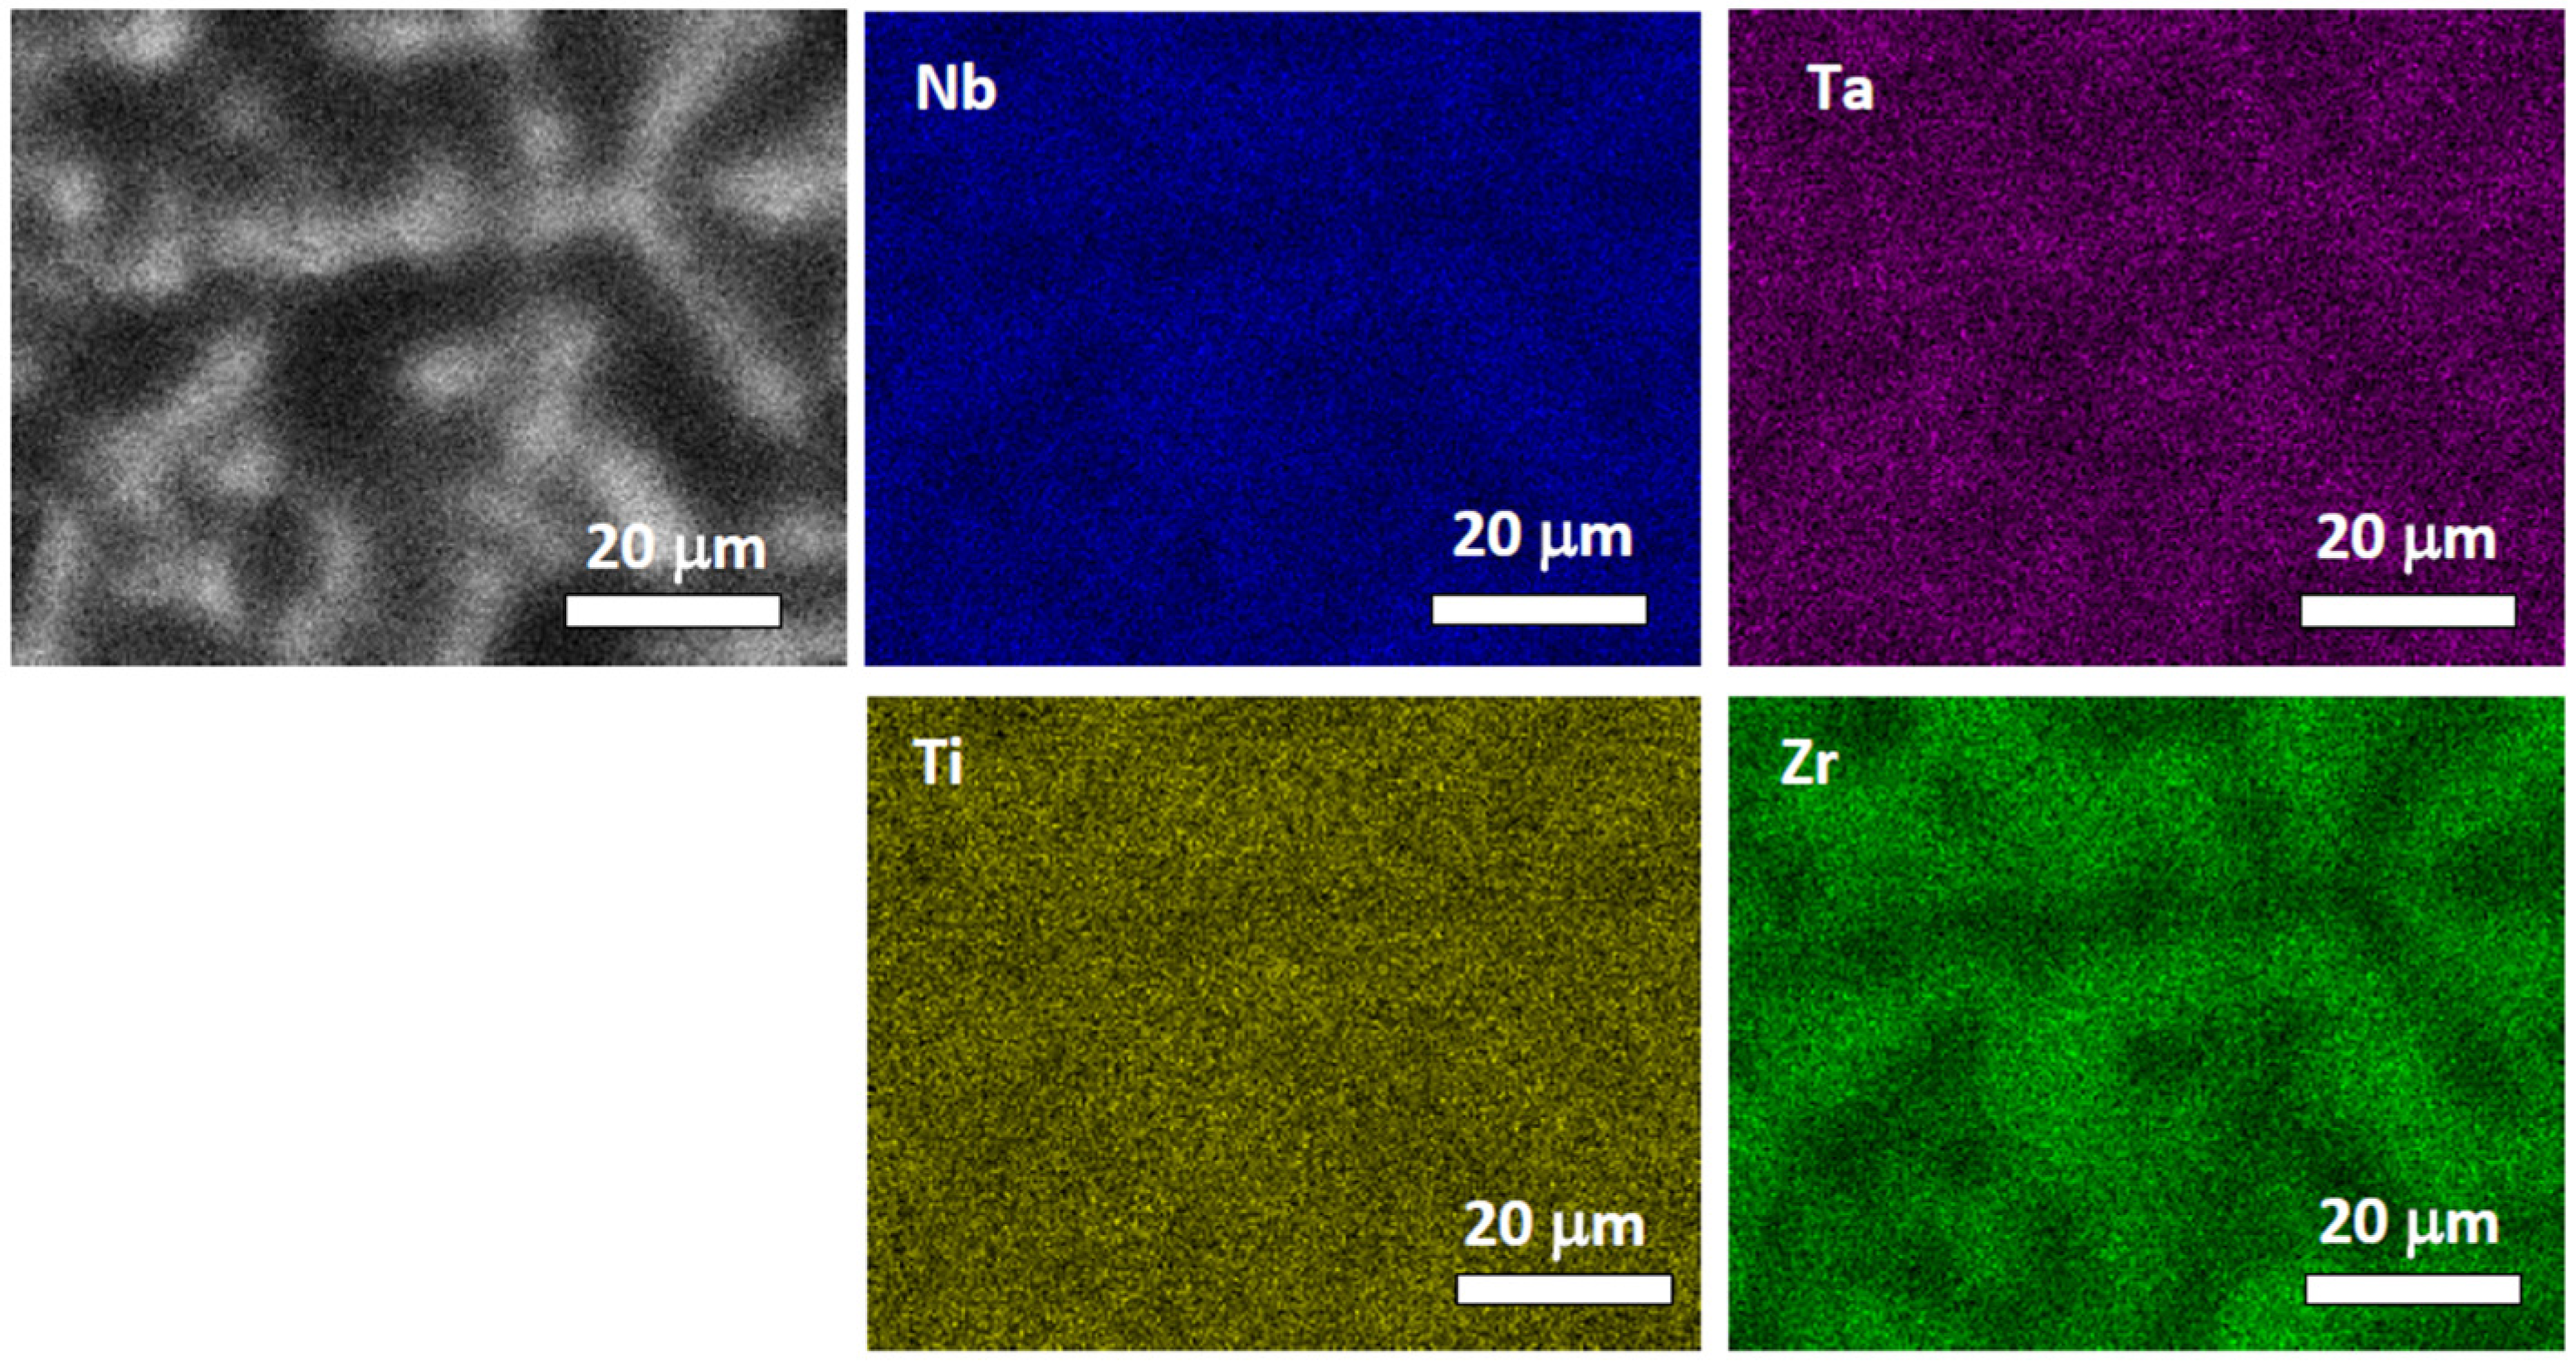
Basic properties of CCAs studies are summarized in Table 1. The chemical composition of alloys determined by EDS agrees with the nominal composition within ± 1 at % representing the uncertainty of EDS measurement.
Since atomic radii differ for various elements, atoms of different elements need various space in the crystalline lattice. As a consequence, the random distribution of atoms of various elements over lattice sites leads to local distortions of the crystalline lattice due to displacements of atoms from the rigid lattice sites depending on their local environment [12]. Hence, the inter-atomic distance in CCAs is not constant but exhibits local fluctuations. Lattice distortions represent an inherent feature of CCAs and play an important role in the unique properties of these materials. The atomic misfit parameter δ [1] can be used as a measure of the difference in the atomic radii of CCAs constituents.
δ = i = 1 N c i ( 1 r i r ¯ ) 2
In the above equation, N is the number of alloying elements, while ci and ri are the atomic concentration and radii of i-th constituent, respectively. The atomic radii of ri of various elements are collected in Table 2 and were calculated as the nearest neighbor distance of atoms in the thermodynamically stable phase of given element under the standard conditions, i.e., bcc structure for Nb, Ta, and V and hcp structure for Hf, Ti, and Zr. The quantity r ¯ stands for the composition weighted average of atomic radii.
r ¯ = i = 1 N c i r i  
From inspection of Table 2, one can conclude that Nb, Ta, and Ti have comparable atomic radii, while Hf and Zr are ‘bigger’ atoms with higher atomic radii and V is a ‘smaller’ atom with a lower atomic radius. Hence, the highest atomic misfit exists between Zr (or Hf) and V. The misfit parameter δ calculated by Equation (1) provides a measure of lattice distortions. It can be expected that the magnitude of lattice distortions increases with the increasing value of the misfit parameter.
The average valence electron concentration (VEC) [43] is listed in Table 1 as well. The CCAs studied are characterized by comparable VEC but exhibit very different values of the misfit parameter δ. Table 1 shows also the configurational molar entropy of a random solid solution S S S = R i = 1 N c i ln c i , which increases with the increasing number of alloy constituents. The enthalpy of mixing of solid solution HSS was calculated from binary heats of solutions using the expression
H S S = i < j 4 H i j c i c j ,  
where Hij are binary heats of solutions calculated using the Midiema’s model [44]. Figure 1 shows a correlation plot of the enthalpy of mixing HSS and the misfit parameter δ for CCAs studied. Clearly, there is a negative correlation between HSS and δ in accordance with the data reported in the literature for other alloys [45,46]. The data for CCAs studied in the present work fall into the region of HSS and δ parameters where the formation of random solid solution is expected [47].

4.1. NbTaTiZr Alloy

The microstructure of NbTaTiZr alloy in the as-cast state is plotted in Figure 2. The microstructure of as-cast ingot is inhomogeneous. On the edge of the ingot (top of Figure 2a), the sample exhibits single-phase solid solution. Deeper in the ingot (bottom of Figure 2a), phase separation occurred, and a typical dendritic microstructure was formed. A similar dendritic microstructure was observed also in the center of the ingot; see Figure 2b. The EDS analysis revealed that the chemical composition at the edge of the sample is uniform; see Figure 2c. Deeper in the ingot, the alloy consists of regions enriched in Nb and Ta (bright regions in Figure 2d), which are separated by dendritic arms rich in Ti and Zr. Hence, the results of scanning electron microscopy (SEM) investigations confirm limited solubility of Nb, Ta, Ti, and Zr elements at room temperature. A single-phase solid solution is metastable at room temperature and remained only at the edge of the ingot, which is in direct contact with the cooled mold, and the melt was cooled with the highest cooling rate there. Hence, in the edge of the ingot, the solutes do not have enough time for the long-range diffusion required for phase separation. Deeper inside the ingot, the cooling rate was not high enough, and single-phase solid solution decomposed into a mixture of two phases: Nb and Ta-rich phase, which appears brighter in SEM images (Figure 2) due to the higher average Z number and Ti and Zr-rich phase, which appears darker. The composition of both phases was determined as an average value of five EDS point scans in regions corresponding to each phase. As an example, the positions of two such scans are indicated in Figure 2d. The composition of the Nb, Ta-rich phase determined by EDS is
(32 ± 2) at % Nb, (35 ± 2) at % Ta, (17 ± 1) at % Ti, (16 ± 1) at % Zr,
while the composition of the Ti, Zr rich phase is
(23 ± 2) at % Nb, (17 ± 2) at % Ta, (25 ± 2) at % Ti, (35 ± 2) at % Zr.
The XRD phase analysis confirmed that both these phases have a bcc structure with slightly different lattice parameters. The XRD pattern of the as-cast NbTaTiZr alloy is plotted in Figure 3 and contains reflections corresponding to the bcc structure. Obviously, the XRD reflections are significantly broadened. It testifies that each reflection actually consists of two overlapping peaks belonging to Nb, Ta-rich and Ti, Zr-rich phases. The Nb, Ta-rich phase exhibits a lattice parameter, a = 3.3509(8) Å, while the Ti, Zr-rich phase has a longer lattice parameter, a = 3.380(2) Å.
The microstructure of NbTaTiZr alloy annealed at 1200 °C is shown in Figure 4. The annealed sample exhibits a dendritic microstructure similar to that in the as-cast state. The EDS elemental maps plotted in Figure 5 clearly show that the annealed sample consists of Nb, Ta-enriched regions separated by dendritic arms rich in Ti and Zr. Hence, the annealing of NbTaTiZr alloy at 1200 °C is not sufficient to form a single-phase solid solution. The XRD pattern of annealed NbTaTiZr alloy is plotted in Figure 4. Annealing at 1200 °C resulted in a narrowing of XRD reflections, indicating a certain sharpening of the Nb, Ta and Ti, Zr-rich phases; i.e., the spatial variations of composition are more abrupt than in the as-cast alloy. The XRD reflections were split into peaks corresponding to the Ti, Zr-rich phase with a higher lattice parameter, a = 3.489(8) Å, and Nb, Ta-rich phase with a smaller lattice parameter, a = 3.337(4) Å. Note that there is an additional weak peak located at 2θ ≈ 72°. The origin of this peak is not clear.

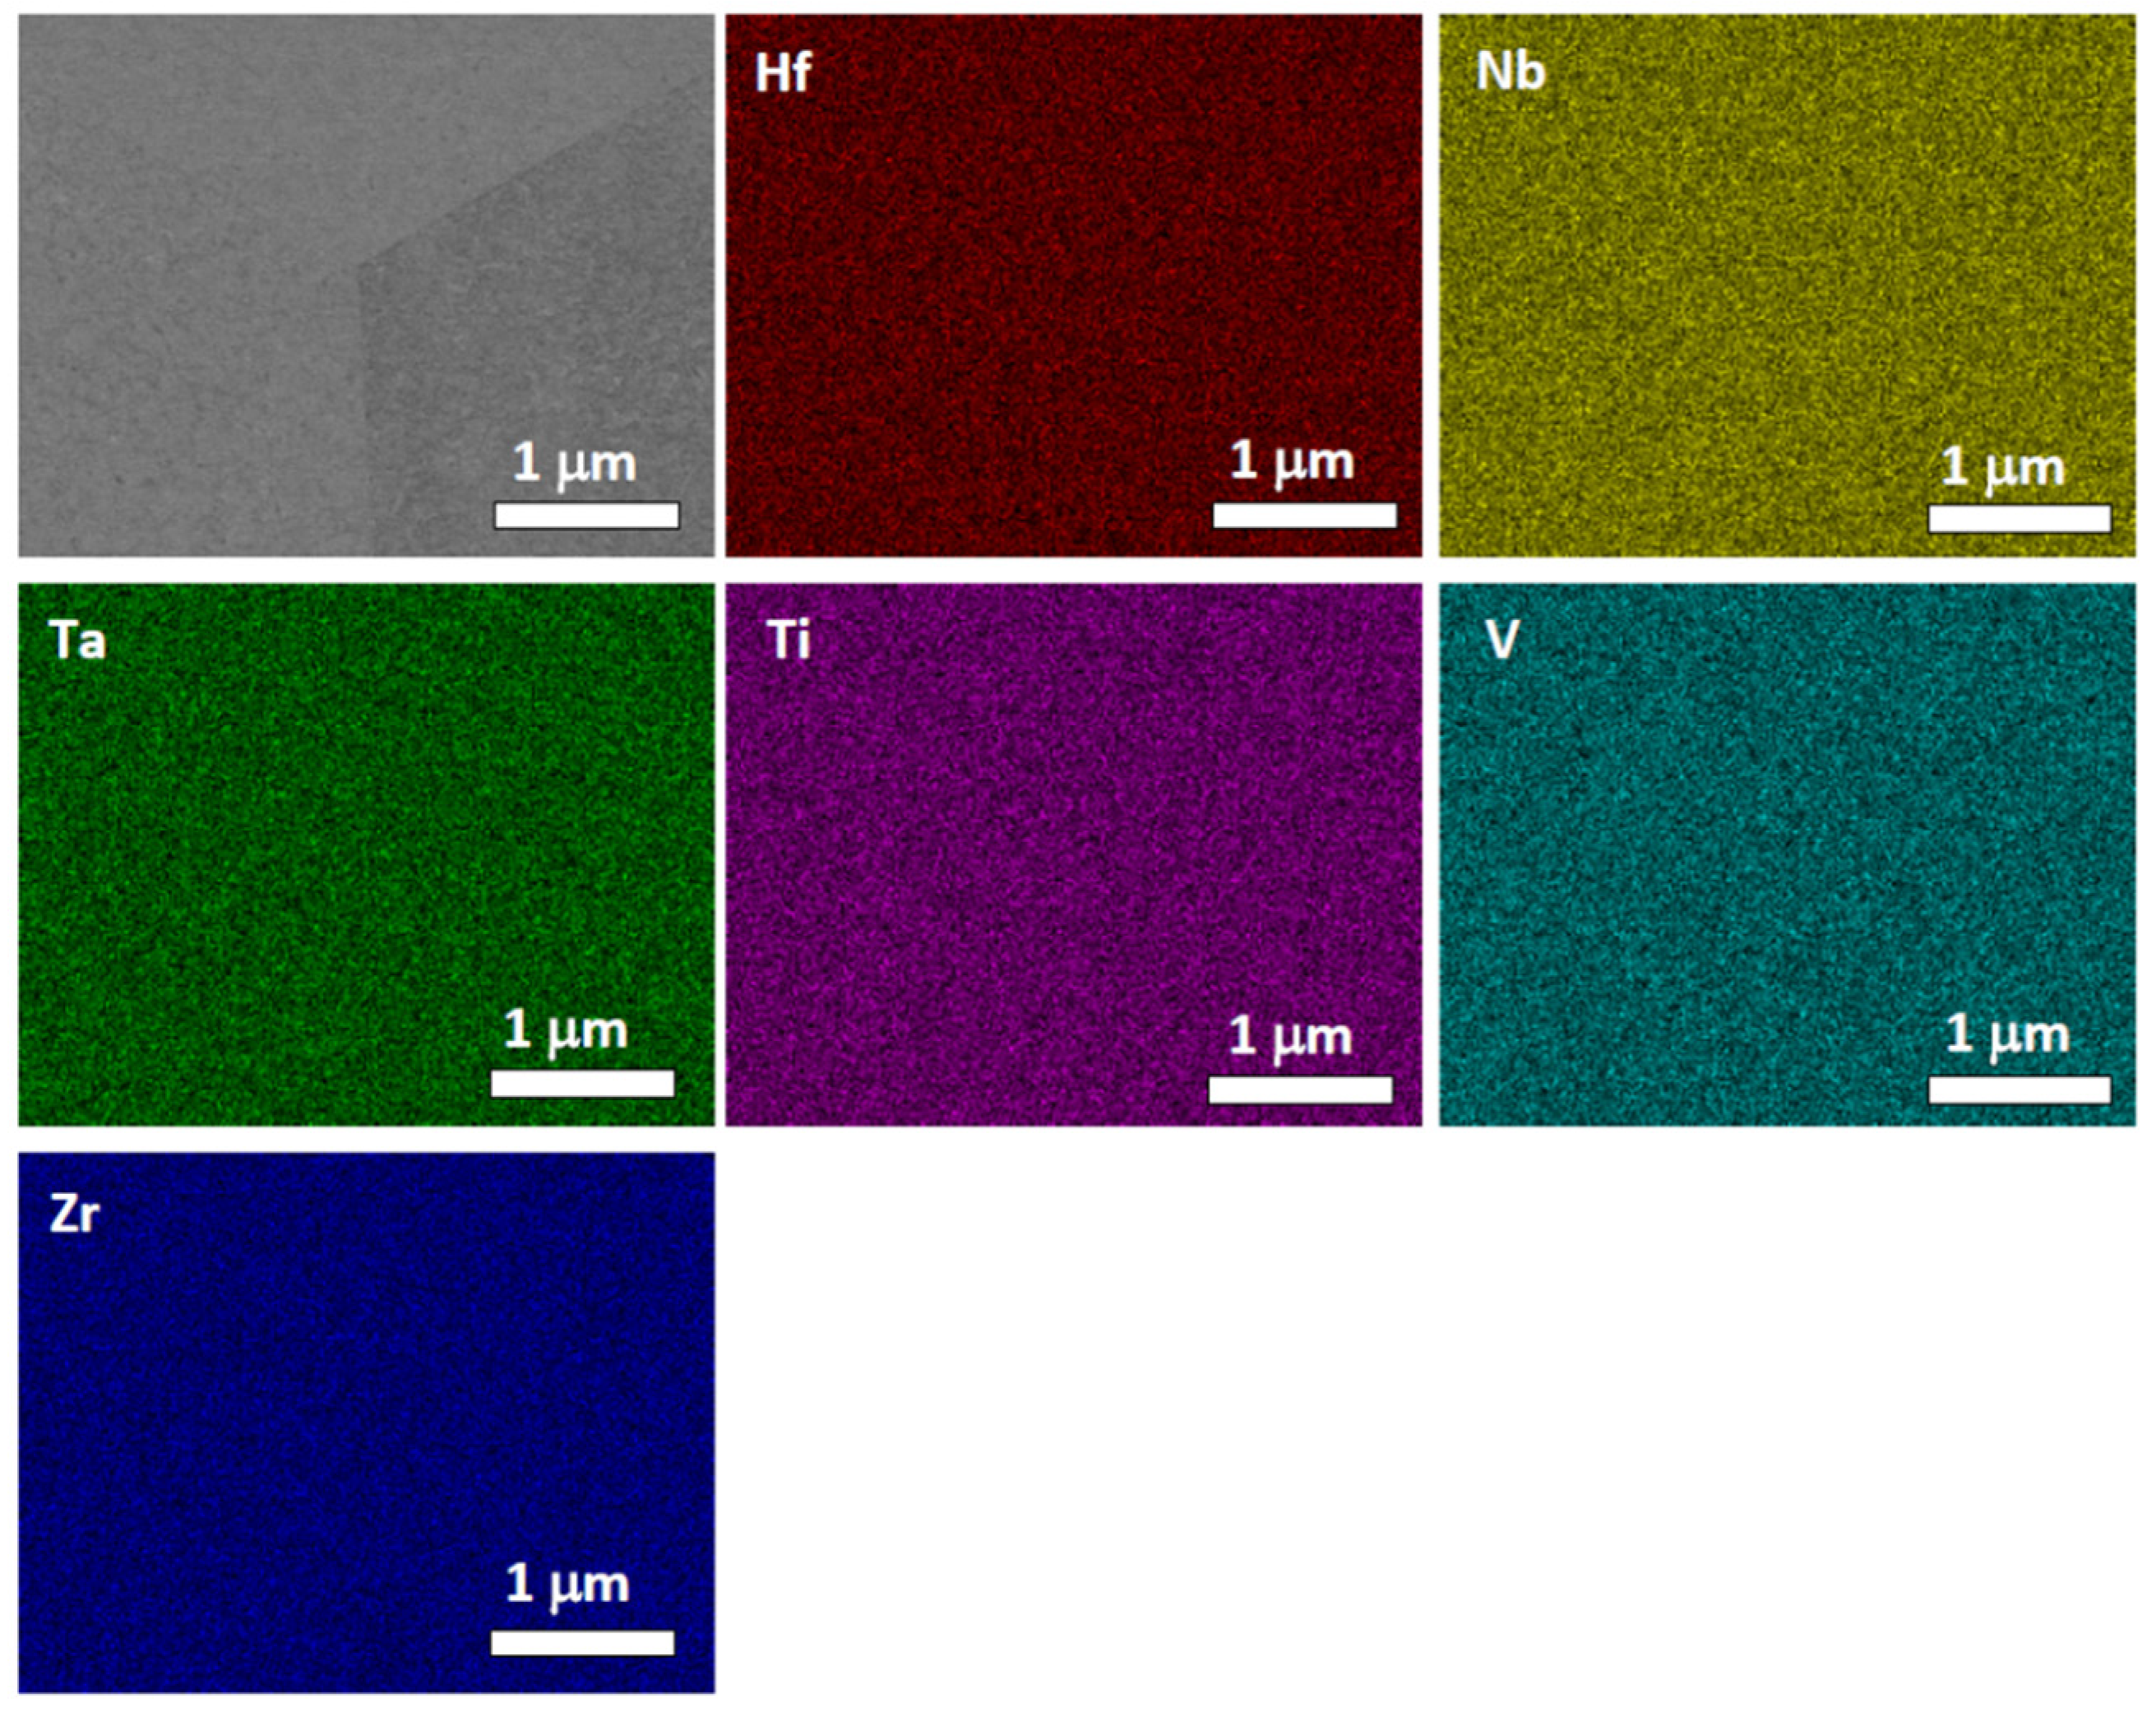
4.2. HfNbTaTiZr Alloy

The microstructure of HfNbTaTiZr alloy in the as-cast state is plotted in Figure 6. The alloy exhibits a dendritic structure, although the difference in the composition between brighter and darker regions is smaller than in the NbTaTiZr alloy. It indicates the beneficial effect of the addition of Hf for the formation of a single-phase solid solution. The EDS elemental maps plotted in Figure 7 show that the alloy consists of regions enriched in Nb and Ta (brighter regions in Figure 6) separated by dendritic arms enriched in Hf, Ti, and Zr (darker regions in Figure 6). The chemical composition of the Nb, Ta-enriched regions is
(20 ± 1) at % Hf, (23 ± 1) at % Nb, (21 ± 1) at % Ta, (17 ± 1) at % Ti, (19 ± 1) at % Zr
while the chemical composition of Hf, Ti, Zr-enriched regions is
(21 ± 1) at % Hf, (19 ± 1) at % Nb, (18 ± 1) at % Ta, (21 ± 1) at % Ti, (21 ± 1) at % Zr.
Hence, differences in composition between Nb, Ta-enriched and Hf, Ti, Zr-enriched regions are rather small. The XRD pattern of the as-cast HfNbTaTiZr alloy plotted in Figure 8 contains reflections corresponding to the bcc structure. Similarly to NbTaTiZr alloy, the peaks are broadened, since they are composed of overlapping reflections of two bcc phases: Nb, Ta-rich phase with a slightly lower lattice parameter and Hf, Ti, Zr-rich phase with a slightly higher lattice parameter. However, it should be mentioned that the peak broadening is significantly smaller compared to NbTaTiZr alloy, and the XRD pattern of HfNbTaTiZr alloy can be well described assuming a single bcc phase with lattice parameter a = 3.4059(1) Å, which is in good agreement with the results published in the literature [11,21,48] and represents an average lattice parameter of Nb, Ta-rich and Hf, Ti, Zr-rich phase. Obviously, lattice parameters of both phases are closer to each other than in the case of NbTaTiZr alloy. It is in accordance with smaller difference in the composition of both phases compared to the NbTaTiZr alloy.
The microstructure of HfNbTaTiZr alloy annealed at 1200 °C is plotted in Figure 9. Annealing obviously resulted in the formation of a single-phase solid solution. The EDS elemental maps shown in Figure 10 confirm the uniform distribution of all alloying elements. The XRD pattern of the annealed sample consists of reflections corresponding to the bcc structure with the lattice parameter a = 3.4055(1) Å. Annealing led to a remarkable narrowing of XRD peaks testifying to the formation of a single-phase solid solution of alloying elements.
It has to be emphasized that the single-phase solid solution is a thermodynamically metastable phase at the ambient temperature. It was confirmed also by CALPHAD modeling [41], which revealed that below 1000 °C, HfNbTaTiZr solid solution decomposes into two bcc phases: a Nb, Ta-rich phase with a smaller lattice parameter and a Hf, Ti, Zr-rich phase with a higher lattice parameter. Below 800 °C, the latter phase further develops into an hcp phase. Hence, the thermodynamically equilibrium state of HfNbTaTiZr alloy at ambient temperature is a mechanical mixture of Nb, Ta-rich bcc phase and Hf, Ti, Zr-rich hcp phase. In order to save a single-phase bcc solid solution, the alloy has to be quenched after annealing at temperature above 1000 °C. Fast cooling prevents diffusion-limited phase decomposition, and it enables saving the single-phase solid solution at room temperature as a metastable phase.
The decomposition of a single-phase solid solution into two bcc phases obviously occurred during the cooling of melt in the case of the as-cast alloy. The cooling rate of the as-cast sample was not fast enough to prevent the decomposition into the two bcc phases, but it was sufficient to prevent further development of the bcc phase enriched in Hf, Ti, and Zr into the hcp phase stable at room temperature. Hence, even the as-cast HfNbTaTiZr alloy is in a metastable state consisting of a mixture of two bcc phases. The transformation of the Hf, Ti, and Zr-rich bcc phase into the hcp phase does not occur at low temperatures due to low mobility of atoms in HfNbTaTiZr alloy. The development of the hcp phase requires prolonged annealing of the alloy at temperatures around 600 °C. This is demonstrated in Figure 11, which shows the microstructure of HfNbTaTiZr alloy annealed at 1000 °C in vacuum and slowly cooled with furnace. One can see in the figure that particles of the Hf, Ti, Zr phase were formed at grain boundaries during slow cooling of the alloy.

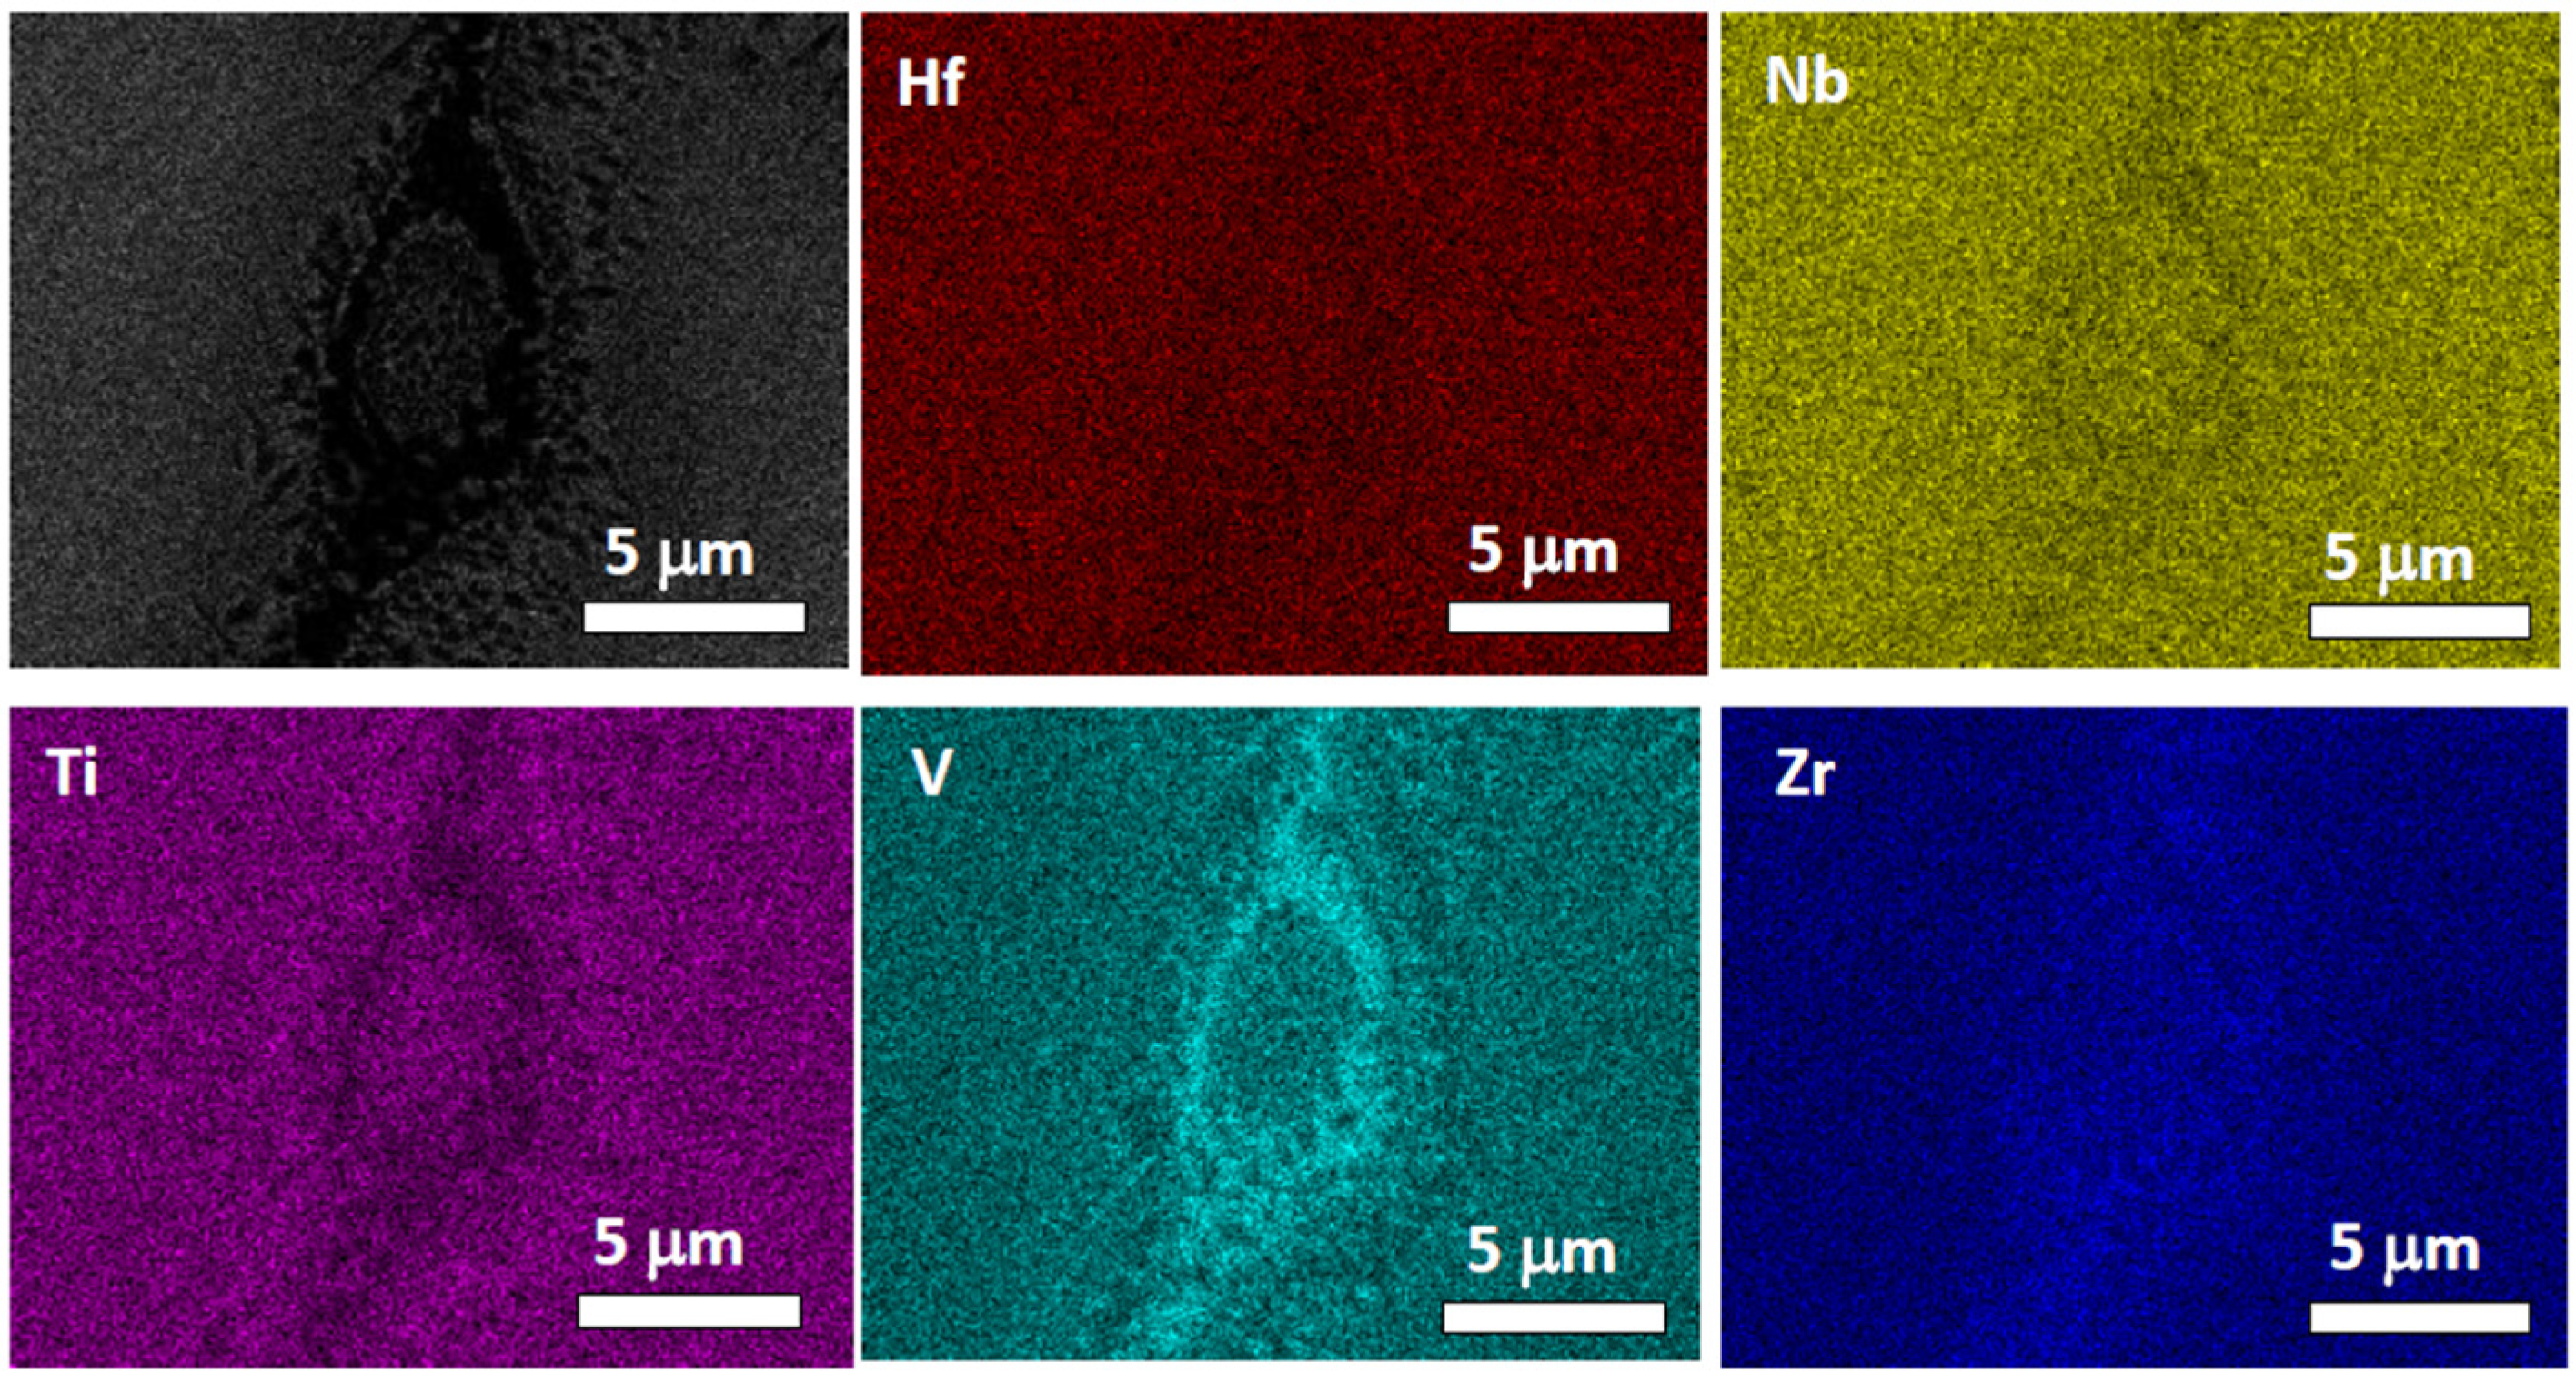
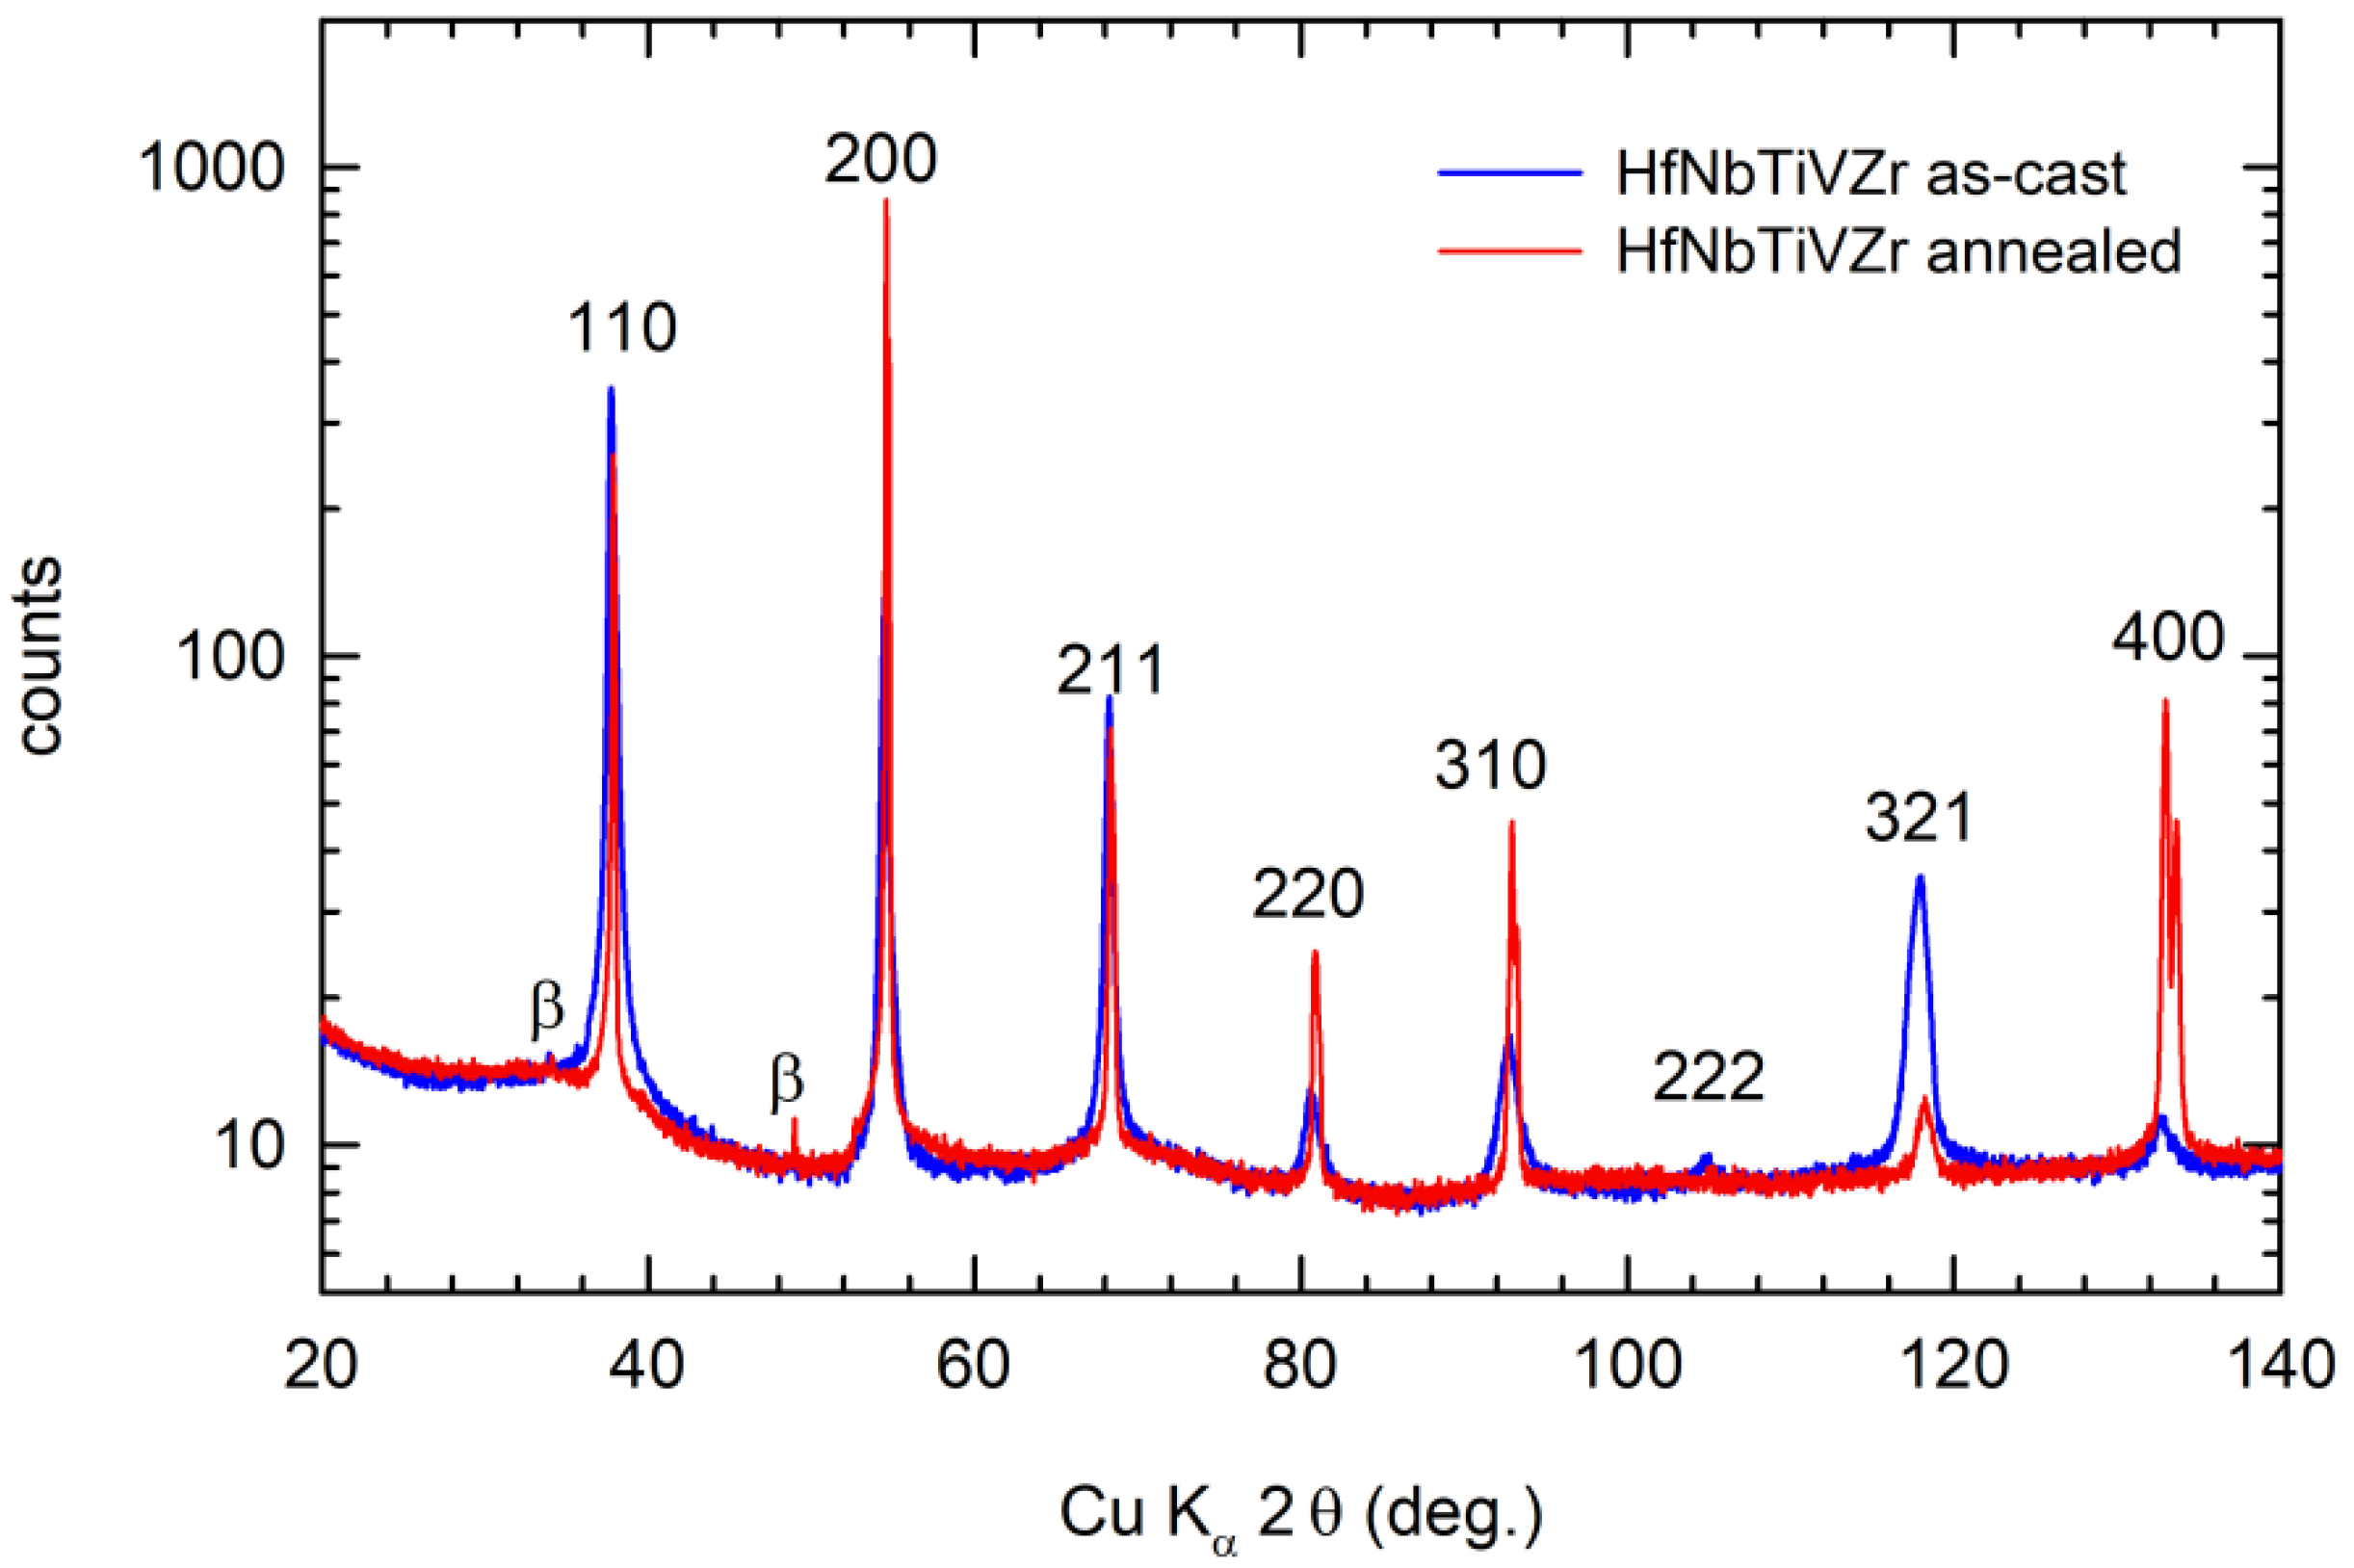
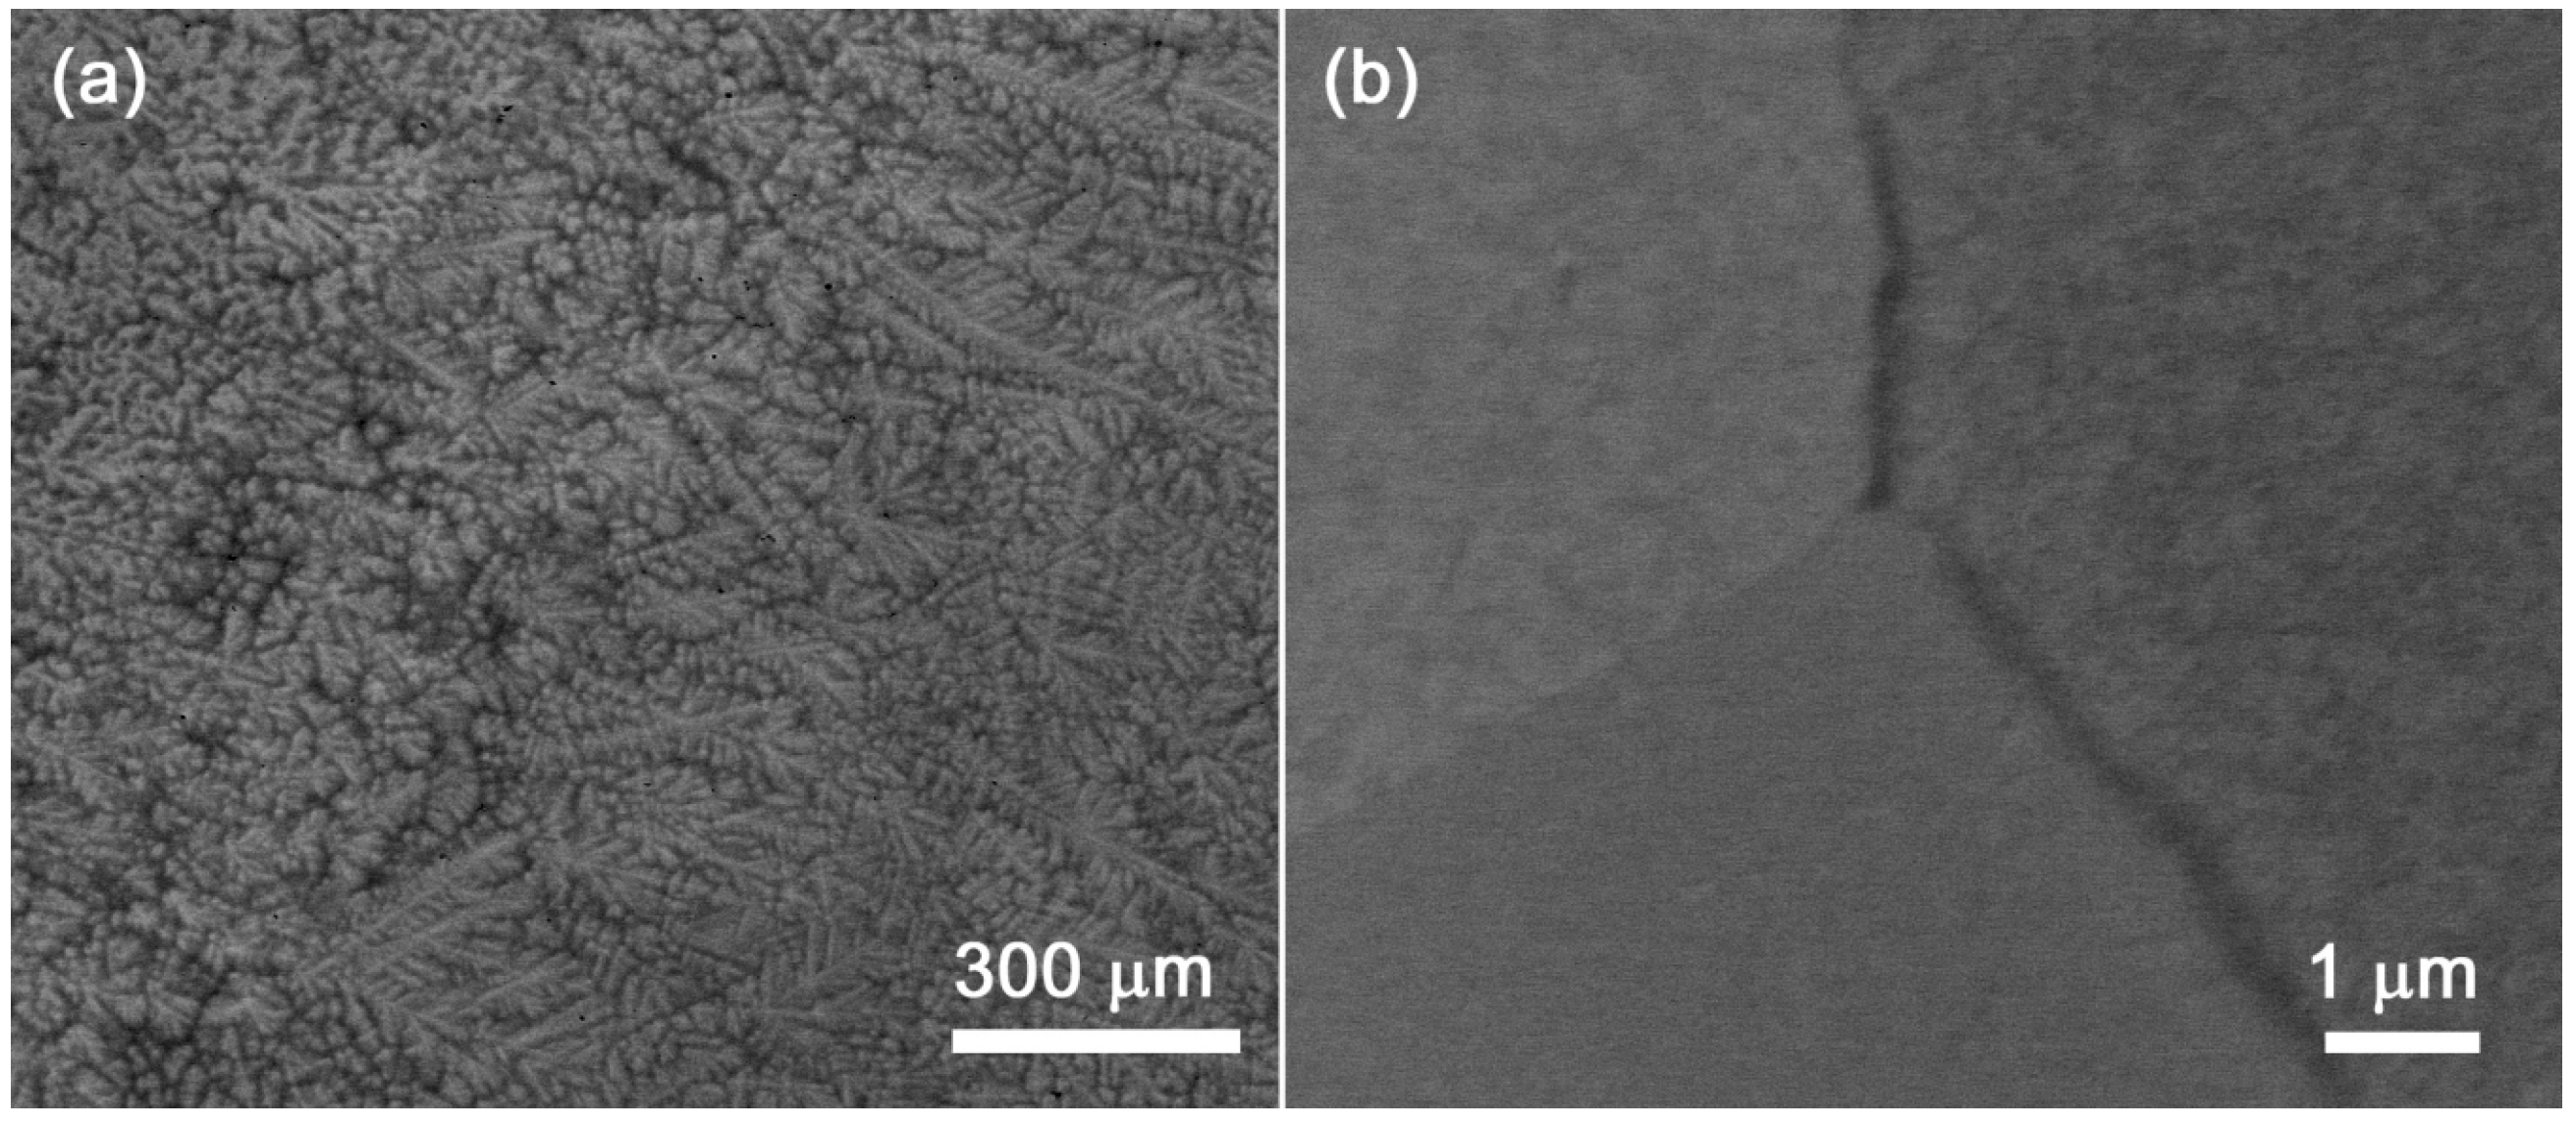
4.3. HfNbTiVZr Alloy

Since the atomic radius of V is significantly smaller than the atomic radii of Zr and Hf, the replacement of Ta by V resulted in a remarkable increase in the atomic misfit parameter; see Table 1. The microstructure of the as-cast HfNbTiVZr alloy is plotted in Figure 12. The alloy consists of elongated bright regions with the composition
(23 ± 1) at % Hf, (24 ± 1) at % Nb, (20 ± 1) at % Ti, (16 ± 1) at % V, (17 ± 1) at % Zr
determined by EDS. The bright regions are separated by regions that appear darker in the SEM micrographs and exhibit the following composition
(19 ± 1) at % Hf, (18 ± 1) at % Nb, (20 ± 1) at % Ti, (22 ± 1) at % V, (21 ± 1) at % Zr.
Hence, bright regions are enriched in Hf and Nb, while dark regions are enriched in V and Zr. Detailed inspection of microstructure revealed that V atoms segregate at grain boundaries and form needle-shaped particles, which are shown in Figure 12b. The EDS elemental maps plotted in Figure 13 confirm that the particles at grain boundaries are enriched in V and Zr. The XRD pattern of the as-cast alloy plotted in Figure 14 testifies that the alloy has a bcc structure. Similarly to HfNbTaTiZr alloy, the XRD reflections are broadened, since each peak consists of overlapping peaks of Hf, Nb-rich and V, Zr-rich bcc phases. The XRD pattern can be well described by a bcc structure with lattice parameter a = 3.3630(6) Å representing an average value for both phases.
Annealing of HfNbTiVZr alloy at 1200 °C finished by water quenching resulted in the formation of a single-phase solid solution; see Figure 15a. A detail of the grain boundary in Figure 16b shows that the segregation of V at grain boundaries occurs in the annealed sample as well but to a lesser extent compared to the as-cast state. It indicates that the nucleation of a V and Zr-rich phase takes place preferentially at grain boundaries, and its formation can be suppressed by fast cooling of the alloy to room temperature. As shown in Figure 14, annealing of the alloy at 1200 °C led to a significant narrowing of XRD reflections, which is consistent with the formation of a single-phase solid solution with the bcc structure. The Rietveld refinement of the XRD pattern of the annealed alloy resulted in the lattice parameter a = 3.3624(4) Å.

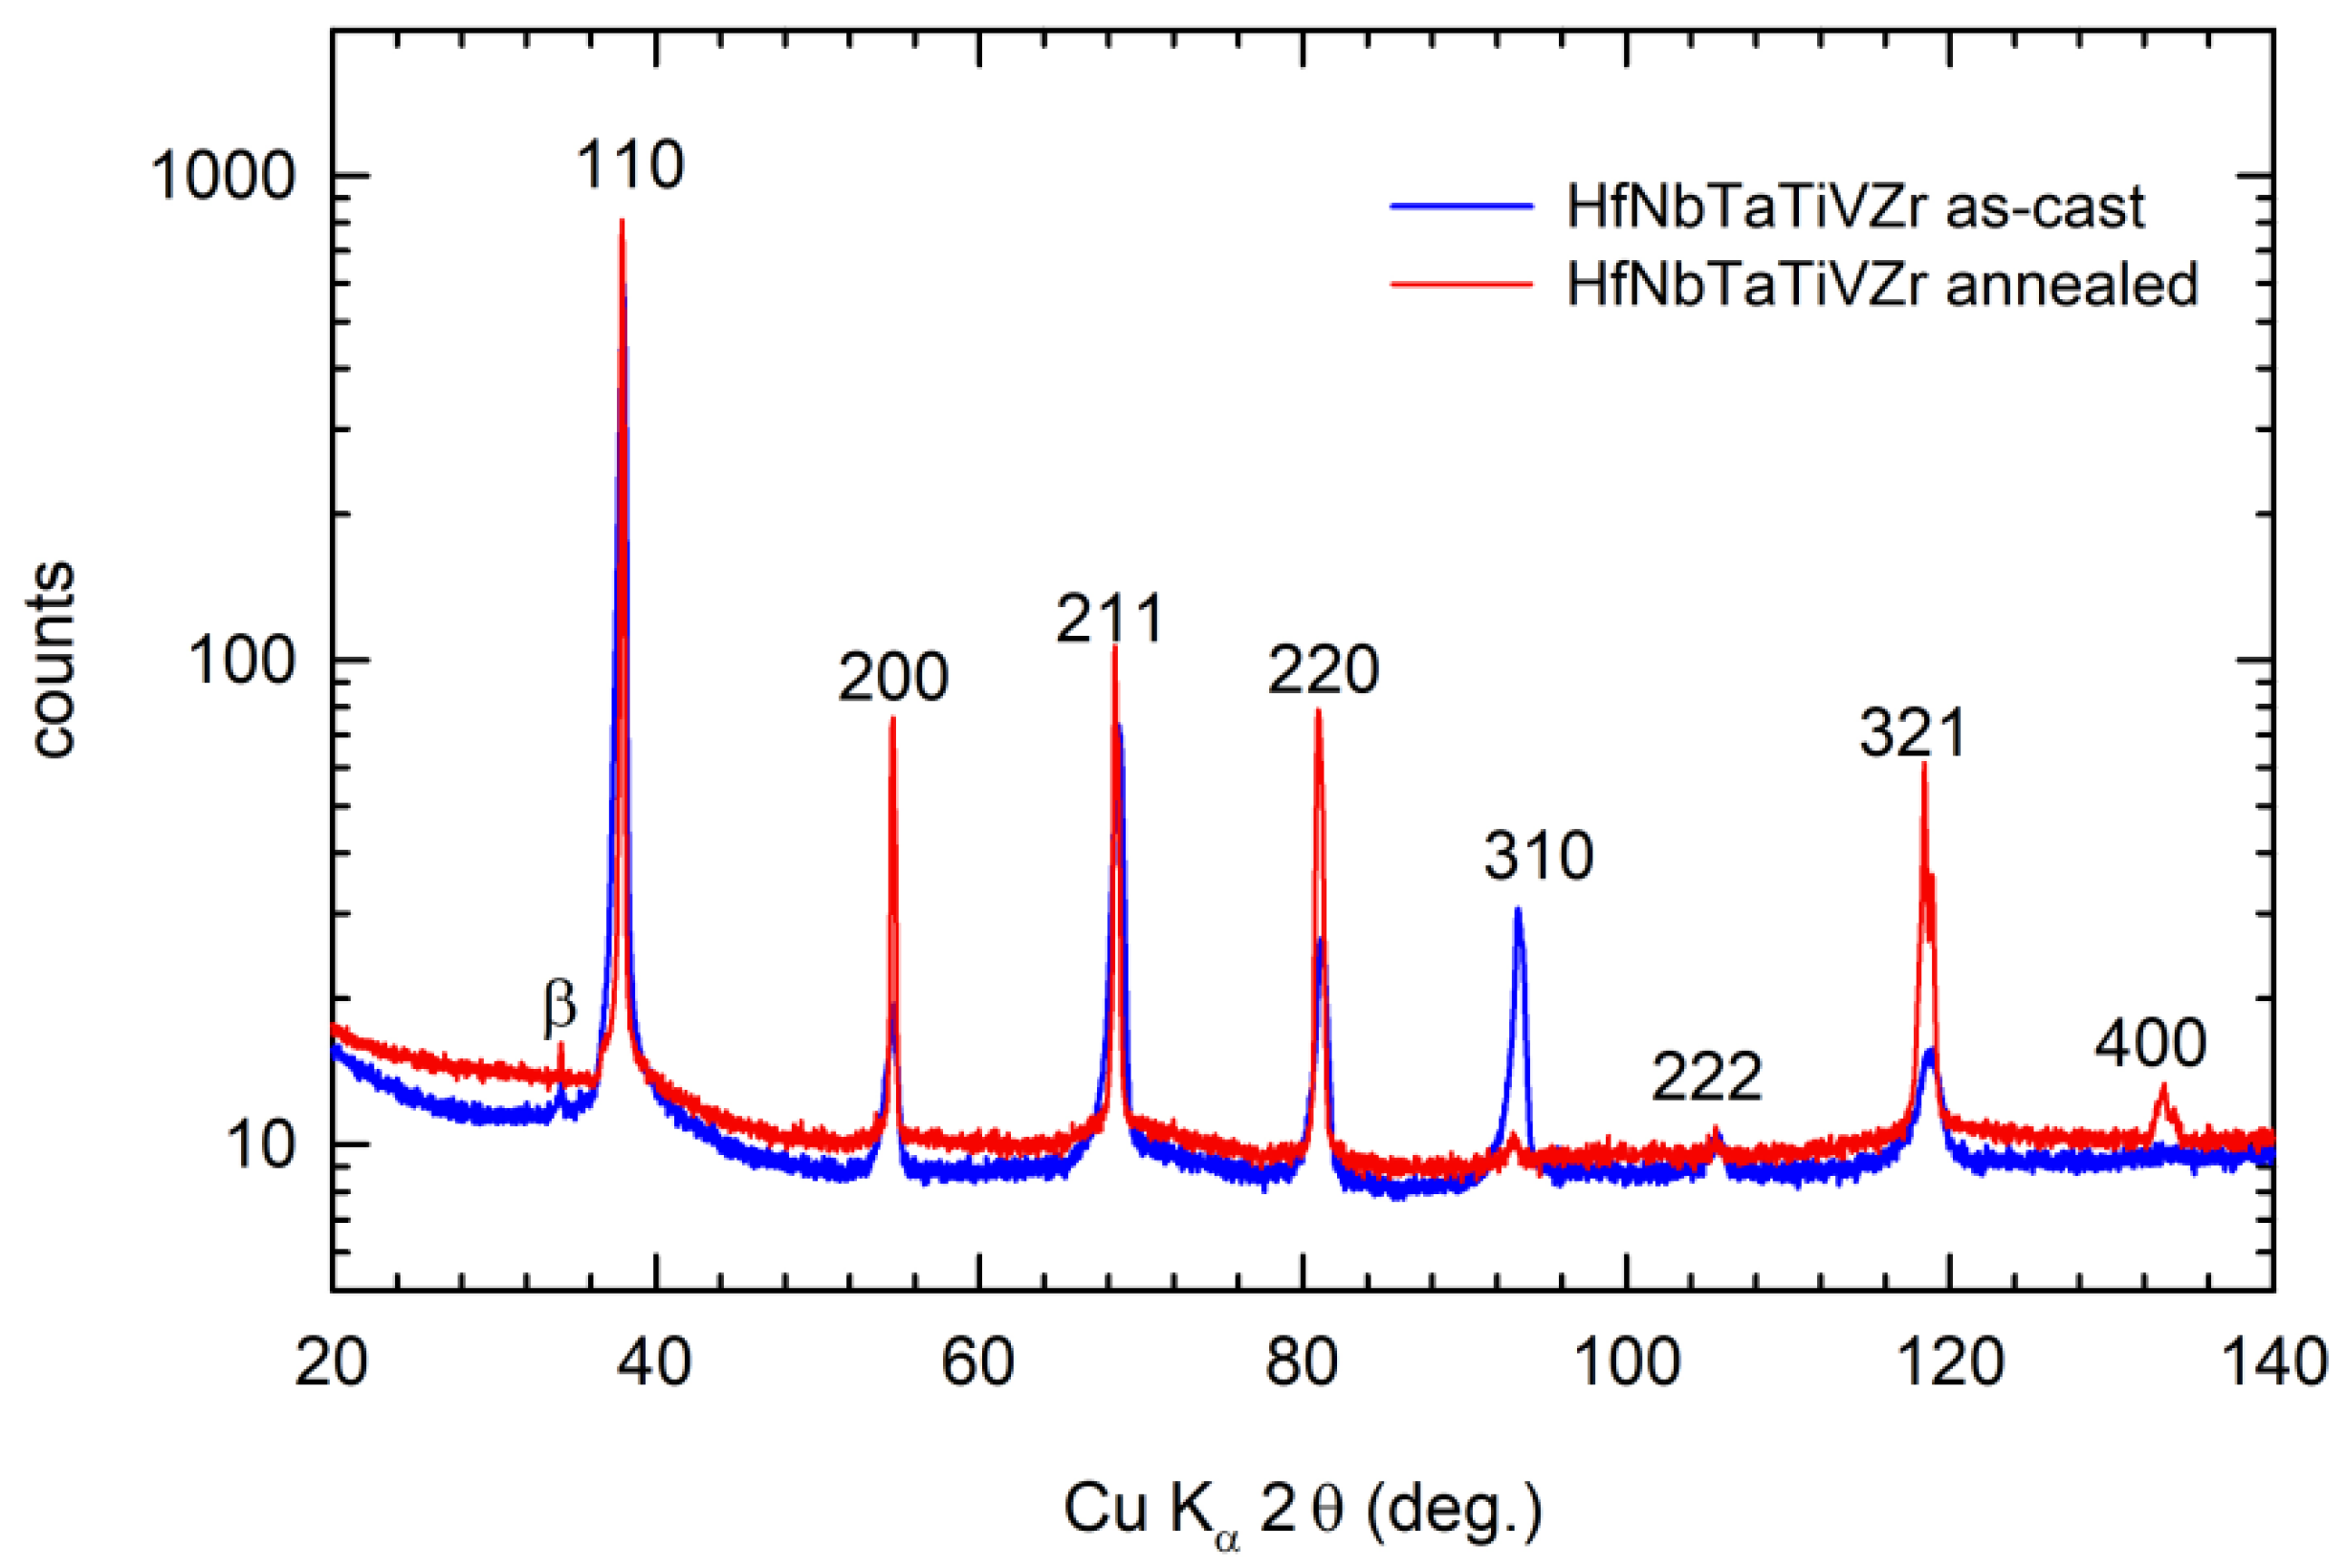
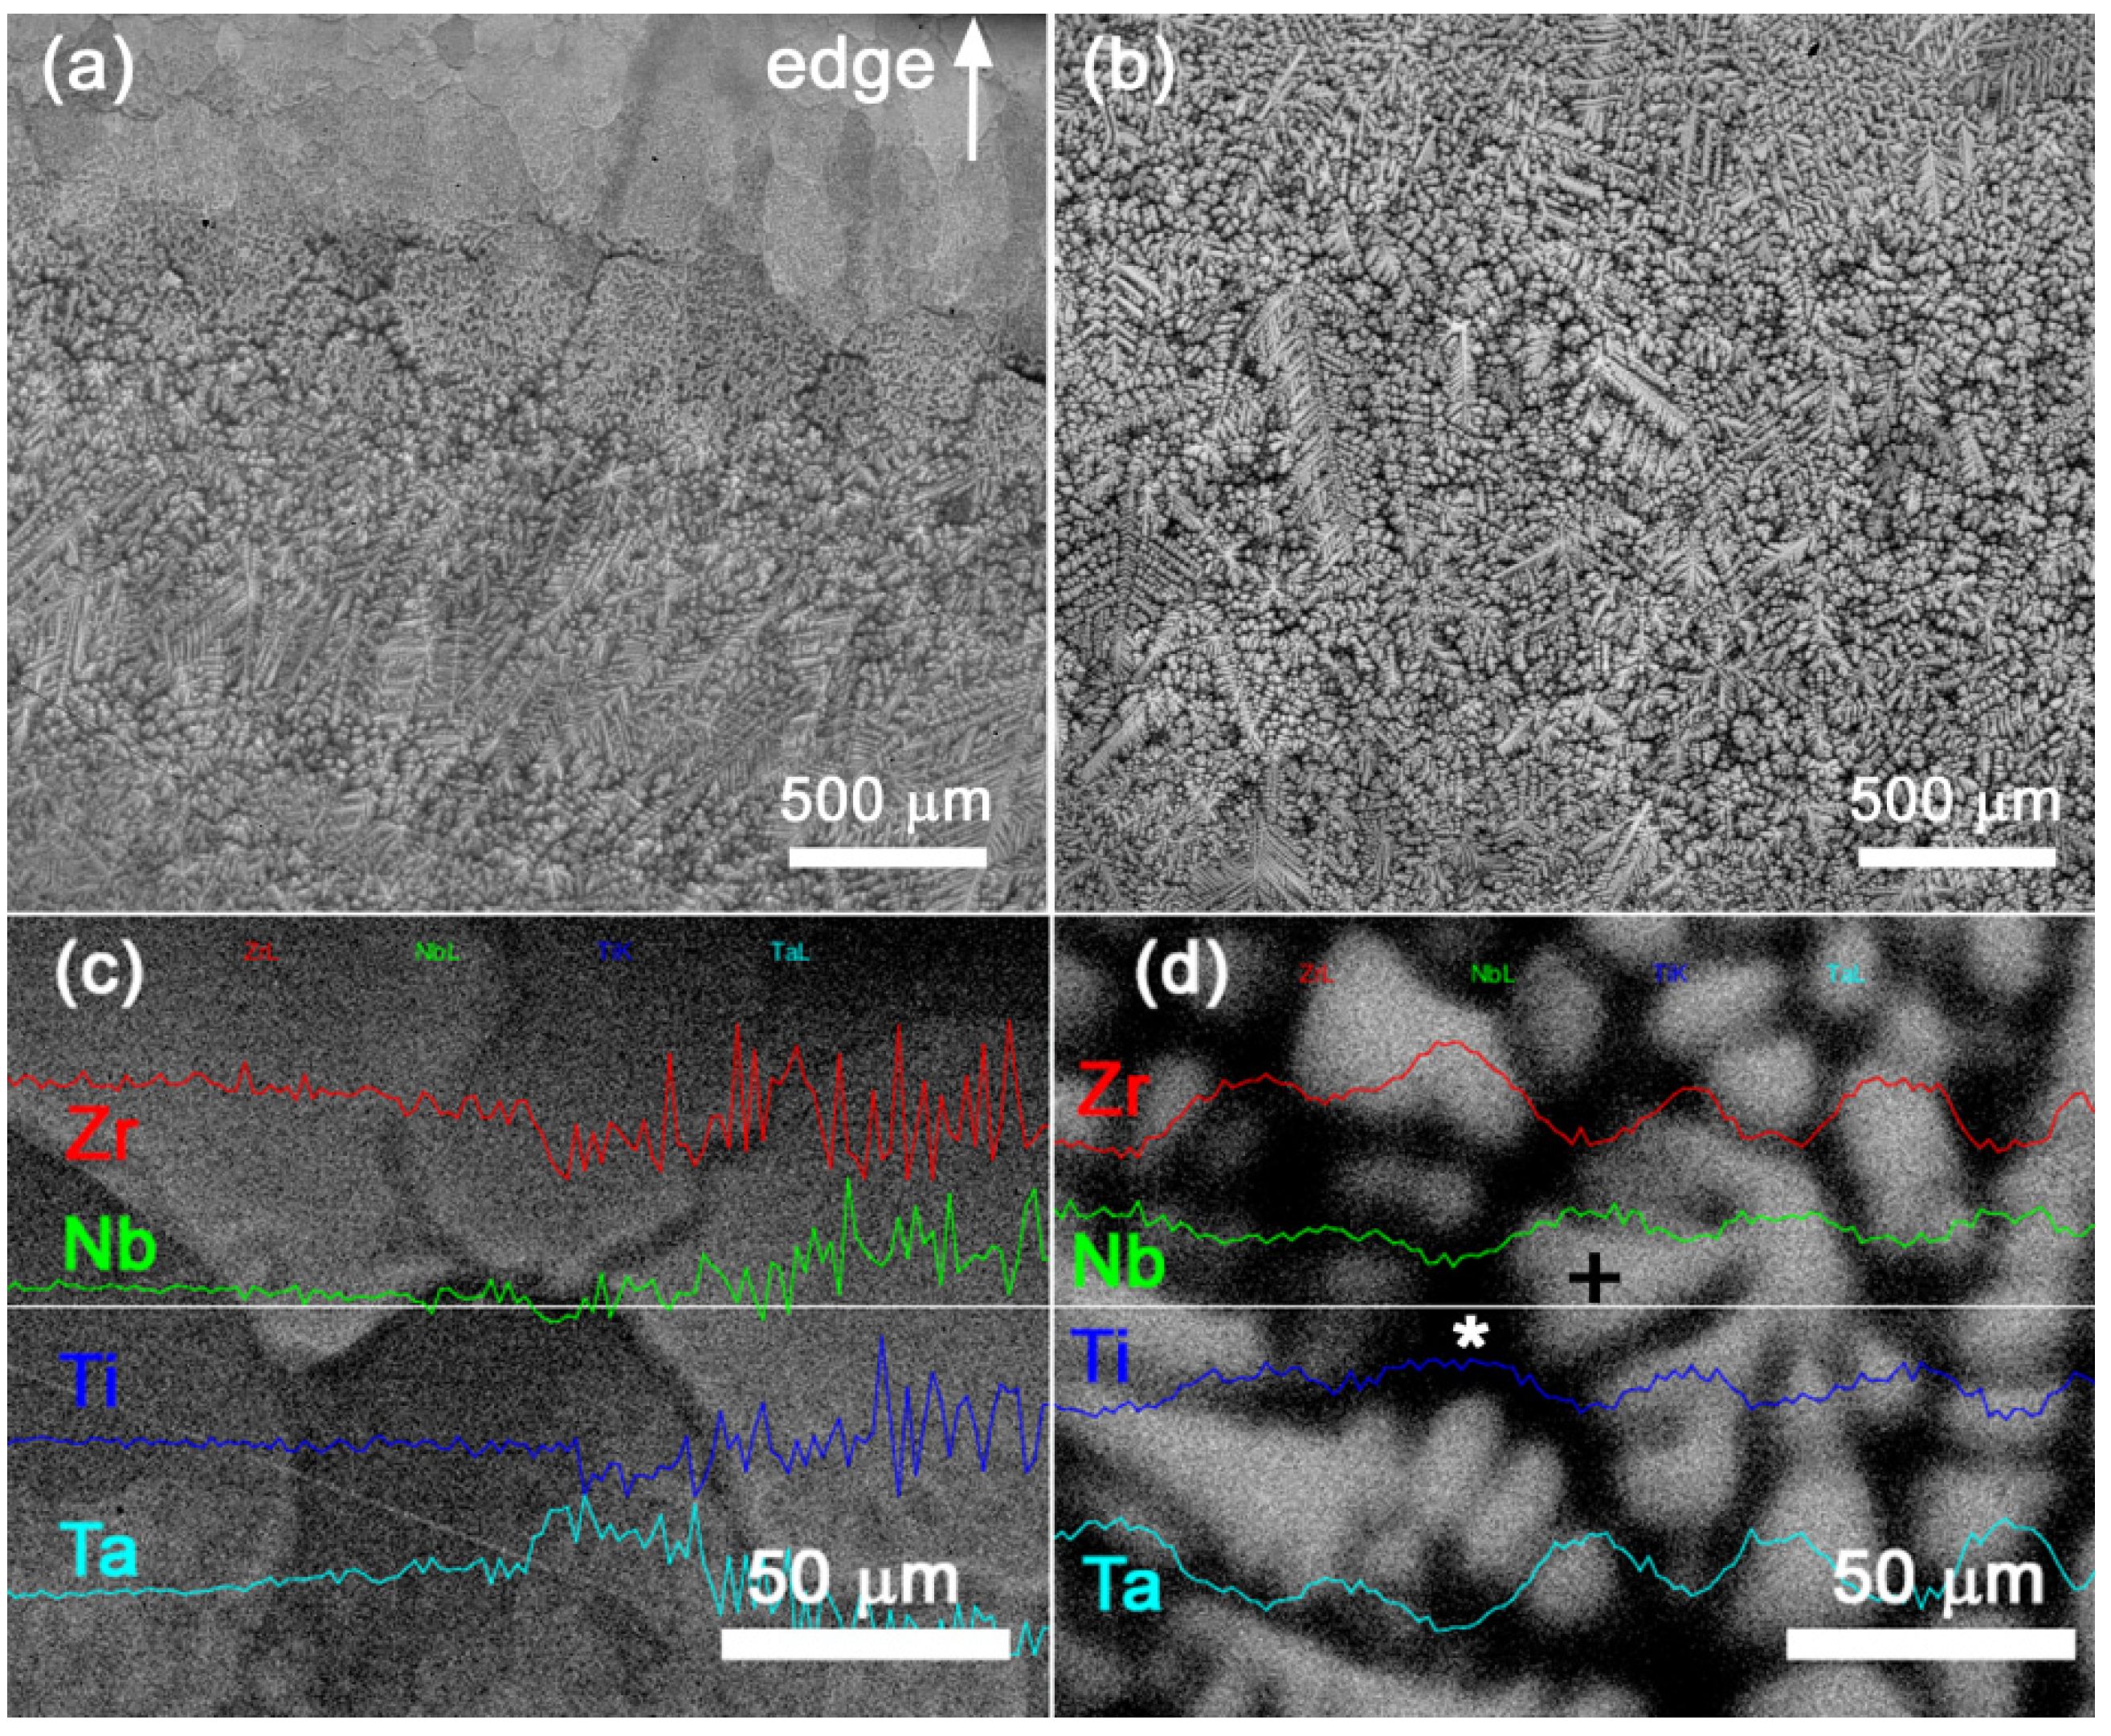
4.4. HfNbTaTiVZr Alloy

The microstructure of the six-element alloy HfNbTaTiVZr in the as-cast state is shown in Figure 16. The EDS elemental maps of the alloy are plotted in Figure 17. Clearly, the as-cast alloy exhibits a dendritic structure consisting of dendrites enriched in Nb and Ta (brighter regions in Figure 16a) separated by inter-dendritic regions enriched in Hf, Ti, V, and Zr (darker regions in Figure 16a). The EDS analysis revealed that brighter regions have composition
(16 ± 1) at %Hf, (18 ± 1) at %Nb, (20 ± 1) at %Ta, (16 ± 1) at %Ti, (14 ± 1) at %V, (16 ± 1) at %Zr
while the composition of the darker regions is
(18 ± 1) at %Hf, (15 ± 1) at %Nb, (12 ± 1) at %Ta, (17 ± 1) at %Ti, (18 ± 1) at %V, (20 ± 1) at %Zr.
In addition, the segregation of V at grain boundaries was observed, as documented in Figure 16b.
The XRD pattern of as-cast HfNbTaTiVZr alloy is plotted in Figure 18 and consists of reflections corresponding to the bcc structure. Although the XRD peaks are broadened and consist of overlapped peaks of Nb, Ta enriched and Hf, Ti, V, Zr enriched phases, the XRD pattern can be well described by a single bcc phase with the lattice parameter a = 3.3545(6) Å representing an average value for both phases.
The microstructure of HfNbTaTiVZr alloy annealed at 1200 °C is plotted in Figure 19. Annealing at 1200 °C resulted in the formation of a single-phase solid solution. It is demonstrated also by the uniform distribution of alloying elements in the EDS elemental maps plotted in Figure 20 as well as by the narrowing of XRD reflections in Figure 18. The annealed alloy has a bcc structure with the lattice parameter a = 3.3551(2) Å. In contrast to the as-cast sample, no segregation of V at grain boundaries was observed in the annealed alloy. It indicates that the cooling rate was high enough to suppress the segregation of elements at grain boundaries.

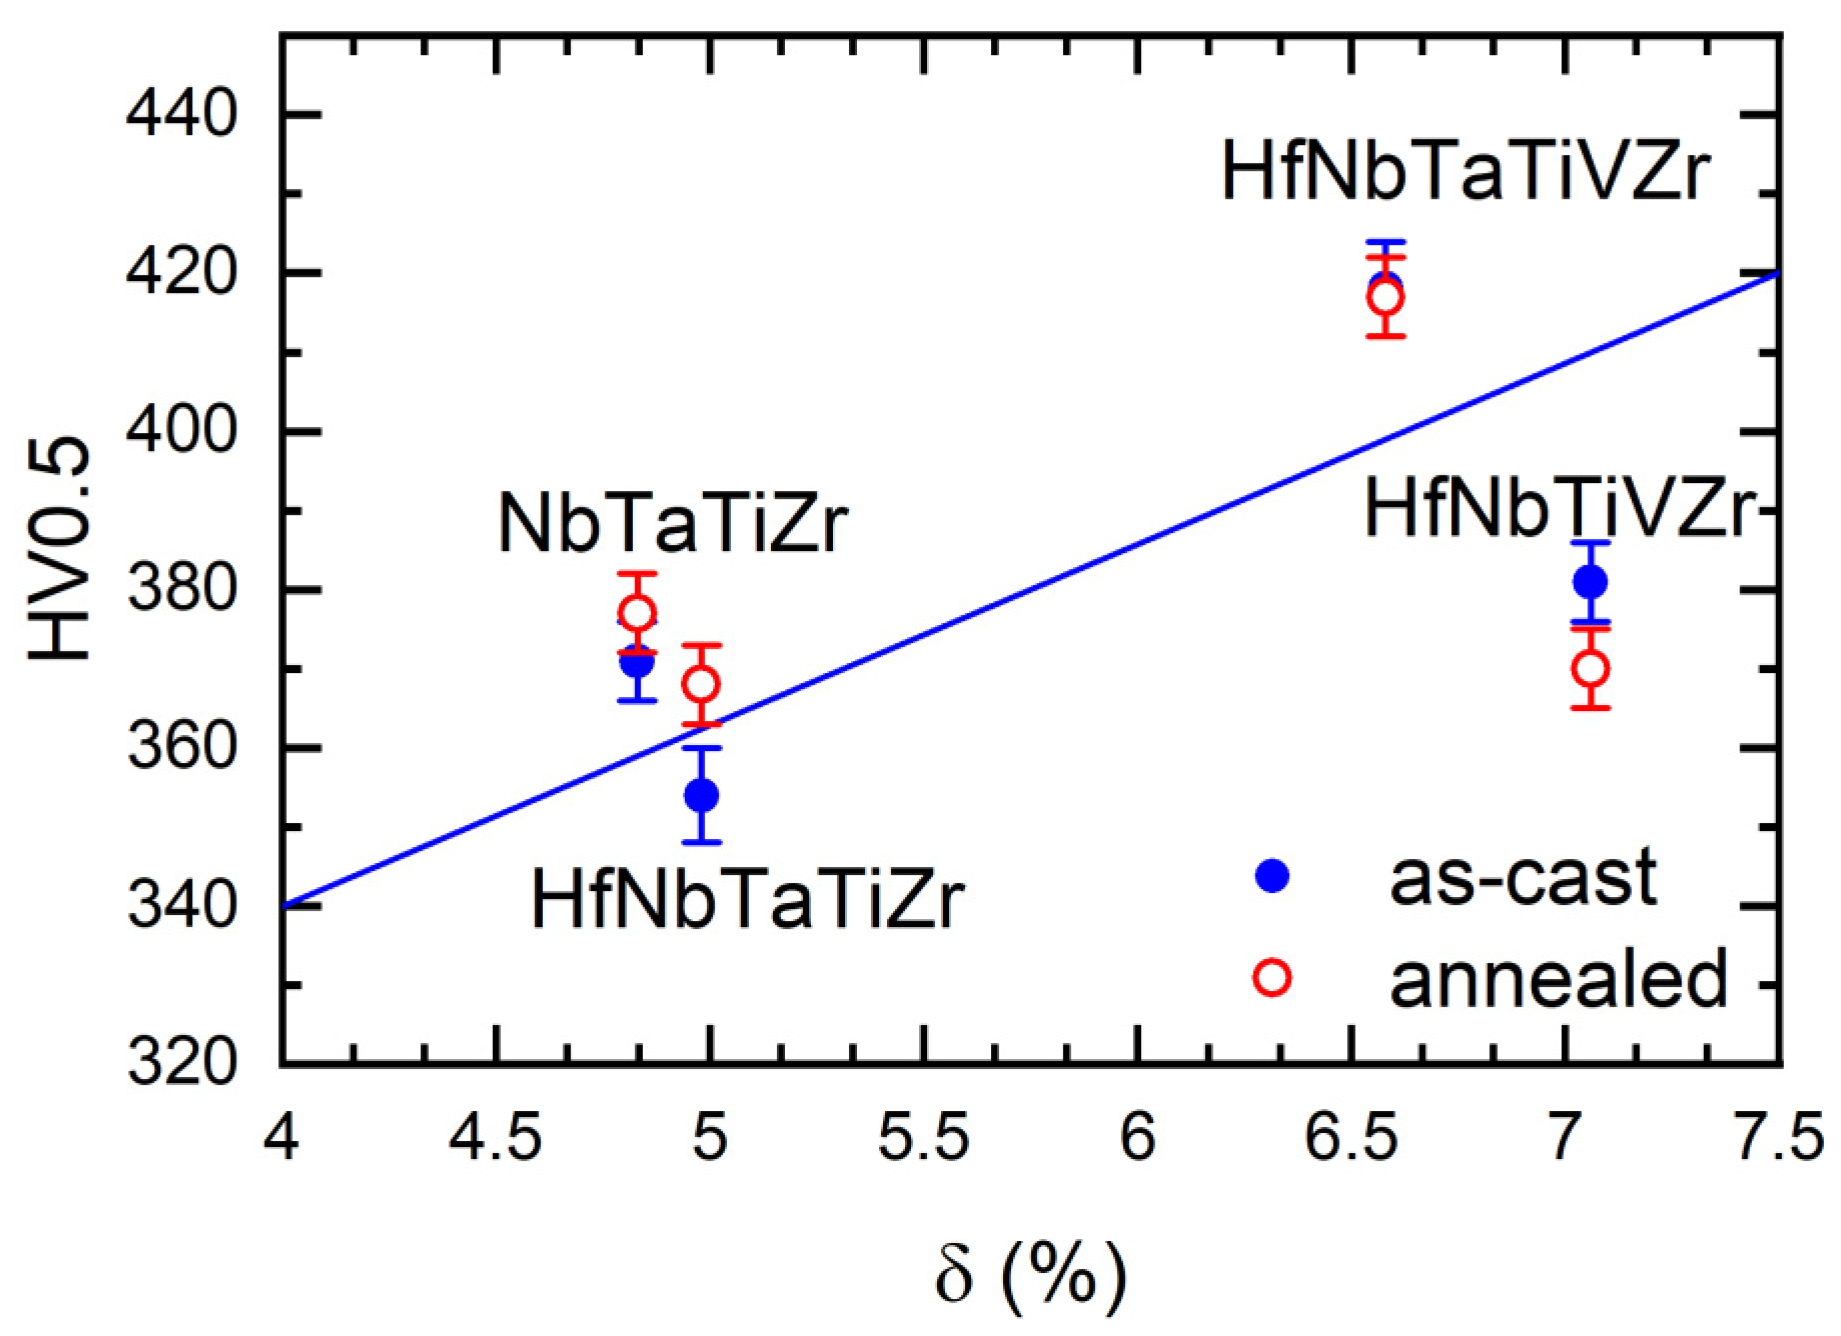
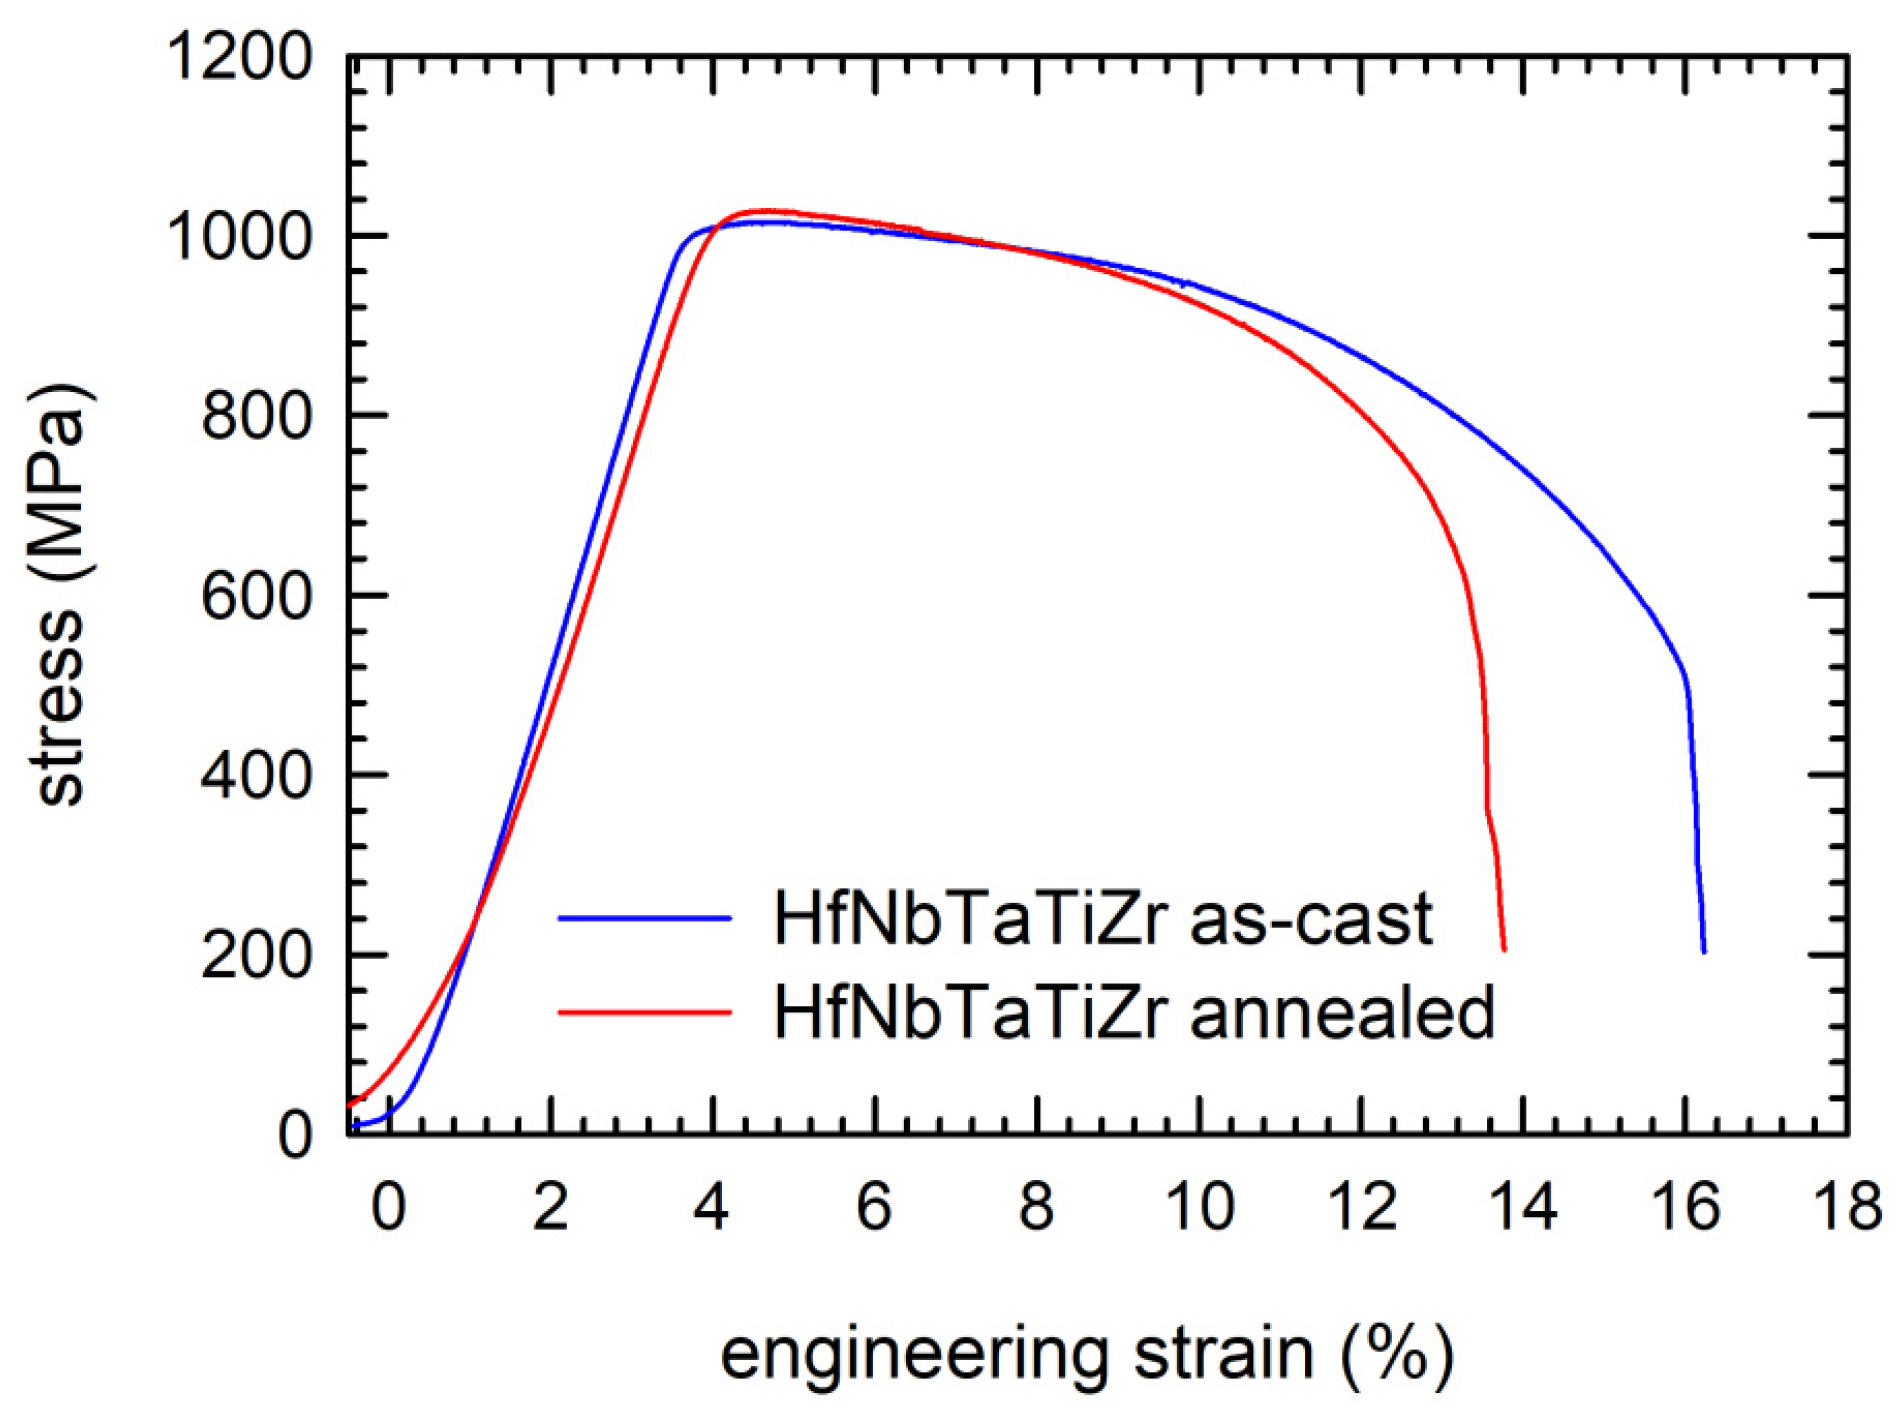
4.5. Mechanical Properties of Alloys

The microhardness, HV0.5, of alloys studied is plotted in Figure 21 as a function of the atomic misfit parameter δ. From inspection of the figure, one can conclude that there is a positive correlation between the hardness and the misfit parameter. It testifies that the differences of atomic radii of alloy constituents represent an important factor for CCA strengthening. Local lattice distortions induced by different atomic radii of alloying elements cause strengthening of CCAs due to the increased stress required to move dislocations in a lattice with the random distribution of solutes. The increased stress required to move the dislocation in CCAs arises from local variations of inter-atomic distances due to variations of the chemical environment around lattice sites [49,50].
Data for as-cast and annealed alloys are compared in Figure 21. The hardness of annealed and as-cast alloys is comparable within experimental uncertainty. The strengthening induced by lattice distortions is visible not only in annealed alloys consisting of single-phase random solid solution but also in as-cast alloys with a dendritic structure. Although as-cast alloys consist of mechanical mixtures of two phases with different compositions, both these phases are random solid solutions, and the difference in their composition is rather low. Hence, the strengthening caused by lattice distortions occurs for both phases, and the hardness of as-cast alloys is comparable to that for annealed alloys consisting of single-phase solid solution.
Hence, from the point of view of practical applications, it is not necessary to achieve single-phase solid solution in CCAs. Even as-cast CCAs consisting of a mechanical mixture of random solid solutions with slightly different chemical compositions exhibit favorable properties related to lattice distortions and high configurational entropy. In particular, the strengthening induced by lattice distortions occurs in both states. This picture is supported by a comparison of tensile stress–strain curves for HfNbTaTiZr alloy plotted in Figure 22. The alloy was subjected to tensile deformation with a strain rate of 10−3 s−1 at room temperature. From inspection of Figure 22, one can conclude that the yield stress of both samples is comparable, namely (1050 ± 30) and (1020 ± 30) MPa for the as-cast and the annealed alloy, respectively. Similarly, the ultimate stress is (1100 ± 20) and (1030 ± 30) MPa for the as-cast and the annealed sample, respectively. Finally, the as-cast alloy has higher ductility. The maximum elongation-to-failure of (18 ± 1) and (14 ± 1)% was determined for the as-cast and annealed sample, respectively. The reduced ductility of the alloy after annealing could be related to gas contamination by residual hydrogen or oxygen molecules in the vacuum furnace, which were absorbed in the lattice of HfNbTaTiZr alloy during annealing.
The yield strength of HfNbTaTiZr alloy determined in the present work is comparable with the value of (929 ± 15) MPa reported by Senov et al. [36] for the alloy subjected to a compression test. Note that the maximum compression strain of the alloy is significantly longer than the elongation-to-failure in the tensile test. Moreover, the alloy exhibits significant strain hardening during the compression test, which was not observed in the tensile test. The tensile test of as-cast HfNbTaTiZr alloy performed in Ref. [51] resulted in slightly higher values of the yield strength (1155 MPa) and the ultimate strength (1212 MPa), but the maximum elongation-to-failure was 12% only. This can be attributed to the lower purity of the initial metals (99.9%). A high concentration of impurities most probably results in additional strengthening but reduces the ductility of the alloy.

5. Conclusions

Equimolar refractory metal CCAs with compositions NbTaTiZr, HfNbTaTiZr, HfNbTiVZr, and HfNbTaTiVZr were prepared by vacuum arc melting. The microstructure of the alloys in the as-cast state and after high-temperature annealing was compared. All CCAs studied have a disordered bcc structure. In the as-cast state, the alloys exhibit a characteristic microstructure consisting of dendrites separated by inter-dendritic regions with slightly different chemical compositions. In addition, vanadium atoms segregate at the grain boundaries. Annealing at 1200 °C for 2 h in a high vacuum finished by water quenching resulted in the formation of single-phase random solid solution in all CCAs studied except for NbTaTiZr. The strength of CCAs is enhanced by lattice distortions caused by different atomic radii of various elements distributed randomly over sites of the bcc lattice. A comparison of hardness of CCAs studied in the present work confirmed that the strengthening increases with the increasing magnitude of lattice distortions. The as-cast and annealed CCAs exhibit comparable mechanical properties. Hence, from the point of view of practical applications, a mechanical mixture of disordered bcc solutions with slightly different chemical composition is as good as single-phase random solid solution.

Author Contributions

Conceptualization, T.V., J.Č. and M.J.; methodology, T.V., J.Č. and D.P.; software, T.V. and J.Č.; validation, T.V., M.Z. and O.S.; formal analysis, M.J.; investigation, T.V., J.Č., O.M., F.L., D.P. and P.H.; writing—original draft preparation, T.V.; visualization, T.V., O.M.; supervision, J.Č.; project administration, M.J.; funding acquisition, M.J., O.S. All authors have read and agreed to the published version of the manuscript.

Funding

This research was funded by the Czech Technological Agency under the project TK01030153 and Czech Science foundation under the project 21-16218S.

Data Availability Statement

The data presented in this study are available on request from the corresponding author.

Conflicts of Interest

The authors declare no conflict of interest.

References

  1. Miracle, D.B.; Senkov, O.N. A critical review of high entropy alloys and related concepts. Acta Mater. 2017, 122, 448–511. [Google Scholar] [CrossRef] [Green Version]
  2. Yeh, J.-W. Recent progress in high entropy alloys. Ann. Chim. Sci. Mater. 2006, 31, 633–648. [Google Scholar] [CrossRef]
  3. Yeh, J.-W.; Chen, S.-K.; Lin, S.-J.; Gan, J.-Y.; Chin, T.-S.; Shun, T.-T.; Tsau, C.-H.; Chang, S.-Y. Nanostructured high-entropy alloys with multiple principal elements: Novel alloy design concepts and outcomes. Adv. Eng. Mater. 2014, 6, 299–303. [Google Scholar] [CrossRef]
  4. Cantor, B.; Chang, I.T.H.; Knight, P.; Vincent, A.J.B. Microstructural development in equiatomic multicomponent alloys. Mater. Sci. Eng. A 2004, 375, 213–218. [Google Scholar] [CrossRef]
  5. Takeuchi, A.; Amiya, K.; Wada, T.; Yubuta, K.; Zhang, W. High-entropy alloys with a hexagonal close-packed structure designed by equi-atomic alloy strategy and binary phase diagrams. JOM 2014, 66, 1984–1992. [Google Scholar] [CrossRef]
  6. Zhang, Y.; Zuo, T.T.; Tang, Z.; Gao, M.C.; Dahmen, K.A.; Liaw, P.K.; Lu, Z.P. Microstructures and properties of high-entropy alloys. Prog. Mater. Sci. 2014, 61, 1–93. [Google Scholar] [CrossRef]
  7. Srikanth, M.; Raja Annamalai, A.; Muthuchamy, A.; Jen, C.-P. A Review of the Latest Developments in the Field of Refractory High-Entropy Alloys. Crystals 2021, 11, 612. [Google Scholar] [CrossRef]
  8. Senkov, O.N.; Miracle, D.B.; Chaput, K.J. Development and exploration of refractory high entropy alloys—A review. J. Mater. Res. 2018, 33, 3092–3128. [Google Scholar] [CrossRef] [Green Version]
  9. Senkov, O.N.; Wilks, G.B.; Miracle, D.B.; Chuang, C.P.; Liaw, P.K. Refractory high entropy alloys. Intermetallics 2010, 18, 1758–1765. [Google Scholar] [CrossRef]
  10. Lee, C.; Maresca, F.; Feng, R.; Chou, Y.; Ungar, T.; Widom, M.; An, K.; Poplawsky, J.D.; Chou, Y.-C.; Liaw, P.K.; et al. Strength can be controlled by edge dislocations in refractory high-entropy alloys. Nat. Comm. 2021, 12, 5474. [Google Scholar] [CrossRef]
  11. Yang, X.; Chen, S.Y.; Cotton, J.D.; Zhang, Y. Phase stability of low-density, multiprincipal component alloys containing aluminum, magnesium, and lithium. JOM 2014, 66, 2009–2020. [Google Scholar] [CrossRef]
  12. Nutor, R.K.; Cao, Q.; Wang, X.; Zhang, D.; Fang, Y.; Zhang, Y.; Jiang, J.-Z. Phase Selection, Lattice Distortions, and Mechanical Properties in High-Entropy Alloys. Adv. Eng. Mater. 2020, 22, 2000466. [Google Scholar] [CrossRef]
  13. Kang, B.; Lee, J.; Ryu, H.J.; Hong, S.H. Ultra-high strength WNbMoTaV high-entropy alloys with fine grain structure fabricated by powder metallurgical process. Mater. Sci. Eng. A 2018, 712, 616–624. [Google Scholar] [CrossRef]
  14. Otto, F.; Dlouhý, A.; Somsen, C.; Bei, H.; Eggeler, G.; George, E.P. The influences of temperature and microstructureon the tensile properties of a CoCrFeMnNi high-entropy alloy. Acta Mater. 2013, 61, 5743–5755. [Google Scholar] [CrossRef] [Green Version]
  15. Gludovatz, B.; Hohenwarter, A.; Catoor, D.; Chang, E.H.; George, E.P.; Ritchie, R.O. A fracture-resistant high-entropy alloy for cryogenic applications. Science 2014, 345, 1153–1158. [Google Scholar] [CrossRef] [PubMed] [Green Version]
  16. Senkov, O.N.; Scott, J.M.; Senkova, S.V.; Meisenkothen, F.; Miracle, D.B.; Woodward, C.F. Microstructure and elevated temperature properties of a refractory TaNbHfZrTi alloy. J. Mater. Sci. 2012, 47, 4062–4074. [Google Scholar] [CrossRef]
  17. Chen, S.Y.; Tong, Y.; Tseng, K.-K.; Yeh, J.-W.; Poplawsky, J.D.; Wen, J.G.; Gao, M.C.; Kim, G.; Chen, W.; Ren, Y.; et al. Phase transformations of HfNbTaTiZr high-entropy alloy at intermediate temperatures. Scr. Mater. 2019, 158, 50–56. [Google Scholar] [CrossRef]
  18. Shi, Y.; Yang, B.; Liaw, P.K. Corrosion-Resistant High-Entropy Alloys: A Review. Metals 2017, 7, 43. [Google Scholar] [CrossRef] [Green Version]
  19. Vrtnik, S.; Koželj, P.; Meden, A.; Maiti, S.; Steurer, W.; Feuerbacher, M.; Dolinšek, J. Superconductivity in thermally annealed Ta-Nb-Hf-Zr-Ti high-entropy alloys. J. Alloy. Compd. 2017, 695, 3530–3540. [Google Scholar] [CrossRef]
  20. Yuan, Y.; Wu, Y.; Tong, X.; Zhang, H.; Wang, H.; Liu, X.J.; Ma, L.; Suo, H.L.; Lu, Z.P. Rare-earth high-entropy alloys with giant magnetocaloric effect. Acta Mater. 2007, 125, 481–489. [Google Scholar] [CrossRef] [Green Version]
  21. Sahlberg, M.; Karlsson, D.; Zlotea, C.; Jansson, U. Superior hydrogen storage in high entropy alloys. Sci. Rep. 2016, 6, 36770. [Google Scholar] [CrossRef] [Green Version]
  22. Nygård, M.M.; Ek, G.; Karlsson, D.; Sahlberg, M.; Sørby, M.H.; Hauback, B.C. Hydrogen storage in high-entropy alloys with varying degree of local lattice strain. Int. J. Hydrog. Energy 2019, 44, 29140–29149. [Google Scholar] [CrossRef] [Green Version]
  23. Zlotea, C.; Sow, M.A.; Ek, G.; Couzinié, J.-P.; Guillot, I.; Bourgon, J.; Møller, K.T.; Jensen, T.R.; Akiba, E.; Sahlberg, M. Hydrogen sorption in TiZrNbHfTa high entropy alloy. J. Alloy. Compd. 2019, 775, 667–674. [Google Scholar] [CrossRef]
  24. Čížek, J.; Kalivodová, J.; Janeček, M.; Stráský, J.; Srba, O.; Macková, A. Advanced Structural Materials for Gas-Cooled Fast Reactors—A Review. Metals 2020, 11, 76. [Google Scholar] [CrossRef]
  25. Nagase, T.; Rack, P.D.; Noh, J.H.; Egami, T. In-situ TEM observation of structural changes in nano-crystalline CoCrCuFeNi multicomponent high-entropy alloy (HEA) under fast electron irradiation by high voltage electron microscopy (HVEM). Intermetallics 2015, 59, 32–42. [Google Scholar] [CrossRef] [Green Version]
  26. Xia, S.Q.; Yang, X.; Yang, T.F.; Liu, S.; Zhang, Y. Irradiation resistance in AlxCoCrFeNi high entropy alloy. JOM 2015, 67, 2340–2344. [Google Scholar] [CrossRef]
  27. He, M.; Wang, S.; Jin, K.; Bei, H.; Yasuda, K.; Matsumura, S. Enhanced damage resistance and novel defect structure of CrFeCoNi under in situ electron irradiation. Scr. Mater. 2016, 125, 5–9. [Google Scholar] [CrossRef] [Green Version]
  28. Zinkle, S.J.; Was, G.S. Materials challenges in nuclear energy. Acta Mater. 2013, 61, 735–758. [Google Scholar] [CrossRef]
  29. Kenik, E.A.; Busby, J.T. Radiation-induced degradation of stainless steel light water reactor internals. Mater. Sci. Eng. R Rep. 2012, 73, 67–83. [Google Scholar] [CrossRef]
  30. Bruemmer, S.M.; Simonen, E.P.; Scott, P.M.; Andresen, P.L.; Was, G.S.; Nelson, J.L. Radiation-induced material changes and susceptibility to intergranular failure of light-water-reactor core internals. J. Nucl. Mater. 1999, 274, 299–314. [Google Scholar] [CrossRef]
  31. Senkov, O.N.; Wilks, G.B.; Scott, J.M.; Miracle, D.B. Mechanical properties of Nb25Mo25Ta25W25 and V20Nb20Mo20Ta20W20 refractory high entropy alloys. Intermetallics 2011, 19, 698–706. [Google Scholar] [CrossRef]
  32. Luo, D.; Zhou, Q.; Ye, W.; Ren, Y.; Greiner, C.; He, Y.; Wang, H. Design and Characterization of Self-Lubricating Refractory High Entropy Alloy-Based Multilayered Films. ACS Appl. Mater. Interfaces 2021, 13, 55712–55725. [Google Scholar] [CrossRef] [PubMed]
  33. Zou, Y.; Ma, H.; Spolenak, R. Ultrastrong ductile and stable high-entropy alloys at small scales. Nat. Commun. 2015, 6, 7748. [Google Scholar] [CrossRef] [PubMed] [Green Version]
  34. Fritze, S.; Malinovskis, P.; Riekehr, L.; von Fieandt, L.; Lewin, E.; Jansson, U. Hard and crack resistant carbon supersaturated refractory nanostructured multicomponent coatings. Sci. Rep. 2018, 8, 14508. [Google Scholar] [CrossRef] [PubMed]
  35. Niinomi, M.; Nakai, M.; Hieda, J. Development of new metallic alloys for biomedical applications. Acta Biomater. 2012, 8, 3888–3903. [Google Scholar] [CrossRef]
  36. Senkov, O.N.; Scott, J.M.; Senkova, S.V.; Miracle, D.B.; Woodward, C.F. Microstructure and room temperature properties of a high-entropy TaNbHfZrTi alloy. J. Alloy. Compd. 2011, 509, 6043. [Google Scholar] [CrossRef]
  37. Heidelmann, M.; Feuerbacher, M.; Ma, D.; Grabowski, B. Structural anomaly in the high-entropy alloy ZrNbTiTaHf. Intermetallics 2016, 68, 11–15. [Google Scholar] [CrossRef]
  38. Zýka, J.; Málek, J.; Veselý, J.; Lukáč, F.; Čížek, J.; Kuriplach, J.; Melikhova, O. Microstructure and Room Temperature Mechanical Properties of Different 3 and 4 Element Medium Entropy Alloys from HfNbTaTiZr System. Entropy 2019, 27, 114. [Google Scholar] [CrossRef] [Green Version]
  39. Senkov, O.N.; Semiatin, S.L. Microstructure and properties of a refractory high-entropy alloy after cold working. J. Alloy. Compd. 2015, 649, 1110–1123. [Google Scholar] [CrossRef]
  40. Couzinié, J.P.; Dirras, G.; Perrière, L.; Chauveau, T.; Leroy, E.; Champion, Y.; Guillot, I. Microstructure of a near-equimolar refractory high-entropy alloy. Mater. Lett. 2014, 126, 285–287. [Google Scholar] [CrossRef]
  41. Schuh, B.; Völker, B.; Todt, J.; Schell, N.; Perrière, L.; Li, J.; Couzinié, J.P.; Hohenwarter, A. Thermodynamic instability of a nanocrystalline, single-phase TiZrNbHfTa alloy and its impact on the mechanical properties. ActaMater. 2018, 142, 201–212. [Google Scholar] [CrossRef]
  42. Coelho, A.A. TOPAS Version 5 (Computer Software), Coelho Software; Brisbane, Australia. 2016. Available online: http://www.topas-academic.net/ (accessed on 1 January 2022).
  43. Guo, S.; Ng, C.; Lu, J.; Liu, C.T. Effect of valence electron concentration on stability of fcc or bcc phase in high entropy alloys. J. Appl. Phys. 2011, 109, 103505. [Google Scholar] [CrossRef] [Green Version]
  44. Takeuchi, A.; Inoue, A. Classification of Bulk Metallic Glasses by Atomic Size Difference, Heat of Mixing and Period of Constituent Elements and Its Application to Characterization of the Main Alloying Element. Mater. Trans. 2005, 46, 2817–2829. [Google Scholar] [CrossRef] [Green Version]
  45. Yang, X.; Zhang, Y. Prediction of high-entropy stabilized solid-solution in multi-component alloys. Mater. Chem. Phys. 2012, 132, 233–238. [Google Scholar] [CrossRef]
  46. Zhang, Y.; Zhou, Y.J.; Lin, J.P.; Chen, G.L.; Liaw, P.K. Solid-solution phase formation rules for multi-component alloys. Adv. Eng. Mater. 2008, 10, 534–538. [Google Scholar] [CrossRef]
  47. Guo, S.; Hu, Q.; Ng, C.; Liu, C.T. More than entropy in high-entropy alloys forming solid solutions or amorphous phase. Intermetallics 2013, 41, 96–103. [Google Scholar] [CrossRef]
  48. Čížek, J.; Haušild, P.; Cieslar, M.; Melikhova, O.; Vlasák, T.; Janeček, M.; Král, R.; Harcuba, P.; Lukáč, F.; Zýka, J.; et al. Strength enhancement of high entropy alloy HfNbTaTiZr by severe plastic deformation. J. Alloy. Compd. 2018, 768, 924–937. [Google Scholar] [CrossRef]
  49. Varvenne, C.; Luque, A.; Curtin, W.A. Theory of strengthening in fcc high entropy alloys. Acta Mater. 2016, 118, 164–176. [Google Scholar] [CrossRef] [Green Version]
  50. Hua, D.; Xia, Q.; Wang, W.; Zhou, Q.; Li, S.; Qian, D.; Shi, J.; Wan, H. Atomistic insights into the deformation mechanism of a CoCrNi medium entropy alloy under nanoindentation. Int. J. Plast. 2021, 142, 102997. [Google Scholar] [CrossRef]
  51. Zýka, J.; Málek, J.; Pala, Z.; Andršová, I.; Veselý, J. Structure and Mechanical Properties of TaNbHfZrTi High Entropy Alloy. In Proceedings of the Metal 2015—24th International Conference on Metallurgy and Materials, Brno, Czech Republic, 3–5 June 2015. [Google Scholar]
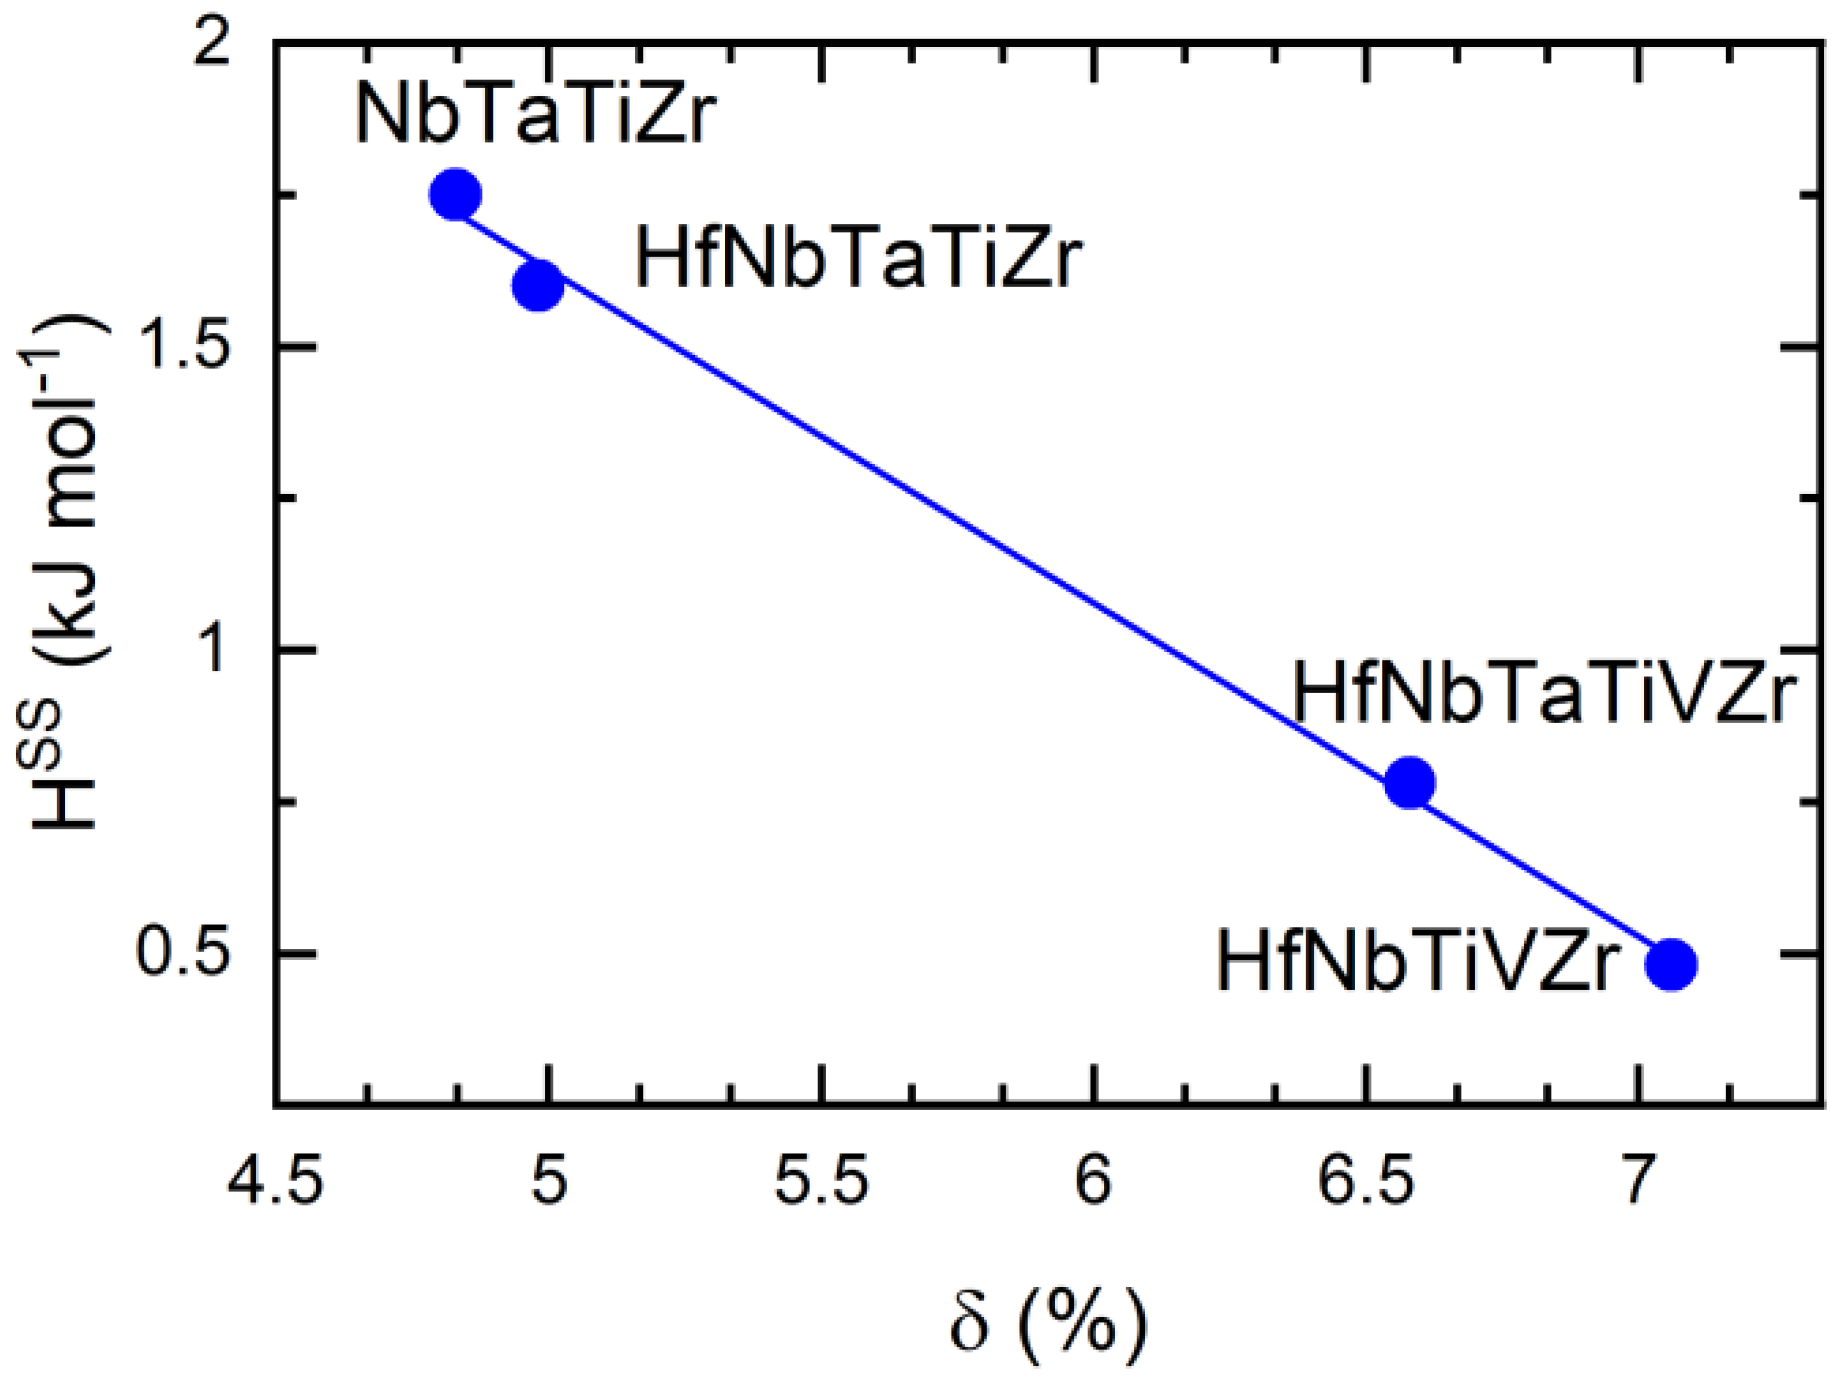
Figure 1. Correlation plot of the mixing enthalpy of solid solution HSS and the atomic misfit parameter δ.
Metals 12 00394 g001
Figure 2. SEM micrographs (back-scattered electrons) and results of the EDS analysis of NbTaTiZr alloy in the as-cast state: (a) edge of the ingot is on top of the figure; (b) center of the ingot, (c) EDS line scan with the concentration profile at the edge of the ingot, (d) EDS line scan in the center of the ingot. The position of the line scan is indicated by the horizontal white line. Regions used for EDS point scans in order to determine the composition of Ti, Zr and Nb, Ta-rich phases are denoted by star and cross symbols, respectively.
Metals 12 00394 g002
Figure 3. XRD patterns of NbTaTiZr alloy in the as-cast state and after annealing at 1200 °C. Reflections for Ti, Zr-rich and Nb, Ta-rich bcc phases are denoted by stars and crosses, respectively. The label β denotes reflection arising from the Cu Kβ wavelength. The origin of the peak denoted by the ? label is unknown.
Metals 12 00394 g003
Figure 4. SEM micrographs (back-scattered electrons) of NbTaTiZr alloy annealed at 1200 °C: (a) an overview of the microstructure, (b) detail taken in higher magnification.
Metals 12 00394 g004
Figure 5. EDS elemental maps of NbTaTiZr alloy annealed at 1200 °C (SEM micrograph in the upper left panel shows the inspected region).
Metals 12 00394 g005
Figure 6. SEM micrographs (back-scattered electrons) of HfNbTaTiZr alloy in the as-cast state: (a) an overview of the microstructure, (b) detail of the microstructure taken in higher magnification. Region used for EDS point scans to determine the composition of the Ti, Zr and Nb, Ta-rich phases are denoted by the star and cross symbols, respectively.
Metals 12 00394 g006
Figure 7. EDS elemental maps of HfNbTaTiZr alloy in the as-cast state (SEM micrograph in the upper left panel shows the inspected region).
Metals 12 00394 g007
Figure 8. XRD pattern of HfNbTaTiZr alloy in the as-cast state and after annealing at 1200 °C. The label β denotes reflection arising from the Cu Kβ wavelength.
Metals 12 00394 g008
Figure 9. SEM micrographs (back-scattered electrons) of HfNbTaTiZr alloy annealed at 1200 °C: (a) an overview of the microstructure (b) detail of the microstructure taken in higher magnification.
Metals 12 00394 g009
Figure 10. EDS elemental maps of HfNbTaTiZr alloy annealed at 1200 °C (SEM micrograph in the upper left panel indicates the inspected region).
Metals 12 00394 g010
Figure 11. SEM micrograph (secondary electrons) of HfNbTaTiZr alloy annealed at 1000 °C for 1 h and slowly cooled with furnace (a) boundary between three grains, (b) detail of particles of the Hf, Ti, Zr-rich hcp phase formed preferentially at grain boundaries.
Metals 12 00394 g011
Figure 12. SEM micrograph (back-scattered electrons) of HfNbTiVZr alloy in the as-cast state: (a) an overview of the microstructure, (b) detail of grain boundary with V-rich particles.
Metals 12 00394 g012
Figure 13. EDS elemental maps of particles formed at grain boundaries in as-cast HfNbTiVZr alloy (SEM micrograph in the upper left panel shows the inspected region).
Metals 12 00394 g013
Figure 14. XRD pattern of HfNbTiVZr alloy in the as-cast state and after annealing at 1200 °C. The label β denotes reflection arising from the Cu Kβ wavelength.
Metals 12 00394 g014
Figure 15. SEM micrograph (back-scattered electrons) of HfNbTiVZr alloy annealed at 1200 °C: (a) an overview of the microstructure, (b) a detail of the grain boundary enriched in V.
Metals 12 00394 g015
Figure 16. SEM micrograph (back-scattered electrons) of HfNbTaTiVZr alloy in the as-cast state: (a) an overview of the microstructure, (b) a detail of the grain boundary enriched in V.
Metals 12 00394 g016
Figure 17. EDS elemental maps of as-cast HfNbTaTiVZr alloy(SEM micrographin the upper left panel shows the inspected region).
Metals 12 00394 g017
Figure 18. XRD pattern of HfNbTaTiVZr alloy in the as-cast state and after annealing at 1200 °C. The label β denotes reflection arising from the Cu Kβ wavelength.
Metals 12 00394 g018
Figure 19. SEM micrograph (back-scattered electrons) of HfNbTaTiVZr alloy annealed at 1200 °C: (a) an overview of the microstructure, (b) a detail of the grain boundary.
Metals 12 00394 g019
Figure 20. EDS elemental maps of as-cast HfNbTaTiVZr alloy annealed at 1200 °C (SEM micrograph in the upper left panel shows the inspected region).
Metals 12 00394 g020
Figure 21. Microhardness of NbTaTiZr, HfNbTaTiZr, HfNbTiVZr, and HfNbTaTiVZr alloys plotted as a function of the atomic misfit parameter δ; full symbols—as-cast alloys; open symbols—annealed alloys.
Metals 12 00394 g021
Figure 22. Stress–strain curves of HfNbTaTiZr alloy subjected to tensile deformation at room temperature with the strain of 10−3 s−1. Results for the as-cast HfNbTaTiZr alloy (blue curve) and the alloy annealed at 1200 °C (red curve) are compared.
Metals 12 00394 g022
Table 1. A list of compositions and properties of CCAs studied: δ—atomic misfit parameter; VEC—average valence electron concentration; SSS—molar configurational entropy of ideal solid solution in units of the universal gas constant R; HSS—mixing enthalpy of solid solution; HV0.5—Vickers hardness of the alloy in the as-cast state and after annealing in vacuum at 1200 °C for 2 h finished by quenching.
Compositionδ
(%)
VECSSS
®
HSS
(kJ/mol)
HV0.5
as-Cast
HV0.5
Annealed
NbTaTiZr4.834.51.391.75371 ± 5377 ± 5
HfNbTaTiZr4.984.41.611.60354 ± 6368 ± 5
HfNbTiVZr7.064.41.610.48381 ± 5370 ± 5
HfNbTaTiVZr6.584.51.790.78418 ± 6417 ± 5
Table 2. Atomic radii ri, equilibrium structure and lattice parameters of refractory metals Hf, Nb, Ta, Ti, V, and Zr. The table contains data for both allotropic phases for Hf, Ti, and Zr.
Elementri
(Å)
StructureLattice Parameters
(Å)
Temperature Range (°C)
Hf (α)1.56hcpa = 3.196, c = 5.051<1995 °C
Hf (β)1.56bcca = 3.610>1995 °C
Nb1.43bcca = 3.300-
Ta1.43bcca = 3.301-
Ti (α)1.45hcpa = 2.951, c = 4.686<882 °C
Ti (β)1.43bcca = 3.306>882 °C
V1.31bcca = 3.03-
Zr (α)1.59hcpa = 3.232, c = 5.147<865 °C
Zr (β)1.56bcca = 3.609>865 °C
Publisher’s Note: MDPI stays neutral with regard to jurisdictional claims in published maps and institutional affiliations.

