Article

Effect of Prolonged Thermal Exposure on Low-Cycle Bending Fatigue Resistance of Low-Carbon Steel

by
Sergey A. Nikulin
1,
Stanislav O. Rogachev
1,2,*,
Vladislav A. Belov
1,
Mikhail Y. Zadorozhnyy
3,
Nikolay V. Shplis
1 and
Mikhail M. Skripalenko
4
1
Department of Physical Metallurgy and Physics of Strength, National University of Science and Technology MISIS, 119049 Moscow, Russia
2
Baikov Institute of Metallurgy and Materials Science, Russian Academy of Sciences, 119334 Moscow, Russia
3
Centre of Composite Materials, National University of Science and Technology MISIS, 119049 Moscow, Russia
4
Department of Metal Forming, National University of Science and Technology MISIS, 119049 Moscow, Russia
*
Author to whom correspondence should be addressed.
Metals 2022, 12(2), 281; https://doi.org/10.3390/met12020281
Submission received: 30 December 2021 / Revised: 29 January 2022 / Accepted: 31 January 2022 / Published: 4 February 2022

Abstract

:
Using a dynamic mechanical analyzer, the comparative studies of a low-cycle bending fatigue were carried out for AISI 1022 low-carbon steel after extreme thermal exposure, simulating the severe beyond-design-basis accident at nuclear power plants. In the as-delivered state, the steel has a high resistance to low-cycle fatigue (the fatigue strength at N = 3.5 × 10⁴ cycles (σNf) was 360 MPa). Long-term thermal exposure led to a slight decrease in the resistance to low-cycle fatigue of steel: σNf is decreased by 9%. The influence of AISI 1022 steel structure on the characteristics of fatigue strength and fracture mechanisms is analyzed.

1. Introduction

Currently, low-carbon steels remain the most popular structural material for civil and industrial construction of buildings and structures [1,2,3]. This is due to the good combination of satisfactory mechanical properties, good weldability and the low cost of these steels. Therefore, as a rule, large-sized products and structures are made of such steels. In particular, low-carbon steels of the AISI 1022 type (22 K—Russian standard) are used for the manufacture of core catcher vessels (CC-vessel) with a wall thickness of 60 mm for nuclear power plants with new VVER reactors [4]. The permissible operating temperatures of products made of AISI 1022 steel do not exceed 450 °C [5,6,7]. At the same time, with the development of a severe beyond-design-basis accident, when the corium falls outside the reactor core, the CC-vessel, according to calculations, heats up to 1000–1200 °C with subsequent long-term cooling [8,9]. Under such conditions, a significant change in the steel structure can occur and, as a consequence, cause the degradation of the mechanical properties of steel (due to the growth of austenitic grain and the development of reversible temper embrittlement), leading to a loss of strength in the CC-vessel and an increase in the risk of its fracture.
Recently, data on the study and clarification of the high-temperature properties of low-carbon steels under static loading have appeared in the literature [10,11]. At the same time, the problem of the resistance of the material for the CC-vessel to low-frequency, low-cycle fatigue is urgent, primarily for nuclear power plants operating in seismically active regions.
The low-cycle fatigue and high-cycle fatigue of low-carbon steels have been widely studied [12,13,14,15,16,17,18,19,20]. However, detailed studies of the effect of the steel structure after extreme thermal exposure on the low-cycle fatigue of such steels have practically not been carried out. Comparison of the few available research results on this problem is impossible due to the use of different schemes and test conditions.
The use of a dynamic mechanical analyzer (DMA) is very effective for conducting studies of low-cycle fatigue; the simplicity of and information on this test method were shown earlier in a comparative assessment of the fatigue resistance of various materials, namely NiTi [21], zirconium alloys [22], Cu-Nb nanocomposite wires [23], etc.
In this work, using a DMA, the comparative studies of low-cycle bending fatigue of AISI 1022 low-carbon steel, having different types of structures obtained under prolonged thermal exposure and simulating the conditions of severe beyond-design-basis accident at nuclear power plants, are carried out.

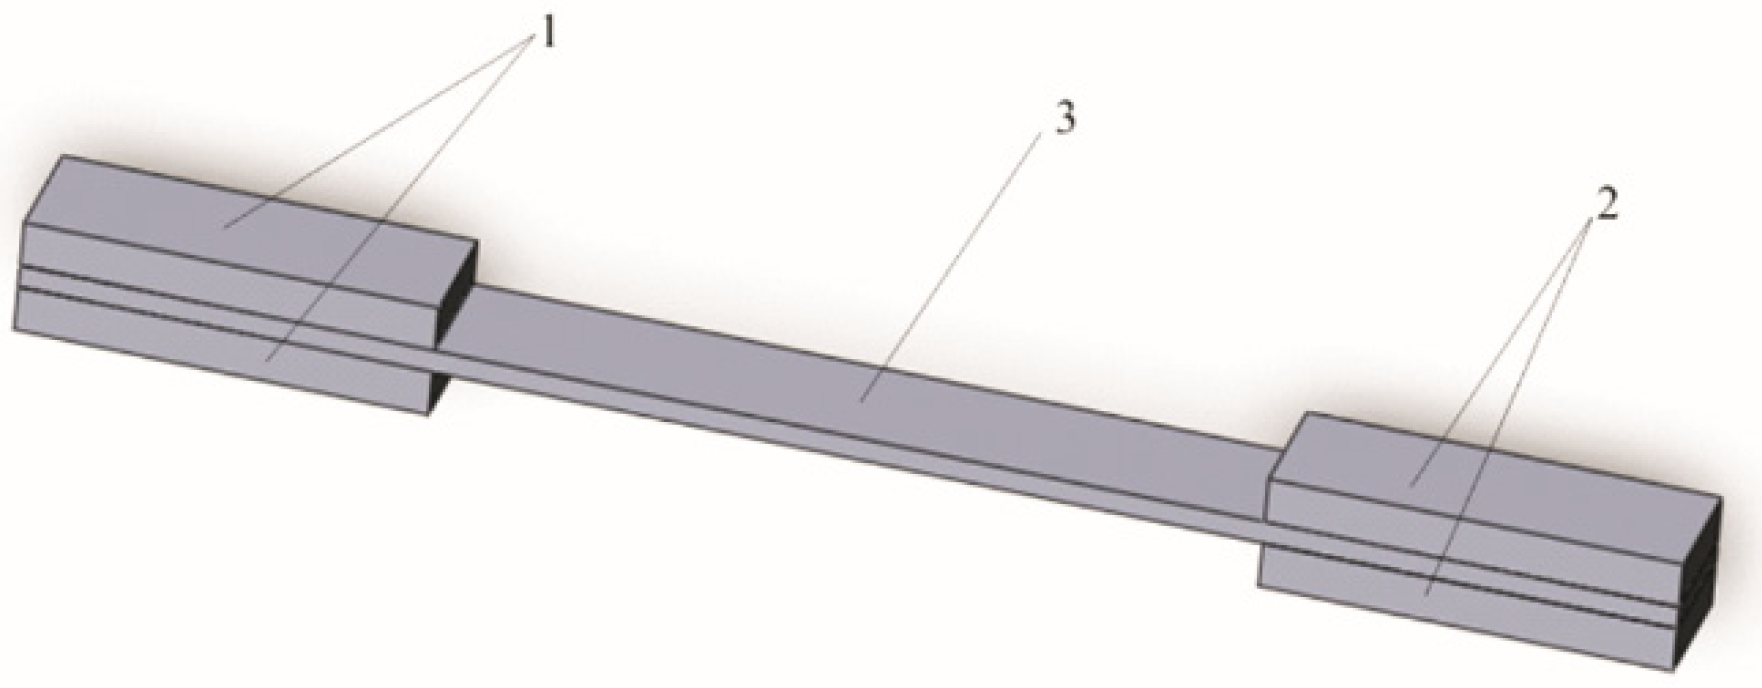
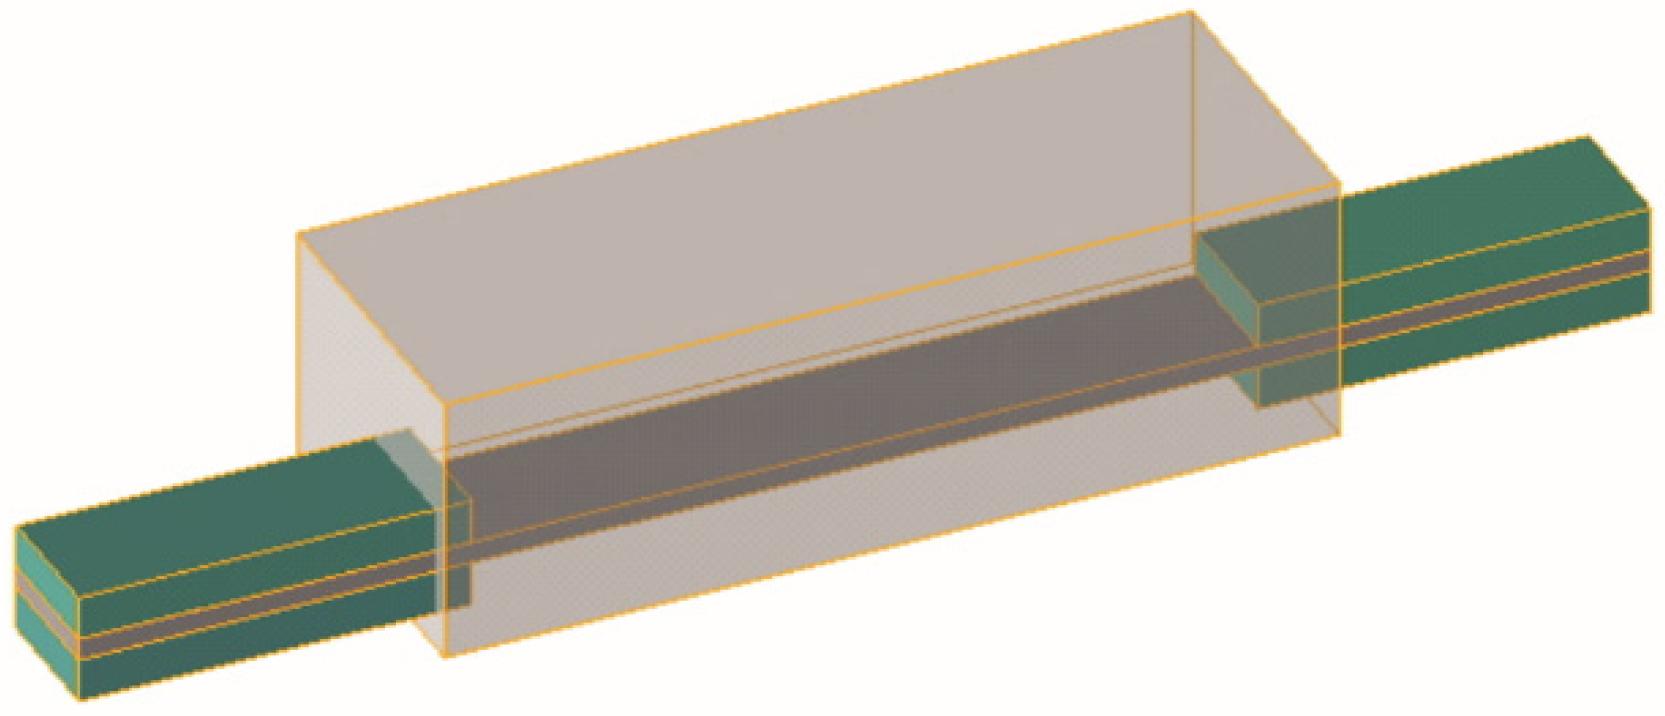
2. Materials and Methods

As a raw material, AISI 1022 steel (22 K—Russian standard), as delivered (sheet 60 mm thick after hot rolling and normalizing), was used. The chemical composition of the steel is shown in Table 1.
The studies of AISI 1022 steel samples in three states were carried out:
  • As delivered;
  • After heat treatment (TO-1), provoking temper embrittlement, according to the mode: heating to 650 °C at a rate of 200 °C/h; cooling to 480 °C at a rate of 1 °C/h; further slow cooling with an oven to room temperature [11];
  • After heat treatment (TO-2), provoking the growth of austenite grains, according to the mode: heating to 1200 °C at a rate of 200 °C/h; exposure—3.7 h; further slow cooling with an oven to room temperature.
Heat treatment was carried out in an electric furnace of the SNVE 1.3.1/16I4 type (CNIITMASH, Moscow, Russia) in a vacuum of ~6.5 × 10⁻³ Pa. During heat treatment, an automatic digital recording of signals from control thermocouples was carried out.
Flat specimens 35.0 mm × 3.0 mm × 0.5 mm in size were used for the low-cycle fatigue tests. These specimens were cut by the electric spark method from the initial steel sheet in the transverse direction. Before testing, all faces of the specimens were polished to a mirror finish, using Grit500 and Grit1000 abrasive papers and a SiC suspension with an abrasive particle size of 0.05 μm.
The tests were carried out using a DMA Q800 setup (TA Instruments, New Castle, DE, USA). DMA Q800 is an instrument used to test the mechanical properties of many different materials. Basically, a deformation is imposed on the specimen in order to evaluate the mechanical properties of the material. DMA Q800 utilizes non-contact, linear drive technology to provide a precise control of stress. Strain is measured using optical encoder technology that provides a high sensitivity and resolution.
The tests were carried out according to the transverse bending scheme in one plane at a constant stress amplitude (σa), i.e., under stress-controlled conditions, with an alternating symmetric loading cycle (asymmetry coefficient R = −1), using a single cantilever gripper, according to the previously described method [22]. When the gripper moved during the tests, the specimen was symmetrically deflected by a set amplitude from the initial position. The stress amplitude of the loading cycles was chosen in the range of 40–95% of the maximum stress to failure (σmax). The σmax was determined by bending the specimen as follows. We carried out a test for alternating bending, constantly increasing the amplitude of each cycle (stress increment test), until the specimen failure moment [22]. As a result, several cycles caused specimen failure. The stress at which failure occurred was taken as σmax. This is due to the fact that we tested highly ductile steel, and during one bending cycle (even with a large bending amplitude), the specimen failure did not occur.
The tests were carried out at a temperature of 30 °C and a frequency of 0.5 Hz. The number of cycles to failure (Nf) based on 3.5 × 10⁴ cycles was determined. Three specimens were used for each stress amplitude (σa).
Fatigue fracture surfaces were analyzed using a JSM-IT500 (JEOL Ltd., Tokyo, Japan) scanning electron microscope at 30×–2000× magnifications.
Metallographic studies of the specimens were carried out using an AxioObserver D1m (Carl Zeiss Microscopy GmbH, Jena, Germany) optical microscope at magnification up to 500× on thin sections before and after etching in a 5% nitric acid solution. Additionally, the surfaces of the specimens after fatigue tests were studied at low magnifications (50×).
Experimental studies were simulated using the QForm finite element analysis software (QForm 9.0.10, QuantorForm LLC, Moscow, Russia). Before this, parts for grippers and a strip, with their subsequent assembly, were created using SolidWorks (Figure 1).
The resulting assembly was loaded into the QShape geometry editor, and a finite element mesh was generated for each of the assembly components. Then, the initial and boundary conditions were set in QForm; the speed of movement of the gripper in the vertical direction was set equal to 20 mm/s, and the friction factor between the gripper and the strip was set equal to 10 (“Sticking” friction law). The displacement of the gripper varied from 0 to 10 mm. To increase the accuracy of calculating the shape change of the strip, we used the boundary condition for adapting the mesh of finite elements for a workpiece in the form of a parallelepiped (Figure 2). Within this area, the size of the finite element did not exceed 0.2 mm.
The non-linear FEM model was used, and flow stress was given as a function of temperature, strain and strain rate. After this, the QForm software converts these data into graphs using its own linear interpolation procedure. The QForm software version considers isotropic hardening. Effective stress was calculated using the von Mises equation, Equation (1):
σ ¯ = 1 2 ( σ 1 σ 2 ) 2 + ( σ 2 σ 3 ) 2 + ( σ 3 σ 1 ) 2 ,
where: σ1, σ2, σ3—principal stresses.

3. Results and Discussion

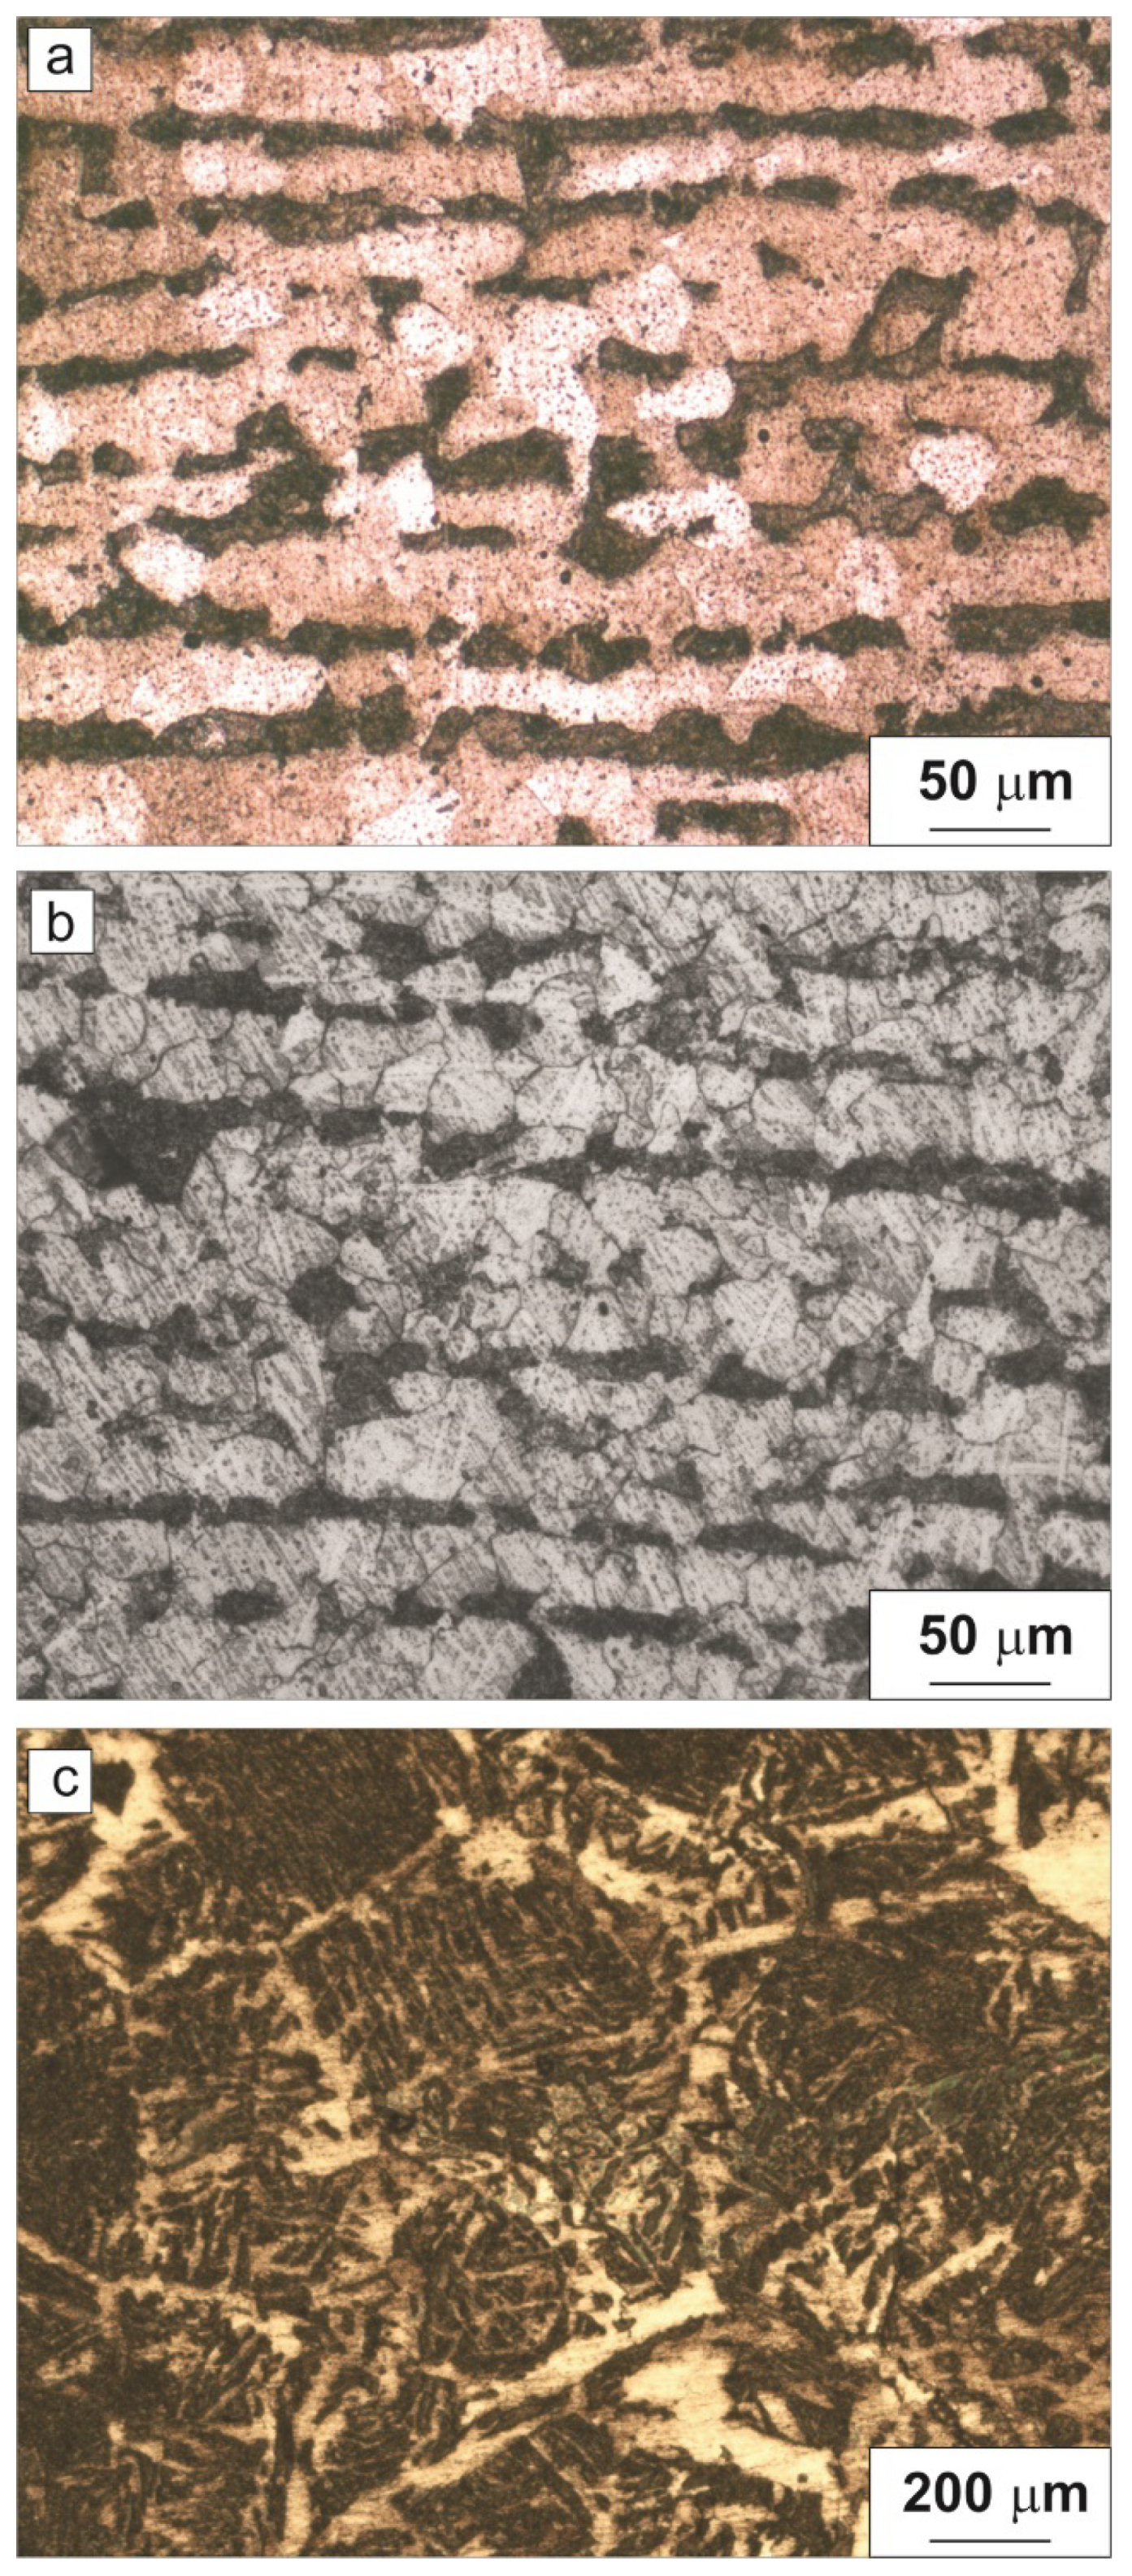
3.1. Structure of Steel before Cyclic Testing

Figure 3 shows the structure of AISI 1022 steel after different treatments. For the as-delivered steel, a ferrite-pearlite banding was observed. The predominant grain size of ferrite was 15–35 µm. After TO-1, no significant changes in the structure were revealed. On the contrary, TO-2 led to the formation of a needle-like, coarse-grained overheating structure with a predominant grain size of 300–600 µm.

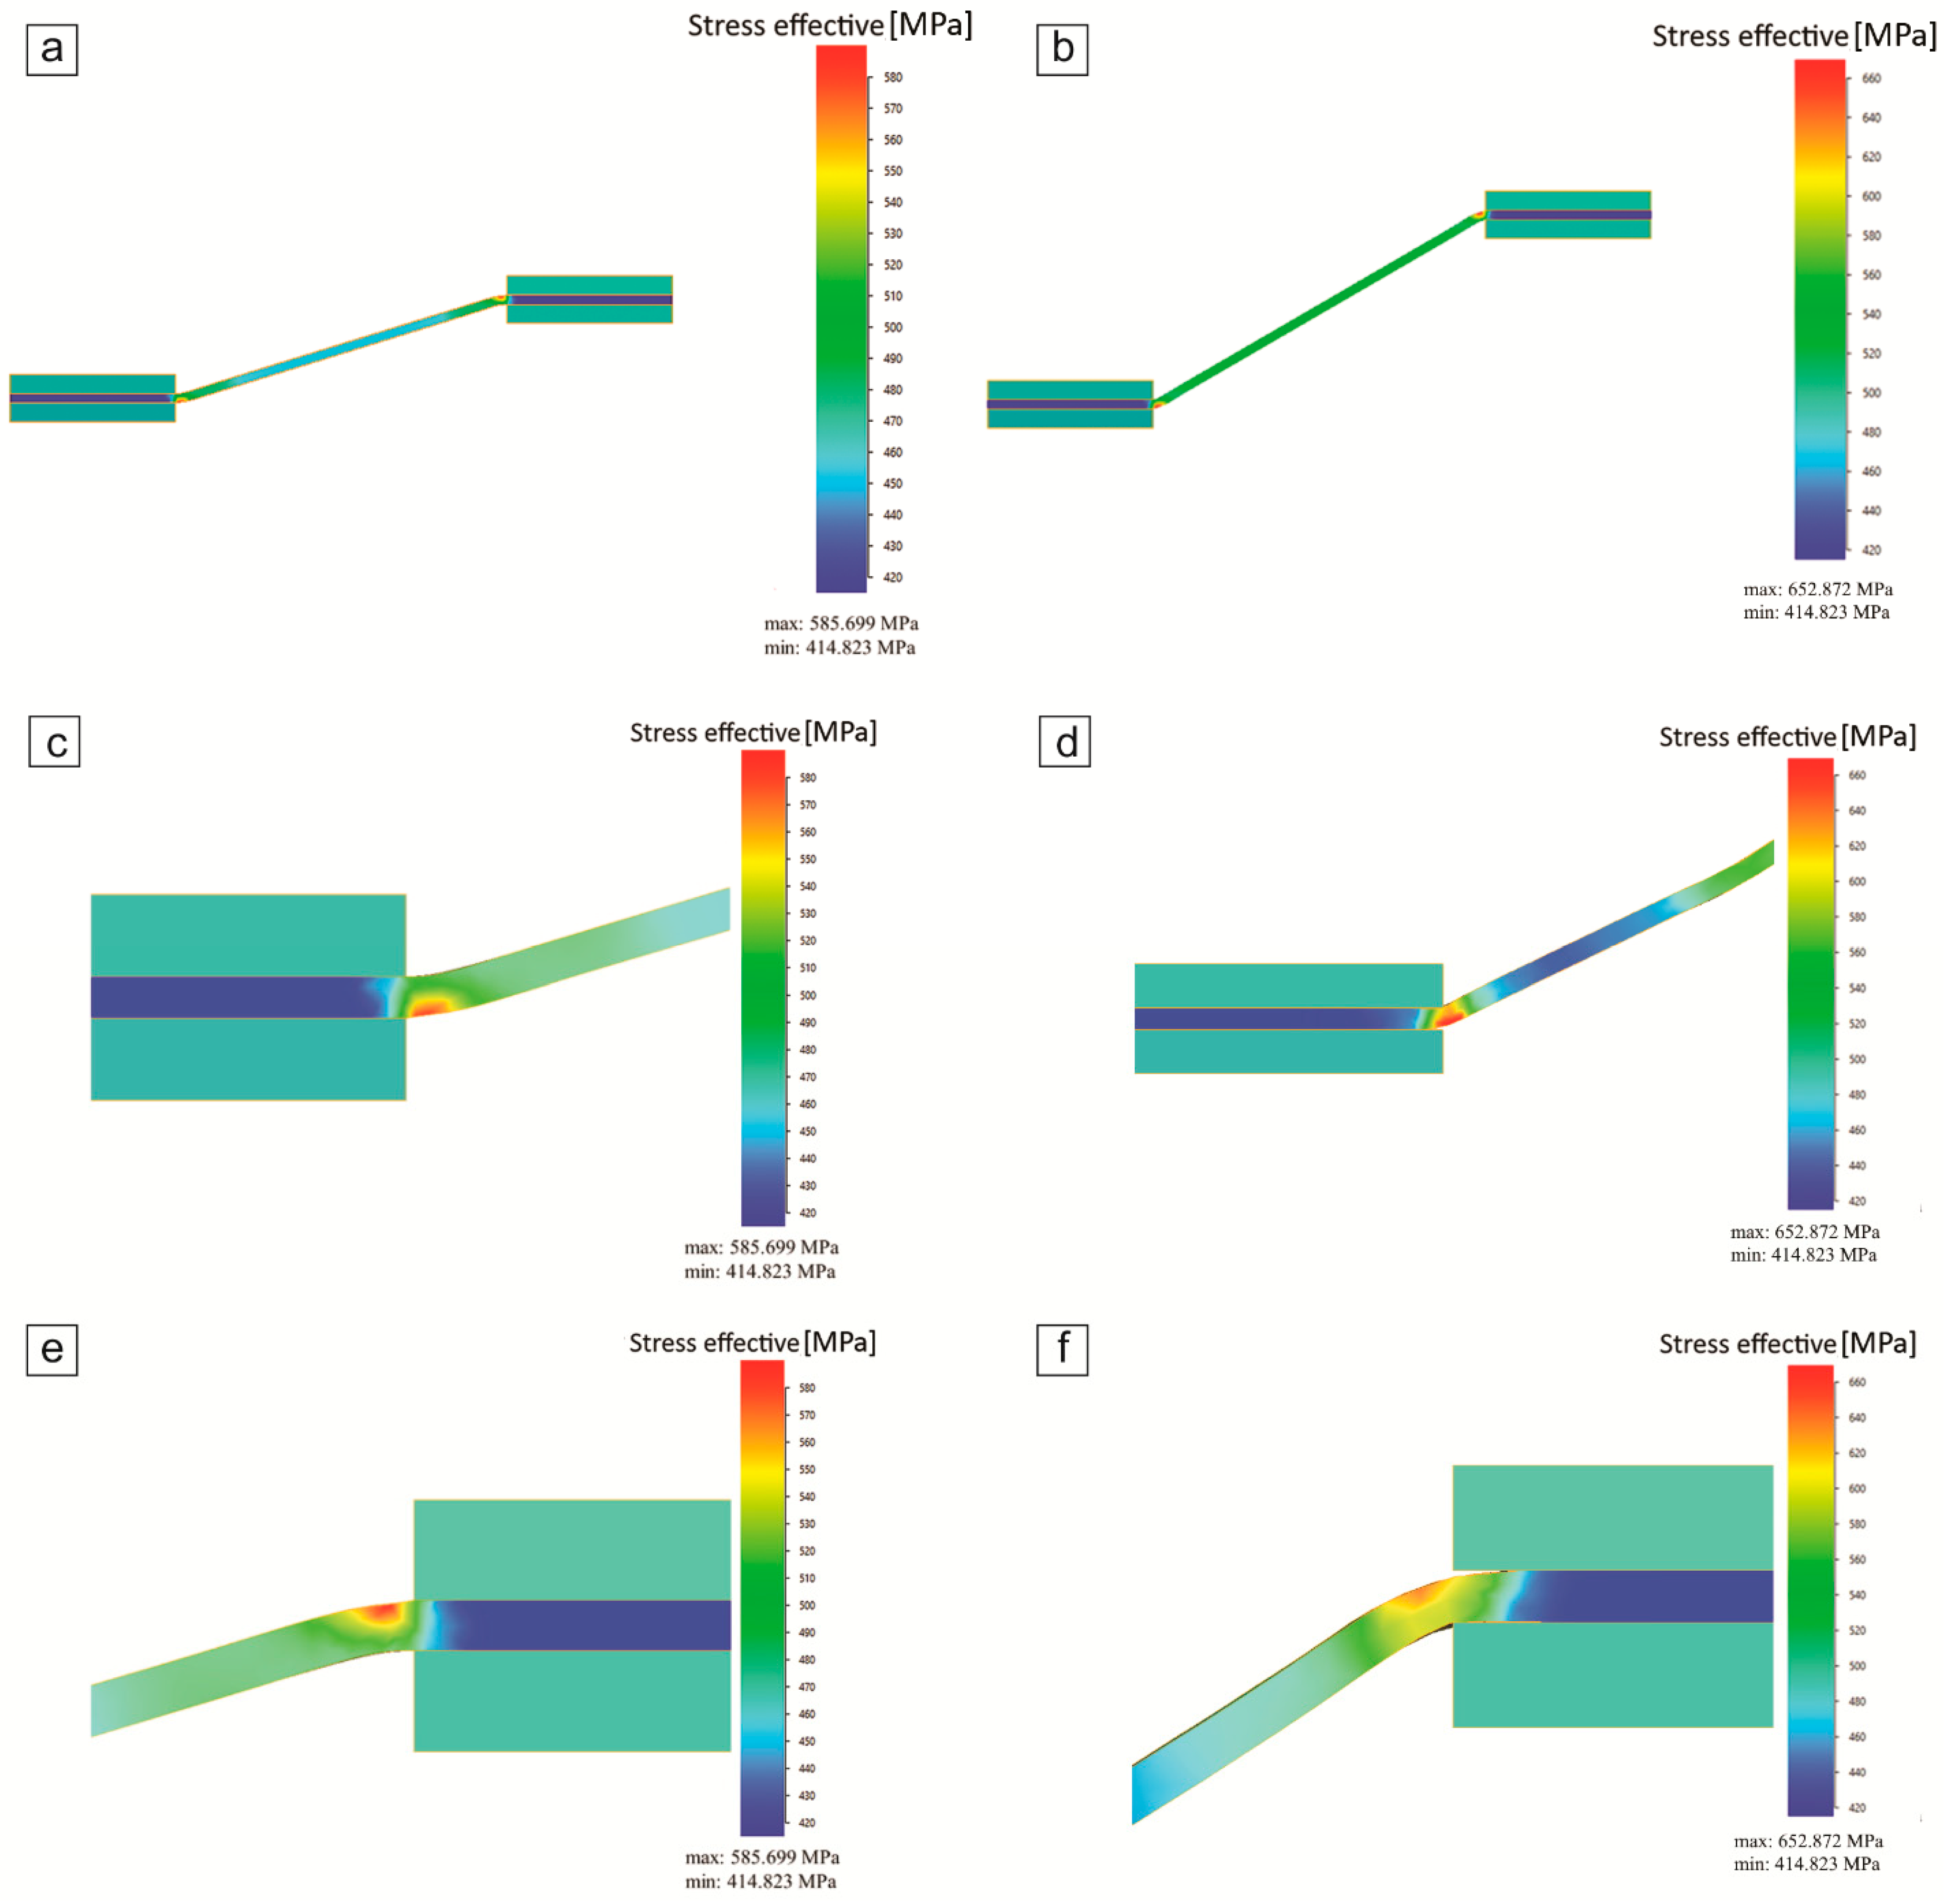
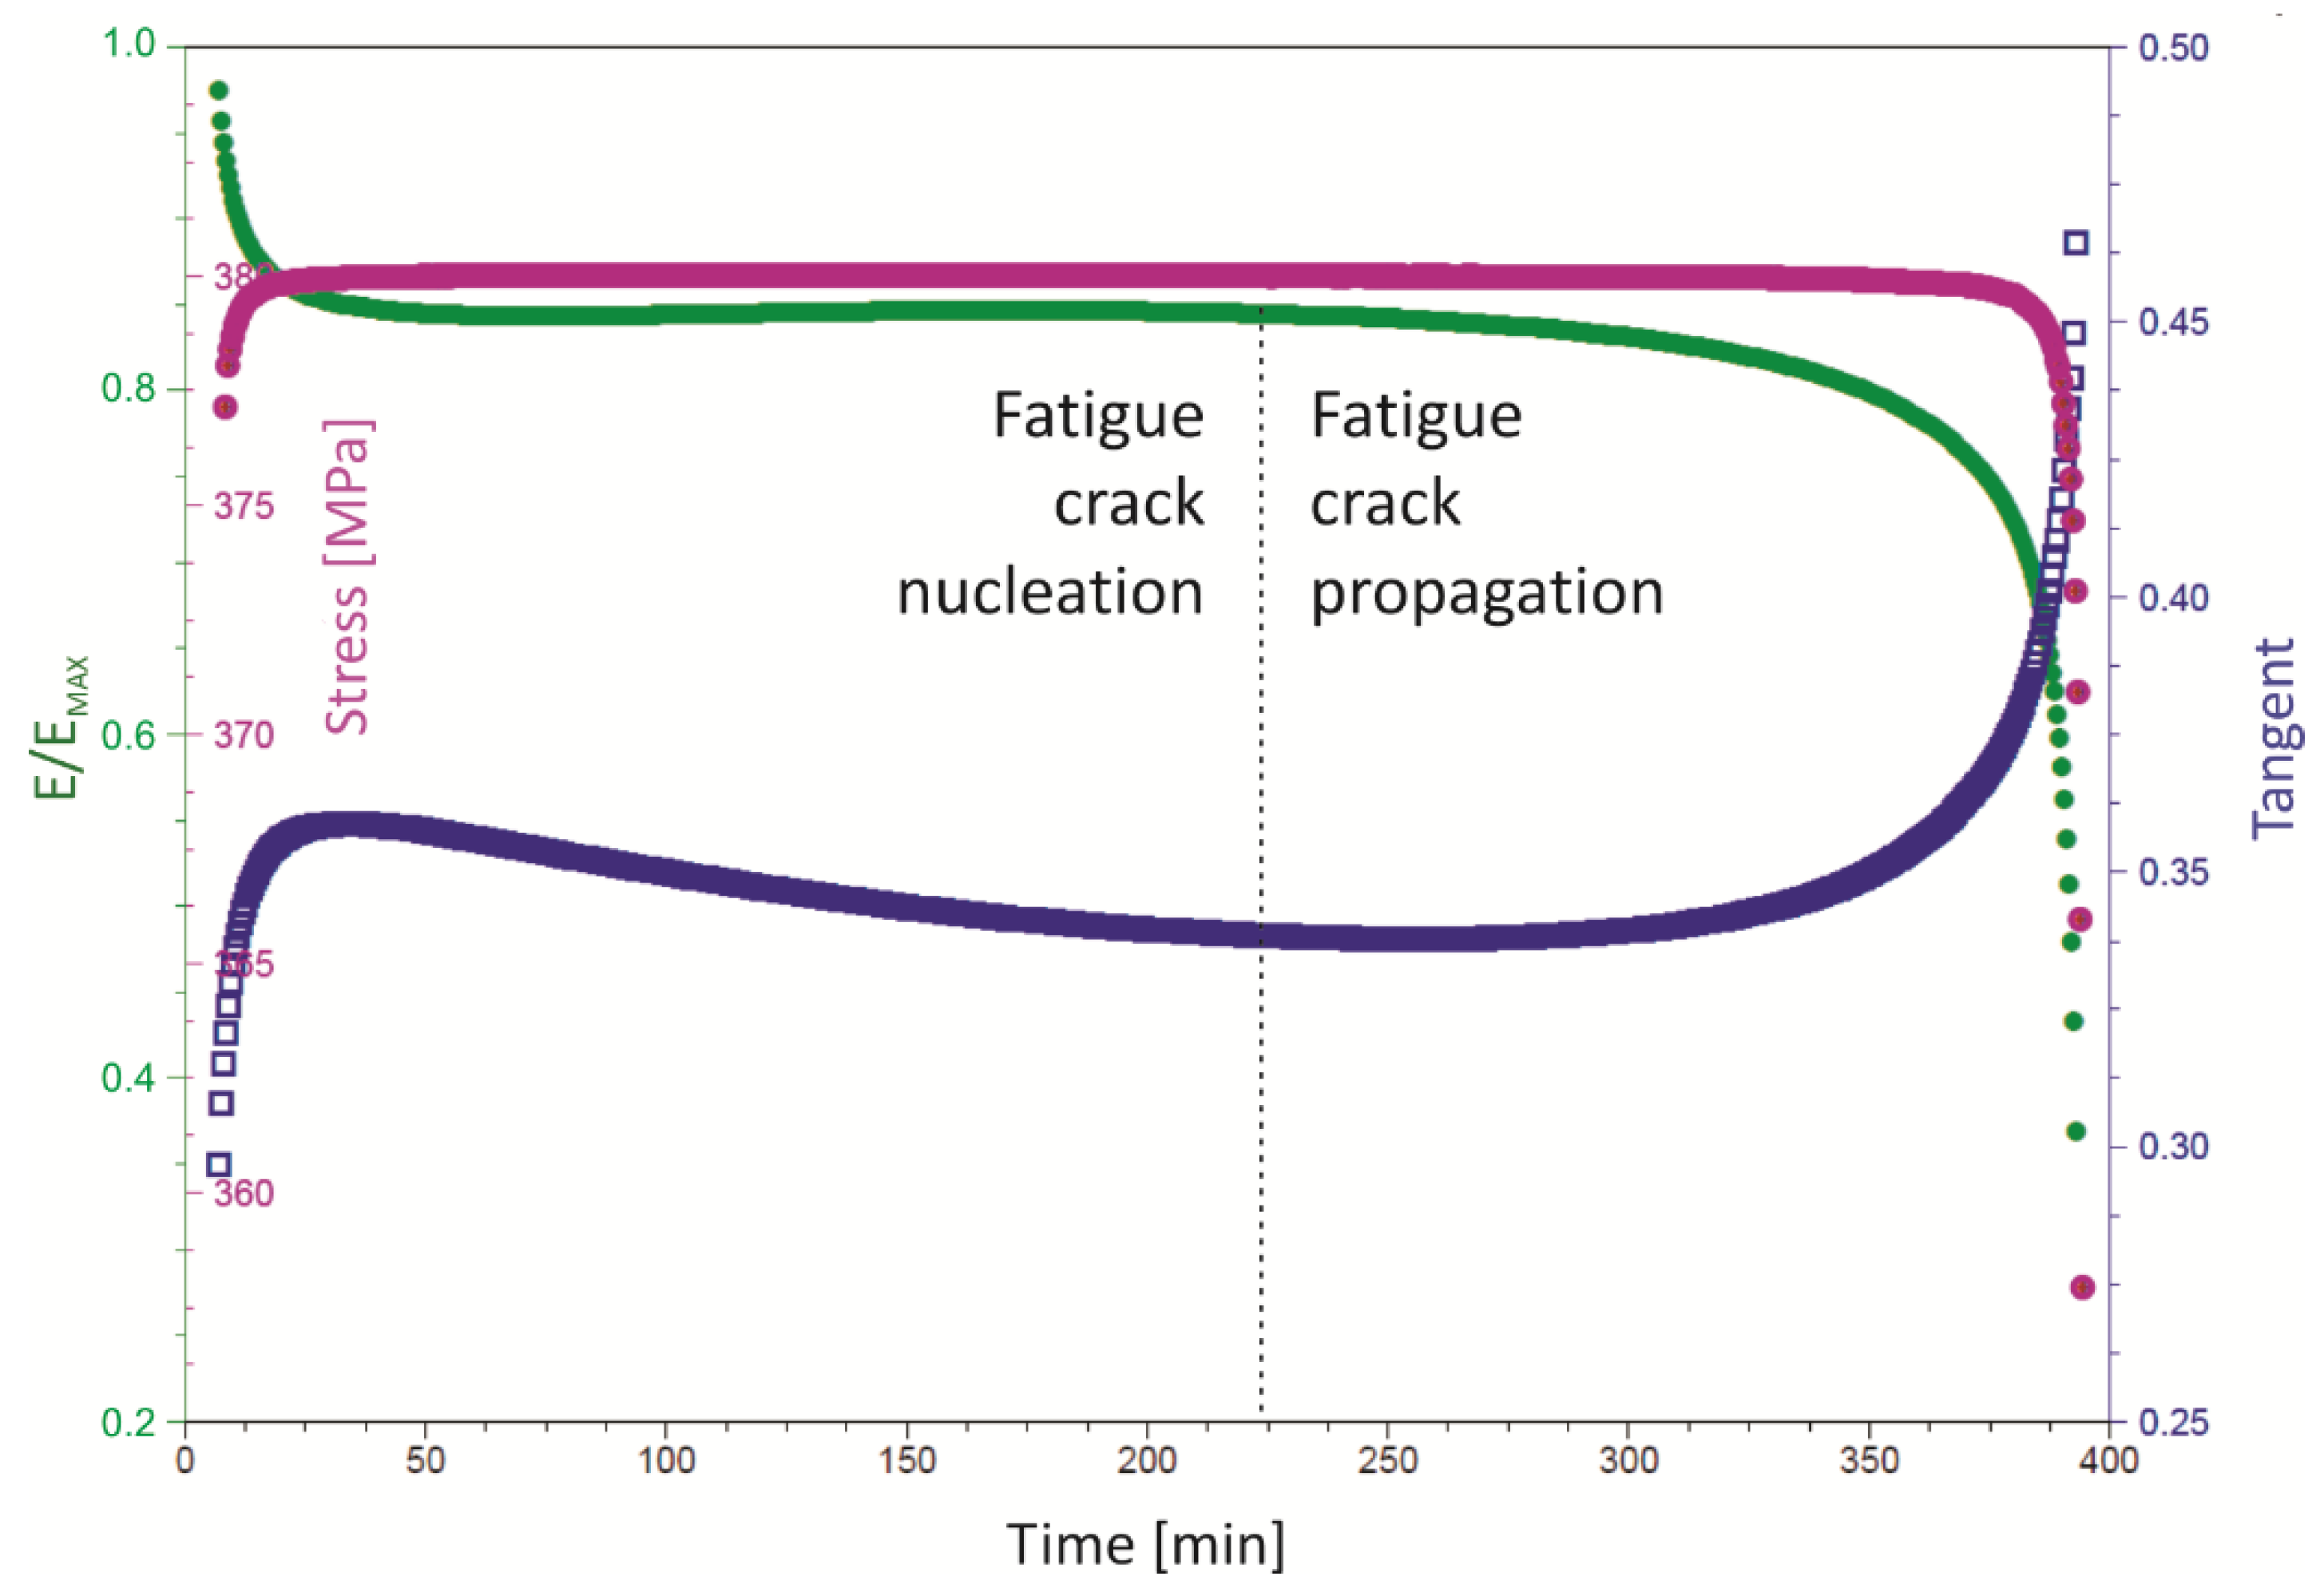
3.2. Fatigue Strength

The initiation of fatigue cracks and further fracture during the DMA tests of all specimens occurred on both surfaces (upper and lower) within 0.5–1.5 mm from the edges of both movable and fixed grippers. According to the results of modeling by the finite element method, these areas correspond to the stress concentration gradient (Figure 4). At low stress amplitude, the fatigue crack initiation was observed near only one of the grippers (movable or fixed).
Fatigue curves in the coordinates “number of cycles (Nf)—stress amplitude (σa)” of AISI 1022 steel specimens both as delivered and after prolonged heat treatments are shown in Figure 5. The mechanical properties of steel specimens are given in Table 2. The fatigue curves of steel specimens after all treatments have a low slope. In a narrow range of variation of the stress amplitude (80–90% of σmax), there is a significant increase in fatigue life (about eight times). This is due to the strain hardening of steel (an increase in the density of dislocations and their blocking occur as a result of strain aging) during fatigue loading, which is typical for low-cycle fatigue of low-carbon steels [13,24]. The fatigue strength at Nf = 3.5 × 10⁴ cycles (σNf) of AISI 1022 steel specimens in the as-delivered state was 360 MPa, which is 1.4 times less than σmax.
Heat treatment of AISI 1022 steel specimens for temper embrittlement (TO-1), as well as heat treatment for the growth of austenite grain (TO-2), led to a decrease in fatigue life. The fatigue strength at Nf = 3.5 × 10⁴ cycles (σNf) of AISI 1022 steel specimens after both heat treatments was σNf = 330 MPa. The σmax/σNf ratio, as well as for AISI 1022 steel in the as-delivered state, was 1.4.
Thus, the decrease in the fatigue strength of AISI 1022 steel after prolonged thermal exposure compared to the as-delivered state is small (the fatigue strength (σNf) decreased by 9%). Based on the high value of the σNf/σmax ratio, as well as the low slope of fatigue curves, the steel after all treatments had a high resistance to low-cycle fatigue.
An example of the DMA cyclic testing process diagram is shown in the Figure 6. During the test, the following parameters were recorded: namely, the elastic modulus, tangent of the mechanical loss angle (loss factor), and stress amplitude. There are several criteria for the onset of the fatigue crack propagation. In this study, the onset of the fatigue crack propagation was determined by the decrease in the elastic modulus observed during the test (Figure 6). Usually, under low-cycle fatigue, the fatigue fracture process is mainly associated with fatigue crack initiation, and the fatigue crack propagation period is short. As the stress amplitude decreases, the fatigue crack propagation period increases. In our case, for AISI 1022 steel specimens in the as-delivered state, the fatigue crack propagation period was 30–40% of the entire test time in almost the entire range of stress amplitudes (70–90% of σmax). It was only at the highest (95% of σmax) stress amplitudes that the fatigue crack propagation period decreased to 20% of the all-test time. For AISI 1022 steel specimens after TO-1 and TO-2, the fatigue crack propagation periods were 35–50% and 25–40%, respectively, of the entire test time over the entire range of stress amplitudes. At stress amplitudes less than 70% of σmax, no change in the elastic modulus during testing of specimens after all treatments was recorded, which indicates the absence (or weak development) of the stage of fatigue crack propagation.

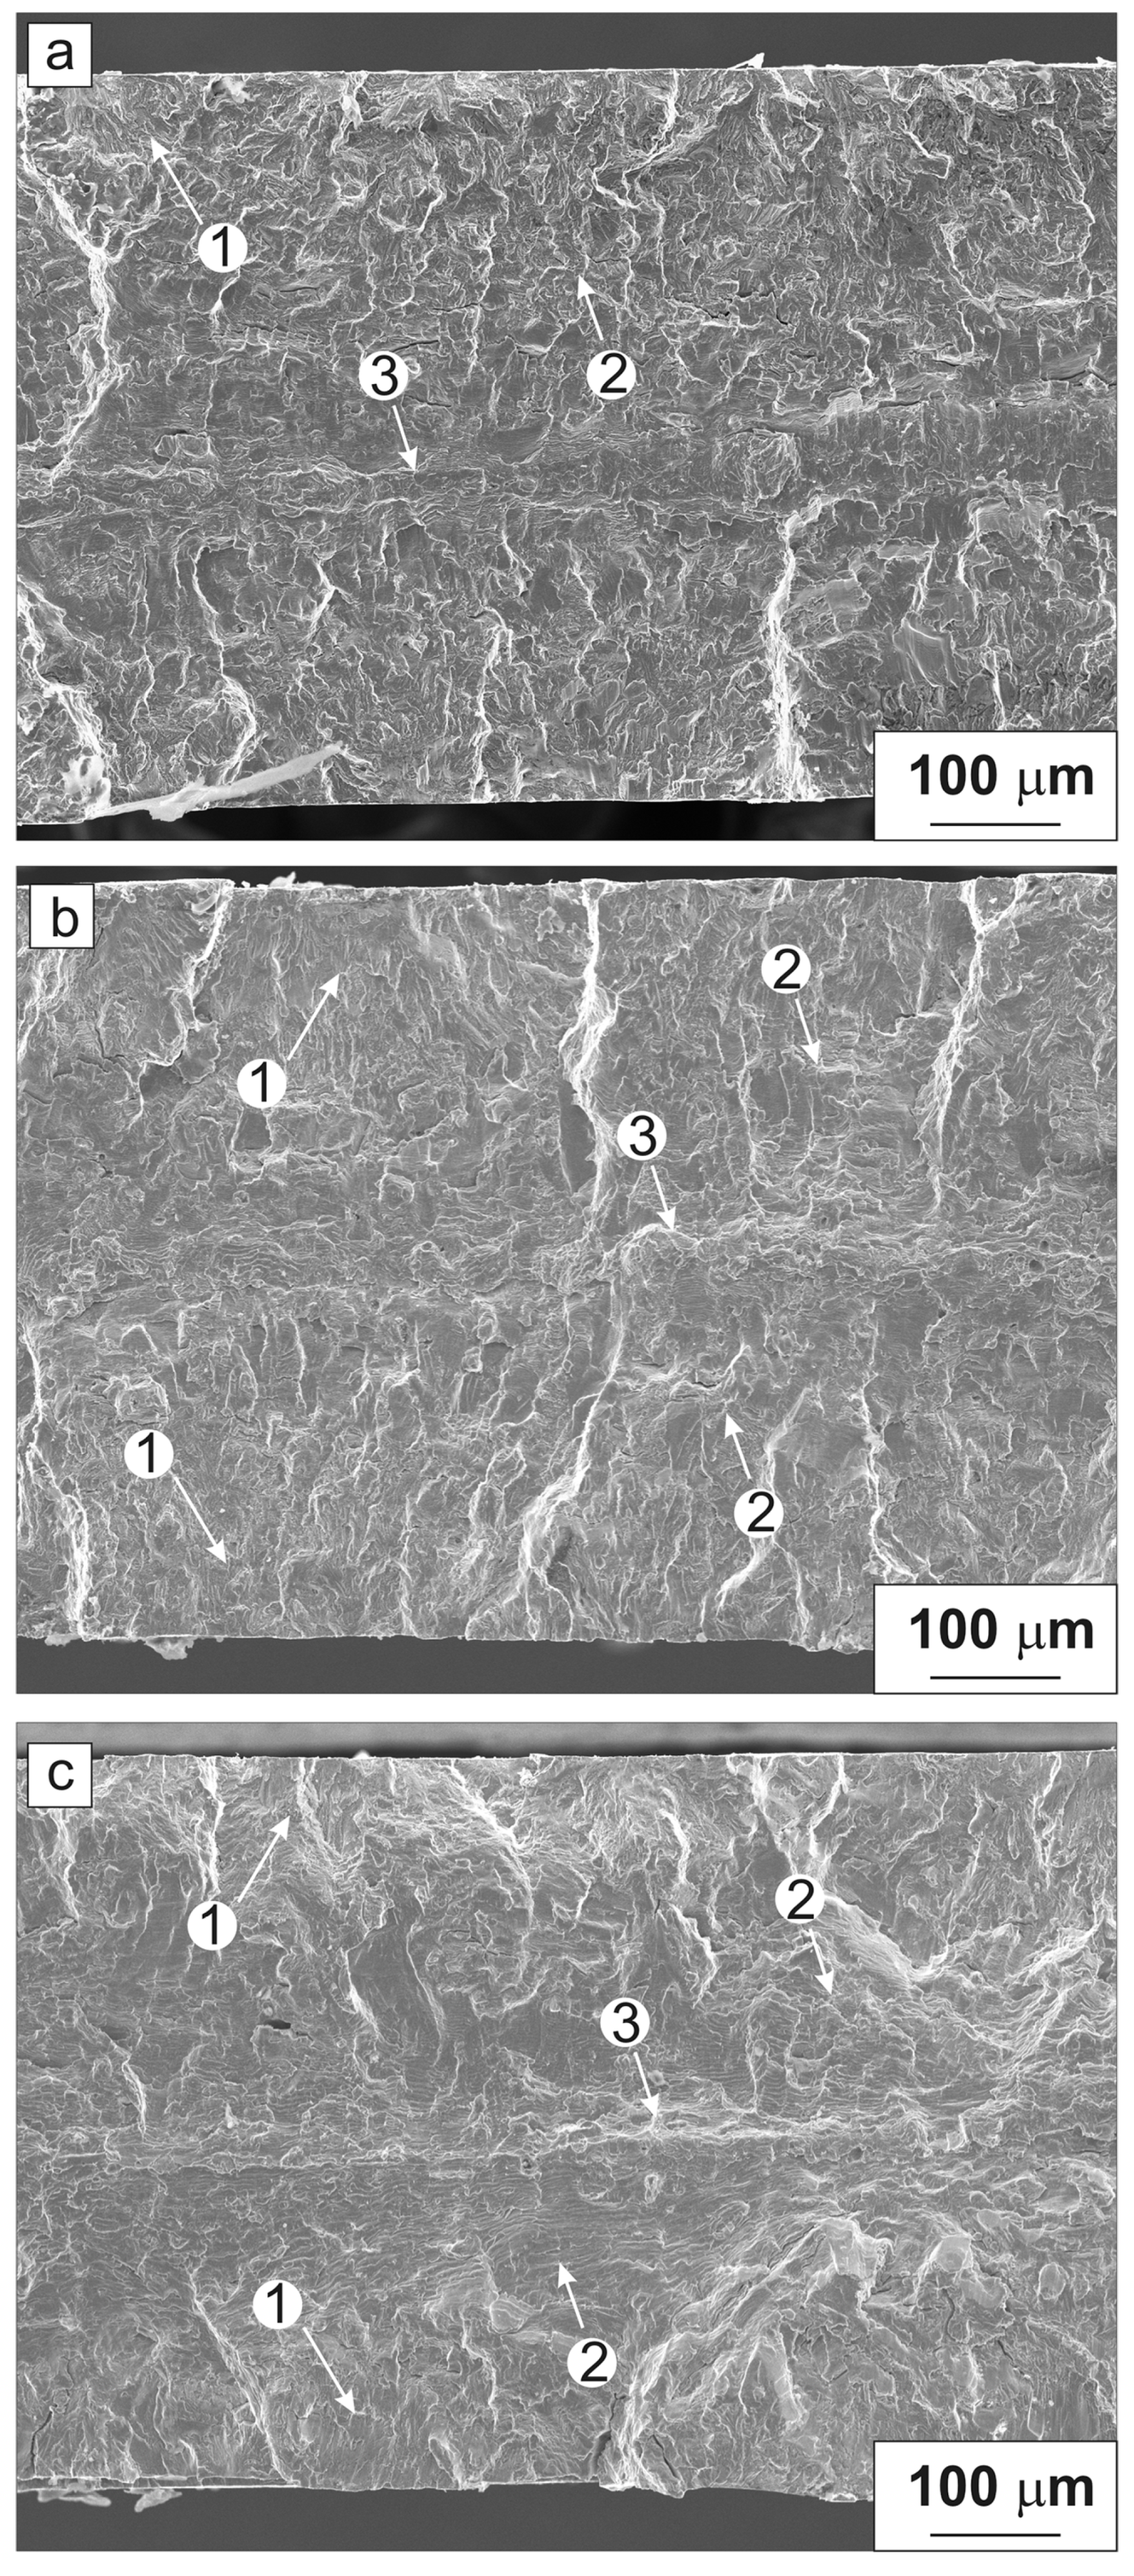
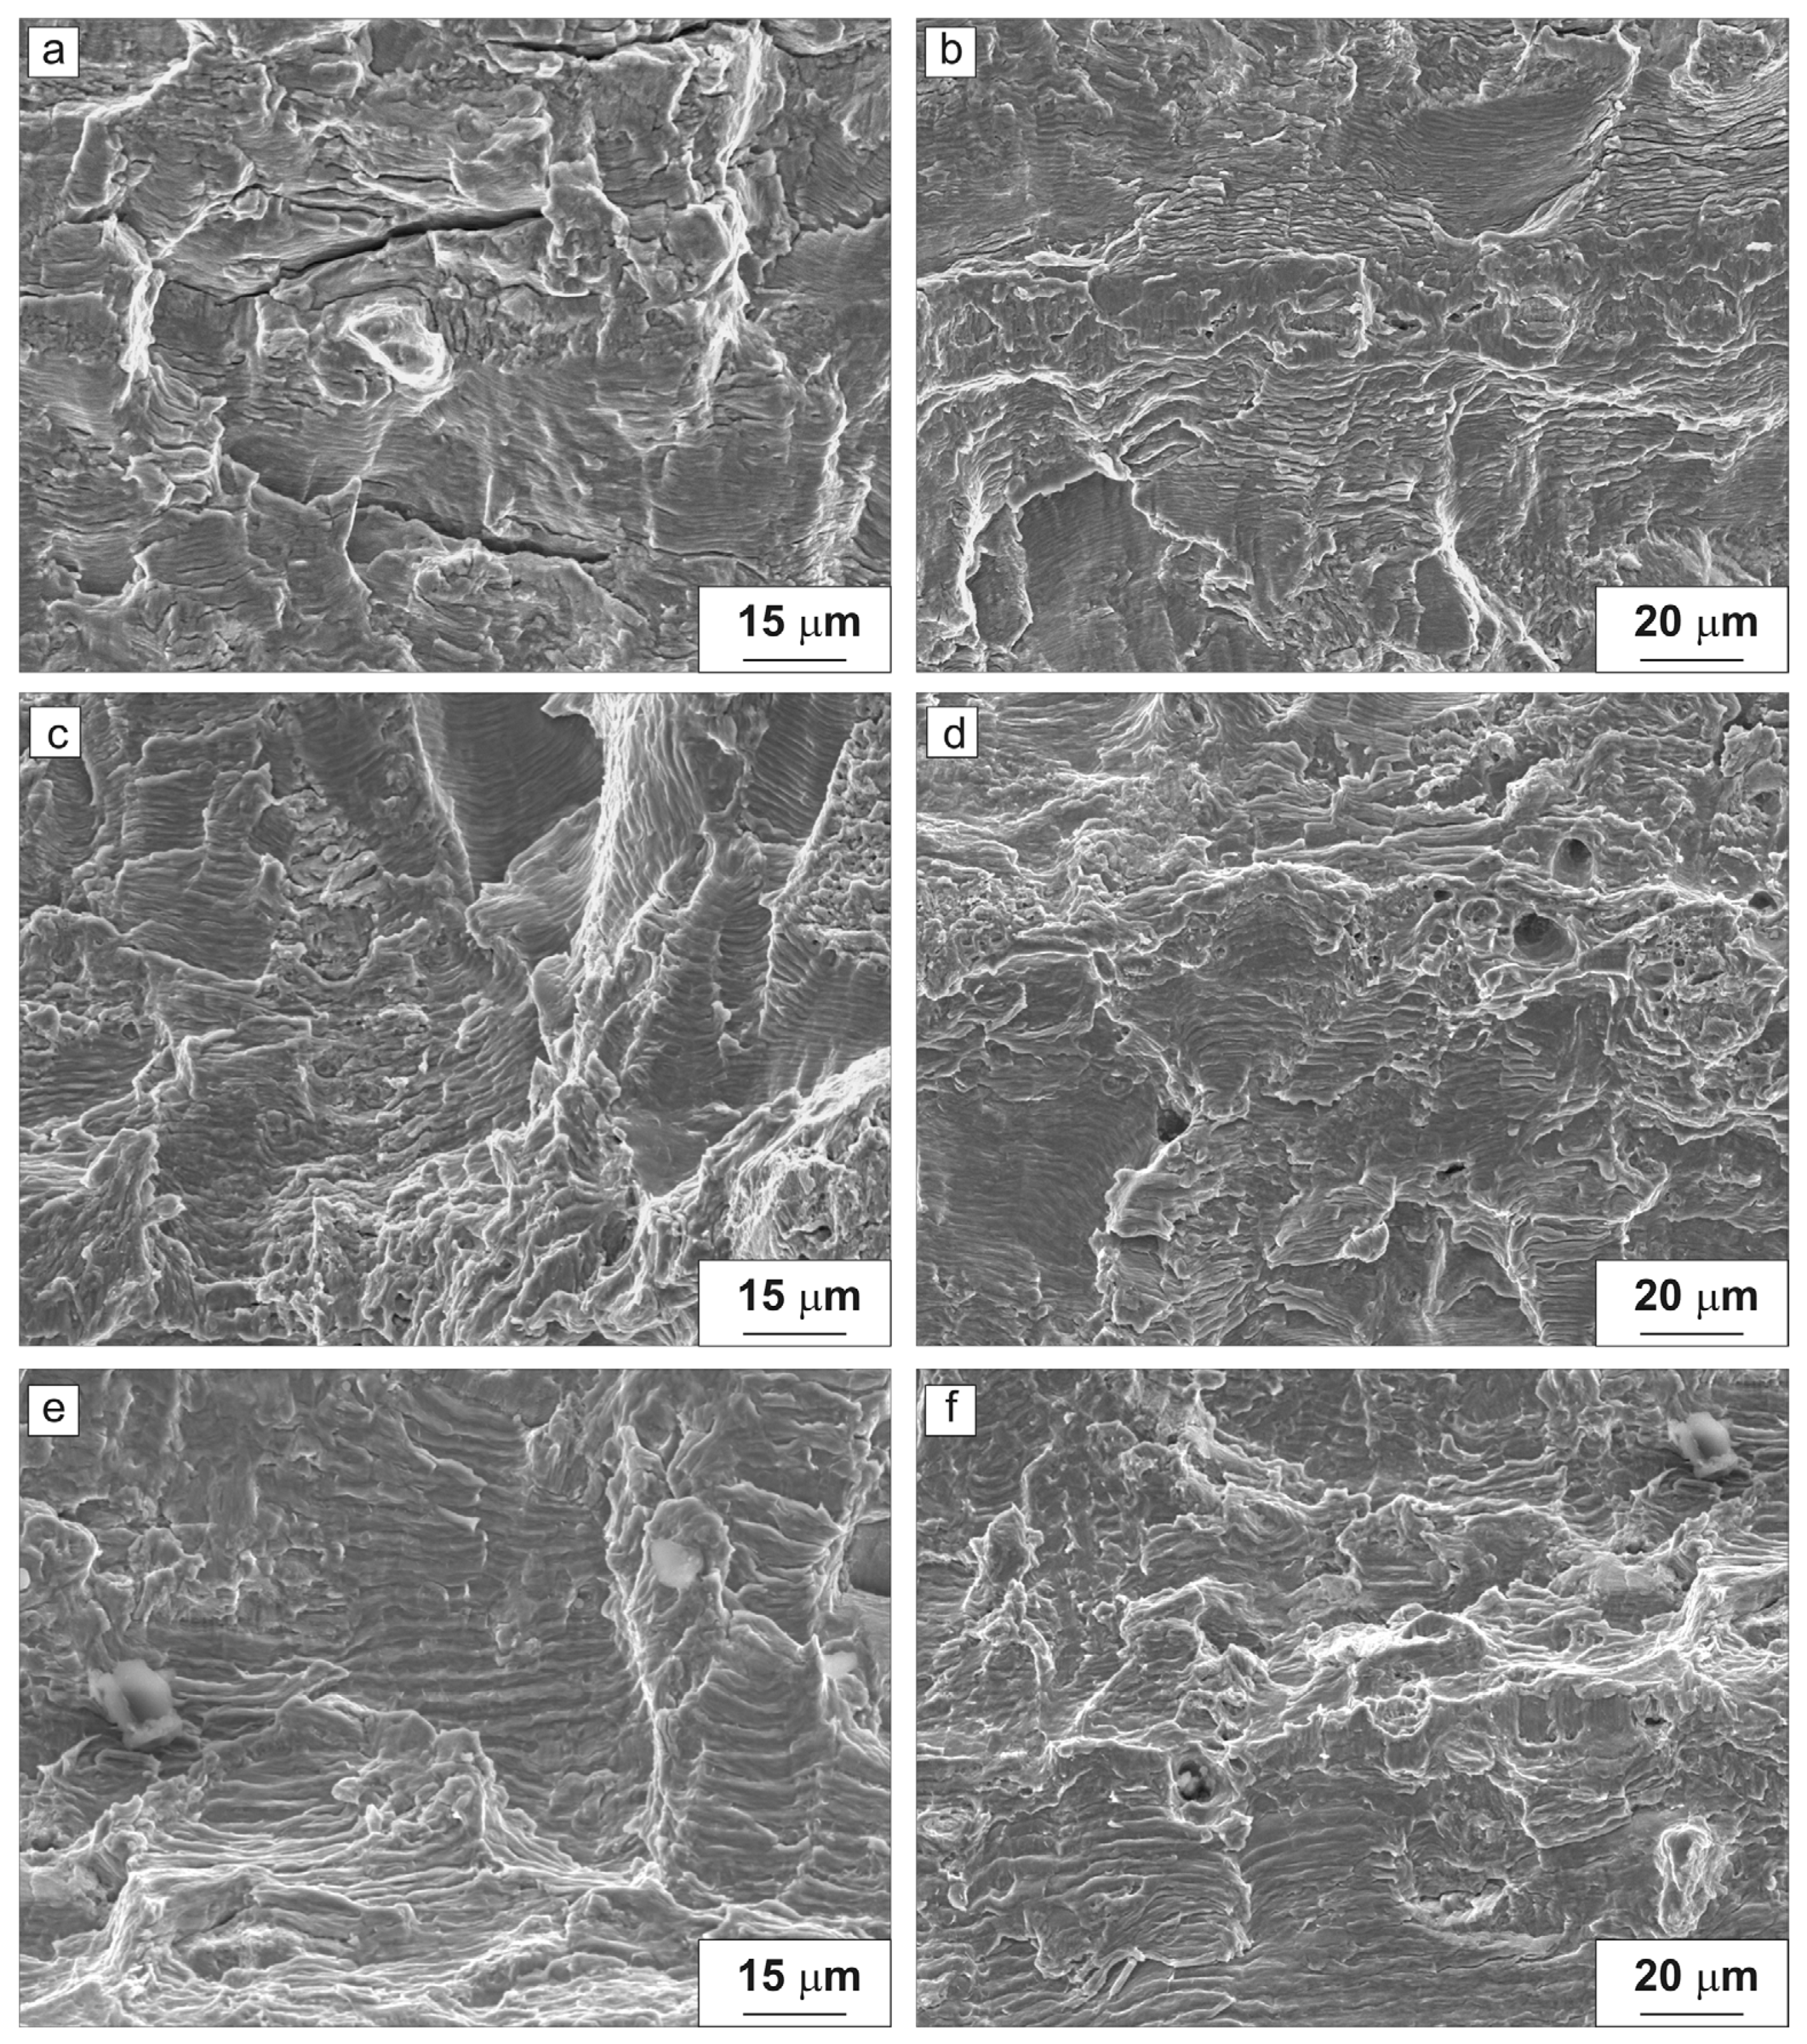
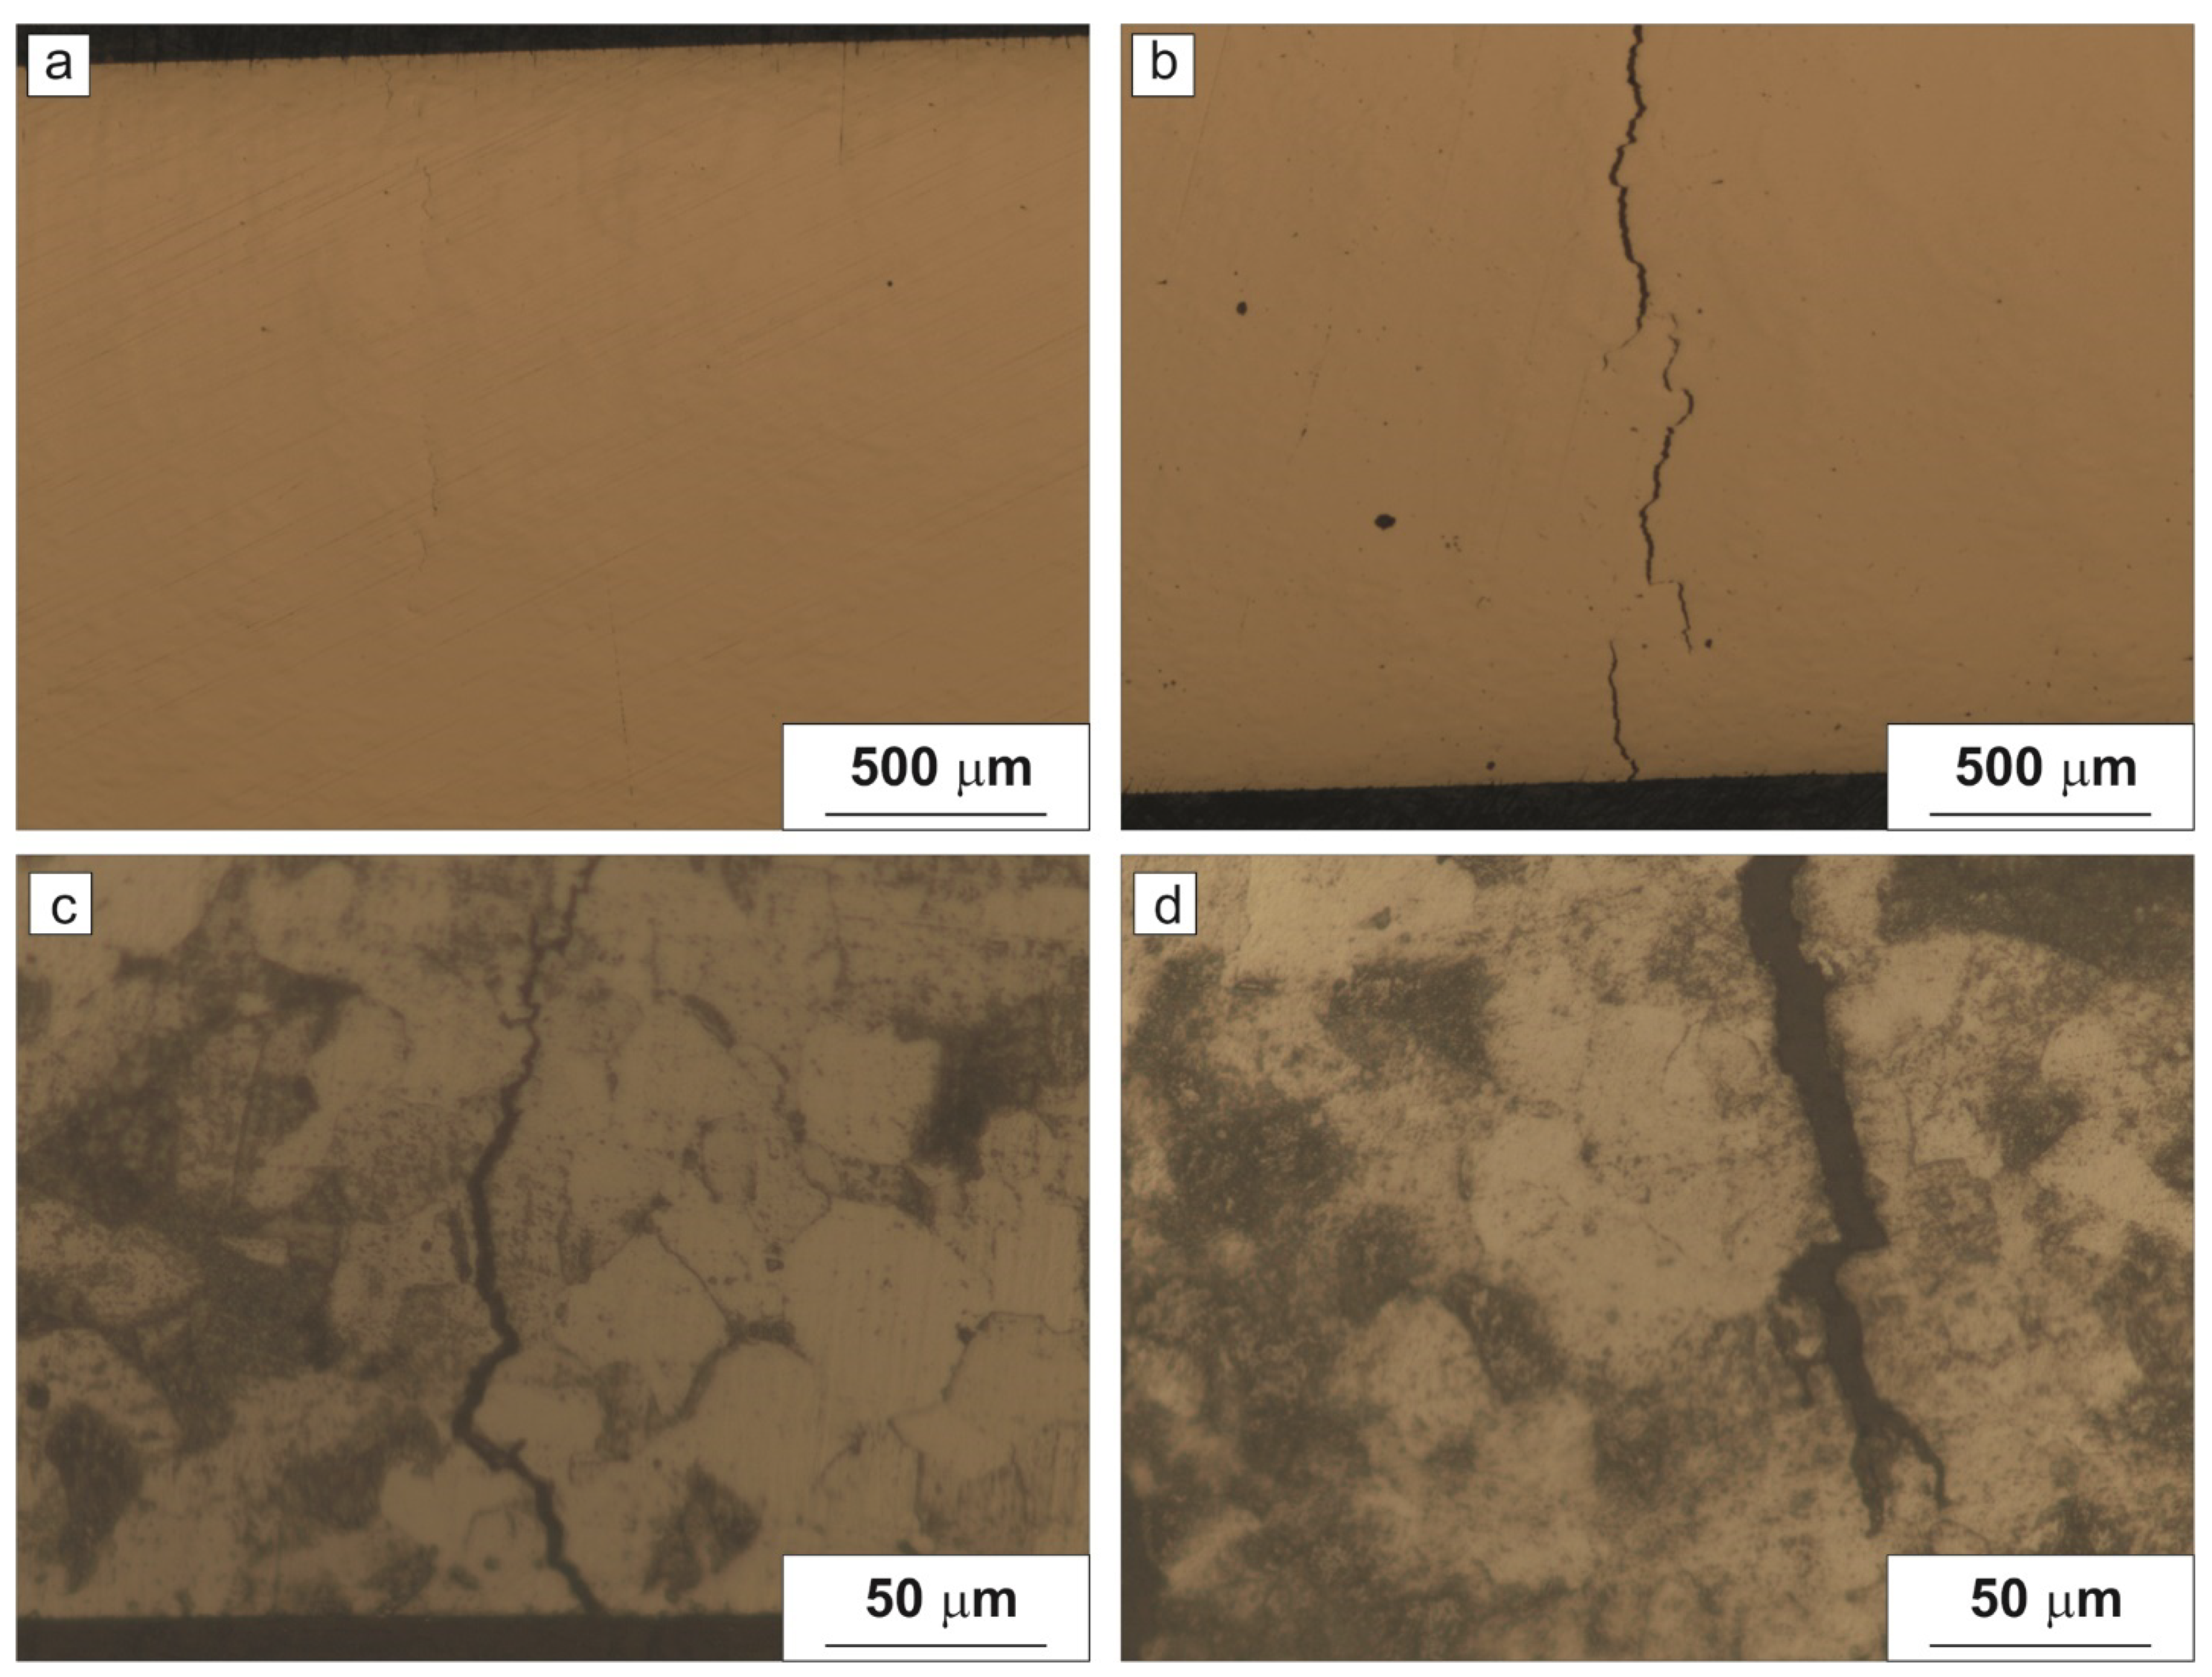
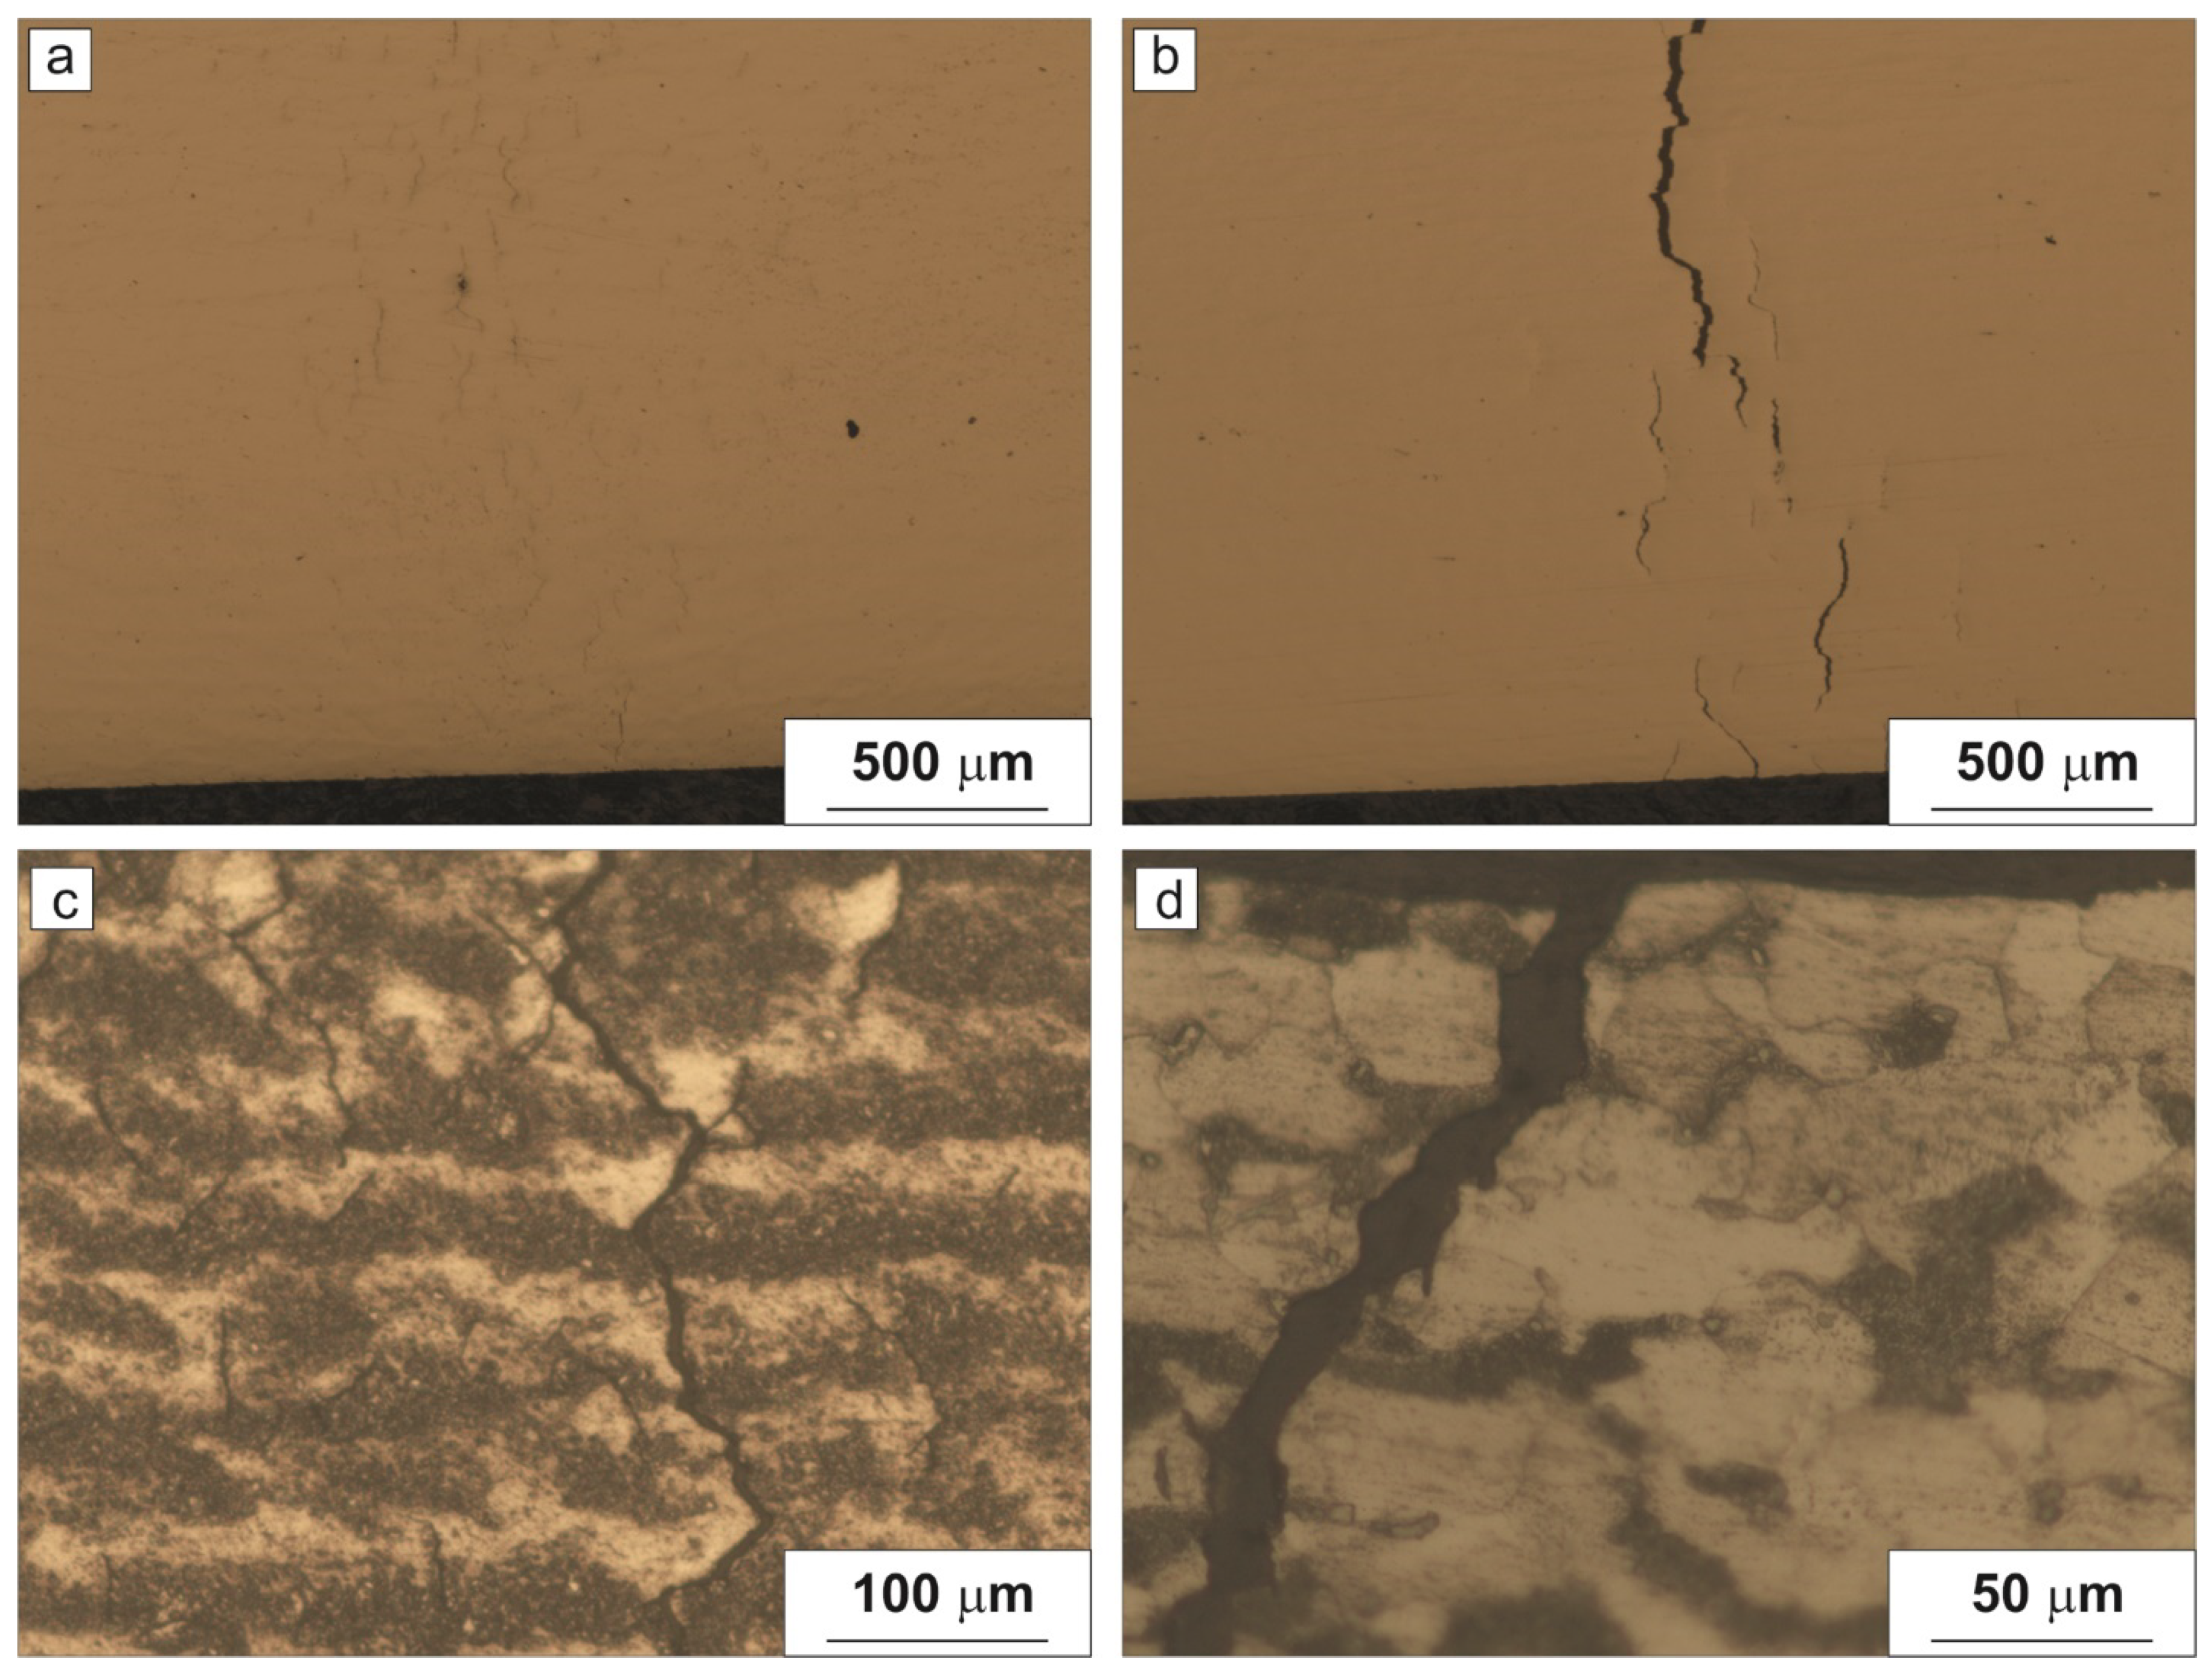
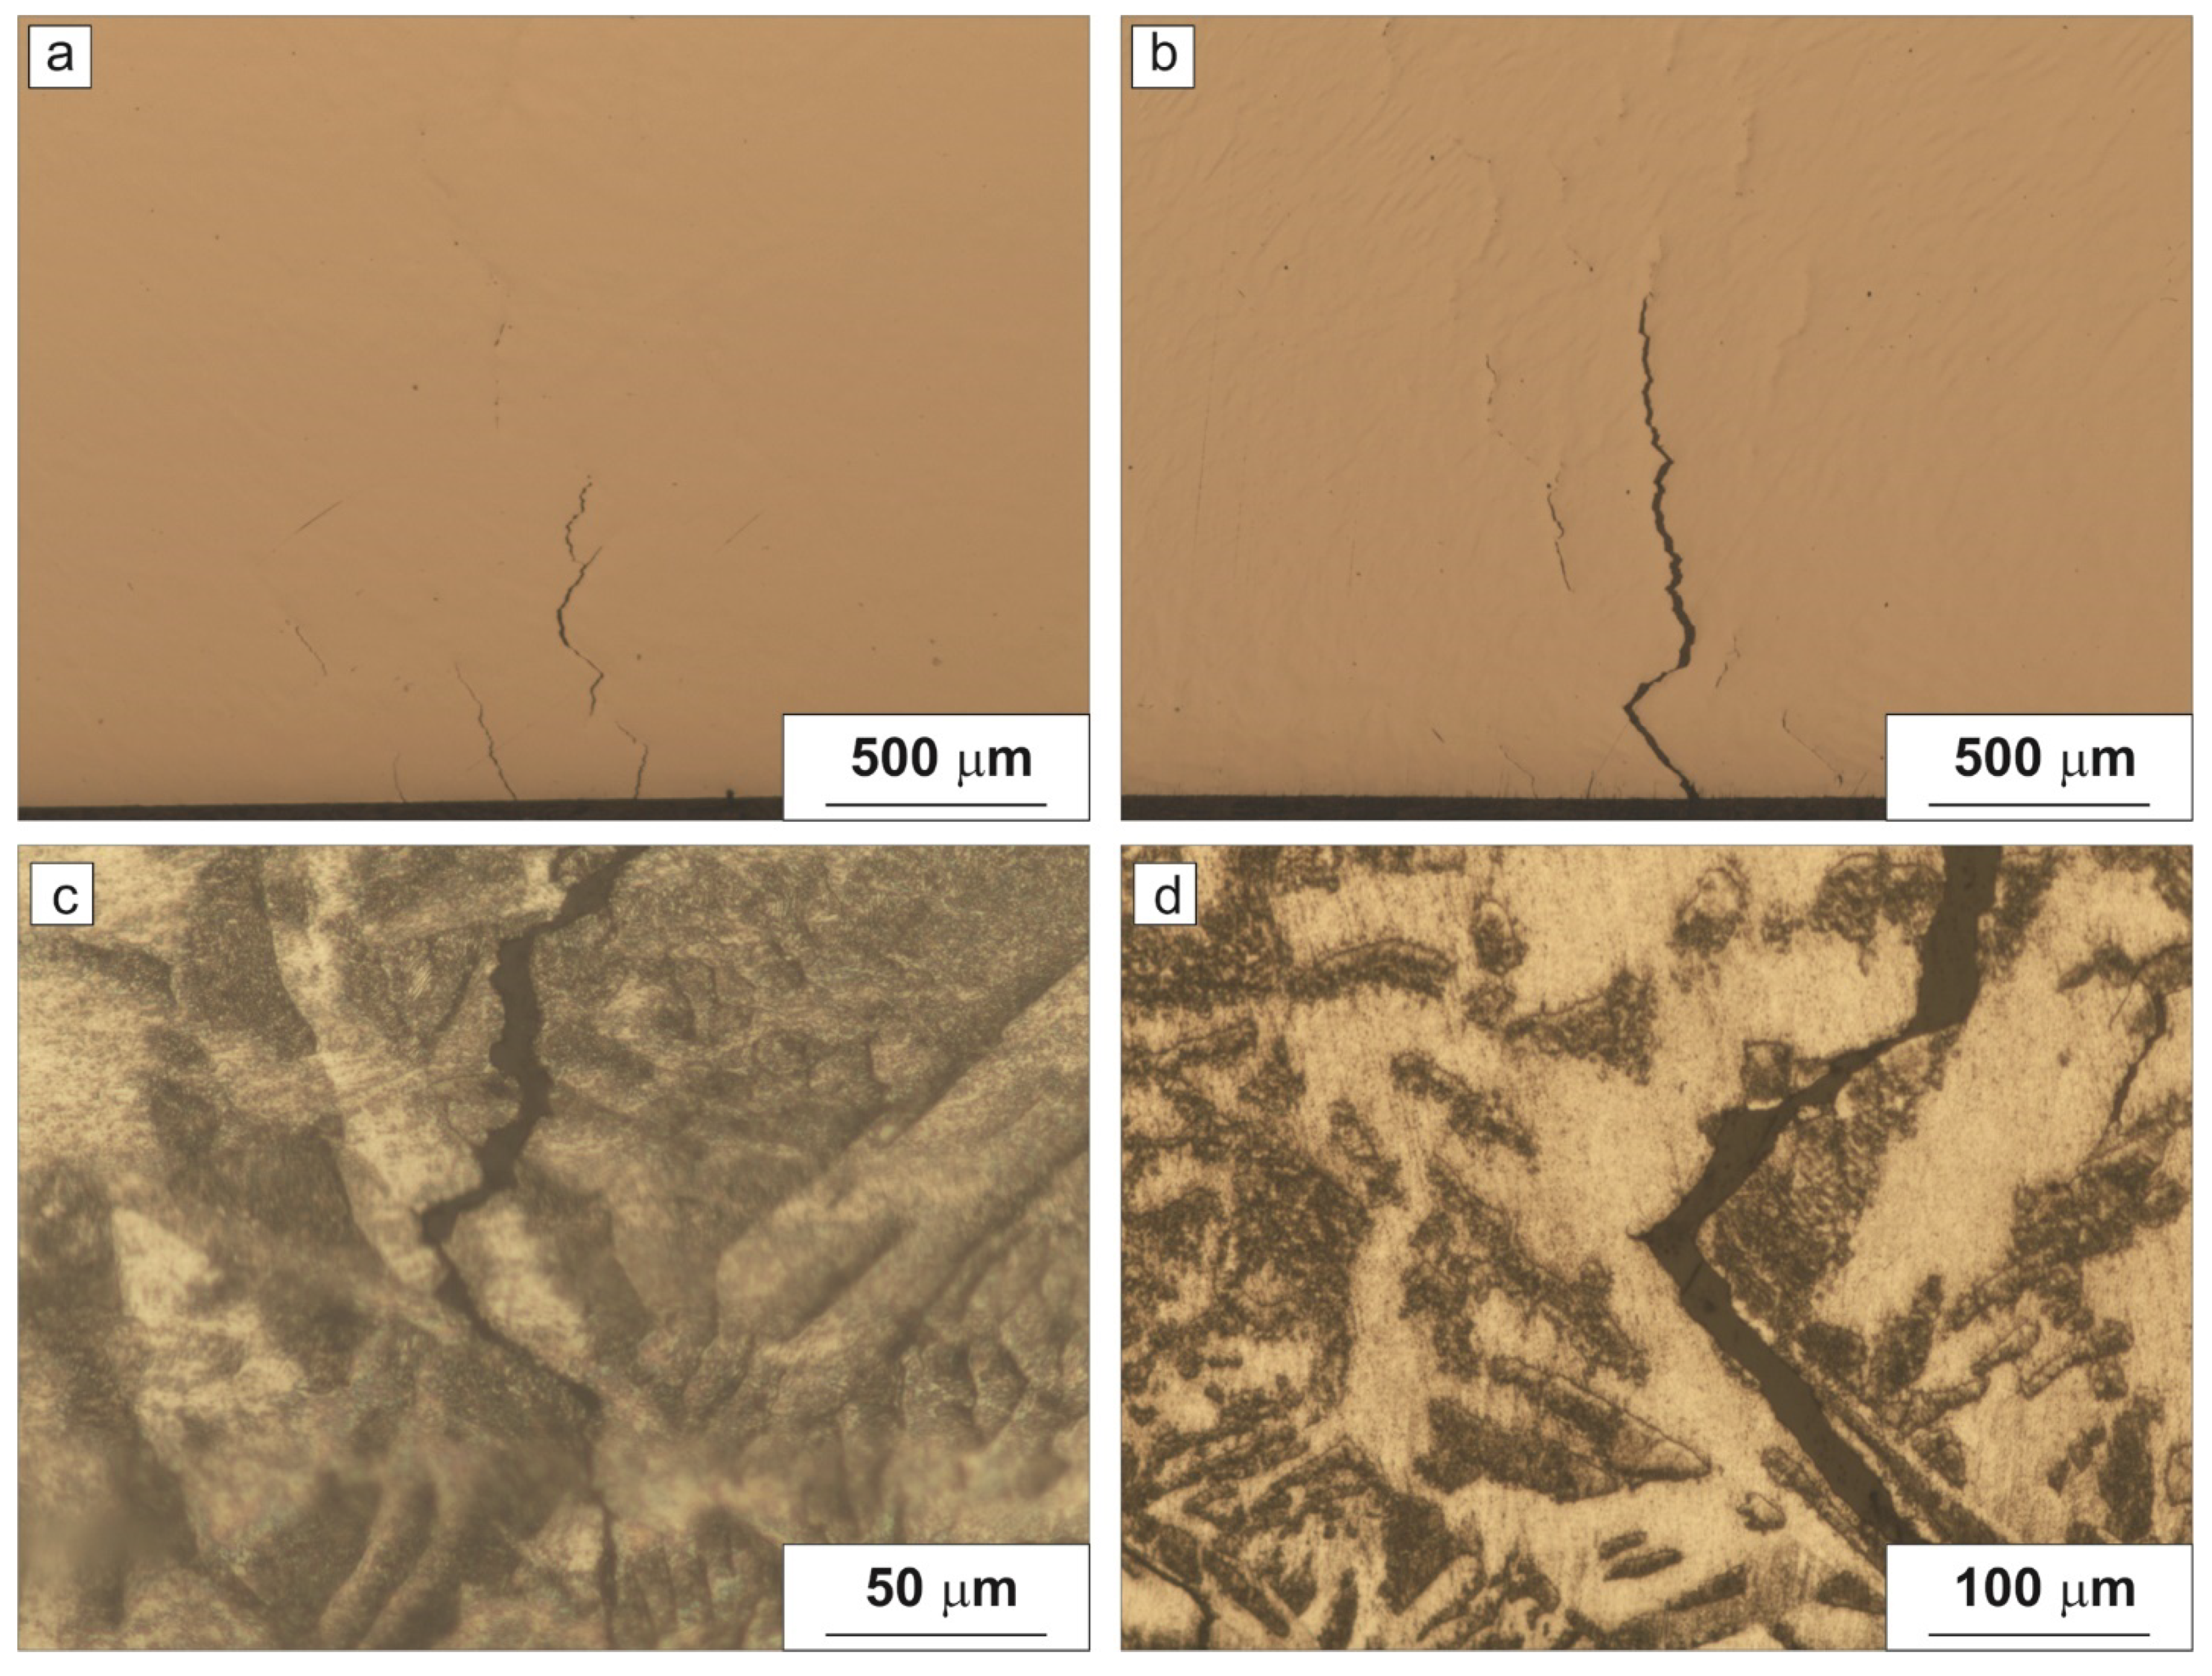
3.3. Fractographic Studies

Figure 7 and Figure 8 show the results of fractographic studies of the fatigue fracture surfaces of AISI 1022 steel specimens after various heat treatments. The fractographic analysis revealed a difference in the micro-mechanisms of fatigue crack propagation depending on the specimen structure, with a similar macrostructure of fatigue fracture surface. In all cases, the nucleation of fatigue cracks occurred on both surfaces of the specimens (upper and lower), and then the cracks spread like a fan to the center of the specimen, where the static rupture took place (Figure 7).
For as-delivered steel specimens, the fracture surface in the fatigue crack propagation zone is rather flat and quasi-ductile; however, fatigue grooves are formed along the crack propagation path. The distance between the grooves was 0.5–0.9 µm. The grooves are generally brittle with cracking between them (Figure 8a). Fatigue crack propagation is accompanied by intense secondary cracking, which is a consequence of steel hardening during cyclic loading. The zone of accelerated (unstable) crack growth is replaced by a grooved relief with an increased distance between grooves of up to 1.5 μm. The static rupture is localized in the middle part of the specimen and is represented by a narrow zone of quasi-ductile fracture with a small (less than 10%) fraction of the ductile dimple component (Figure 8b). The formation of such a quasi-ductile relief of a fatigue fracture surface is associated with the hardening of steel during cyclic loading.
For steel after heat treatment (TO-1), at the stage of fatigue crack propagation, a developed ductile surface fracture relief with typical parallel fatigue micro-grooves with a distance of about 0.9 μm between them is observed (Figure 8c).
For steel after heat treatment (TO-2) at the stage of fatigue crack propagation, as well as for steel after TO-1, there is a developed ductile surface fracture relief with the presence of typical fatigue micro-grooves with a distance between grooves of 1–2 µm. The stage of accelerated (unstable) crack growth can be distinguished. There, a developed surface relief can be observed with an increased distance between fatigue grooves up to 3.5 μm (Figure 8e). The static rupture of steel specimens after both heat treatments is associated with typical ductile dimple fracture (Figure 8d,f).

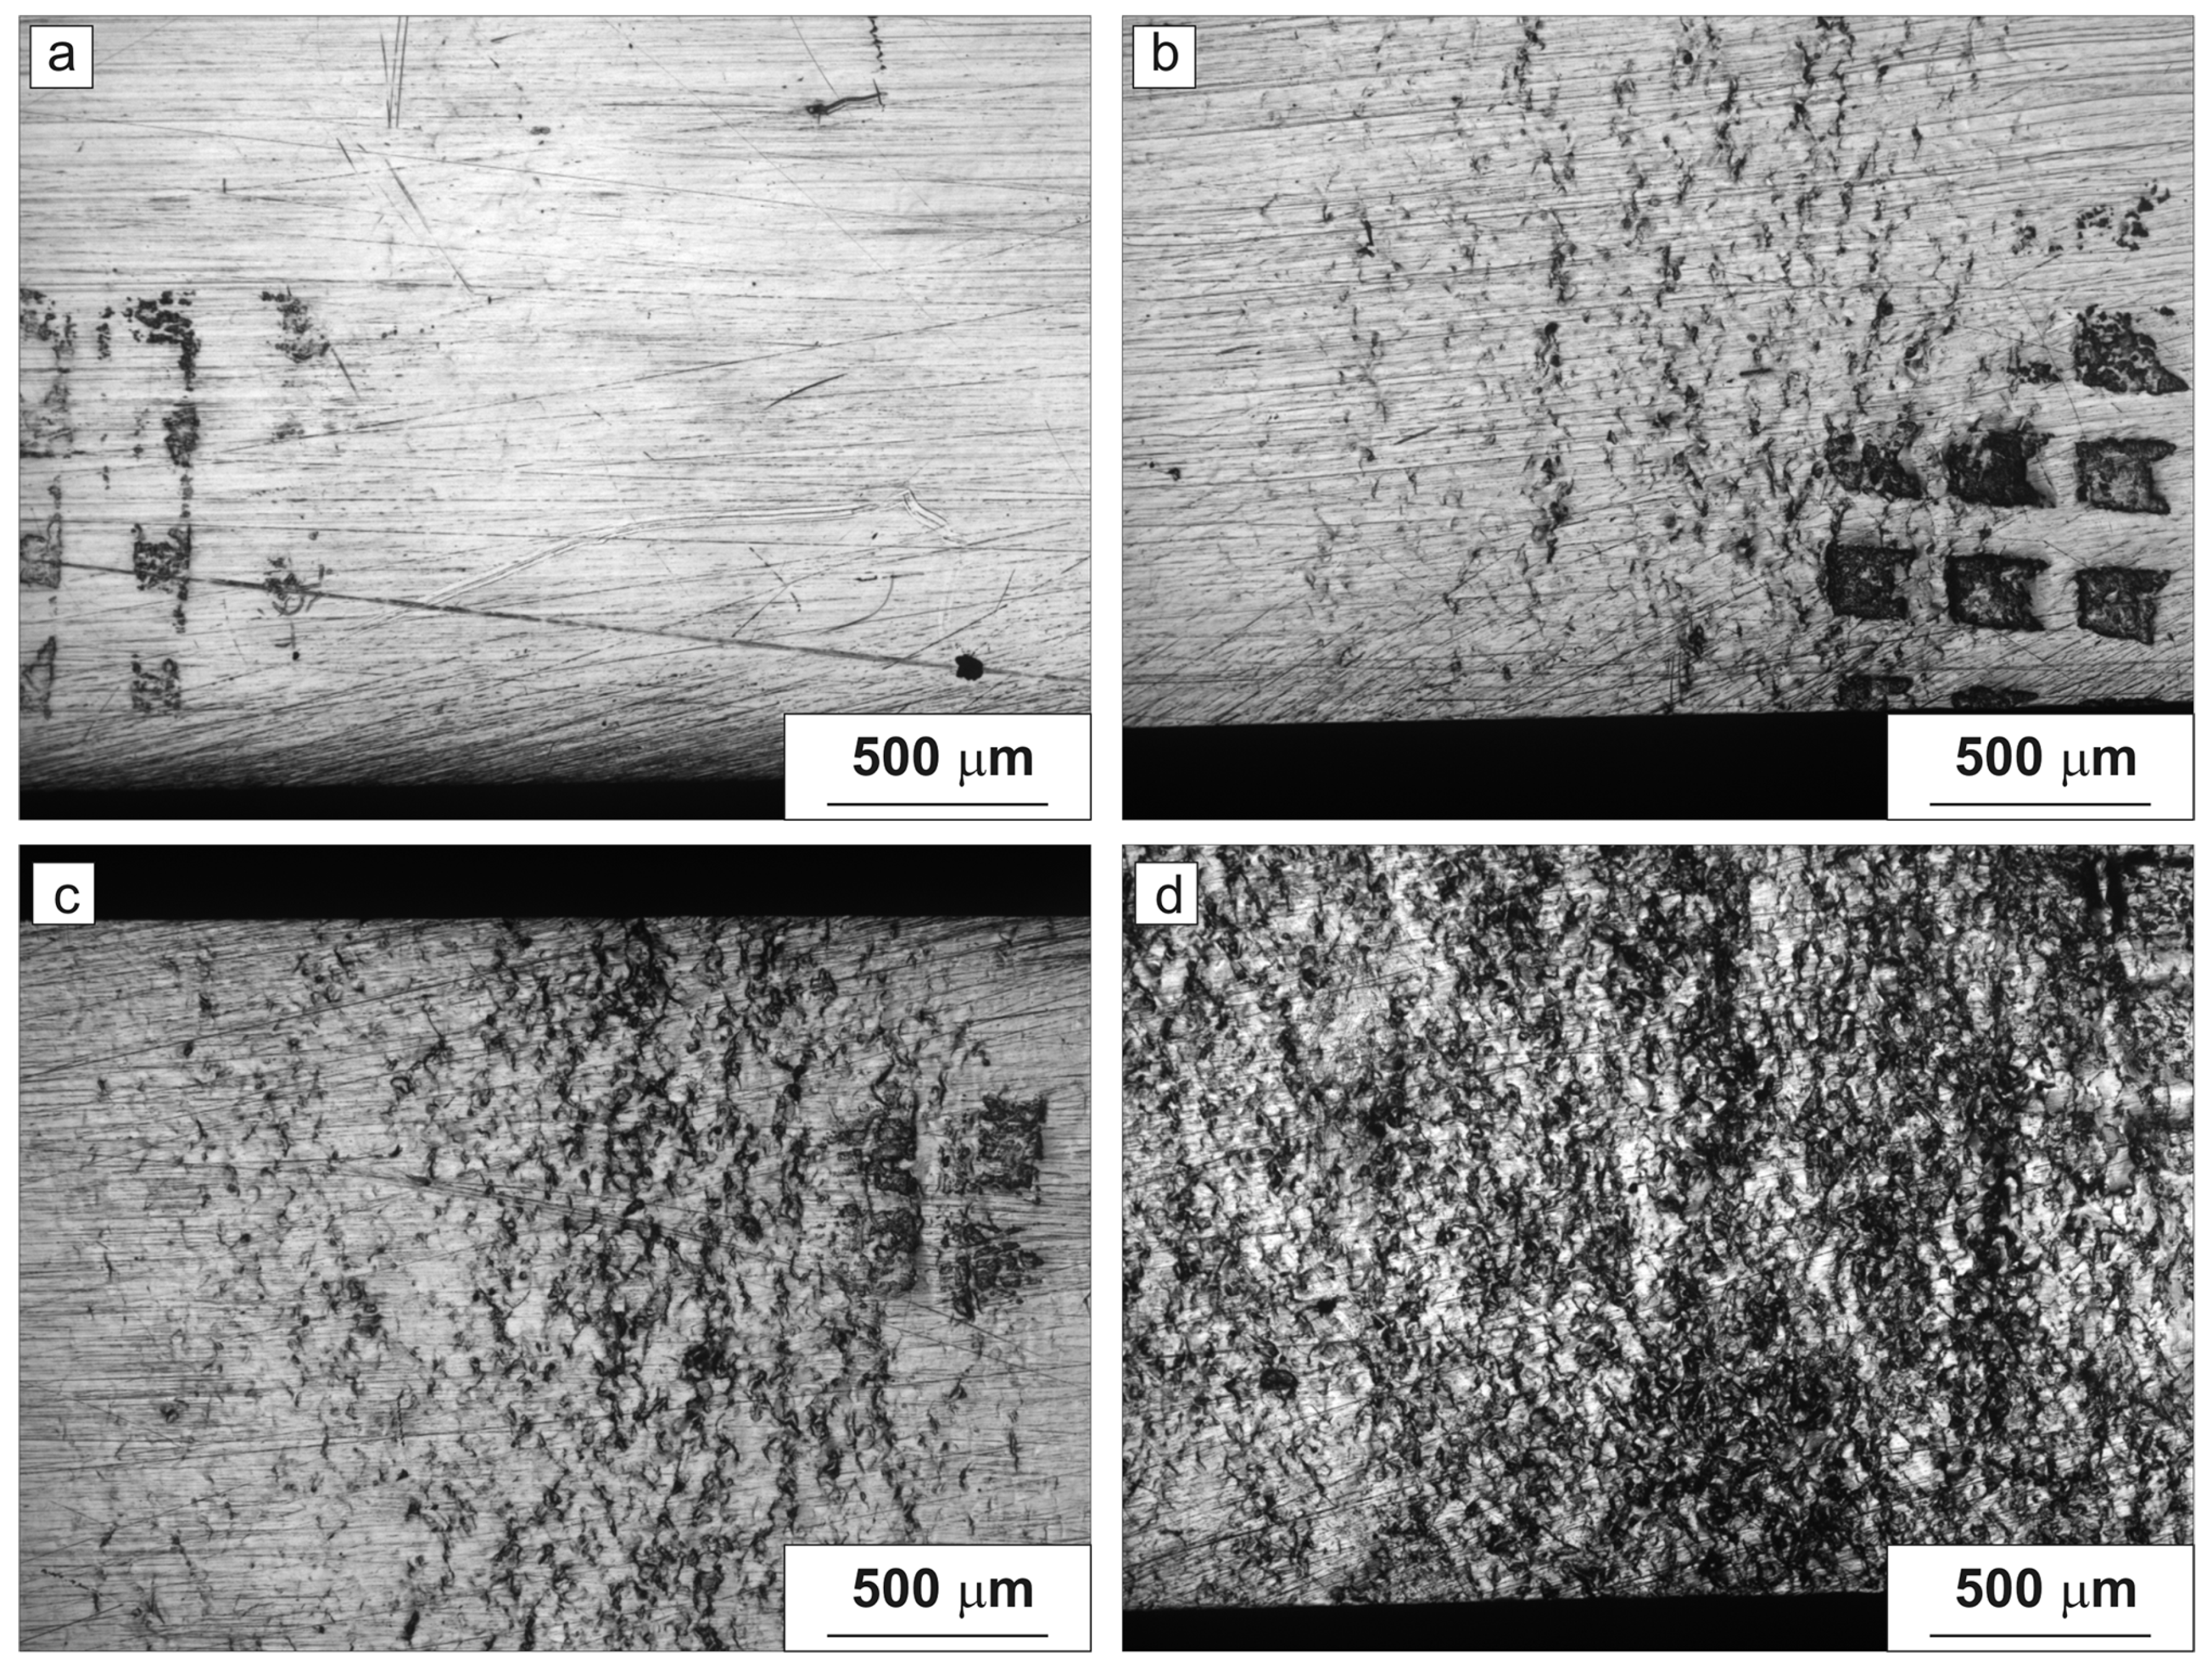
3.4. Specimen Structure after Cyclic Testing

During cyclic tests, a typical deformation relief “orange peel” was formed on the surface of the specimens within 0.5–1.5 mm from the edge of the grippers, coinciding with the contours of the grain structure and arising from the difference in the prevailing systems of slip of dislocations in the grain and at the grain boundaries during micro-plastic deformation (Figure 9, Figure 10 and Figure 11). An analysis of the specimen surfaces with an optical microscope showed that fatigue fracture begins from the formation of a network of parallel micro-cracks oriented along the fracture surface (Figure 7b). It can be seen that the places of initiation of fatigue cracks are grain boundaries, as well as for low-carbon (0.1% C) ferrite-pearlite steel studied in [17]. In the same work [17], it was shown that the grain boundaries, on the other hand, were an effective barrier to the growth of nucleated cracks.
With an increase in the stress amplitude of the loading cycle, the number of micro-cracks increases; with an increase in the number of loading cycles, some of micro-cracks grow and merge with the formation of long cracks (Figure 9c). Crack propagation occurs with large plastic deformation at the crack tip. The numerous zones of plastic deformation during the growth and merging of micro-cracks form a deformation relief. The final rupture of the specimen occurs from one of the longest main cracks (Figure 9d).
The starting stress of the crack initiation in steel specimens after various heat treatments is different. So, for AISI 1022 steel in the as-delivered state, no micro-cracks were observed on the surface of the specimens up to a stress amplitude of 300–320 MPa (Figure 9a). Micro-cracks formed on the surface of the specimens tested at a stress amplitude of 340 MPa, but their further growth was not observed (Figure 9b). The merging of cracks and the formation of a main crack were observed at stress above 360 MPa (Figure 9c,d).
For AISI 1022 steel after TO-1, the formation of micro-cracks on the surface of the specimens was observed even at a stress amplitude of 300 MPa (Figure 10a). With an increase in the stress amplitude of the loading cycle and an increase in the number of loading cycles, the growth and merge of cracks and the final rupture of the specimen occur, as well as for the steel in the as-delivered state (Figure 10b). The same stress of the onset of the micro-crack formation was observed for AISI 1022 steel after TO-2.
The deformation relief on the surface of AISI 1022 steel specimens after TO-2 is more developed; parallel slip bands were observed within one grain. The distance between adjacent cracks is greater than in the steel in the as-delivered state, as well as after TO-1.
Figure 12, Figure 13 and Figure 14 show the structure of steel specimens after fatigue tests before and after etching. The structure corresponds approximately to the middle part (in thickness) of a flat specimen. One can see a decrease in the number of cracks in the middle of the specimen in comparison with the number of cracks on its surface (Figure 12a, Figure 13a and Figure 14a). With an increase in the stress amplitude of the loading cycle, the number of cracks decreases, while their length and opening increase (Figure 12a, Figure 13a and Figure 14a). This correlates well with the above process of merging surface cracks and their propagation towards the middle of the specimen.
An analysis of the etched sections in the area of fatigue failure confirmed that the propagation of fatigue cracks in steel specimens both as delivered and after TO-1 occurs along grain boundaries (Figure 12c,d and Figure 13c,d). At the same time, some cracks propagated along the grain body with secondary cracking at the crack tip. Fatigue crack propagation of a similar nature in low-carbon steel was observed in [17]. On the contrary, for steel specimens after TO-2, the crack propagated mainly along the grain body and partially along the interphase boundaries (Figure 14c,d).
For specimens both as delivered and after TO-1, changes in the microstructure in the area of fatigue failure were not revealed (this result refers to the middle part (in thickness) of a flat specimen). For specimens after TO-2, in the area of fatigue crack propagation, the formation of parallel slip bands was observed. Thus, the main changes in the structure of steel during cyclic tests occur in the surface layers of the specimen, which is typical for carbon steels [25].
It was shown earlier [11] that TO-1 of AISI 1022 steel specimens leads to their embrittlement during impact bending tests and an increase in the temperature of the onset of a ductile–brittle transition from room temperature to 50 °C. On the contrary, during cyclic bending tests of AISI 1022 steel specimens after TO-1, a more plastic fracture mechanism was observed. Note that the failure of specimens during cyclic bending tests occurred at stresses comparable to (or below) the yield strength. This means that the fatigue crack propagation process was mainly associated with micro-deformation within the grains, in contrast to impact tests, where the stress level was higher. This circumstance, apparently, contributed to a more developed plastic deformation in AISI 1022 steel specimens during cyclic tests. A decrease in the fatigue strength of specimens after TO-1 and TO-2 is associated with a decrease in their static strength and a decrease in the tendency to strain hardening under cyclic loading.
An increase in the grain size in steel after TO-2, apparently, facilitates the deformation process, since the fraction of grain-boundary barriers to the dislocation movement decreases. This leads to a change in the intensity of an increase in deformation at the tip of a propagating fatigue crack and causes a significant increase in the distance between grooves at the stage of the instable crack growth, observed in fracture surfaces of the specimens [25].

4. Conclusions

According to the results of comparative tests using a dynamic mechanical analyzer for low-cycle bending fatigue of AISI 1022 low-carbon steel specimens in the as-delivered state (after normalization) and after extreme thermal exposure in two modes—(1) slow cooling from 650 °C for 7 days and (2) holding at 1200 °C for 3.7 h with slow cooling—the following conclusions were made:
(a)
Slow cooling from a temperature of 650 °C for 7 days does not lead to visible changes in the initial ferrite-pearlite banded structure of steel; the holding at 1200 °C for 3.7 h with slow cooling leads to an increase in the predominant grain size from 15–35 to 300–600 μm and the formation of a needle-like structure of overheating (Widmanstatten structure).
(b)
In the as-delivered state, the steel has a high resistance to low-cycle fatigue; the fatigue strength at Nf = 3.5 × 10⁴ cycles (σNf) was 360 MPa. Both long-term thermal exposure modes lead to a slight decrease in the resistance to the low-cycle fatigue of steel: σNf is decreased by 9%.
(c)
Both long-term thermal exposures change the micro-mechanism of fatigue fracture from quasi-ductile with an irregular grooved relief and secondary cracking to ductile micro-grooved relief.
(d)
A multifold grain growth, after holding at 1200 °C for 3.7 h, changes the predominant sites of fatigue crack initiation from grain boundaries to the grain body and increases the distance between grooves in a fatigue fracture surface.

Author Contributions

Conceptualization, S.A.N. and S.O.R.; methodology, V.A.B.; investigation, S.O.R., V.A.B., M.Y.Z. and N.V.S.; writing—original draft preparation, S.O.R.; writing—review and editing, S.A.N.; formal analysis, M.M.S., visualization, M.M.S. All authors have read and agreed to the published version of the manuscript.

Funding

The study of the structure was carried out using the equipment of the Center for Collective Use “Materials Science and Metallurgy” with the financial support of the Ministry of Science and Higher Education of the Russian Federation (#075-15-2021-696).

Institutional Review Board Statement

Not applicable.

Informed Consent Statement

Not applicable.

Data Availability Statement

The raw/processed data required to reproduce these findings cannot be shared at this time as the data also form part of an ongoing study.

Conflicts of Interest

The authors declare no conflict of interest.

References

  1. Budynas, R.G.; Nisbett, J.K. Shigley’s Mechanical Engineering Design, 9th ed.; McGraw-Hill: New York, NY, USA, 2011; pp. 49–52. [Google Scholar]
  2. Odesskii, P.D.; Egorova, A.A. Strength of steel for unique engineering structures. Russ. Metall. 2012, 2012, 911–918. [Google Scholar] [CrossRef]
  3. Schastlivtsev, V.M.; Tabatchikova, T.I.; Yakovleva, I.L.; Klyueva, S.Y.; Kruglova, A.A.; Khlusova, E.I.; Orlov, V.V. Microstructure and properties of low-carbon weld steel after thermomechanical strengthening. Phys. Met. Metallogr. 2012, 113, 480–488. [Google Scholar] [CrossRef]
  4. Rempe, J.L.; Knudson, D.L.; Condie, K.G.; Suh, K.Y.; Cheung, F.-B.; Kim, S.-B. Conceptual design of an in-vessel core catcher. Nucl. Eng. Des. 2004, 230, 311–325. [Google Scholar] [CrossRef]
  5. Rempe, J.L.; Knudson, D.L. High temperature thermal and structural material properties for metals used in LWR vessels. In Proceedings of the ICAPP’08, Anaheim, CA, USA, 8–12 June 2008; p. 8220. [Google Scholar]
  6. Thinnes, G.L.; Korth, G.E.; Chavez, S.A. High-temperature creep and tensile data for pressure vessel steels SA533B1 and SA508-CL2. Nucl. Eng. Des. 1994, 148, 343–350. [Google Scholar] [CrossRef]
  7. Yang, C.-C.; Liu, C.-L. Improvement of the Mechanical Properties of 1022 Carbon Steel Coil by Using the Taguchi Method to Optimize Spheroidized Annealing Conditions. Materials 2016, 9, 693. [Google Scholar] [CrossRef] [PubMed] [Green Version]
  8. Fischer, M. The severe accident mitigation concept and the design measures for core melt retention of the European Pressurized Reactor (EPR). Nucl. Eng. Des. 2004, 230, 169–180. [Google Scholar] [CrossRef]
  9. Sultan, T.; Sapra, M.K.; Kundu, S.; Kadam, A.V.; Kulkarni, P.P.; Rao, A.R. Experimental & analytical study of passive thermal sensing system developed for cooling water injection into AHWR core catcher. Nucl. Eng. Des. 2017, 322, 81–91. [Google Scholar] [CrossRef]
  10. Loktionov, V.; Lyubashevskaya, I.; Sosnin, O.; Terentyev, E. Short-term strength properties and features of high-temperature deformation of VVER reactor pressure vessel steel 15Kh2NMFA-A within the temperature range 20–1200 °C. Nucl. Eng. Des. 2019, 352, 110188. [Google Scholar] [CrossRef]
  11. Nikulin, S.A.; Rogachev, S.O.; Vasil’ev, S.G.; Belov, V.A.; Komissarov, A.A. Effect of Long-Term Annealing on the Impact Toughness of 22K Steel. Russ. Metall. 2021, 2021, 481–485. [Google Scholar] [CrossRef]
  12. Masuda, C.; Ohta, A.; Nishijima, S.; Sasaki, E.J. Fatigue striation in a wide range of crack propagation rates up to 70 μm/cycle in a ductile structural steel. Mater. Sci. 1980, 15, 1663–1670. [Google Scholar] [CrossRef]
  13. Nip, K.H.; Gardner, L.; Davies, C.M.; Elghazouli, A.Y. Extremely low cycle fatigue tests on structural carbon steel and stainless steel. J. Constr. Steel. Res. 2010, 66, 96–110. [Google Scholar] [CrossRef]
  14. Kim, Y.; Hwang, W. High-Cycle, Low-Cycle, Extremely Low-Cycle Fatigue and Monotonic Fracture Behaviors of Low-Carbon Steel and Its Welded Joint. Materials 2019, 12, 4111. [Google Scholar] [CrossRef] [Green Version]
  15. Noh, K.; Shams, S.A.A.; Kim, W.; Kim, J.N.; Lee, C.S. Influence of Microstructure on Low-Cycle and Extremely-Low-Cycle Fatigue Resistance of Low-Carbon Steels. Met. Mater. Int. 2021, 27, 3862–3874. [Google Scholar] [CrossRef]
  16. Huang, Z.Y.; Wagner, D.; Bathias, C.; Chaboche, J.L. Cumulative fatigue damage in low cycle fatigue and gigacycle fatigue for low carbon–manganese steel. Int. J. Fatigue 2011, 33, 115–121. [Google Scholar] [CrossRef]
  17. Hasunuma, S.; Oki, S.; Motomatsu, K.; Ogawa, T. Fatigue life prediction of carbon steel with machined surface layer under low-cycle fatigue. Int. J. Fatigue 2019, 123, 255–267. [Google Scholar] [CrossRef]
  18. Zhang, M.; Yang, P.; Tan, Y. Micromechanisms of fatigue crack nucleation and short crack growth in a low carbon steel under low cycle impact fatigue loading. Int. J. Fatigue 1999, 21, 823–830. [Google Scholar] [CrossRef]
  19. Lee, T.-H.; Oh, C.-S.; Ryu, S.-H.; Kim, J.-T. Crystallography and Morphology of Carbides in a Low-Cycle Fatigued 1Cr-1Mo-0.25V Steel. Metall. Mater. Trans. A 2011, 42, 147–157. [Google Scholar] [CrossRef]
  20. Hu, Y.; Wu, S.; Withers, P.J.; Cao, H.; Chen, P.; Zhang, Y.; Shen, Z.; Vojtek, T.; Hutař, P. Corrosion fatigue lifetime assessment of high-speed railway axle EA4T steel with artificial scratch. Eng. Fract. Mech. 2021, 245, 107588. [Google Scholar] [CrossRef]
  21. Prymak, O.; Klocke, A.; Kahl-Nieke, B.; Epple, M. Fatigue of orthodontic nickel–titanium (NiTi) wires in different fluids under constant mechanical stress. Mater. Sci. Eng. A 2004, 378, 110–114. [Google Scholar] [CrossRef]
  22. Nikulin, S.A.; Rozhnov, A.B.; Gusev, A.Y.; Nechaykina, T.A.; Rogachev, S.O.; Zadorozhnyy, M.Y. Fracture resistance of Zr–Nb alloys under low-cycle fatigue tests. J. Nucl. Mater. 2014, 446, 10–14. [Google Scholar] [CrossRef]
  23. Rozhnov, A.B.; Pantsyrny, V.I.; Kraynev, A.V.; Rogachev, S.O.; Nikulin, S.A.; Khlebova, N.E.; Polikarpova, M.V.; Zadorozhnyy, M.Y. Low-cycle bending fatigue and electrical conductivity of high-strength Cu/Nb nanocomposite wires. Int. J. Fatigue 2019, 128, 105188. [Google Scholar] [CrossRef]
  24. Zhou, Q.; Qian, L.; Meng, J.; Zhao, L.; Zhang, F. Low-cycle fatigue behavior and microstructural evolution in a low-carbon carbide-free bainitic steel. Mater. Des. 2015, 85, 487–496. [Google Scholar] [CrossRef]
  25. Terent’ev, V.F. Fatigue Strength of Metals and Alloys; Intermet Inzhiniring: Moscow, Russia, 2002. (In Russian) [Google Scholar]
Figure 1. Assembly in SolidWorks for subsequent computer simulation of the bending process: 1—left gripper, 2—right gripper, 3—strip.
Metals 12 00281 g001
Figure 2. Adaptation of the finite element mesh (area in the form of a parallelepiped) when calculating the bending process in QForm.
Metals 12 00281 g002
Figure 3. Structure of AISI 1022 steel in (a) as-delivered state, after (b) TO-1 and after (c) TO-2.
Metals 12 00281 g003
Figure 4. Distribution of stresses in an AISI 1022 steel plate during bending for (a,c,e) low and (b,d,f) high stress amplitude.
Metals 12 00281 g004
Figure 5. Fatigue curves of AISI 1022 steel in different states: —as delivered; —TO-1; —TO-2.
Metals 12 00281 g005
Figure 6. An example of the DMA cyclic testing process diagram for AISI 1022 steel specimens in the as-delivered state.
Metals 12 00281 g006
Figure 7. General view of fatigue fracture surfaces of AISI 1022 steel (a) in the as-delivered state at a stress amplitude 370 MPa; (b) after TO-1 at a stress amplitude 340 MPa; (c) after TO-2 at a stress amplitude 340 MPa (1—crack initiation zone; 2—crack propagation zone; 3—rupture zone).
Metals 12 00281 g007
Figure 8. Fatigue fracture surfaces of AISI 1022 steel (a,b) in the as-delivered state at a stress amplitude of 370 MPa, (c,d) after TO-1 at a stress amplitude of 340 MPa, (e,f) after TO-2 at a stress amplitude of 340 MPa: (a,c,e) fatigue crack propagation zone; (b,d,f) rupture zone.
Metals 12 00281 g008
Figure 9. The upper surface of AISI 1022 steel specimens in the as-delivered state after cyclic tests at stress amplitude: (a) 300 MPa; (b) 340 MPa; (c) 370 MPa; (d) 470 MPa.
Metals 12 00281 g009
Figure 10. The upper surface of AISI 1022 steel specimens after heat treatment (TO-1) and cyclic tests at stress amplitude: (a) 300 MPa; (b) 380 MPa.
Metals 12 00281 g010
Figure 11. The upper surface of AISI 1022 steel specimens after heat treatment (TO-2) and cyclic tests at stress amplitude: (a) 370 MPa; (b) 420 MPa.
Metals 12 00281 g011
Figure 12. Structure and development of fatigue cracks (a,b) before and (c,d) after etching of AISI 1022 steel specimens in the as-delivered state after cyclic tests at stress amplitude: (a,c) 360 MPa; (b,d) 460 MPa.
Metals 12 00281 g012
Figure 13. Structure and development of fatigue cracks (a,b) before and (c,d) after etching of AISI 1022 steel specimens after TO-1 and cyclic tests at stress amplitude: (a,c) 340 MPa; (b,d) 420 MPa.
Metals 12 00281 g013
Figure 14. Structure and development of fatigue cracks (a,b) before and (c,d) after etching of AISI 1022 steel specimens after TO-2 and cyclic tests at stress amplitude: (a,c) 370 MPa; (b,d) 420 MPa.
Metals 12 00281 g014
Table 1. The chemical composition of 22 K steel (mass. %).
FeCSiMnPSCrNiCuAl
bal0.240.260.750.0130.0010.040.030.050.03
Table 2. Mechanical properties of AISI 1022 steel after various heat treatments.
Stateσmax [MPa]σNf * [MPa]σNf/σmax
as-delivered5003600.7
TO-14503300.7
TO-24703300.7
*—at N = 3.5 × 10⁴ cycles.
Publisher’s Note: MDPI stays neutral with regard to jurisdictional claims in published maps and institutional affiliations.

