Article

A Multiple Site Type Nucleation Model and Its Application to the Probabilistic Strength of Pd Nanowires

Faculty of Mechanical Engineering, Technion-Israel Institute of Technology, Haifa 3200003, Israel
*
Author to whom correspondence should be addressed.
Metals 2022, 12(2), 280; https://doi.org/10.3390/met12020280
Submission received: 6 December 2021 / Revised: 22 January 2022 / Accepted: 25 January 2022 / Published: 4 February 2022
(This article belongs to the Section Computation and Simulation on Metals)

Abstract

:
Pristine specimens yield plastically under high loads by nucleating dislocations. Since dislocation nucleation is a thermally activated process, the so-called nucleation-controlled plasticity is probabilistic rather than deterministic, and the distribution of the yield strengths depends on the activation parameters to nucleate. In this work, we develop a model to predict the strength distribution in nucleation-controlled plasticity when there are multiple nucleation site types. We then apply the model to molecular dynamics (MD) simulations of Pd nanowires under tension. We found that in Pd nanowires with a rhombic cross-section, nucleation starts from the edges, either with the acute or the obtuse cross-section angles, with a probability that is temperature-dependent. We show that the distribution of the nucleation strain is approximately normal for tensile loading at a constant strain rate. We apply the proposed model and extract the activation parameters for site types from both site types. With additional nudged elastic bands simulations, we propose that the activation entropy, in this case, has a negligible contribution. Additionally, the free-energy barriers obey a power-law with strain, with different exponents, which corresponds to the non-linear elastic deformation of the nanowires. This multiple site type nucleation model is not subjected only to two site types and can be extended to a more complex scenario like specimen with rough surfaces which has a distribution of nucleation sites with different conditions to nucleate dislocations.

1. Introduction

Nucleation is a thermally activated process in which a new structure is formed, and it plays a significant role in a wide range of phenomena and applications. In particular, nucleation of dislocations is the predominant process in the plasticity of defect-free (pristine) specimens at the nanoscale. When applying loads to specimens that are pristine of dislocations (such as nanowires and nanoparticles), they yield plastically by nucleating a dislocation. This so-called nucleation-controlled plasticity is characterized by high strengths, usually in the GPa regime, as was found both in experiments and in molecular dynamics (MD) simulations [1,2,3,4,5,6]. Dislocation nucleation can take place in the bulk (e.g., in nanoindentation [7,8]), but in many cases, it was shown to occur on the surface. In nanoparticles, for instance, strength was found to be controlled by dislocation nucleation at the vertices in Au [9], MgO [10], Fe [11], Ni [12], and Mo [13] nanoparticles. Nucleation-controlled plasticity in nanowires (also named nanowhiskers) under tension is also argued to start on the surface [2,3,14,15]. Numerous experimental studies were performed on the strength of nanowires, such as Au [14,16,17], Pd [16,18], Cu [3], and Ag [19]. Nanowires of face-centered cubic metals are characterized by an abrupt load drop at the onset-of-plasticity, with tensile strengths in the GPa regime, that corresponds to the nucleation of a partial dislocation [20]. MD simulations suggest that the partial dislocation nucleates on the surface, on the edges between two facets with an obtuse angle between them [21,22].
However, since nucleation is a thermally activated process, it becomes more and more apparent that strength in nucleation-controlled plasticity is a probabilistic process, i.e., at each given temperature, a specimen has a probability of yielding plastically at certain stress, rather than having a deterministic value. Schuh et al. [7] performed nanoindentation experiments at several temperatures, showing that the pop-in load is distributed. The stochastic behavior was related to the probabilities to nucleate a dislocation beneath the indent. Following this work, several other experimental studies have shown similar distributed behavior in the load of the pop-in events [8,23,24,25,26]. Chen et al. took this observation to the fore [27] and studied the distribution of the strength of Pd nanowires in tensile loading. They showed that the strength is in the GPa regime, which is typical of nucleation-controlled plasticity, but instead of being deterministic, it was distributed over a large range. For example, the strength of the Pd nanowires was distributed at room temperature between 2 GPa and 8 GPa. This behavior was later observed in Au nanowires, where it was also shown that thin Al2O3 coating reduces the strength distribution [28]. It was argued that while plasticity of the coated nanowires is still controlled by dislocation nucleation at the surfaces, the smaller strength distribution is rationalized by a change in the nucleation conditions, i.e., the activation parameters are altered. Thus, to quantify the strength distribution at the nanoscale, it is imperative to quantify the nucleation activation parameters at the nucleation site.
Generally, one can characterize the activation parameters at a nucleation site using a free-energy barrier G and an attempt rate ν 0 . The free-energy barrier varies with different state variables, such as strain, stress, and temperature. Schuh et al. proposed using the probabilistic behavior of the pop-in stresses in nanoindentation to find the activation parameters from experiments [7]. To calculate the activation parameters, it was assumed that the free-energy barrier decreases linearly with stress, and it is temperature-independent. However, atomistic simulations further showed that these assumptions are not necessarily correct. For instance, Zhu et al. [29] calculated the free-energy barrier to nucleate dislocations in Cu nanowires with a rectangular cross-section under uniaxial compression using the free-end nudged elastic band (FENEB) method. They found a non-linear dependency of the free-energy barrier on the compressive stress and proposed a power-law dependency on the stress, rather than a linear relation. However, the FENEB does not capture the temperature-dependency of the free-energy barrier. Ryu et al. [30] revisited the assumption that the free-energy barrier is temperature independent, and by developing a method combining the umbrella-sampling with MD simulations, they found the substantial contribution of the temperature to the free-energy barrier in the nucleation of prismatic dislocation loops in Cu bulk [31] and nanowires [30]; there can be a non-negligible contribution of the activation entropy. More specifically, they proposed that the free-energy barrier is decreasing linearly with the temperature (the Meyer–Neldel compensation rule [32]) and that it vanishes at about half of the bulk melting temperature. This was attributed to the melting temperature near the surface. Based on the understanding of how the free-energy barrier depends on stress and temperature, Gianola and co-authors extended the analysis proposed by Schuh et al., to calculate the activation parameters to nucleate partial dislocations on the surface of Pd nanowires [27] and Au/Coated Au nanowires [28] from the strength distributions. The calculation of the activation parameters from the probabilistic strength of specimens at the nanoscale was extended by Chachamovitz and Mordehai [33] to MD simulations, who showed that the activation volume, which is the change in the free-energy barrier per change in the applied stress, can be obtained directly from the strength distribution.
Despite the progress made in extracting the activation parameters from the distribution of the strength as a function of temperature, all models suffer from the same shortcoming; it is assumed that all nucleation sites have the same activation parameters. However, the assumption that in realistic conditions there is only one site type is not necessarily correct. For instance, it was shown experimentally that the surface of nanowires is not atomically flat and the edges, at which partial dislocations are nucleated, are not sharp [20]. Such atomic surface-steps may serve as nucleation sites, with different conditions for dislocation nucleation, as was also observed in faceted Au nanoparticles after exposing them in a focused-ion beam environment [34]. However, even without surface flaws or rounded edges, atomistic simulations have addressed the question of dislocation nucleation from different sites on the surface of Au nanowires and it was shown that the activation parameters from different edges of the nanowires are different [21]. While different activation parameters of comparable values were found from different nucleation sites on the surface, only one nucleation site prevails in these simulations since atomistic simulations are usually performed at low temperatures. Although the nucleation site type with the lowest energy barrier is preferable at low temperatures, the probability to nucleate dislocations in sites with higher energy barriers is possible at intermediate and high temperatures, as was argued by Amodeo et al. for MgO nanoparticles under compression [35]. It was shown using nudged elastic band (NEB) simulations that the probabilities to nucleate dislocations from the vertices of MgO nanoparticles or edges at 1000 K are of the same order under a compressive strain of 11%. Similar ideas, on the effect of other dislocation sources on plasticity, were raised in recent years for the distribution of dislocation sources in non-pristine small-scale specimens. For instance, Derlet and Maaß quantified the size-effect in the strength of micropillars by proposing a certain distribution of critical stresses for a plastic event to occur [36]. Recently, Gu et al. developed a model for dislocation-mediated plasticity in small-scale specimens, considering different distributions of the dislocation microstructure [37]. However, to the best of our knowledge, the distribution of nucleation site types was not included in the nucleation-controlled plasticity of pristine specimens at the nanoscale. Current nucleation models do not account for how different possible nucleation site types affect the overall strength.
On one hand, the probabilistic strength was demonstrated in numerous experiments, as detailed above. However, nucleation is a rapid process and experiments alone cannot reveal the activation parameters and where exactly dislocations are nucleated. On the other hand, atomistic simulations can provide details on the nucleation sites and the nucleation rates from each site, but these were not related to the probabilistic strength. To bridge this gap, the probabilistic strength should be related to the nucleation rates when there are different nucleation sites. The main objective of this study is to set the theoretical ground to study the strength of pristine specimens when there are different conditions for dislocation nucleation. In this work, we extend the study on nucleation-controlled plasticity to cases in which there are multiple types of nucleation sites. To demonstrate the model, we perform MD simulations of Pd nanowires with a rhombic cross-section. We show that even in pristine nanowires, there are two possible nucleation sites, and we employ the model to calculate the activation parameters for dislocation nucleation from both sites in Pd nanowires. Using MD simulations, we show that the plasticity of Pd nanowires under tensile loading is controlled by dislocation nucleation from both types of edges, with probabilities that depend on the temperature. Using the proposed multiple-site nucleation model and the MD simulations results, complemented by several NEB simulations, we analyze the free energy barriers to nucleate dislocations from each edge of the nanowire and discuss the results.

2. Methods

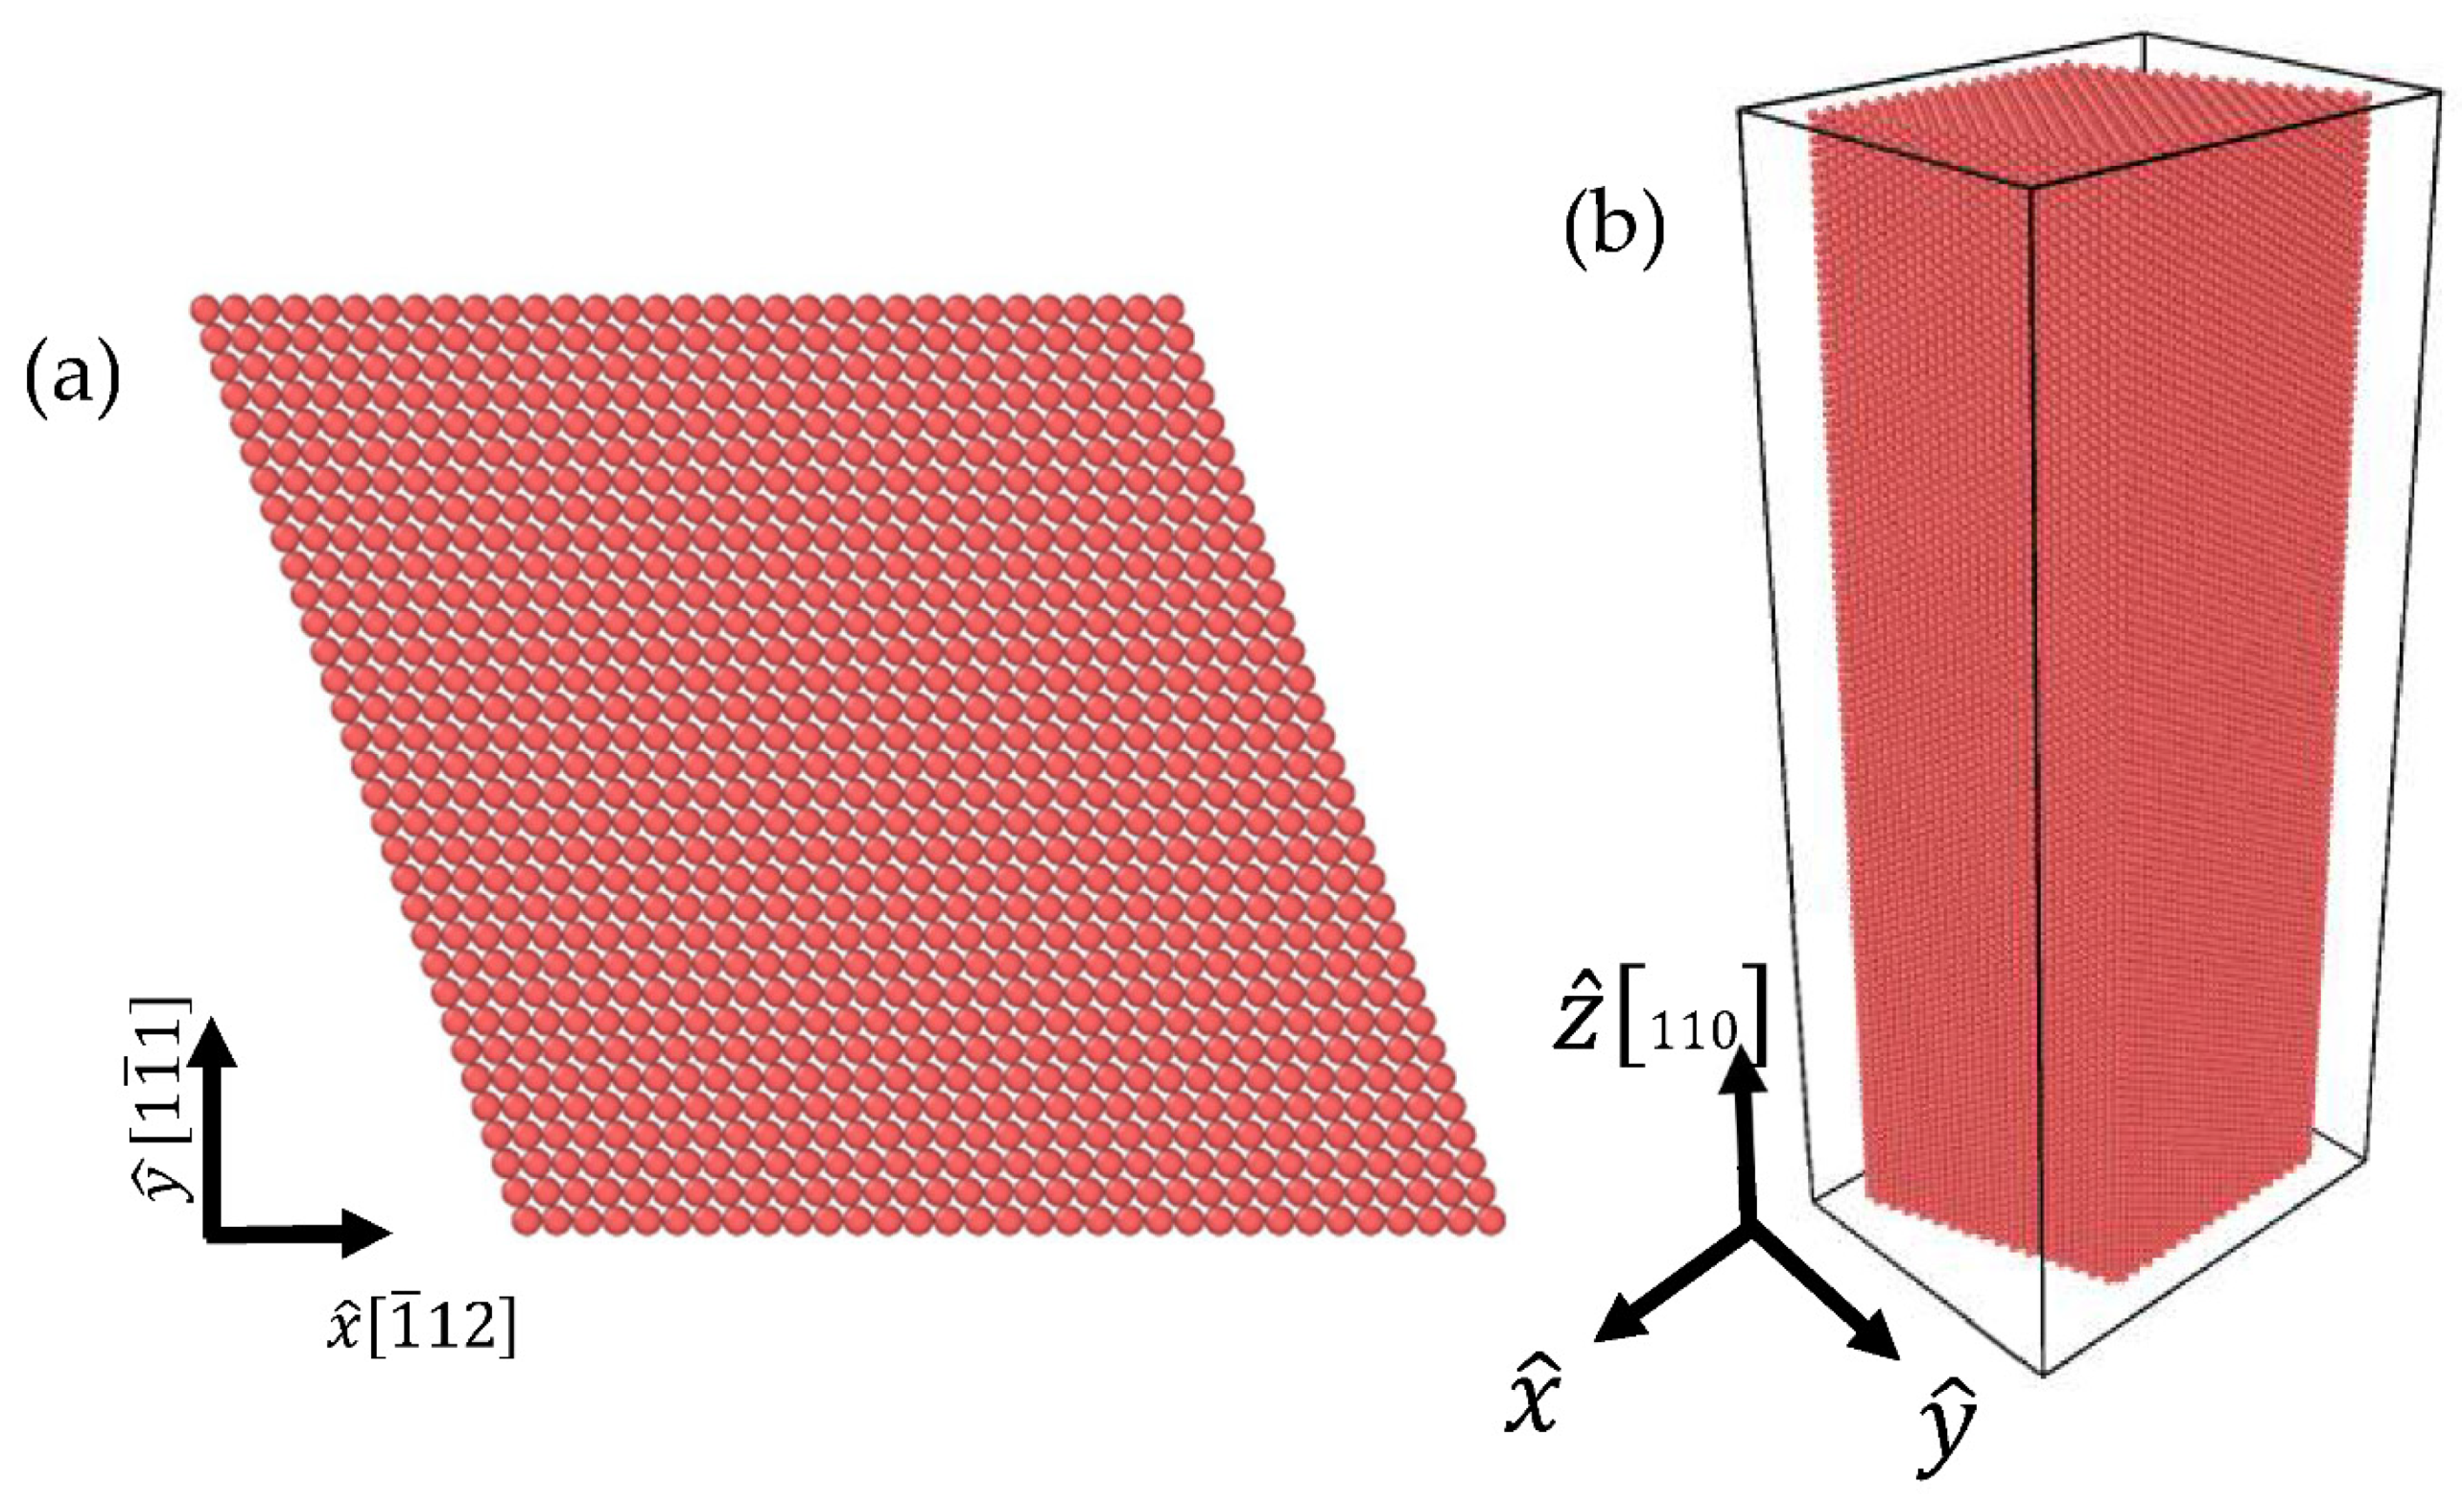
2.1. Molecular Dynamics Simulations

We perform tensile loading MD simulations of Pd nanowires using the Large-scale Atomic/Molecular Massively Parallel Simulator (LAMMPS) [38]. The Pd interatomic interactions were described according to the embedded atom method (EAM) interatomic potential, using the parameterization proposed by Zhou et al. [39]. This interatomic potential parametrization was employed successfully to study mechanical properties at the nanoscale in the past (e.g., [40,41]). We constructed a nanowire with a rhombic cross-section, axially orientated in a [ 110 ] direction (z-axis) and with facets on ( 1 1 ¯ 1 ) and ( 1 1 ¯ 1 ¯ ) planes. Pd nanowire with a rhombic cross-section was observed experimentally [16]. All simulations are performed with the same size nanowire with a length of 8 ( 6 a ) = 7.6   nm for the unrelaxed edges of the rhombic section, where a = 3.89   Å is the zero-temperature lattice constant. Periodic boundary conditions are applied along the nanowire axis, with an unrelaxed periodicity of L = 109 ( a / 2 ) = 30   nm . Non-periodic boundary conditions are applied in the non-axial directions and the cell size in these directions is chosen to be large enough to avoid interaction of the boundaries with the atoms on the surface of the faceted nanowire. The unrelaxed shape of the nanowire is shown in Figure 1.
After construction, the nanowires were relaxed via conjugate gradient allowing both the atomic positions and MD computational cell size along the nanowire axis to change. Then, we initialized the velocities of the atoms to twice the desired temperature and relaxed the atomic system dynamically in a constant-temperature constant-stress ensemble (NPT ensemble), allowing the computational cell along the nanowire axis (z-direction) to thermally expand to nullify the internal axial stress at the desired temperature. The computational cell dimensions in the x- and y-directions are kept constant during the whole simulation. The dynamics relaxation is performed for 10,000 timesteps of 1 fs. After relaxing the nanowire at the desired temperature, it is tensile loaded at a constant rate of 108 s−1 by changing the computational cell size along the z-direction, without changing the cell dimensions in the two other directions. During tensile loading, we apply the constant-temperature canonical ensemble using the Langevin thermostat. The timestep of the MD simulation was set to 1 fs.
During the simulation, the evolution of the virial of the atomic system is calculated. The engineering stress is then defined as the virial over the initial volume of the nanowire, and the engineering strain is the relative change of the length in the z-direction, with respect to the relaxed box size. An example of a typical stress-strain curve for a temperature of 100 K is shown in Figure 2a. The nanowires are deforming elastically up to tensile stresses in the GPa regime and there is a stress drop when the dislocation is nucleated. We define the strain at which the stress drops as the nucleation strain (we refer the reader to the Supplementary Information file for a detailed description of how the nucleation strain was found automatically). Additionally, the atomic configuration slightly after the nucleation strain is recorded. Using the common neighbor analysis (CNA) implemented in OVITO [42] we identified the nucleated dislocation. As we shall further show, dislocations can be nucleated from the edge with the obtuse or the acute angle. Based on the intermediate positions of the nucleated partial dislocation, we identify the nucleation site of the dislocations. An example for each case is shown in Figure 2b (we employ OVITO for visualization).
We wish to note that the elastic deformation is non-linear. Similar qualitative behavior was found experimentally by Chen et al. [27]. While we further quantify the elastic constants and their first derivative in the discussion, the linear elastic constants calculated at small deformation yield comparable results to the experimental values. According to the OpenKIM website [43], the EAM potential yields C 11 = 249.47   GPa , C 12 = 175.78   GPa and C 44 = 81.25   GPa , which yields an anisotropic elastic constant along the tensile direction [44] of E { 110 } = 169.76   GPa , This value is in good comparison with the experimental values proposed by Chen et. Al. [27] for tensile loading of Pd nanowires. Nonetheless, we emphasize that although the values ratify the applicability of the Pd potential to study mechanical properties, we control the strain rate in our simulations, and to apply the nucleation model, we do not demand a linear stress-strain relation or accurate values for the elastic constants.

2.2. Nudged Elastic Band Simulations

NEB simulations are performed, with information on the position of the atoms from the MD simulation. To construct the initial and final replicas for the NEB simulation, two atomic positions from a tensile loading MD simulation at very low temperature were taken slightly before and after the nucleation, corresponding to the initial and final configurations for the NEB, respectively. Then, the positions of the atoms in the initial and final configurations were uniformly scaled to the same strain. We performed this scaling for several strain values, between 0% and 4%. The initial configurations were relaxed via conjugate gradient with a relative energy tolerance of 10−8. Then, we used 65 replicas of states between the initial and final configurations with a spring constant of 0.5 eV / Å 2 and applied the Fire algorithm relaxation on each replica with a relative energy tolerance of 10−8.

3. Results

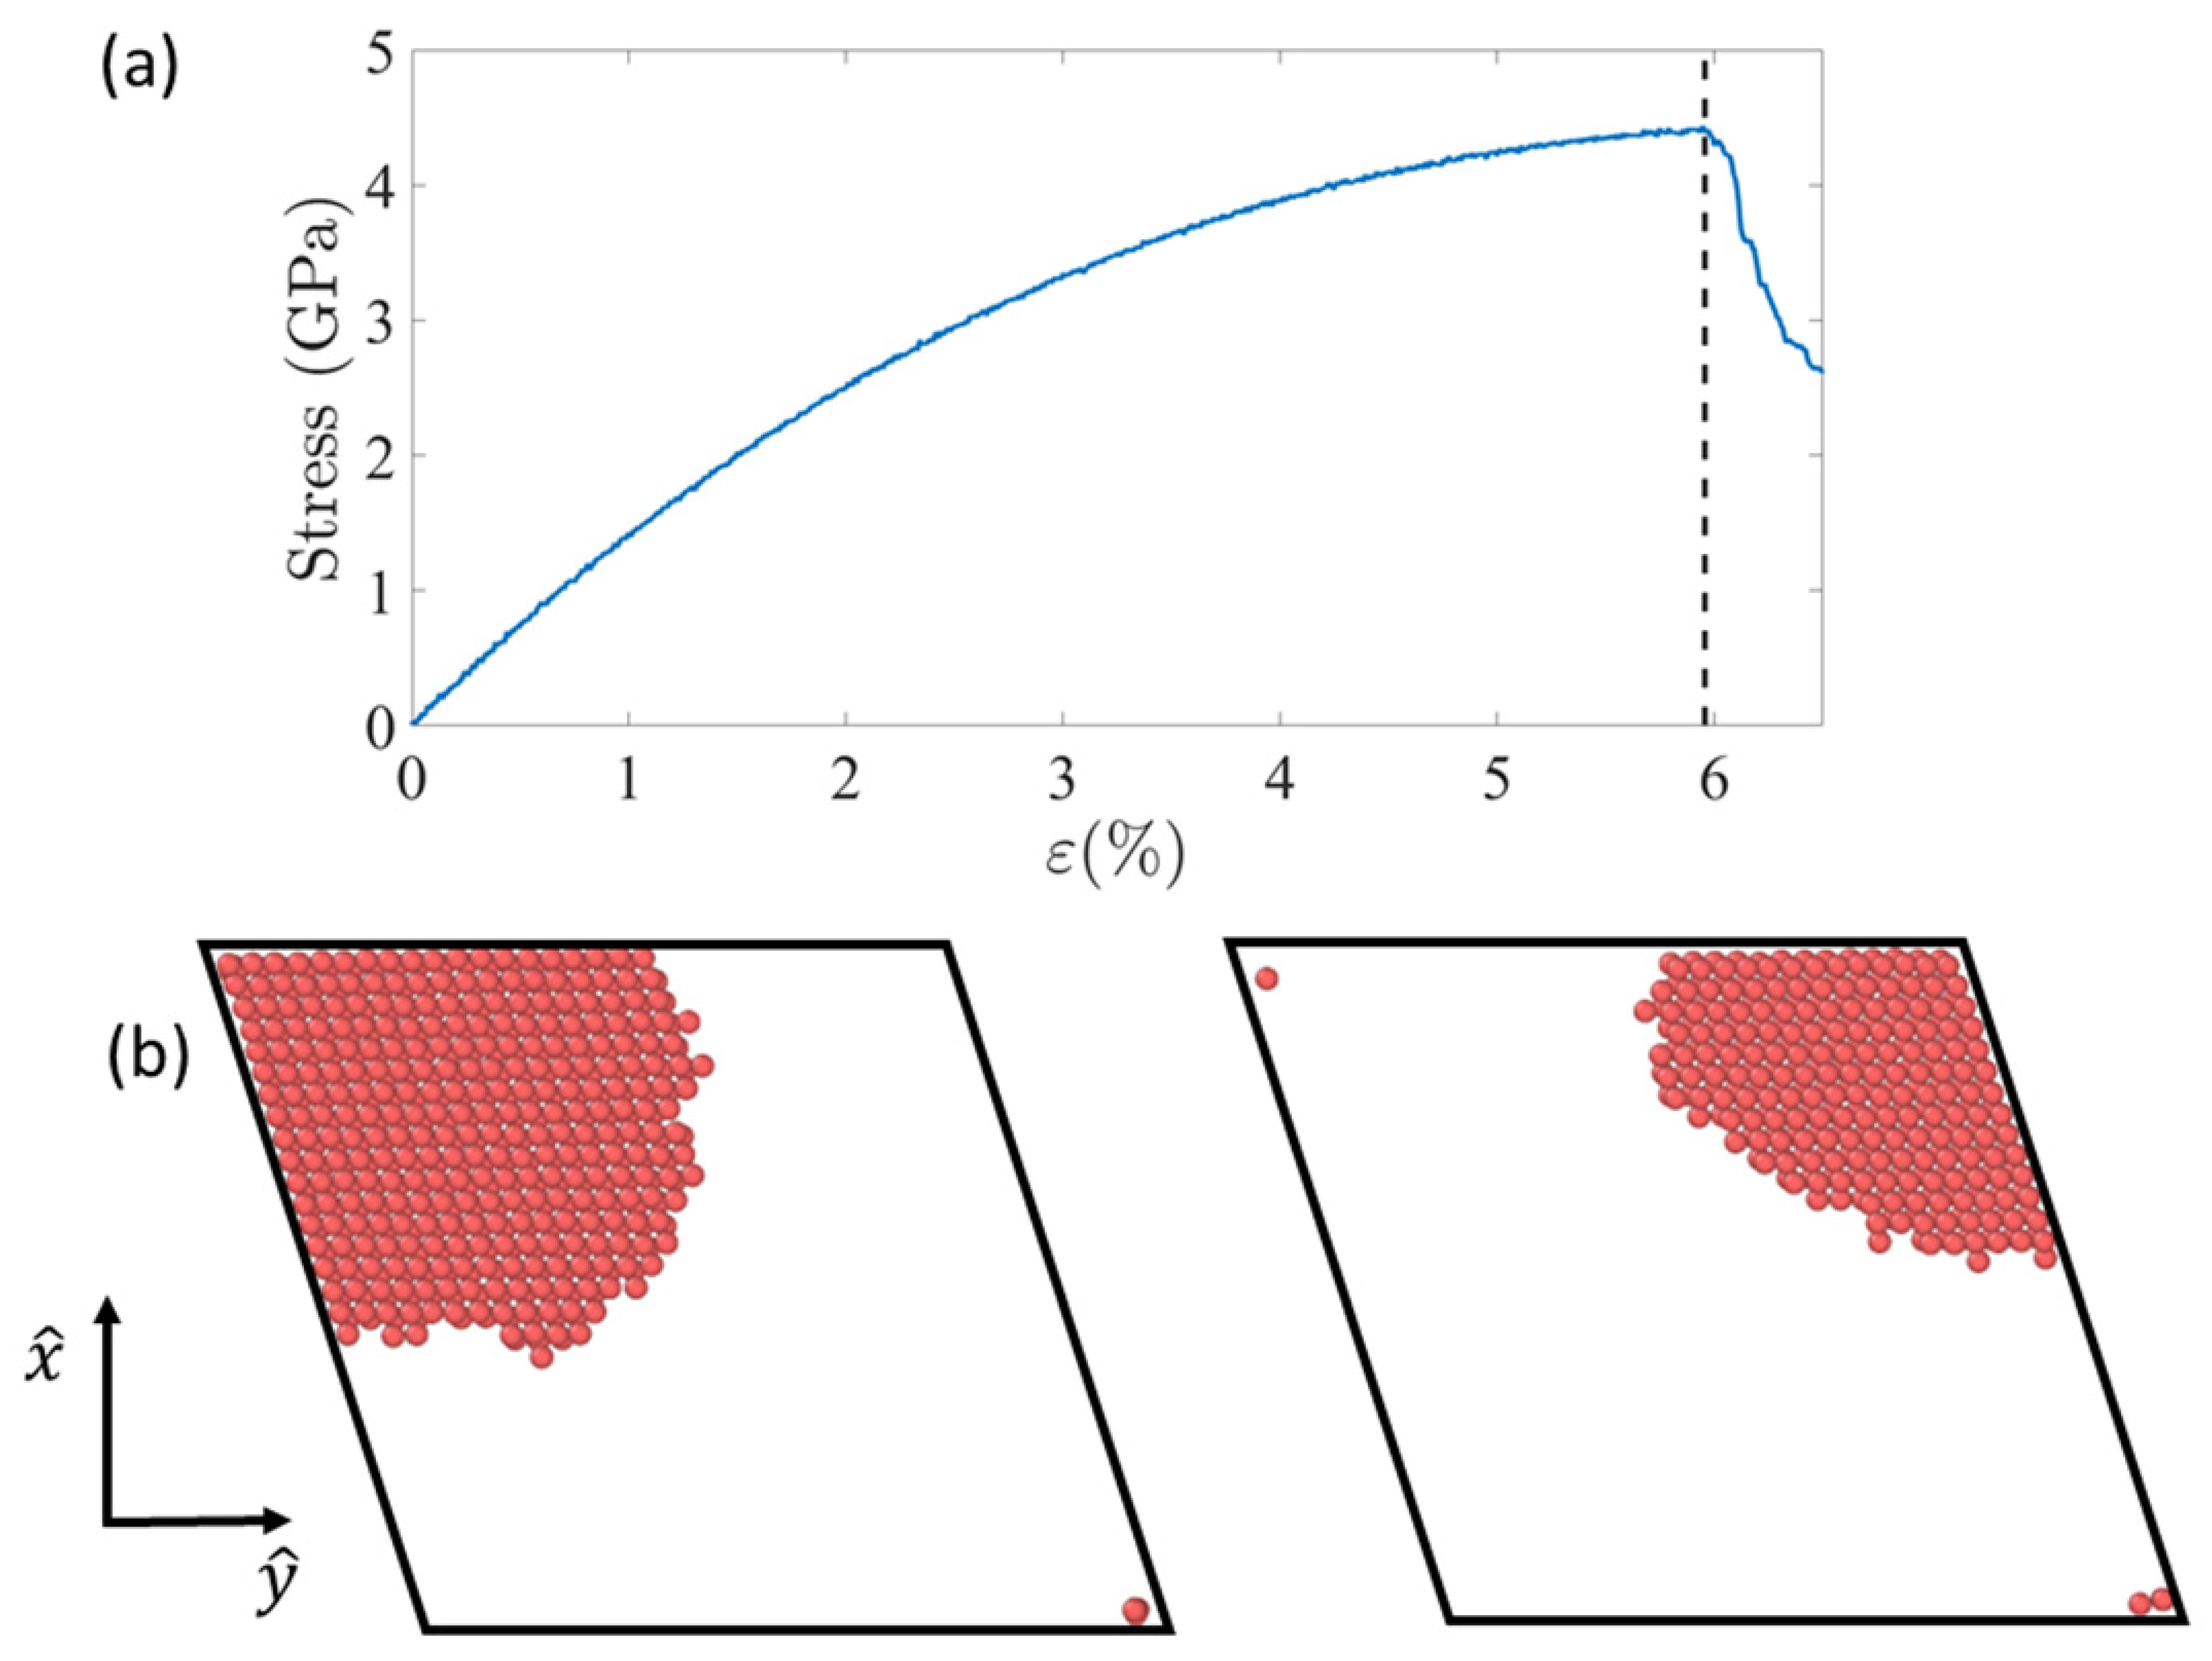
3.1. MD Simulations of Nucleation-Controlled Plasticity in Pd Nanowires

Tensile loading of a Pd nanowire was established in the MD simulations. While the geometry of the nanowire and the strain rate was kept constant in all simulations, we varied the temperature between 2 K and 800 K. At the lowest temperature, nucleation is expected to be nearly spontaneous and not probabilistic. When examining the nucleation site, we find nucleation to occur in the edge with the acute angle. Therefore, the strain at which dislocation is nucleated in this simulation is denoted as the critical strain ε c r , and in the loading conditions applied in this work, we find it to be ε c r , 1 = 6.98 % . The subscript ‘1′ refers to parameters that are related to a nucleation from the acute angle.
As for the other temperatures, we performed 30 to 60 simulations at each temperature, each simulation is with different distributions of initial velocities (the smaller number of simulations was performed at temperatures below 200 K). In each simulation, the strain at which a dislocation was nucleated was calculated, and the nucleation site was identified, as detailed in the previous section. In all simulations up to a temperature of 200 K, a Shockley partial dislocation was always nucleated at the acute angle. However, at higher temperatures, a Shockley partial dislocation was nucleated either in the obtuse or the acute angle, with decreasing probability to nucleate from the acute angle with higher temperatures. We note that although the same dislocation type was nucleated, its character might be different since the line direction of the dislocation nucleated from each site is different [21]. In Figure 3, we summarize the probability to nucleate a dislocation from the acute angle, based on all the simulations. For instance, at 700 K, dislocation was first nucleated in the acute angle only in 17 simulations out of the 60.
Additionally, based on the nucleation strain in each simulation, the cumulative distribution function (CDF) of the nucleation strains was calculated at each temperature. The CDFs are plotted in Figure 4, in which we considered the relative number of simulations in which nucleation occurred up to a certain strain, regardless of the nucleation site, but we marked differently the contribution from each site. One can see that CDFs qualitatively resemble the CDFs found for nucleation in Mo nanoparticles, although throughout the whole range of temperatures examined in the Mo nanoparticles, nucleation always occurred from the same site type (the vertices) [33]. Error functions are fitted to each CDF, from which the most probable nucleation strain ε ¯ and the distribution width ω are calculated. The results are plotted as a function of temperature in Figure 5. The value of ε ¯ is decreasing with temperature, whereas at the lower temperatures the decrease is sharper. Another increase in the slope (in absolute values) is observed at higher temperatures, above 500 K.
Several approximations have been proposed for the relation between the temperature and ε ¯ . Generally, one can summarize the relation to be of the form
ε c r ε ¯ ( T ) T 1 n ,
where some previous studies proposed a value of n = 1 or n = 2 [45]. In this study, we find n = 2.33 . While this is a phenomenological relation, it does not capture the increasing slope at high temperature, but we find it sufficient when further analyzing the results in the following Sections.
While the most probable strain is composed of nucleation from both sites, let us examine the average nucleation strain from the acute and obtuse angles. We denote the average nucleation strain when considering the values from the i-th site type only by ε ^ i . At the lowest and highest temperatures, there is a clear preference to one of the sites, i.e., the value of ε ¯ is equal to the average value obtained for nucleation in the acute ( ε ^ 1 ) or obtuse ( ε ^ 2 ) angles in low and high temperatures, respectively. At intermediate temperatures (450 K–600 K), in which the probabilities to nucleate dislocation in both site types were comparable, the value of ε ¯ was found to be in between ε ^ 1 and ε ^ 2 , emphasizing that both sites are contributing, in correlation with the probabilities shown in Figure 5. We accentuate that ε ^ i is not necessarily the most probable nucleation strain from the i-th site type if only the i-th site type is active, since we do not control the nucleation site and the nucleation from both sites is always active in each simulation. We further discuss the relation between ε ^ i and ε ¯ in the framework of the multiple site type nucleation model. Additionally, the distribution width was found to increase with temperature up to 550K, above which a change in tendency is observed. We draw the attention of the reader that a change in tendency (the slope) was also observed at the same range of temperature in the plot of ε ¯ ( T ) .
The simulation results demonstrate the probabilistic behavior of the strength of Pd nanowires at non-zero temperatures. Probabilistic strength in nucleation-controlled plasticity was shown to be related to the free-energy barrier and the attempt rate for nucleation (e.g., [7,18,33]). However, all previous models assume all nucleation sites have the same activation parameters and treat them as one site type nucleation model. Since we identified two types of nucleation sites, we need first to generalize the models to multiple nucleation site types, from which we would be able to extract the activation parameters for nucleation for each nucleation site type.

3.2. Multiple Site type Nucleation Model

In this section, we extend these models to a case in which nucleation can take place in one of several nucleation site types, which are different from one another in their activation parameters. Let us assume there are M different types of sites, and there are Ni sites of type i. The activation free-energy barrier to nucleate a dislocation at i-th site is F i ( ε , T ) where T is the temperature of the system and ε is the uniaxial strain. We note that in this work we control the strain, and we are using the activation Helmholtz free energy for dislocation nucleation. Controlling the stress will lead to a similar analysis, but with the Gibbs free energy for dislocation nucleation G i ( σ , T ) . Based on models, such as the transition state theory (TST) or Becker-Döring (BD) theory, the rate at which the system overcomes this energy barrier at the i-th site is
ν i = ν i 0 e β F i ( ε , T ) ,
where ν i 0 is a stress-independent attempt rate at the i-th site and β = ( k B T ) 1 has its usual meaning. While in the TST model, the prefactor ν i 0 is assumed to be temperature-independent, in the BD model, ν i 0 is a combination of several parameters (including the Zeldovich factor), which are temperature-dependent. However, in the work of Ryu et al. on the nucleation of dislocations in Cu nanowires, the temperature dependence of the prefactor was found to be insignificant, with respect to the temperature dependency of the exponent. Therefore, we consider ν i 0 to be constant.
As in previous models, we assume that load on the nanowire increases from an unstrained configuration (at t = 0 ) at a constant strain rate ε ˙ ; i.e., the uniaxial strain is ε = ε ˙ t . The atoms will then fluctuate around their equilibrium positions until a dislocation will be nucleated in one of the sites. The probability Φ ( t + δ t , T ) of having a single passage over the barrier until time t + δ t in one of the sites is the probability that such an event already occurred until time t or, if it did not occur until time t , a dislocation was nucleated in one of the sites in the time interval ( t , t + δ t ),
Φ ( t + δ t , T ) = Φ ( t , T ) + [ 1 Φ ( t , T ) ] i = 1 M N i v i δ t .
In addition, let us define a new function of the strain and temperature P i ( ε , T ) for each site type,
P i ( ε , T ) = N i v i j = 1 M N j v j .
The physical meaning of the function P i ( ε , T ) will be further clarified. Thus, we can replace the sum in Equation (3) with the nucleation rate and the function P i ( ε , T ) in one of the sites. For clarity, in what follows, we use to notation F 1 and P 1 to indicate the function F 1 ( ε , T ) and P 1 ( ε , T ) , unless the functions are calculated at a specific strain. Without loss of generality, let us express the probabilities according to the nucleation at the 1-st site type,
Φ ( t + δ t , T ) = Φ ( t , T ) + [ 1 Φ ( t , T ) ] N 1 v 1 P 1 δ t .
The solution of this differential equation yields the function Φ , which is also known as the CDF,
Φ ( ε   , T ) = 1 exp [ N 1 ν 1 0 ε ˙ 0 ε 1 P 1 ( η , T ) e β F 1 ( η , T ) d η ] .
We changed Φ from being a function of time to a function of the strain, since they are one-to-one related.
Similar to the analysis performed in [33] for one nucleation site type, the CDF can be approximated to an error function, centered at the most probable strain ε ¯ , with standard deviation ω . The analysis, which is detailed in Appendix A yields that the activation parameters correspond to ε ¯ via the relation
N 1 ν 1 0 ε ˙ P 1 ( ε ¯ , T ) e β F 1 ( ε ¯ , T ) = P 1 , ε ( ε ¯ , T ) P 1 ( ε ¯ , T ) β F 1 , ε ( ε ¯ , T ) ,
and to the standard deviation of the CDF through the relation,
( 1 ω ( ε ¯   , T ) ) 2 = ( β F 1 , ε ( ε ¯   , T ) ) 2 + 2 P 1 , ε ( ε ¯   , T ) P 1 ( ε ¯   , T ) β F 1 , ε ( ε ¯   , T ) + P 1 , ε ε ( ε ¯   , T ) P 1 ( ε ¯   , T ) .
In this relation, the values of F 1 , P 1 and their derivatives are considered for each temperature T at the most probable strain ε ¯   .
One can see that when considering only one type of nucleation site ( P 1 = 1 ), Equation (7) reduces back to previously published models (e.g., Equation (39) in Ref. [30] for a stress-controlled deformation). Similarly, when considering one site type nucleation model, the relation in Equation (8) is similar to the results found in [33], with the exception that here the derivative of the free energy is with respect to the strain and not the stress and is not interpreted as the activation volume.
We have chosen to express the solution based on one site type, which we denoted as type 1, but it is imperative to emphasize that there is no unique preference to one site or another. The information on the other sites is embedded within the function P 1 . If one substitute Equation (4) into Equation (7), then the equal contribution of all sites is revealed,
1 ε ˙ ( i = 1 M N i v i ( ε ¯ , T ) ) 2 = β i = 1 M N i v i ( ε ¯ , T ) F i , ε ( ε ¯ , T ) .  
This equation becomes the known solution for a single site when we consider M = 1 . As we shall demonstrate, in case the energy barrier is unknown, the use of Equation (7) can be handy in the case of Pd nanowires since it requires finding the activation parameters for a single site only. The result can be expressed using all site types by substituting the function P 1 using Equation (4),
( 1 ω ( ε ¯   , T ) ) 2 i = 1 M N i v i ( ε ¯ , T ) ( β F i , ε ( ε ¯ , T ) ) 2 i = 1 M N i v i ( ε ¯ , T ) .
In what follows, we apply the multiple site type nucleation model to the MD simulation results, to find the activation parameters for nucleation, i.e., the functions F i ( ε ,   T ) and the attempt rates ν i 0 .

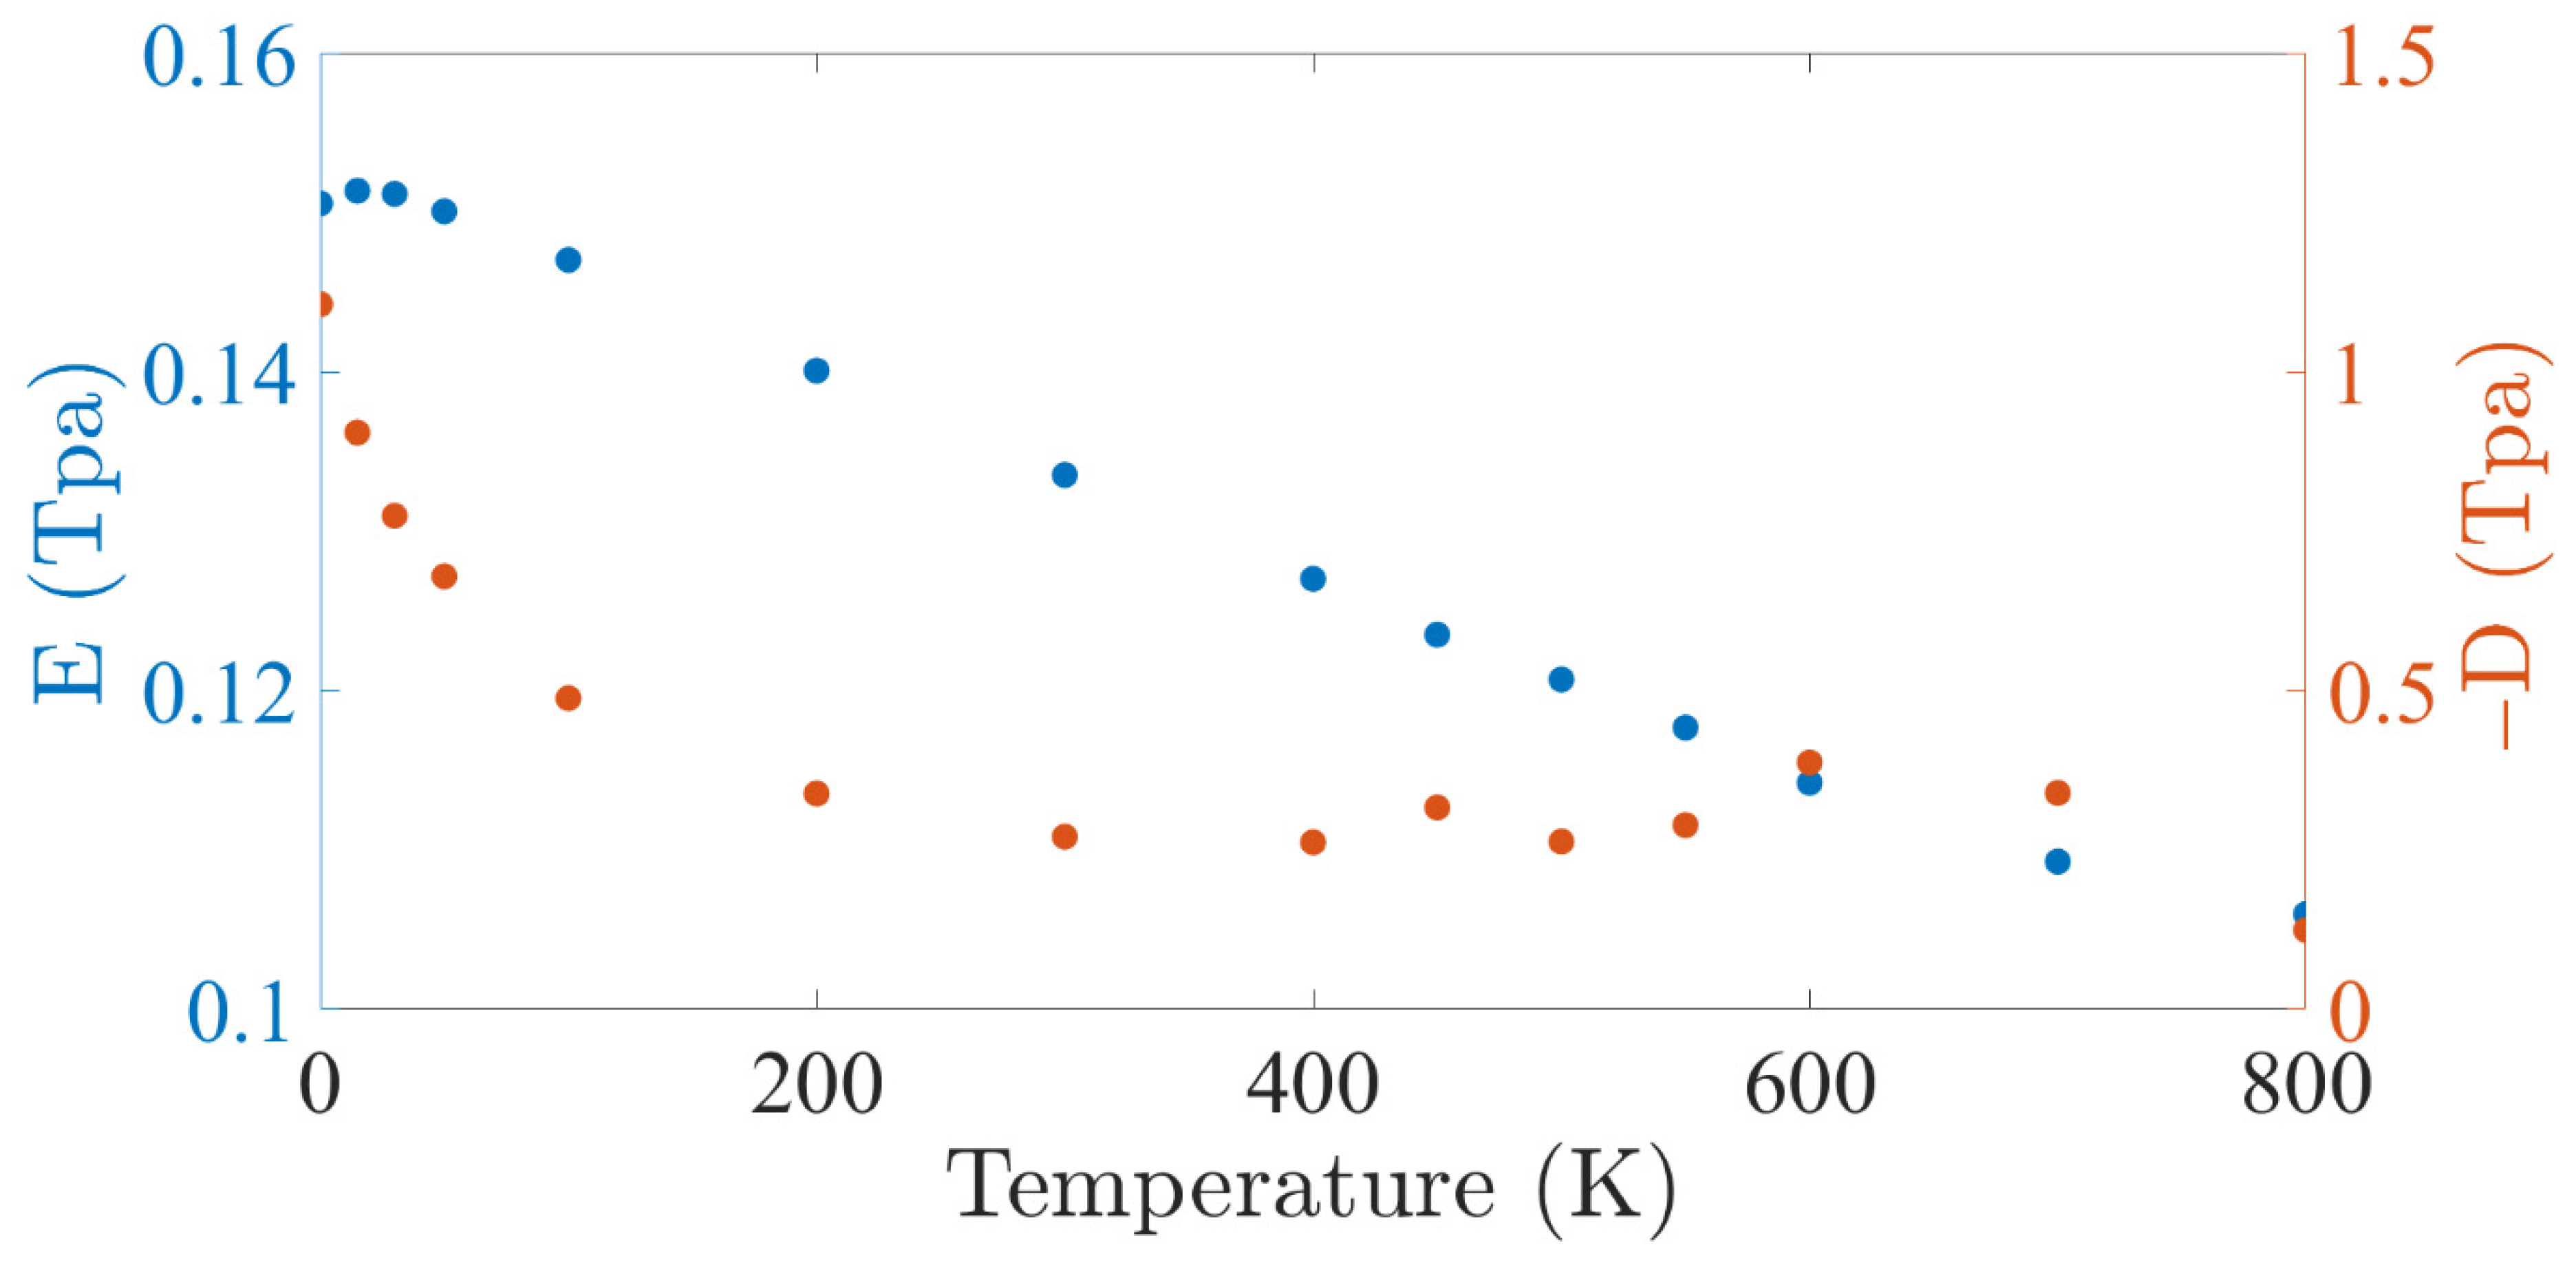
3.3. Calculation of the Activation Parameter from the Two Types of Edges

When only one site type existed, the activation volume could have been calculated directly from the CDF distribution width. However, in the case of the nanowire shown here, we have two site types. The MD simulations demonstrate the dislocations can be nucleated under tensile loading either from the edge with the obtuse or the acute angle. The probabilistic behavior, with the temperature-dependent probabilities for nucleation from both sites, can be employed to calculate the activation parameters for nucleation from the obtuse and acute angles. The distribution of the strength of the nanowires is controlled by the free energy barrier functions to nucleate dislocation in the acute and obtuse angles, F 1 and F 2 , respectively, and the attempt rates ν 1 0 and ν 2 0 .
Generally, one needs to solve a minimization problem, finding the energy barriers and attempt rates that will reproduce the MD stochastic simulation results. While we further discuss this method of solution, it requires assuming explicit functions for the energy barriers, and at this stage, we would like to avoid this. For this reason, we detail here a different approach, albeit more specific to this problem of two site type nucleation. Using the MD simulation results, we obtained some information on the function P 1 at certain combinations of temperatures T and strains ε ¯ , which can assist us in finding the activation parameters. Therefore, in the approach adopted here, we focus our analysis first on the activation parameters from one nucleation site (the acute angle), using the function P 1 to integrate the information from both site types. To facilitate on the reader, we outline here the steps of the analysis presented in this section: Since we need to find the values of P 1 ’s derivatives based on the MD simulation results, we first propose in Section 3.3.1 an analysis on how to use the MD simulations to find the derivatives. We then use the derivatives to find the nucleation rate from the acute angle and the contribution of the activation entropy in Section 3.3.2. For the latter, we have to employ also the results of the NEB simulations. Finally, the value we find for the rates and the activation entropy pave the way to find the rest of the activation parameters from the acute and obtuse angles, as we detail in Section 3.3.3. While this approach is somewhat specific to this problem, it allows us not to assume the form of the energy function a-priori and to better understand the physical origins of the different activation parameters we find.

3.3.1. Extracting the Values of P 1 and Its Derivatives from the MD Simulation Results

Following the model in Section 3.2, we can express the ε ¯ and ω according to the activation parameters in one of the nucleation sites only (without loss of generality, we choose here the site with the acute angle, numbered as 1). However, the information from the second nucleation site is embedded within the function P 1 , which is also unknown for every strain and temperature. Thus, let us first estimate the function P 1 and its derivatives at the most probable strain ε ¯ . Looking at the definition of P 1 in Equation (4), we can interpret the value of P 1 ( ε ¯ ,   T ) as the probability to nucleate a dislocation at the acute angle at a temperature T . This value was obtained directly from the MD simulation (see Figure 3), and accordingly P 2 ( ε ¯ ,   T ) = 1 P 1 ( ε ¯ ,   T ) . We emphasize that when the probability to nucleate in the obtuse angle is small, as expected at low temperature, the statistics obtains from 30 or 60 simulations might not be sufficient to calculate accurately P 1 ( ε ¯ ,   T ) . Since there is a probability to nucleate a dislocation in obtuse angles at all non-zero temperatures, even if extremely low, we fitted a function P 1 ( ε ¯ ( T ) ,   T ) = 1 2 1 2 · tanh ( A · ln ( T ) B ) , where the best fit was achieved with A = 2.56 and B = 16.1 . The fit is shown in Figure 3. Although this is a fundamental fit, that is aimed at facilitating the analysis, it stems from the fact that nucleation occurs only from the acute angle at T = 0 , and as the temperature is increased, the probability to nucleate dislocation from the acute angle decreases but do not vanish.
The derivatives of P 1 at ε ¯ cannot be obtained directly from the MD simulations. Therefore, let us go back to the definition of P 1 and find its derivatives at ε ¯ . In the case of the nanowire, there is an equal number of nucleation sites on each edge ( N 1 = N 2 = 2 L ( b / 2 ) where b is the Burgers vector). Therefore, the probability function P 1 in Equation (4) takes the form
P 1 = ν 1 0 e β F 1 ν 1 0 e β F 1 + ν 2 0 e β F 2 .
One can show that the partial derivative P 1 , ε of this equation is
P 1 , ε = β ( F 2 , ε F 1 , ε ) P 2 P 1 ,
where we recall that the probability to nucleate in the second site is
P 2 = ν 2 0 e β F 2 ν 1 0 e β F 1 + ν 2 0 e β F 2 .
Deriving Equation (12) again, leads to the second derivative, which can be expressed as
P 1 , ε ε = β ( F 2 , ε ε F 1 , ε ε ) P 2 P 1 + β 2 ( F 2 , ε F 1 , ε ) 2 P 2 P 1 ( P 2 P 1 ) .
In the last relation, we employed the identity P 2 , ε = P 1 , ε , which is satisfied in all strains and temperatures since the sum of the probabilities P i is always equal to 1. As in previous cases, we neglect the second derivatives of F i .
While the values of P 1 ( ε ¯ ,   T ) and P 2 ( ε ¯ ,   T ) are known from the MD simulations, to find the derivatives P 1 , ε ( ε ¯ ,   T ) and P 1 , ε ε ( ε ¯ ,   T ) using Equations (12) and (14), the first derivative of Δ F , ε ( ε ¯ ,   T ) = F 2 , ε F 1 , ε should be calculated. Since Δ F is a function of both strain and temperature, its partial derivative satisfies
Δ F , ε ( ε ¯ ,   T ) = d Δ F d ε ( ε ¯ ,   T ) Δ F , T ( ε ¯ ,   T ) d T d ε ( ε ¯ ,   T )   ,
while we consider the relation between ε ¯ and T ( ε ¯ ) in the full derivative. Let us treat separately each term on the right-hand side (RHS) of the equation. The first term on the RHS can be related to P 1 using Equation (11),
Δ F = 1 β ln ( 1 P 1 1 ) .
In this expression, we assumed that ν 1 0 = ν 2 0 , since the attempt rate are related to the atomic vibrations and are expected to be of similar magnitude in both nucleation site types. We shall further denote the attempt rate as ν 0 . Using the MD simulation results, we plot Δ F ( ε ¯ , T ) as a function of 1− ε ¯ / ε c r , 1 in Figure 6. Since all dislocations were nucleated from the acute angle at temperatures below 200 K, we used the values of the fitted function in Figure 3 at this temperature range, instead of the MD simulation results. We note that while we fitted function for P 1 ( ε ¯ , T ) can be used in Equation (16), it would be easier to fit a polynomial function of the form Δ F ( ε ¯ , T ( ε ¯ ) ) = i = 0 3 B i ( 1 ε ¯ / ε c r , 1 ) 2 i to the results, from which d Δ F d ε ( ε ¯ ,   T ) can be found more easily. The fit yields B 0 = 0.01 10 3   eV , B 1 = 3.81   eV , B 2 = 57.37   eV and B 3 = 123.93   eV . We note that if using the fit of P 1 ( ε ¯ , T ) , the fitted curve using the polynomial function is very close within the examined strain range.
The second term on the RHS of Equation (15) is related to the activation entropy. We shall consider here that the Meyer–Neldel compensation rule [32] applies, i.e., the activation free-energies for nucleation in each site is of the form
F i = Q i ( ε ) ( 1 T T m i ) ,
where Q i is the temperature-independent part of the activation energy for nucleation at the i-th site, and T m i is the surface disorder temperature, which is a characteristic temperature at which the free-energy barrier vanishes for all tensile strains. We assume here that T m 1 = T m 2 is equal in both nucleation sites T m . Under these assumptions, we rewrite Equation (15) is
Δ F , ε ( ε ¯ ,   T ) = d Δ F d ε ( ε ¯ ,   T ) Δ F , T ( ε ¯ ,   T ) d T d ε ( ε ¯ ,   T ) = d Δ F d ε ( ε ¯ ,   T ) + 1 β 1 T m T ln ( 1 P 1 ( ε ¯ ,   T ) 1 ) d T d ε ( ε ¯ ,   T ) ,
where we employed Equations (16) and (17) to express Δ F , T in the second term on the RHS of Equation (15) according to P 1 . The derivative d T d ε ( ε ¯ ,   T ) is calculated from the slope of Figure 5a, using the relation found on Equation (1).
In summary, the derivative of P 1 can be calculated using Equations (12) and (14), where the derivative Δ F , ε is calculated using Equation (18). However, the value of T m is unknown, and we first need to find its value. However, the value of T m cannot be found only based on the MD simulations, and we shall continue considering different values for T m , calculating the function F 1 for different values of T m and finally, find the value that will match NEB calculations. This process is detailed in the next section.

3.3.2. Finding the Value of T m

According to Equation (8), the following relation is satisfied at the most probable nucleation strain
β F 1 , ε = P 1 , ε P 1 ( P 1 , ε P 1 ) 2 P 1 , ε ε P 1 + 1 ω 2 .  
Since the free energy is decreasing with strain, we have chosen the negative solution of the square root. This result can be substituted in Equation (7) and we find that at the most probable nucleation strain
N 1 ν 1 0 ε ˙ P 1 e β F 1 = 1 ω 2 + ( P 1 , ε P 1 ) 2 P 1 , ε ε P 1 .
If we define χ ( ε ¯ ( T ) , T ) = ε ˙ P 1 N 1 · 1 ω 2 + ( P 1 , ε P 1 ) 2 P 1 , ε ε P 1 (the RHS is calculated at ε ¯ and T), then Equation (20) satisfies
ν 1 0 e β F 1 ( ε ¯ , T ) = χ ( ε ¯ , T ) .
While the distribution width is directly calculated from the MD simulations, the values of P 1 and its derivatives can be also calculated, as detailed above, given that the value of T m is known. Since different values for T m manifests themselves in Δ F , ε ( ε ¯ ,   T ) , which in turn results in different values for the derivatives of P 1 , we choose different values for T m and calculate the values of χ ( ε ¯ , T ) for each T m . In Figure 7, we plot the value of ln χ as a function of 1 ε / ε cr 1 for two different values of T m . As one can see, the difference between the different values of T m is not substantial and the contribution of ω to the values of χ is predominant.
At T = 0 , a dislocation will nucleate only if the spontaneous strain for nucleation is reached, i.e., ε ¯ = ε c r , 1 , which occurs only if the free-energy barrier vanishes F 1 ( ε ¯ ( 0 ) , T = 0 ) = 0, regardless of the value of T m . Thus, according to Equation (21), the value at which the curve crosses the axis T = 0 corresponds to ln ν 1 0 . Indeed, the difference in the plots for different values of T m in Figure 7 diminishes for small values of ( 1 ε / ε cr 1 ). Since the values of χ at the lower temperatures are weakly affected by the choice of T m , we found ν 1 0 to be equal to 1.05 · 10 9   sec 1 by extrapolating the results for T m , using a relation of the form ln ( χ / ν 1 0 ) ( 1 ε / ε cr 1 ) 2 . An example for the fitted relation found for T m is shown in Figure 7. The range of values found for ν 1 0 is slightly lower than values found for dislocation nucleation in other systems [31].
Using the fitted value for the attempt rate, we can now use Equation (20) to find the values of F 1 ( ε ¯ , T ) at each temperature for different values of T m . In Figure 8 we plot Q 1 . Since the effect of T m on the value of χ was not substantial, the values of Q 1 found for smaller values T m are larger. To find the value of T m we performed also NEB simulations for the nucleation of dislocations from the acute angle. In Supplementary Figure S1 we plot the barriers found using NEB at various strains. For tensile strain above 4%, the energy barrier was of the order of a few fractions of eV, which limits the accuracy of the NEB simulations due to the accuracy needed in the number of replicas. Therefore, we limited ourselves in the NEB simulations to tensile strains below 4%, which are below the range of the most probable strains calculated in the MD simulations. We recall that the NEB simulations find the minimum potential energy path, hence it corresponds to Q 1 . Therefore, the results of the NEB simulations are plotted also in Figure 8. As one can see, surprisingly, the values of Q 1 calculated indirectly from the MD simulations exceeds the values of Q 1 found using NEB simulations for small values of T m . More profoundly, it is when the activation entropy is found to be negligible ( T m ) that the values of Q 1 obtained using both methods match continuously. Therefore, in what follows, we shall consider T m and further calculate the free energy barriers for nucleation in both sites, neglecting the contribution of the activation entropy.

3.3.3. Finding the Free-Energy Barriers

Since we can neglect the activation entropy, F 1 is a function of the strain only, i.e., F 1 = Q 1 . Accordingly, the values plotted in Figure 9 for Q 1 ( ε ¯ ) as a function of ε ¯ are also the values of the free-energy barrier. Therefore, we can fit a function Q 1 ( ε ) for the results, to find the dependence of the free-energy barrier on the strain. In previous studies, a power law was argued to fit the activation energy near the spontaneous nucleation threshold. Thus, we fit a function of the form
Q 1 ( ε ) = Q 1 0 ( 1 ε ε c r 1 ) α 1 ,
where Q 1 0 and α 1 are fitting parameters. The best fit to all the results obtained both indirectly from the MD simulations and the NEB simulations is obtained with Q 1 0 = 18.44   eV and α 1 = 4.20 (shown in Figure 9).
We can now address the activation parameters in the obtuse angle (site type number 2). Based on Equation (16), the difference in the activation energies corresponds to the nucleation probabilities from each site. We assume that the activation entropy is negligible also in the obtuse angle site, i.e., F 2 ( ε , T ) = Q 2 ( ε ) . Therefore, we can directly find the energy barrier in the obtuse angle based on the parameters found previously
Q 2 ( ε ) = Q 1 ( ε ) k T ln ( 1 P 1 1 ) .  
In Figure 9, we plot the values of Q 2 ( ε ) also as a function of ε . As can be seen, the values of Q 2 are larger than zero at ε c r 1 , since at low temperatures nucleation from the acute angle prevails. At lower strains, the activation energy in the acute angle exceeds that of the obtuse angle, explaining the transition towards nucleation in the latter at higher temperatures. We fit a similar power-law, as in Equation (22), with the exception that the value for spontaneous nucleation strain in the obtuse angle ε c r 2 cannot be found directly and is considered as a fitting parameter. However, fitting both Q 2 0 ,   α 2   and   ε c r 2 based on the few values obtained using Equation (23) leads to large uncertainties, and there is a relatively large range of values for Q 2 0 ,   α 2   and   ε c r 2 that yield a good fit to the MD simulation results in Figure 9. Therefore, to determine the best values for the free energy barrier for nucleation from the obtuse angle, the following procedure was adopted. We chose different values of ε c r 2 and for each value of ε c r 2 we fitted values for Q 2 0 and α 2 . Given that the energy barrier is of the form of Equation (22), the integral in Equation (6) can be calculated analytically, and for each value of ε c r 2 the CDF is calculated analytically,
Φ ( ε   , T ) = 1 i = 1 M exp { N i ν i 0 ε c r i α i ε ˙ ( Q i 0 k B T ) 1 α i [   Γ u ( 1 α i , Q i 0 k B T ( 1 ε ε c r i ) α i ) Γ u ( 1 α i , Q i 0 k B T ) ] } ,  
where Γ u is the upper gamma function. Then, we calculated the PDF as a function of the temperature and the strain using a numerical derivative of the CDF, for each set of ε c r 2 , Q 2 0 and α 2 , from which we found the most probable nucleation strain as a function of the temperature. A value of ε c r 2 = 8.6 % was found to yield the best comparison between the calculated values of ε ¯ ( T ) using Equation (6) and the MD simulation results. The corresponding parameters of the activation energy are Q 2 0 = 0.80   eV and α 2 = 2.15 . The fitted result of the energy barrier for nucleation from the obtuse site is shown in Figure 9.
We plot the PDF based on the activation energy functions found for each site and the nucleation rates in Figure 10a, in addition to all the nucleation strains obtained from the MD simulations. As one can see, the calculated distribution is in good comparison with the distributions found in the MD simulations.

4. Discussion

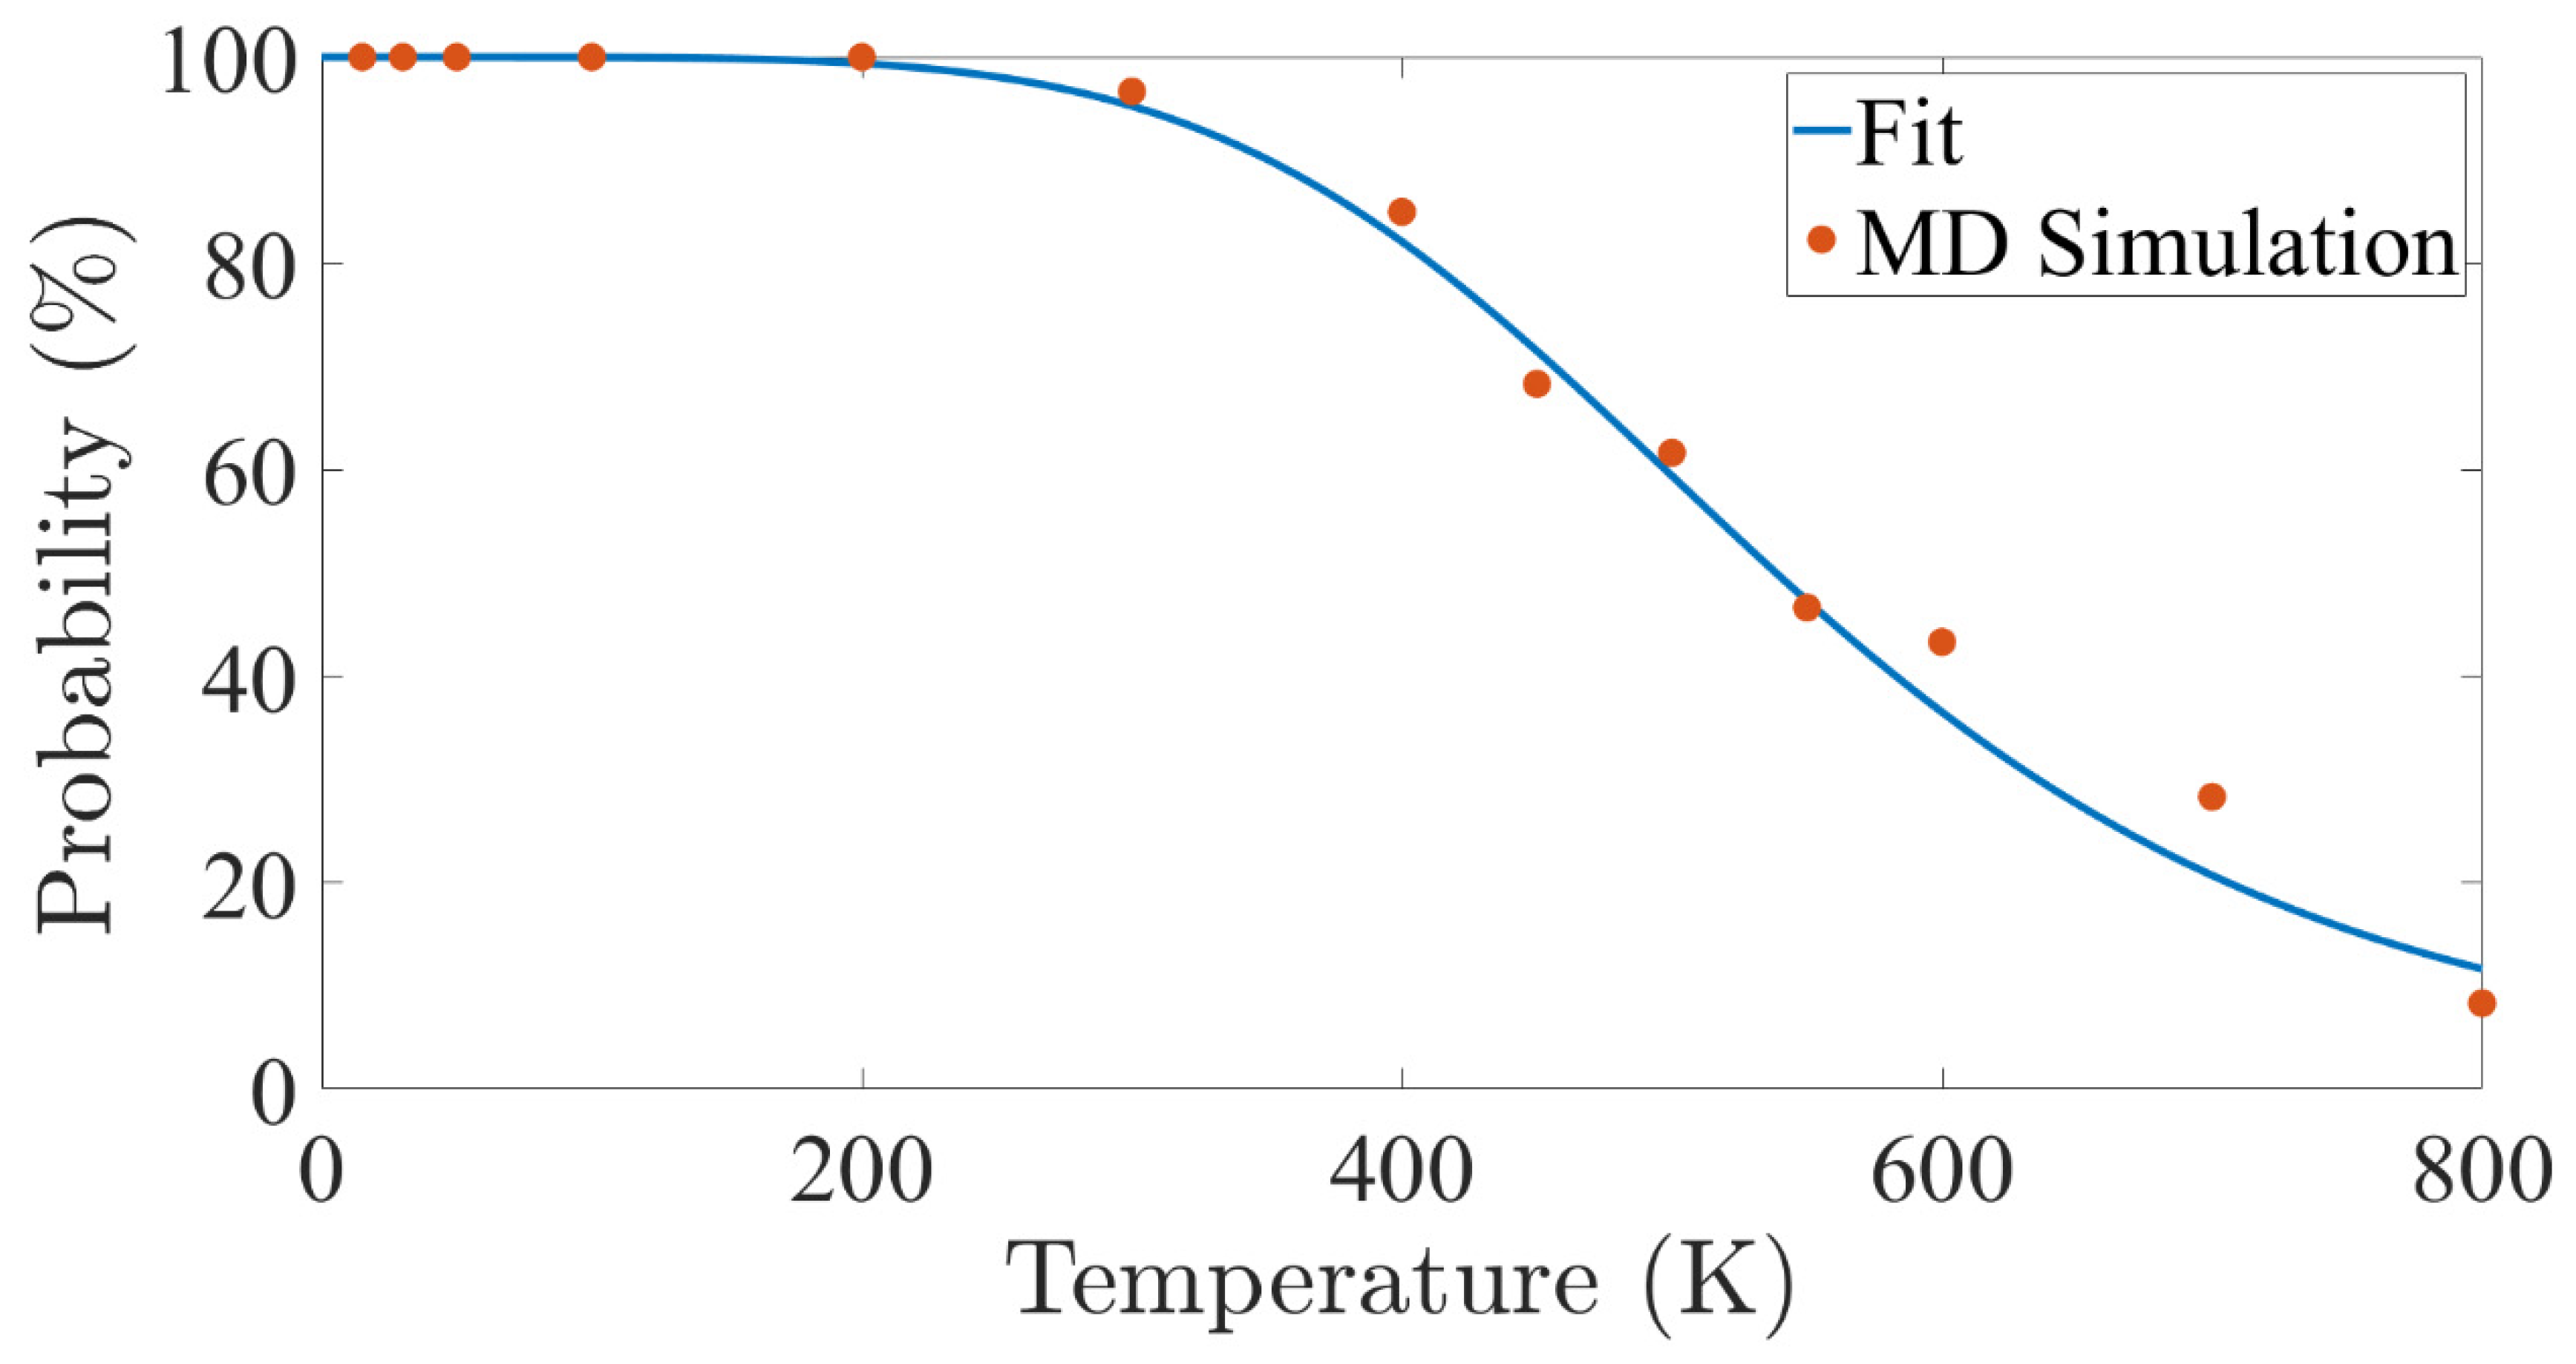
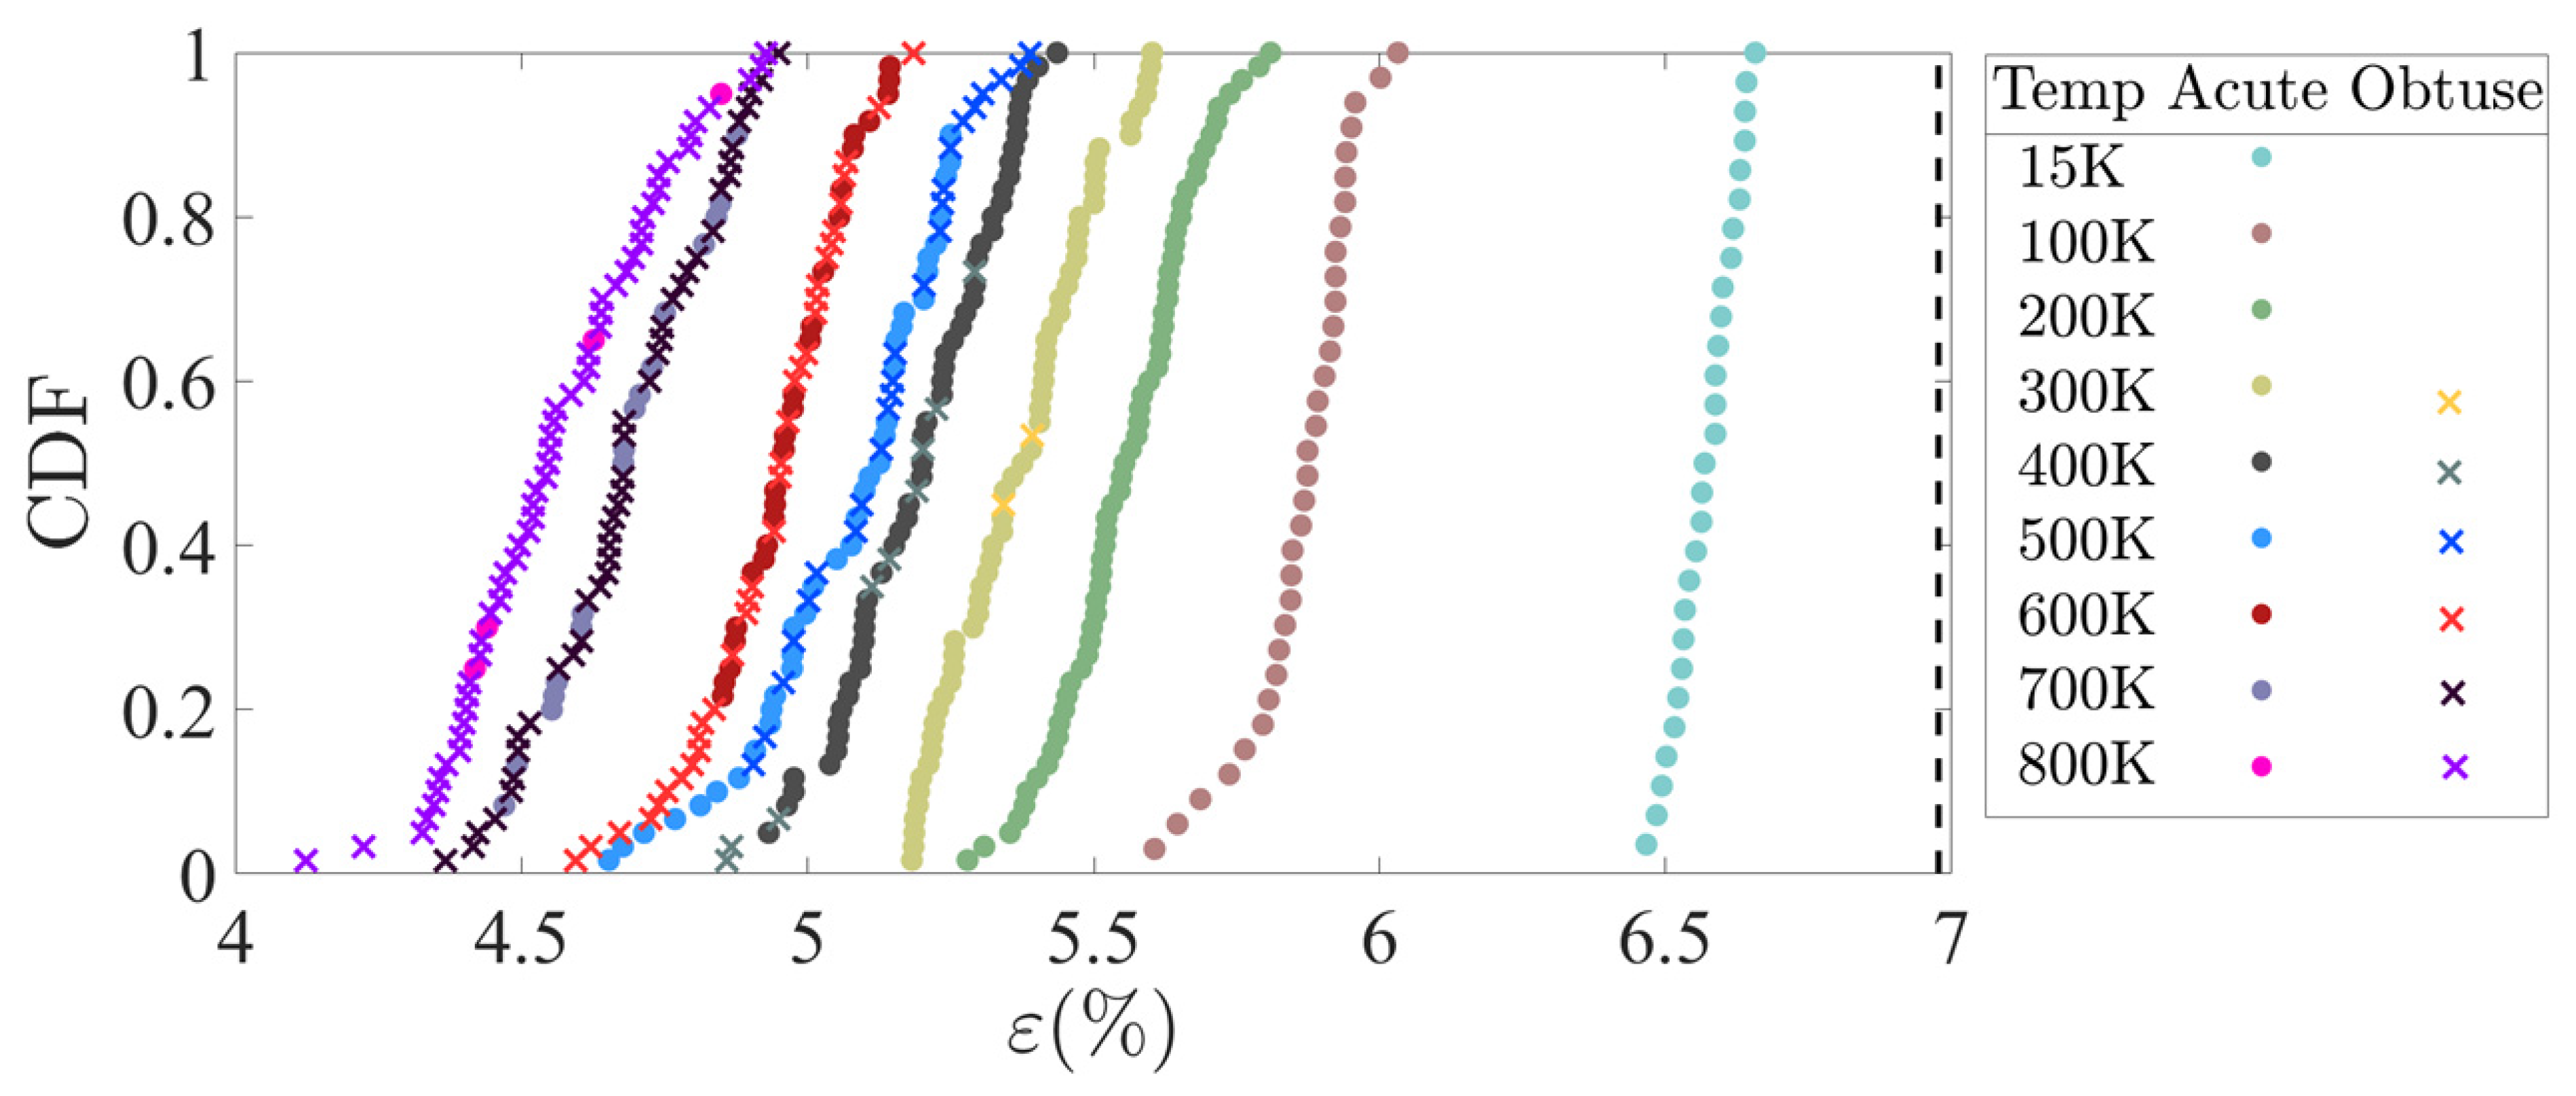
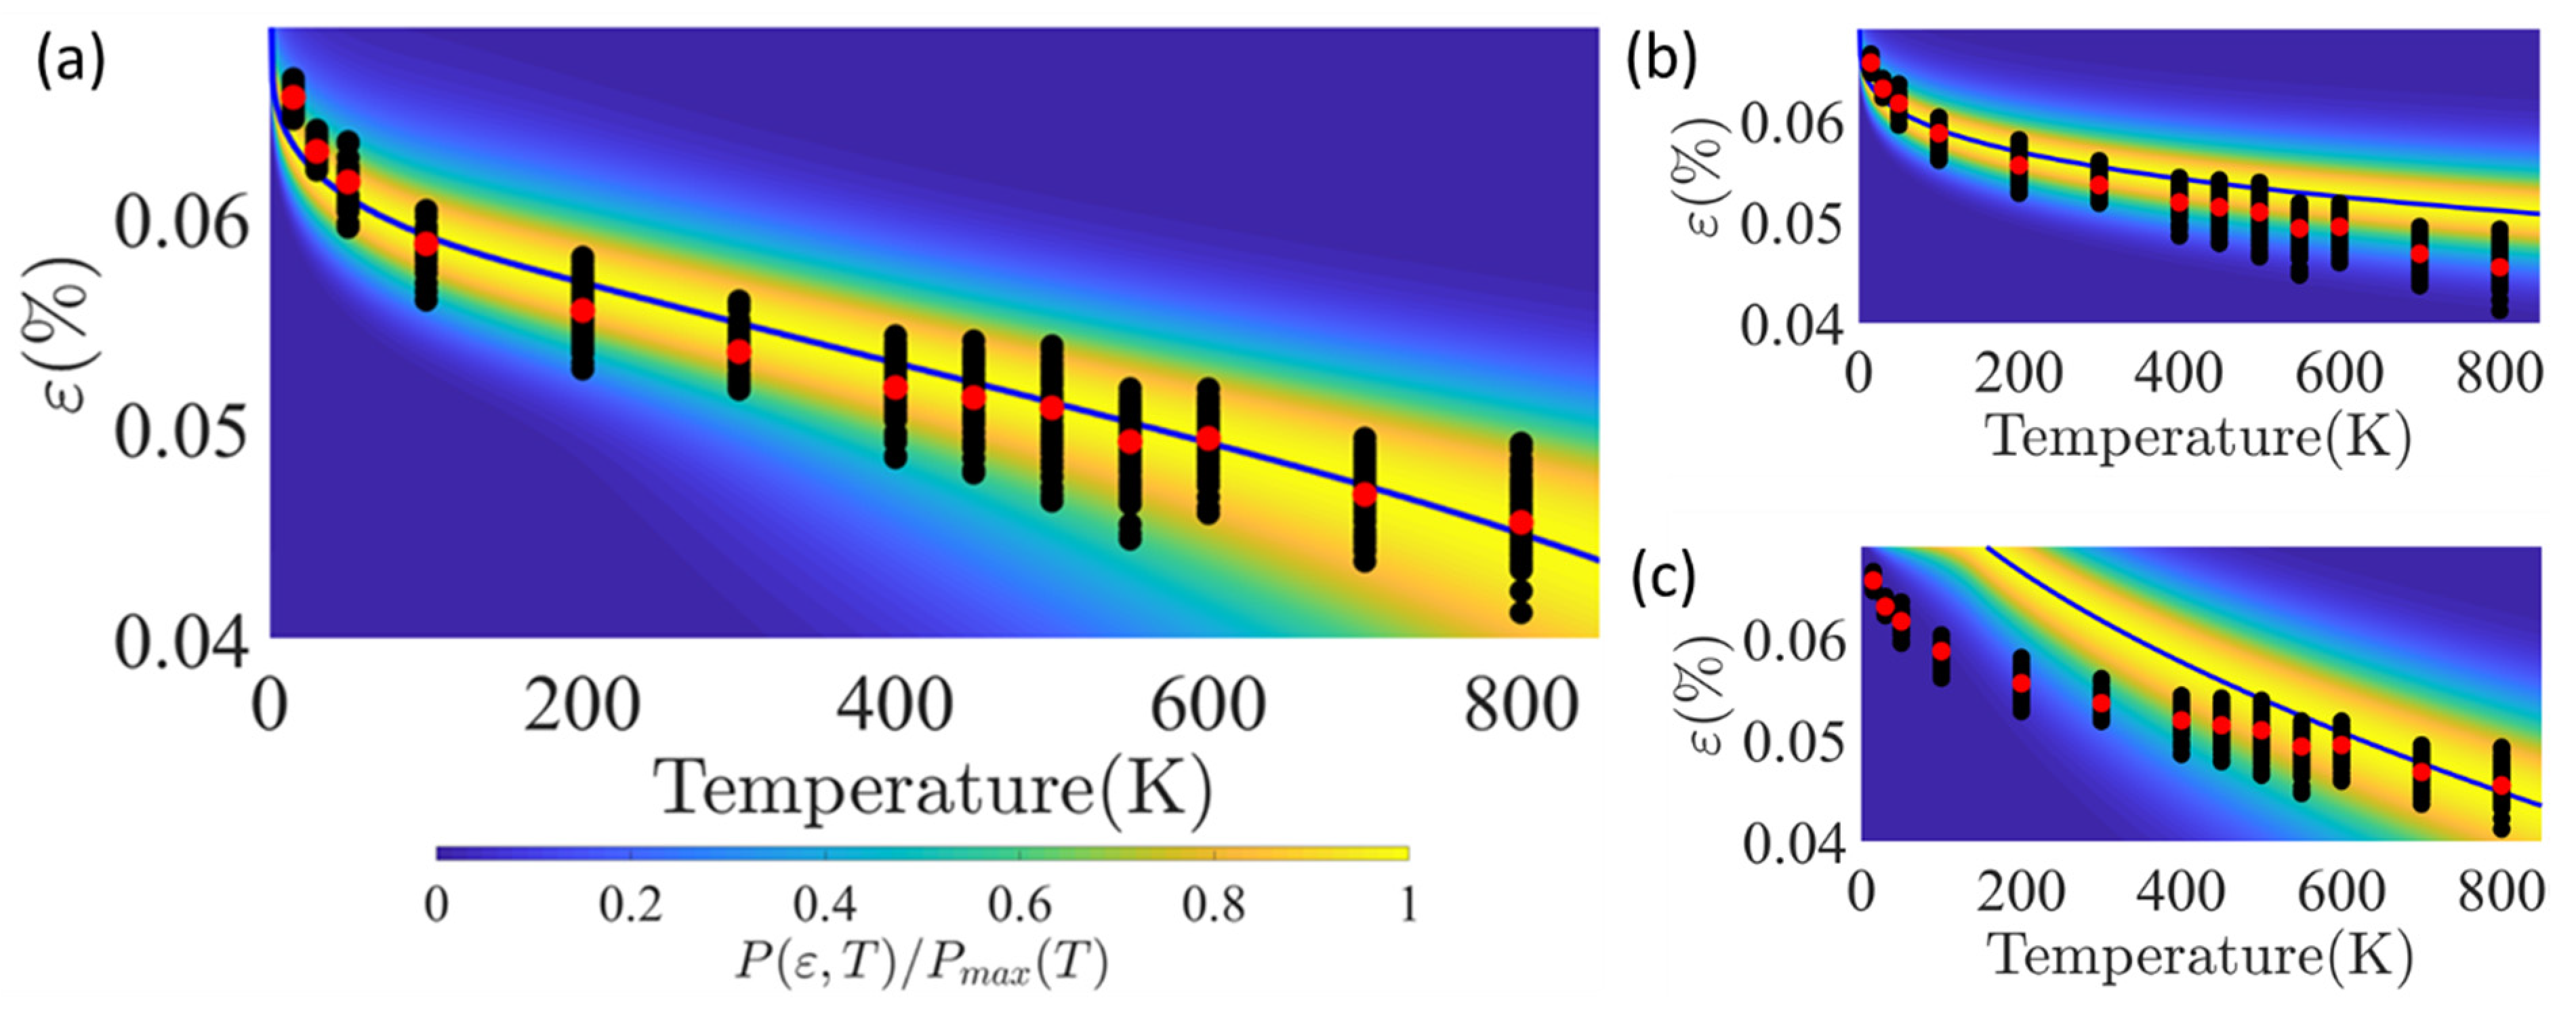
4.1. The Most Probable Strain as a Function of Temperature for Multiple Nucleation Site Types

Based on the analytical solution of the PDF, the most probable nucleation strain as a function of temperature is plotted in Figure 10a (blue line). As in the MD simulations, there is an inflection point when plotting the most probable nucleation strain as a function of temperature, around 550K, which is the temperature above which nucleation from the obtuse angle is more favorable. The calibrated model for the two-type sites allows us to explore in more depth the contribution of each site type to the probabilistic behavior of the nucleation strain, with which we can examine in more depth the change in slope in the plot of ε ¯ ( T ) .
In Figure 10b,c, we plot the PDF obtained when considering only one site type is active, i.e., n 2 = 0 or n 1 = 0 , respectively. When only nucleation from the acute angle is allowed, one can see that at the low temperatures, the calculation follows nicely the MD simulation results. This is not surprising, since at the low temperatures the energy barrier for nucleation at these sites is much more favorable than from the obtuse angle. However, as the temperature rise, if considering nucleation from the acute angle only, the most probable nucleation strains predicted are higher than the ones obtained from the MD simulations. Moreover, the most probable nucleation strain as a function of temperature has no inflection point.
When allowing nucleation only from the obtuse angle (Figure 10c), a stronger dependency on the temperature is found, since the energy barriers found here are lower. In particular, the value found for Q 0 2 are an order of magnitude smaller than the value of Q 0 1 . Since ε c r 2 > ε c r 1 , the PDF in Figure 10c can be calculated up to the ε c r 2 . However, when considering both sites, at T = 0 the strains will be limited by ε c r 1 we truncate the plot at ε c r 1 . As in the previous case, the function of the most probable nucleation strain as a function of temperature has no inflection point, and the values reached higher temperatures are lower than the ones found in the MD simulations.
It is worth noting that the most probable nucleation strain when considering only one of the types may be different for each site type. For instance, if we denote by ε ¯ i the most probable nucleation strain when only the i -th site is active, we find that in ε ¯ 1 ( 400 K ) = 5.42% for nucleation in the acute angle, which is lower than the value of ε ¯ 2 ( 400 K ) = 5.76% when considering nucleation only from the obtuse angle. However, when considering both site types together, the most probable nucleation strain is ε ¯ ( 400 K ) = 5.30%, which leans towards the value of the acute angle. This highlights the difference when considering each site alone and when allowing several site types acting together, and more precisely, the difference between the ε ¯ i and ε ^ i . Let us consider the case in which nucleation from one site type is more favorable than from the other site types (without loss of generality, we mark the favorable site type as site number k ). In this case, P k is close to 1 and ε ¯ k is also noticeably lower than ε ¯ i for all the other site types. As a result, most of the nucleation events will be from k-th site type and the nucleation strains will distribute around the value of ε ¯ k ( ε ¯ ε ¯ k ). However, nucleation from other site types is still possible, but since the most probable nucleation strain of the other site types is noticeably higher in this case, most of the nucleation events that will be collected during the simulations/experiments will be from the tails of the distribution that are close to ε ¯ k . Consequently, the few results for the nucleation strains from other site types are not distributed around ε ¯ i , i.e., ε ^ i is close to ε ¯ k for i k rather than close to ε ¯ i . As an example, we return to the MD simulation results. At 400K, out of the sixty simulations, in nine cases nucleation occurred at the obtuse angle, at nucleation strains between 4.77% and 5.20%. These values are not close to ε ¯ 2 predicted from our model but rather close to the values of ε ¯ = 5.19 % presented in Figure 4. On the other hand, as shown in Figure 4, when nucleation from the obtuse is substantially more favorable, the values of the nucleation from the acute angle are close to ε ¯ . Thus, one should pay notice that the data on the nucleation strains collected from unfavorable nucleation sites are only part of the distribution at the tails which are close to the value of ε ¯ k at the favorable site type.
These findings demonstrate some of the characteristics of the PDF when there is more than one possible nucleation site type. Although the most probable nucleation strain from each site type alone may be different, the total PDF will eventually be distributed around a certain value, which depends on the probabilities to nucleate from each site type. Since there are different dependencies of ε ¯ i on the temperature, there is an inflection point in ε ¯ ( T ) , at the temperature range that corresponds to the temperature in which the probability to nucleate at both site types is equal. We note that this inflection in the plot is different than the inflection demonstrated previously using a single nucleation site type, when the activation entropy is not neglected [30], in which at higher temperatures the effect of the activation entropy is more pronounced. However, as we shown here, in the case studied here using the MD simulations we do not find a significant contribution of the activation entropy, leading us to suggest that it is the combination of nucleation sites that generate a change in the tendencies above a certain temperature. A further study on why the activation entropy is negligible in our simulations is planned in the future.

4.2. The Exponents near the Critical Nucleation Strain

We found the exponents to be α 1 = 4.20 and α 2 = 2.15 . These values are different than the value of 1.5 suggested previously by Chachamovitz and Mordehai [33], and, the value in the acute angle is close to the values considered by Chen et al. [18]. Although we considered a rhombic cross-section, which is different than the hexagonal cross-section discussed by Chen et al., the temperature range in the experiments did not exceed 500K, which is the range of temperatures in which nucleation is favorable from the acute angle. Therefore, we suggest that despite the differences between the simulations and the experiments, the high values for the exponents found in the MD simulations match the experimental observation.
One possible reason for the relatively high exponent is the non-linear elastic behavior. To understand the reason why the non-linear response leads to a different exponent, let us first explain the universality of the 1.5 exponent proposed previously, as was commented by Cottrell for the energy barriers near bifurcation points [46]. The energy barrier without applied stress is approximated to a double-well potential along a reaction coordinate that corresponds to the embryonic dislocation loop radius (a 4-th order polynomial function). When an external force is applied, the work done by the external stress is linear with the loop radius, hence, it adds a linear term to the double well function, and at the critical stress, the energy function becomes monotonically decreasing. If estimating the energy barrier at stress is slightly lower than the critical stress, they are found to change with the stress with an exponent of 1.5.
In the MD simulations, it is the strain that is controlled, rather than the stress. If the relationship was linear, then similar arguments to the ones proposed by Cottrell could have been made with the strain. However, since the stress-strain relation is not linear, the work done by the external load is not linear with the strain, which will lead to a different exponent than the universal factor of 1.5 found by Cottrell.
Moreover, the decrease in the slope in the stress-strain curve tends to increase the exponent. To explain this, let us examine qualitatively how the slope of the stress-strain curve is affecting the nucleation at strains close to ε c r , 1 . Suppose that the stress reached the critical nucleation strain is σ c r , 1 . Then, the stronger is the decrease in the slope of the stress-strain curves, the less sensitive is the stress to variations in the strain. Therefore, if we examine the strain at which a certain stress σ is reached which is slightly below the critical stress ( σ c r , 1 σ σ c r , 1 ), the higher is the degree of non-linearity in the stress-strain curve near the critical strain/stress, the lower is the strain at which this stress is reached. Thus, even if the energy barrier decreases with the stress as a power-law with an exponent of 1.5, the non-linear stress-strain relation results in a higher sensitivity of the energy barrier to strains near the critical strain, i.e., higher exponents.
To examine if this was also the reason for the different exponents found for the two different sites in the MD simulation, we examined the non-linearity of the stress-strain curves at various temperatures. In particular, at the lowest and highest temperatures which correspond to preferential nucleation from the obtuse and acute angles, respectively. We considered a non-linear quadratic elastic relationship, as was done experimentally by Chen et al. for Pd nanowires [27],
σ = E ε + D ε 2 ,
where E and D are the second (Young’s) and third-order elastic moduli, respectively. The values of E and D at various temperatures, as was found from fitting to the stress-strain curves obtained from the MD simulations, are shown in Figure 11. The range of values is comparable to the values found experimentally by Chen et al. [27]. Moreover, one can see that at the lowest temperature, in which nucleation from the acute angle prevails, the ratio D / E is equal to 7.34 , whereas, at the highest temperature, in which nucleation from the obtuse angle is favorable, the ratio decreases to 1.16. In summary, we suggest that the non-linear stress-strain relation has led to two exponents α 1 and α 2 which are greater than 1.5, but the decrease in the degree of the non-linearity in the stress-strain curves manifests itself in the lower values of the latter.

4.3. The Activation Entropy

We have found the activation entropy to be negligible. However, one can define the activation entropy using the activation Gibbs or the Helmholtz free energy, if the stress or the strain is controlled, respectively. Suppose that the stress is controlled, and the resolved shear stress on the nucleation plane is τ . Then the activation entropy in the stress-controlled case is S σ ( τ , T ) = G ( τ , T ) T . Alternatively, if the strain is controlled and the shear strain is γ , then the definition of the activation entropy is S ε ( γ , T ) = F ( γ , T ) T . An extended discussion on the difference between the two definitions was made by Ryu et al. [30]. They have shown that if the volume is large enough with respect to the activation volume for nucleation (which is the case here) then the relation between the two activation entropies is
S σ ( τ , T ) = S ε ( γ , T ) + G ( τ , T ) τ   τ T | γ .
The second term on the RHS depends on the activation volume (defined as G ( τ , T ) τ ) and the thermal softening of the elastic constants, and it is positive in our case, i.e., S σ ( τ , T ) > S ε ( γ , T ) .
The difference between the two definitions may be substantial. Although Equation (26) refers to the shear stress and strain on the nucleation slip plane, let us use the tensile stress and strain instead, which are expected to yield similar orders of magnitudes. Although it was not calculated directly here, the activation volumes for nucleation from the edges of Cu nanowires were found to be of the order of 1 10 b 3 [29] and we adopt these typical values to our study as well. The thermal softening, based on Equation (25), depends on the temperature dependence of the E and D . Based on Figure 11, D is rather independent of the temperature above 200 K, and we consider only the dependence of E on the temperature. According to Figure 11, σ T | ε 60 ε   MPa   K 1 . Considering strain of 5%, we find the difference S σ ( τ , T ) S ε ( γ , T ) to be between 5   k B and 50   k B . Such large differences were obtained also using Umbrella sampling by Ryu et al. [30] for dislocation nucleation in Cu (both homogenous and on the surface of nanowires). They found that when controlling the strain, the activation entropies were of the order of a few k B ’s, whereas when controlling the stress, the activation entropies were an order of magnitude larger. This difference manifests itself in the values of T m obtained using strain control, which was almost twice the melting temperature of Cu, similarly to the large values found in this work.

4.4. Generalization of the Fitting Process

In this work, we implemented the model on a two-site type system. In this case, since we also had access to the probability of nucleation from each site, we choose to use Equations (7) and (8), which focus only on one of the sites, where all the information on the other sites was embedded in P 1 . However, in cases where information on P 1 is not accessible, a general minimization problem can be solved, given that some assumptions are made on the free activation energy functions.
To apply the minimization problem, one should make some additional a-priori assumptions on the free-energy functions. For instance, we have shown that in the case of the Pd nanowires the zero-temperature energy barrier is of the form of Equation (22) and the activation entropy is negligible. However, if one postulates such a function for the free-energy barrier in advance, without any prior knowledge on the activation entropy, the parameters of the energy functions can be fitted numerically to the nucleation strain distribution. In the case examined here, for example, if we assume that T m and ν 0 are equal for both sites, we have seven parameters to fit: Q 1 0 , Q 2 0 ,   α 1 , α 2 , ε c r , 2 ,   T m and ν 0 . The parameters can be fitted to the 13 values found for ε ¯ and ω at various temperatures using Equations (9) and (10). If we define at each temperature T examined in the MD simulations, the functions
ζ ( T ) = 1 ε ˙ ( i = 1 M N i v i ( ε ¯ , T ) ) 2 + β i = 1 M N i v i ( ε ¯ , T ) F i , ε ( ε ¯ , T ) ,
ξ ( T ) = i = 1 M N i v i ( ε ¯ , T ) ω 2 ( ε ¯   , T ) i = 1 M N i v i ( ε ¯ , T ) ( β F i , ε ( ε ¯ , T ) ) 2 ,
we need to find the parameters that minimize that target function f ( Q 1 0 , Q 2 0 ,   α 1 , α 2 , ε c r , 2 ,   T m , ν 0 ) = ( ζ 2 + ξ 2 ) , where the sum is over all temperatures examined in the MD simulation. Such an approach is a general one and can be extended to multiple site types.
Solving the minimization problem has the advantage that it is not limited to two site types and it does not require the knowledge of the function P 1 . Therefore, it can be applied to more than two site types and to cases where the relative number of nucleation events from each site is unknown, e.g., in experiments. However, the main disadvantage of this method is that it requires an assumption on the functional form of the free-energy barrier. We have found here that a power law fits well with MD simulation results. Nonetheless, some consider other phenomenological functional forms for the free energy barrier, e.g., a more complex power law in [31] or an exponential function [21]. Therefore, the accuracy of the solution may depend on the correctness of the choice for the energy barrier function.

5. Conclusions

The main objective of this manuscript is to calculate the strength in nucleation-controlled plasticity when there are multiple types of nucleation sites. This objective was tackled theoretically by generalizing a model for the strength of nanospecimens with numerous types of nucleation sites. The model was demonstrated by analyzing MD simulation results of the strength distribution of Pd nanowires with a rhombic cross-section. One surprising outcome of the MD simulations is that nucleation does not occur only from the edge with the obtuse angle, as was thought until now, but nucleation is probable from all edges of the nanowire, as a function of the temperature. Even for this simple case, with two nucleation site types, the different activation energy functions to nucleate from each site, was shown to lead to differences in the dependency of the nucleation strain on the temperature. The transition between the two dependencies was observed in the simulations around 550K, which is above the highest temperature tested in experiments [18].
The model is not limited to MD simulation results, as was performed in this work, and can be employed with other techniques that find the free-energy barrier at the possible nucleation site types. This model can be applied to solve more realistic cases, to examine the effect of homogeneity of the surface on the distribution. For instance, surface roughness introduces a distribution of nucleation sites, which differs in the conditions to nucleate dislocations and in the strength distributions [47]. The model presented here can improve the analysis of the probabilistic strength of realistic nano-specimens, in which rough surfaces are more realistic. The model is not limited to nucleation of dislocations but can be applied to other nucleation phenomena, e.g., to plasticity events in glasses [48].

Supplementary Materials

The following supporting information can be downloaded at: https://www.mdpi.com/article/10.3390/met12020280/s1, Figure S1: The energy along the minimum energy path between a pristine nanowire and a final state with a dislocation nucleated from the acute angle.

Author Contributions

Data curation, S.N.; Formal analysis, S.N. and D.M.; Funding acquisition, D.M.; Investigation, S.N. and D.M.; Methodology, S.N. and D.M.; Project administration, D.M.; Supervision, D.M.; Validation, S.N.; Visualization, S.N.; Writing—original draft, S.N.; Writing—review & editing, S.N. and D.M. All authors have read and agreed to the published version of the manuscript.

Funding

This research was supported by the Israel Science Foundation (Grant no. 1521/16).

Institutional Review Board Statement

Not applicable.

Data Availability Statement

The data presented in this study are available on request from the corresponding author.

Acknowledgments

D.M wishes to thank David Rodney for fruitful discussions and comments on the nucleation model.

Conflicts of Interest

The authors declare no conflict of interest.

Appendix A

We can now follow a similar analysis to the one performed in [33], to find the most probable strain for nucleation ε ¯ at a temperature T . We first derive the CDF according to the strain, finding the probability density function (PDF),
Φ , ε ( ε   , T ) = exp [ N 1 ν 1 0 ε ˙ 0 ε 1 P 1 ( η , T ) e β F 1 ( η , T ) d η ] N 1 ν 1 0 ε ˙ P 1 e β F 1 .
The PDF reaches a maximum at the most probable nucleation strain ε ¯ ( T ) . Therefore, if we derive the PDF function according to the strain,
Φ , ε ε ( ε   , T ) = N 1 ν 1 0 ε ˙ P 1 e β F 1   exp [ N 1 ν 1 0 ε ˙ 0 ε 1 P 1 ( η , T ) e β F 1 ( η , T ) d η ] ( N 1 ν 1 0 ε ˙ P 1 e β F 1 + P 1 , ε P 1 + β F 1 , ε ) = Φ , ε ε ( ε   , T ) ( N 1 ν 1 0 ε ˙ P 1 e β F 1 + P 1 , ε P 1 + β F 1 , ε )
and then demand that at the most probable nucleation strain Φ , ε ε ( ε ¯   , T ) = 0 , we find the relation for ε ¯ in Equation (7).
In [33], it was shown that in the case of one site type nucleation model, when plotting the CDF as a function of the tensile stress, the standard deviation of the CDF function corresponds to the activation volume. The latter is defined as minus the derivative of the free-energy barrier with respect to stress. We wish to find a similar relation here, when plotting the CDF as a function of the tensile strain in the multiple site type nucleation model. For this, we derive Equation (A2) again and find its value at ε ¯ ,
Φ , ε ε ε ( ε ¯   , T ) Φ , ε ( ε ¯   , T ) · ( ( β F 1 , ε ( ε ¯   , T ) ) 2 + 2 P 1 , ε ( ε ¯   , T ) P 1 ( ε ¯   , T ) β F 1 , ε ( ε ¯   , T ) + P 1 , ε ε ( ε ¯   , T ) P 1 ( ε ¯   , T ) ) .  
The result is expressed using the value of the PDF at ε ¯ . Additionally, as in [33], we neglect the contribution of F 1 , ε ε . The PDF near ε ¯ can be then expressed as Taylor series expansion around ε ¯ . since the PDF is maximal at ε ¯ , the first derivative of the PDF nullifies and the first significant contribution is the second derivate of the PDF,
Φ , ε ( ε   , T ) Φ , ε ( ε ¯   , T ) + 1 2 Φ , ε ε ε ( ε ¯   , T ) ( ε ε ¯ ) 2   .
Given that the distribution of nucleation strains around ε ¯ behaves like a normal distribution with a standard deviation of ω , as in [33], the PDF near ε ¯ is of the form Φ , ε ( ε   , T ) A e ( ε ε ¯ ) 2 2 ω 2 , where A is a normalization factor. Making a Taylor series expansion of the Gaussian around ε ¯ and comparing the components with those in Equation (A4), we find that
A = Φ , ε ( ε ¯   , T ) ,
A 2 ω 2 = 1 2 Φ , ε ( ε ¯   , T ) · ( ( β F 1 , ε ( ε ¯   , T ) ) 2 + 2 P 1 , ε ( ε ¯   , T ) P 1 ( ε ¯   , T ) β F 1 , ε ( ε ¯   , T ) + P 1 , ε ε ( ε ¯   , T ) P 1 ( ε ¯   , T ) ) .
Using Equations (A5a) and (A5b) we find the distribution width (defined as the standard deviation of the distribution), as expressed in Equation (8).

References

  1. Wu, B.; Heidelberg, A.; Boland, J. Mechanical properties of ultrahigh-strength gold nanowires. Nat. Mater. 2005, 4, 525–529. [Google Scholar] [CrossRef]
  2. Bin Wu, B.; Heidelberg, A.A.; Boland, J.J.; Sader, J.E.; Sun, X.; Li, Y. Microstructure-hardened silver nanowires. Nano Lett. 2006, 6, 468–472. [Google Scholar] [CrossRef]
  3. Richter, G.; Hillerich, K.; Gianola, D.S.; Mönig, R.; Kraft, O.; Volkert, C.A. Ultrahigh strength single crystalline nanowhiskers grown by physical vapor deposition. Nano Lett. 2009, 9, 3048–3052. [Google Scholar] [CrossRef] [PubMed] [Green Version]
  4. Wang, J.; Mao, S.X. Atomistic perspective on in situ nanomechanics. Extreme Mech. Lett. 2016, 8, 127–139. [Google Scholar] [CrossRef] [Green Version]
  5. Wang, Y.-J.; Gao, G.-J.J.; Ogata, S. Size-dependent transition of deformation mechanism, and nonlinear elasticity in Ni3Al nanowires. Appl. Phys. Lett. 2013, 102, 041902. [Google Scholar] [CrossRef]
  6. Mordehai, D.; David, O.; Kositski, R. Nucleation-controlled plasticity of metallic nanowires and nanoparticles. Adv. Mater. 2018, 30, 1706710. [Google Scholar] [CrossRef] [PubMed]
  7. Schuh, C.A.; Mason, J.; Lund, A.C. Quantitative insight into dislocation nucleation from high-temperature nanoindentation experiments. Nat. Mater. 2005, 4, 617–621. [Google Scholar] [CrossRef]
  8. Mason, J.; Lund, A.C.; Schuh, C.A. Determining the activation energy and volume for the onset of plasticity during nanoindentation. Phys. Rev. B 2006, 73, 054102. [Google Scholar] [CrossRef]
  9. Mordehai, D.; Lee, S.-W.; Backes, B.; Srolovitz, D.J.; Nix, W.D.; Rabkin, E. Size effect in compression of single-crystal gold microparticles. Acta Mater. 2011, 59, 5202–5215. [Google Scholar] [CrossRef]
  10. Issa, I.; Amodeo, J.; Réthoré, J.; Joly-Pottuz, L.; Esnouf, C.; Morthomas, J.; Perez, M.; Chevalier, J.; Masenelli-Varlot, K. In situ investigation of MgO nanocube deformation at room temperature. Acta Mater. 2015, 86, 295–304. [Google Scholar] [CrossRef]
  11. Kositski, R.; Kovalenko, O.; Lee, S.-W.; Greer, J.R.; Rabkin, E.; Mordehai, D. Cross-split of dislocations: An athermal and rapid plasticity mechanism. Sci. Rep. 2016, 6, 25966. [Google Scholar] [CrossRef] [PubMed]
  12. Sharma, A.; Hickman, J.; Gazit, N.; Rabkin, E.; Mishin, Y. Nickel nanoparticles set a new record of strength. Nat. Commun. 2018, 9, 4102. [Google Scholar] [CrossRef] [PubMed]
  13. Sharma, A.; Kositski, R.; Kovalenko, O.; Mordehai, D.; Rabkin, E. Giant shape- and size-dependent compressive strength of molybdenum nano- and microparticles. Acta Mater. 2020, 198, 72–84. [Google Scholar] [CrossRef]
  14. Sedlmayr, A.; Bitzek, E.; Gianola, D.S.; Richter, G.; Mönig, R.; Kraft, O. Existence of two twinning-mediated plastic deformation modes in Au nanowhiskers. Acta Mater. 2012, 60, 3985–3993. [Google Scholar] [CrossRef]
  15. Weinberger, C.R.; Cai, W. Plasticity of metal nanowires. J. Mater. Chem. 2012, 22, 3277–3292. [Google Scholar] [CrossRef]
  16. Seo, J.-H.; Park, H.S.; Yoo, Y.; Seong, T.-Y.; Li, J.; Ahn, J.-P.; Kim, B.; Choi, I.-S. Origin of size dependency in coherent-twin-propagation-mediated tensile deformation of noble metal nanowires. Nano Lett. 2013, 13, 5112–5116. [Google Scholar] [CrossRef]
  17. Seo, J.-H.; Yoo, Y.; Park, N.-Y.; Yoon, S.-W.; Lee, H.; Han, S.; Lee, S.-W.; Seong, T.-Y.; Lee, S.-C.; Lee, K.-B.; et al. Superplastic deformation of defect-free au nanowires via coherent twin propagation. Nano Lett. 2011, 11, 3499–3502. [Google Scholar] [CrossRef]
  18. Chen, L.Y.; He, M.-R.; Shin, J.; Richter, G.; Gianola, D.S. Measuring surface dislocation nucleation in defect-scarce nanostructures. Nat. Mater. 2015, 14, 707–713. [Google Scholar] [CrossRef]
  19. Yin, S.; Cheng, G.; Richter, G.; Gao, H.; Zhu, Y. Transition of deformation mechanisms in single-crystalline metallic nanowires. ACS Nano 2019, 13, 9082–9090. [Google Scholar] [CrossRef]
  20. Roos, B.; Kapelle, B.; Richter, G.; Volkert, C.A. Surface dislocation nucleation controlled deformation of Au nanowires. Appl. Phys. Lett. 2014, 105, 201908. [Google Scholar] [CrossRef]
  21. Weinberger, C.; Jennings, A.T.; Kang, K.; Greer, J.R. Atomistic simulations and continuum modeling of dislocation nucleation and strength in gold nanowires. J. Mech. Phys. Solids 2012, 60, 84–103. [Google Scholar] [CrossRef]
  22. Jennings, A.T.; Weinberger, C.R.; Lee, S.-W.; Aitken, Z.H.; Meza, L.; Greer, J.R. Modeling dislocation nucleation strengths in pristine metallic nanowires under experimental conditions. Acta Mater. 2013, 61, 2244–2259. [Google Scholar] [CrossRef]
  23. Wu, D.; Nieh, T. Incipient plasticity and dislocation nucleation in body-centered cubic chromium. Mater. Sci. Eng. A 2014, 609, 110–115. [Google Scholar] [CrossRef]
  24. Ma, Y.; Huang, X.; Hang, W.; Liu, M.; Song, Y.; Yuan, J.; Zhang, T. Nanoindentation size effect on stochastic behavior of incipient plasticity in a LiTaO3 single crystal. Eng. Fract. Mech. 2020, 226, 106877. [Google Scholar] [CrossRef]
  25. Ramalingam, S.; Reimanis, I.E.; Packard, C.E. Determining activation volume for the pressure-induced phase transformation in β-eucryptite through nanoindentation. J. Am. Ceram. Soc. 2012, 95, 2051–2058. [Google Scholar] [CrossRef]
  26. Wang, S.-P.; Xu, J. Incipient plasticity and activation volume of dislocation nucleation for TiZrNbTaMo high-entropy alloys characterized by nanoindentation. J. Mater. Sci. Technol. 2019, 35, 812–816. [Google Scholar] [CrossRef]
  27. Chen, L.Y.; Richter, G.; Sullivan, J.P.; Gianola, D.S. Lattice anharmonicity in defect-free Pd nanowhiskers. Phys. Rev. Lett. 2012, 109, 125503. [Google Scholar] [CrossRef] [PubMed] [Green Version]
  28. Shin, J.; Chen, L.Y.; Sanli, U.T.; Richter, G.; Labat, S.; Richard, M.-I.; Cornelius, T.; Thomas, O.; Gianola, D.S. Controlling dislocation nucleation-mediated plasticity in nanostructures via surface modification. Acta Mater. 2019, 166, 572–586. [Google Scholar] [CrossRef]
  29. Zhu, T.; Li, J.; Samanta, A.; Leach, A.; Gall, K. Temperature and strain-rate dependence of surface dislocation nucleation. Phys. Rev. Lett. 2008, 100, 025502. [Google Scholar] [CrossRef] [PubMed] [Green Version]
  30. Ryu, S.; Kang, K.; Cai, W. Predicting the dislocation nucleation rate as a function of temperature and stress. J. Mater. Res. 2011, 26, 2335–2354. [Google Scholar] [CrossRef] [Green Version]
  31. Ryu, S.; Kang, K.; Cai, W. Entropic effect on the rate of dislocation nucleation. Proc. Natl. Acad. Sci. USA 2011, 108, 5174–5178. [Google Scholar] [CrossRef] [PubMed] [Green Version]
  32. Meyer, W.V.; Neldel, H. Relation between the energy constant and the quantity constant in the conductivity—Temperature formula of oxide semiconductors. Z. Tech. Phys. 1937, 18, 588–593. [Google Scholar]
  33. Chachamovitz, D.; Mordehai, D. The stress-dependent activation parameters for dislocation nucleation in molybdenum nanoparticles. Sci. Rep. 2018, 8, 3915. [Google Scholar] [CrossRef] [PubMed] [Green Version]
  34. Lee, S.-W.; Mordehai, D.; Rabkin, E.; Nix, W.D. Effects of focused-ion-beam irradiation and prestraining on the mechanical properties of FCC Au microparticles on a sapphire substrate. J. Mater. Res. 2011, 26, 1653–1661. [Google Scholar] [CrossRef]
  35. Amodeo, J.; Maras, E.; Rodney, D. Site dependence of surface dislocation nucleation in ceramic nanoparticles. NPJ Comput. Mater. 2021, 7, 60. [Google Scholar] [CrossRef]
  36. Derlet, P.; Maas, R. A probabilistic explanation for the size-effect in crystal plasticity. Philos. Mag. 2014, 95, 1829–1844. [Google Scholar] [CrossRef] [Green Version]
  37. Gu, Y.; Eastman, D.W.; Hemker, K.J.; El-Awady, J.A. A statistical model for predicting size effects on the yield strength in dislocation-mediated crystal plasticity. J. Mech. Phys. Solids 2020, 147, 104245. [Google Scholar] [CrossRef]
  38. Plimpton, S. Fast parallel algorithms for short-range molecular dynamics. J. Comput. Phys. 1995, 117, 1–19. [Google Scholar] [CrossRef] [Green Version]
  39. Zhou, X.W.; Johnson, R.A.; Wadley, H.N.G. Misfit-energy-increasing dislocations in vapor-deposited CoFe/NiFe multilayers. Phys. Rev. B 2004, 69, 144113. [Google Scholar] [CrossRef] [Green Version]
  40. Mousavi, S.M.T.; Zhou, H.; Zou, G.; Gao, H. Transition from source- to stress-controlled plasticity in nanotwinned materials below a softening temperature. NPJ Comput. Mater. 2019, 5, 2. [Google Scholar] [CrossRef]
  41. Zhou, Y.; Fichthorn, K.A. Internal stress-induced orthorhombic phase in 5-fold-twinned noble metal nanowires. J. Phys. Chem. C 2014, 118, 18746–18755. [Google Scholar] [CrossRef]
  42. Stukowski, A. Visualization and analysis of atomistic simulation data with OVITO—The open visualization tool. Model. Simul. Mater. Sci. Eng. 2010, 18, 015012. [Google Scholar] [CrossRef]
  43. Zhou, X.W.; Wadley, H.N.G.; Johnson, R.A.; Larson, D.J.; Tabat, N.; Cerezo, A.; Petford-Long, A.K.; Smith, G.D.W.; Clifton, P.H.; Martens, R.L.; et al. Atomic scale structure of sputtered metal multilayers. Acta Mater. 2001, 49, 4005–4015. [Google Scholar] [CrossRef]
  44. Zhang, J.-M.; Zhang, Y.; Xu, K.-W.; Ji, V. Young’s modulus surface and Poisson’s ratio curve for cubic metals. J. Phys. Chem. Solids 2007, 68, 503–510. [Google Scholar] [CrossRef]
  45. Rabkin, E.; Srolovitz, D.J. Onset of plasticity in gold nanopillar compression. Nano Lett. 2007, 7, 101–107. [Google Scholar] [CrossRef] [PubMed]
  46. Cottrell, A.H. Thermally activated plastic glide. Philos. Mag. Lett. 2002, 82, 65–70. [Google Scholar] [CrossRef]
  47. Xie, Z.; Shin, J.; Renner, J.; Prakash, A.; Gianola, D.S.; Bitzek, E. Origins of strengthening and failure in twinned Au nanowires: Insights from in-situ experiments and atomistic simulations. Acta Mater. 2020, 187, 166–175. [Google Scholar] [CrossRef]
  48. Rodney, D.; Schuh, C. Distribution of thermally activated plastic events in a flowing glass. Phys. Rev. Lett. 2009, 102, 235503. [Google Scholar] [CrossRef]
Figure 1. The unrelaxed shape of the Pd nanowire in the MD simulations. (a) The rhombic cross-section. (b) a 3D view of the nanowire. The frame is the MD computational cell.
Metals 12 00280 g001
Figure 2. (a) The engineering stress-strain plot during tensile loading in a simulation at 100 K. The strain at which dislocation was nucleated is marked with a dashed line. (b) Nucleation from the acute (left) and obtuse (right) angles. For clarity, only the atoms in stacking fault are visualized and the rhombic contour of the cross-section is sketched.
Metals 12 00280 g002
Figure 3. The probability to nucleate a dislocation at the acute angle is based on the MD simulations. A phenomenological function was fitted to the results.
Metals 12 00280 g003
Figure 4. CDFs nucleate a dislocation as a function of the strain for different temperatures. The critical strain of the acute angle ε c r , 1 is marked in a dashed line.
Metals 12 00280 g004
Figure 5. (a) Most probable nucleation strain ε ¯ and the average nucleation strain for each nucleation site in different temperatures. (b) Distribution width ω in different temperatures.
Metals 12 00280 g005
Figure 6. The difference in the activation energy between the two nucleation sites at the most probable nucleation strain for each temperature.
Metals 12 00280 g006
Figure 7. l n ( χ ) as a function of ( 1 ε / ε c r 1 ) for two different values of T m . A fit to the results for T m is plotted.
Metals 12 00280 g007
Figure 8. Temperature-independent part of the free energy barrier Q 1 as a function of ( 1 ε / ε c r 1 ) .
Metals 12 00280 g008
Figure 9. Free Energy Barrier for the acute and obtuse angles for different strain values.
Metals 12 00280 g009
Figure 10. Analytical model for the probability distribution (PDF) for the strain to nucleate dislocation at a certain temperature when considering nucleation from (a) both site types, from the (b) acute angle and (c) the obtuse angle only. The color indicates the value of the PDF, scaled by its maximum value at each temperature. The most probable nucleation strain for each analytically calculated PDF is marked with blue line. All temperature-dependent nucleation strains calculated in the MD simulations are marked in black dots, and the most probable nucleation strain from the MD simulation ( ε ¯ ( T ) ) , is marked with red dots.
Metals 12 00280 g010
Figure 11. E and D were obtained from the MD simulation results for different temperatures.
Metals 12 00280 g011
Publisher’s Note: MDPI stays neutral with regard to jurisdictional claims in published maps and institutional affiliations.

