Article

Development of Hot Working Process Maps for Incompressible TRIP Steel and Zirconia Composites Using Crystal Plasticity-Based Numerical Simulations

1
Lehrstuhl für Umformtechnik, Institut für Technologien der Metalle, Universität Duisburg Essen, 45117 Essen, Germany
2
Institute of Metal Forming, Technische Universität Bergakademie Freiberg, 09599 Freiberg, Germany
3
Department of Mechanical Engineering, National Taiwan University of Science and Technology, Taipei 10607, Taiwan
*
Author to whom correspondence should be addressed.
Metals 2022, 12(12), 2174; https://doi.org/10.3390/met12122174
Submission received: 28 October 2022 / Revised: 29 November 2022 / Accepted: 13 December 2022 / Published: 16 December 2022

Abstract

:
In this study, we developed hot working process maps for incompressible TRIP steel composites with 0%, 5%, 10%, and 20% zirconia particles using crystal plasticity-based numerical simulations. Experimentally recorded material flow curves were used to calibrate material model parameters for TRIP steel and zirconia. The fitted material models were used for running the composite simulations. Representative volume elements (RVEs) for composites were generated using the open-source DREAM.3D program. After post-processing, the simulation results were used to calculate global and local stress–strain values at temperatures ranging from 700 to 1200 °C and strain rates ranging from 0.001 to 100 s−1. Local stress–strain maps allow researchers to investigate the effect of zirconia particles on composites, which is difficult to measure experimentally at these high temperatures. On the dynamic material model (DMM), the global results were then used to construct process maps. Because the ability of the simulation model to depict dynamic softening was constrained, the processing maps derived from the simulation data did not depict regions of instability. By running crystal plasticity-based numerical simulations, we reported important findings that might help in building hot working process maps for dual-phase materials.

1. Introduction

The application of numerical simulation to optimize and understand the processing–microstructure–property relationship for materials has increased considerably. This has facilitated the production of new materials with better mechanical properties. For example, the application of particle-reinforced metal matrix composites (PRMMC) has gained popularity due to their high strength, better wear resistance, and stiffness with ceramic particles [1]. The TRIP (Transformation-Induced Plasticity) steel MMCs with zirconia have been extensively investigated because the steel phase in the matrix can enhance ductility, stiffness, and high strength. Additionally, adding zirconia particles increases the yield strength and the ability to withstand more deformations when loaded [2].
The mechanical behavior of metallic materials is generally estimated from compression or tensile test data [3]. The shape of the stress–strain curves obtained from these experimental tests provides embedded information related to hot deformation, such as softening, hardening, and dynamic recrystallization. The more energetic system analysis is based on the Dynamic Material Model (DMM) proposed by Prasad et al. [4], in which the workpiece is considered to be the nonlinear dissipator of power when it undergoes a suitable metal-forming process. This dissipation of power can be calculated from constitutive equations to evaluate the microstructural behavior of the material under specific boundary conditions. The workability of more than 200 alloy materials has been studied using this approach [5].
Process maps are generally created using experimental data. These experimental material data are obtained at various elevated temperatures and strain rates which requires a lot of testing; this testing makes the determination of process maps expensive and time consuming [6]. The development of a virtual material laboratory has allowed computers to estimate these forming processes and helped researchers by decreasing the number of experiments that need to be conducted for enhancing the technological and economic aspects and calculation of material deformation behavior.
Numerical simulations are an accurate and robust method for solving complex equations and variables related to the physical aspects of materials, such as elastic and plastic deformation mechanisms and damage or failure analyses [7]. Advancements in CP simulations have stimulated research on a variety of materials [8,9,10,11,12]. However, these approaches have certain limitations, especially the choice of the representative volume element (RVE) and the identification of the model parameters concerning the material under investigation.
The RVE indicates a small material volume whose effective characteristics, such as volume fraction, morphology, and randomness of the phases, represent the material. The RVE should be large enough to represent the material behavior but small enough to reduce the computation costs [13]. The choice of an RVE is also determined by the detail of the analysis prescribed by the researcher and introducing different RVEs at different structural scale levels might be required. The parametric calibration of crystal plasticity models should be performed independent of the attributes of the RVE, and therefore, an isotropic and small RVE is needed to obtain averaged global response, which is then compared with experimental observations [14,15]. However, developing an optimal isotropic 3D RVE for dual-phase material with varying percentages, i.e., 5%, 10%, and 20% of the second phase, is challenging, and no published study has investigated this issue.
Under certain boundary conditions, TRIP steel MMCs exhibit a strong increase in transformation-induced plasticity, although this effect only occurs up to 100 °C [16,17]. Additionally, zirconia particles in the steel matrix can increase the toughness of the matrix while it undergoes a stress-induced phase transformation from the tetragonal phase to the monoclinic phase. However, this effect was only observed at 600 °C [18,19]. TRIP steel MMCs are conventionally produced by sintering in the form of blocks or discs, and their mechanical behavior needs to be determined at high temperatures for further applications. The experimentally generated process maps can be obtained from studies on TRIP steel composites. However, no suitable approach is available to construct them based on numerical simulations. In the current study, we applied a temperature of 700–1200 °C; the TRIP effect in the steel matrix (austenite) and the phase transformation effect in zirconia do not occur at these temperatures [20]. After considering these attributes, we applied the crystal plasticity-based phenomenological power law, which in a virtual laboratory setup, helps in calculating the material process maps more efficiently with adequate efficiency.
In this study, we proposed a methodology for developing process maps for multi-phase materials in a virtual laboratory setting by varying the composite composition. Other researchers might use this methodology for different materials, applications, and loading conditions to determine the accuracy of predictions. Section 2 presents the methodology along with information on material data, material models, construction of the RVE, and the simulation strategy. In Section 3, we presented the results of this study. In Section 4, the findings were compared to the current state of the art, and the prospects were assessed. Finally, in Section 5, the conclusion of the study was provided.

2. Methodology

TRIP steel composites with 0%, 5%, 10%, and 20% zirconia particles were used as the study material. Numerical simulations use a systematic strategy to collect data from published studies or experiments and create suitable representative volume elements (RVEs). The numerical simulation tool, DAMASK [12], was used to perform simulations for obtaining the deformation behavior of the material. The parameters of the material model for both phases were calibrated from the experimental flow curves. For the crystal plasticity model, the detailed governing equations are provided in Appendix A.1. The open-source DREAM.3D tool [21] was used to construct dual-phase 3D and 2D RVEs, which included the input geometry files for both global and local behavior simulations for composite material. After post-processing, the global results were analyzed using MATLAB and a process map was generated. Based on the formulations proposed by Prasad et al. [22] for the dynamic material model (DMM), a MATLAB code was generated to create the process map. For readers unfamiliar with the DMM, a brief description is provided in Appendix A.2. The local results were analyzed using Paraview [23] for all cases. The simulations performed in this study were conducted using a 3.7 GHz, four-core CPU with 8 GB of RAM. The methodology used in this study to generate process maps from the results of the simulation is shown in Figure 1.

2.1. RVE Construction

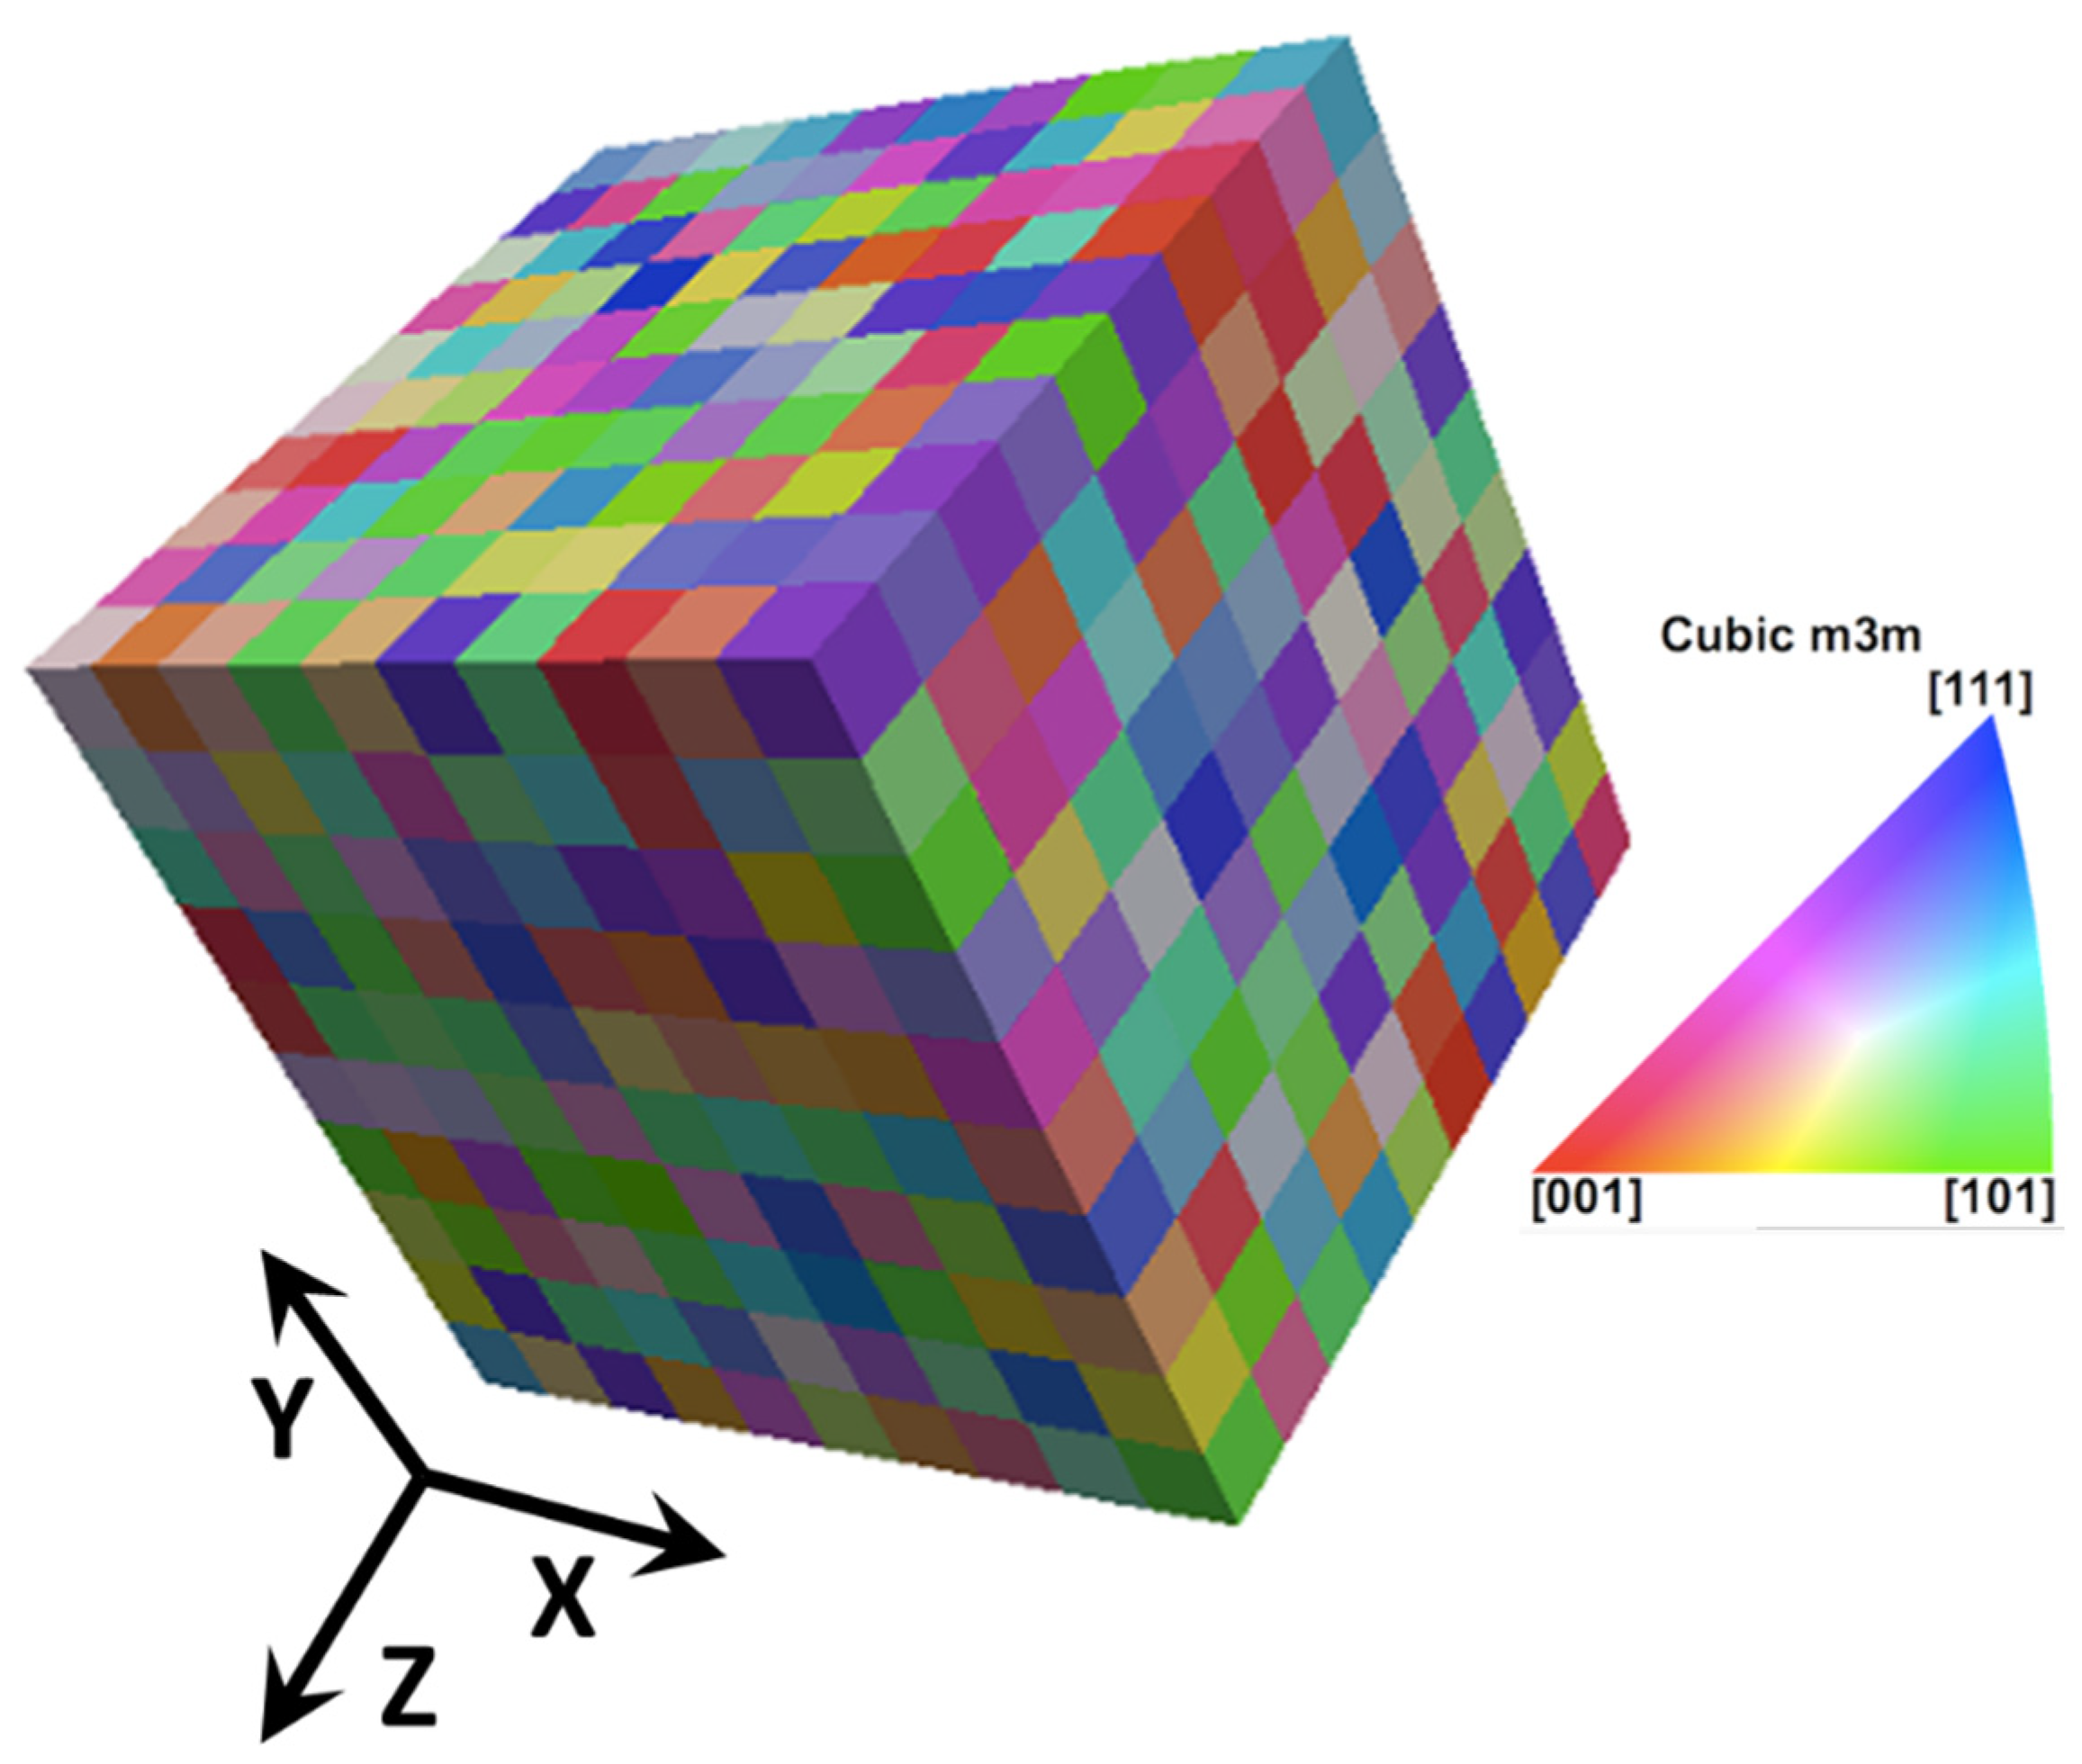
Using a published methodology [15], a pipeline was developed in DREAM 3D to generate the RVE. For individual austenite and zirconia phases, a single phase 10 × 10 × 10 isotropic 3D RVE with 1000 elements was adopted from a published study, as shown in Figure 2 [14].
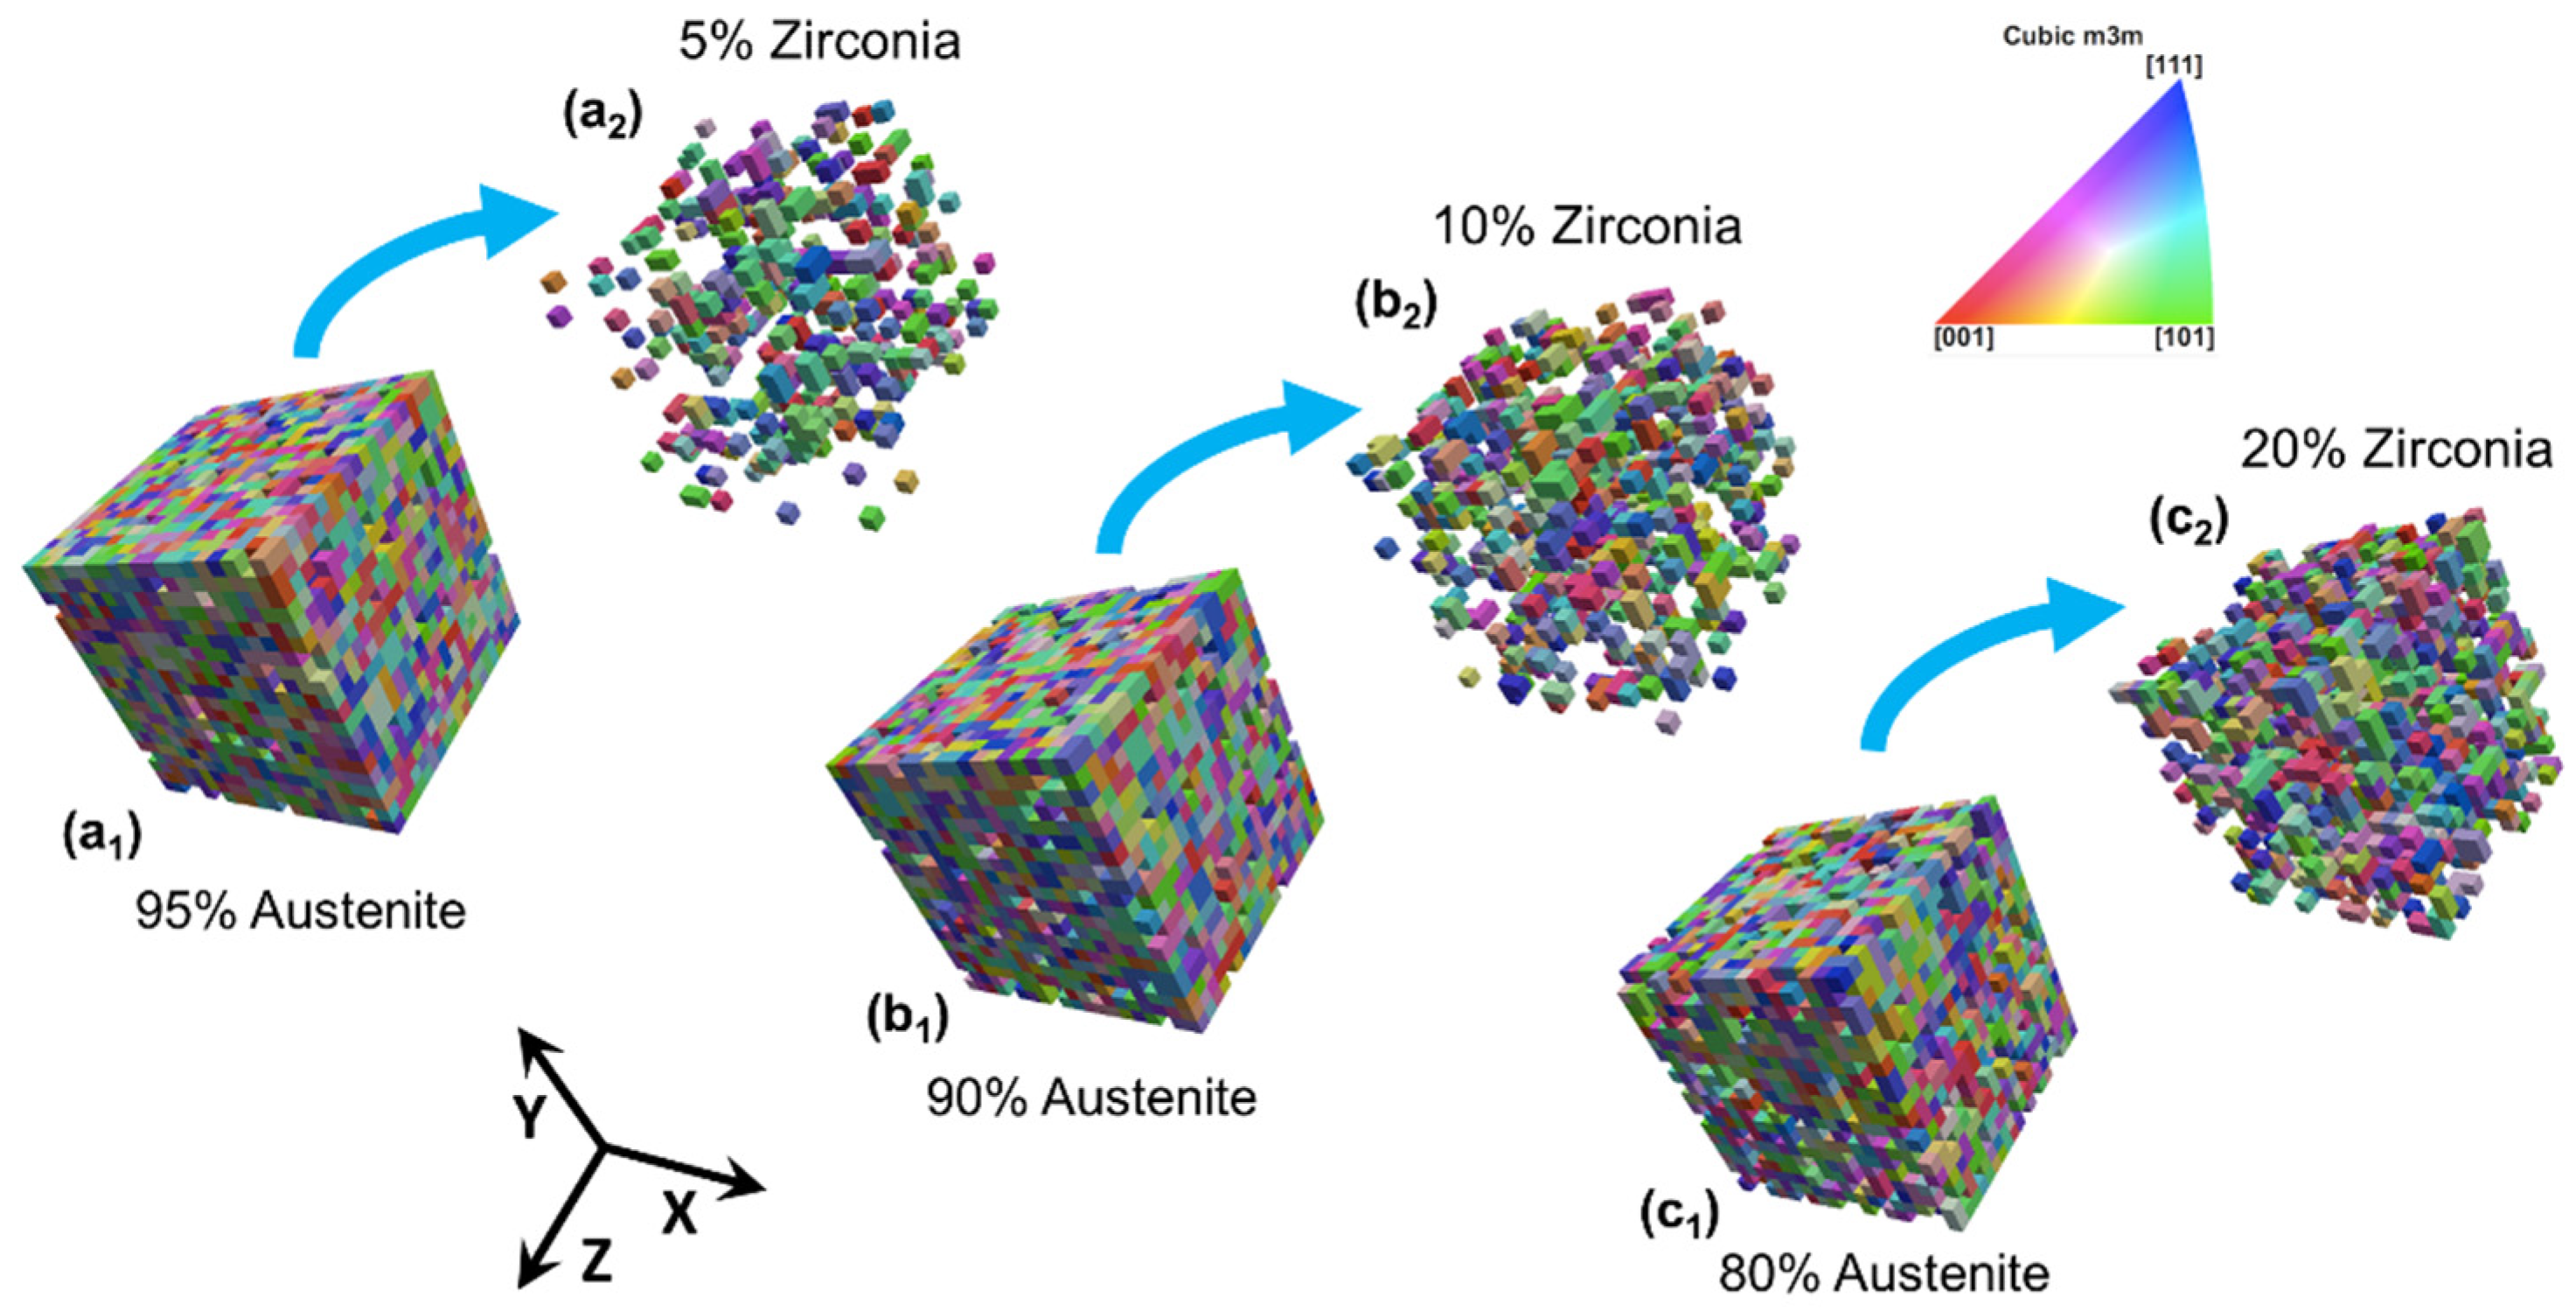
For the TRIP steel MMCs, three RVEs were generated with 5, 10, and 20 vol. % zirconia particles in a suitable austenite matrix. To maintain the proper phase concentration, an RVE of 60 × 60 × 60 was selected. The primary and secondary phases were generated as cubic equiaxed crystal structures, and ellipsoid grains were assigned. The maximum number of iterations allowed was 100,000.
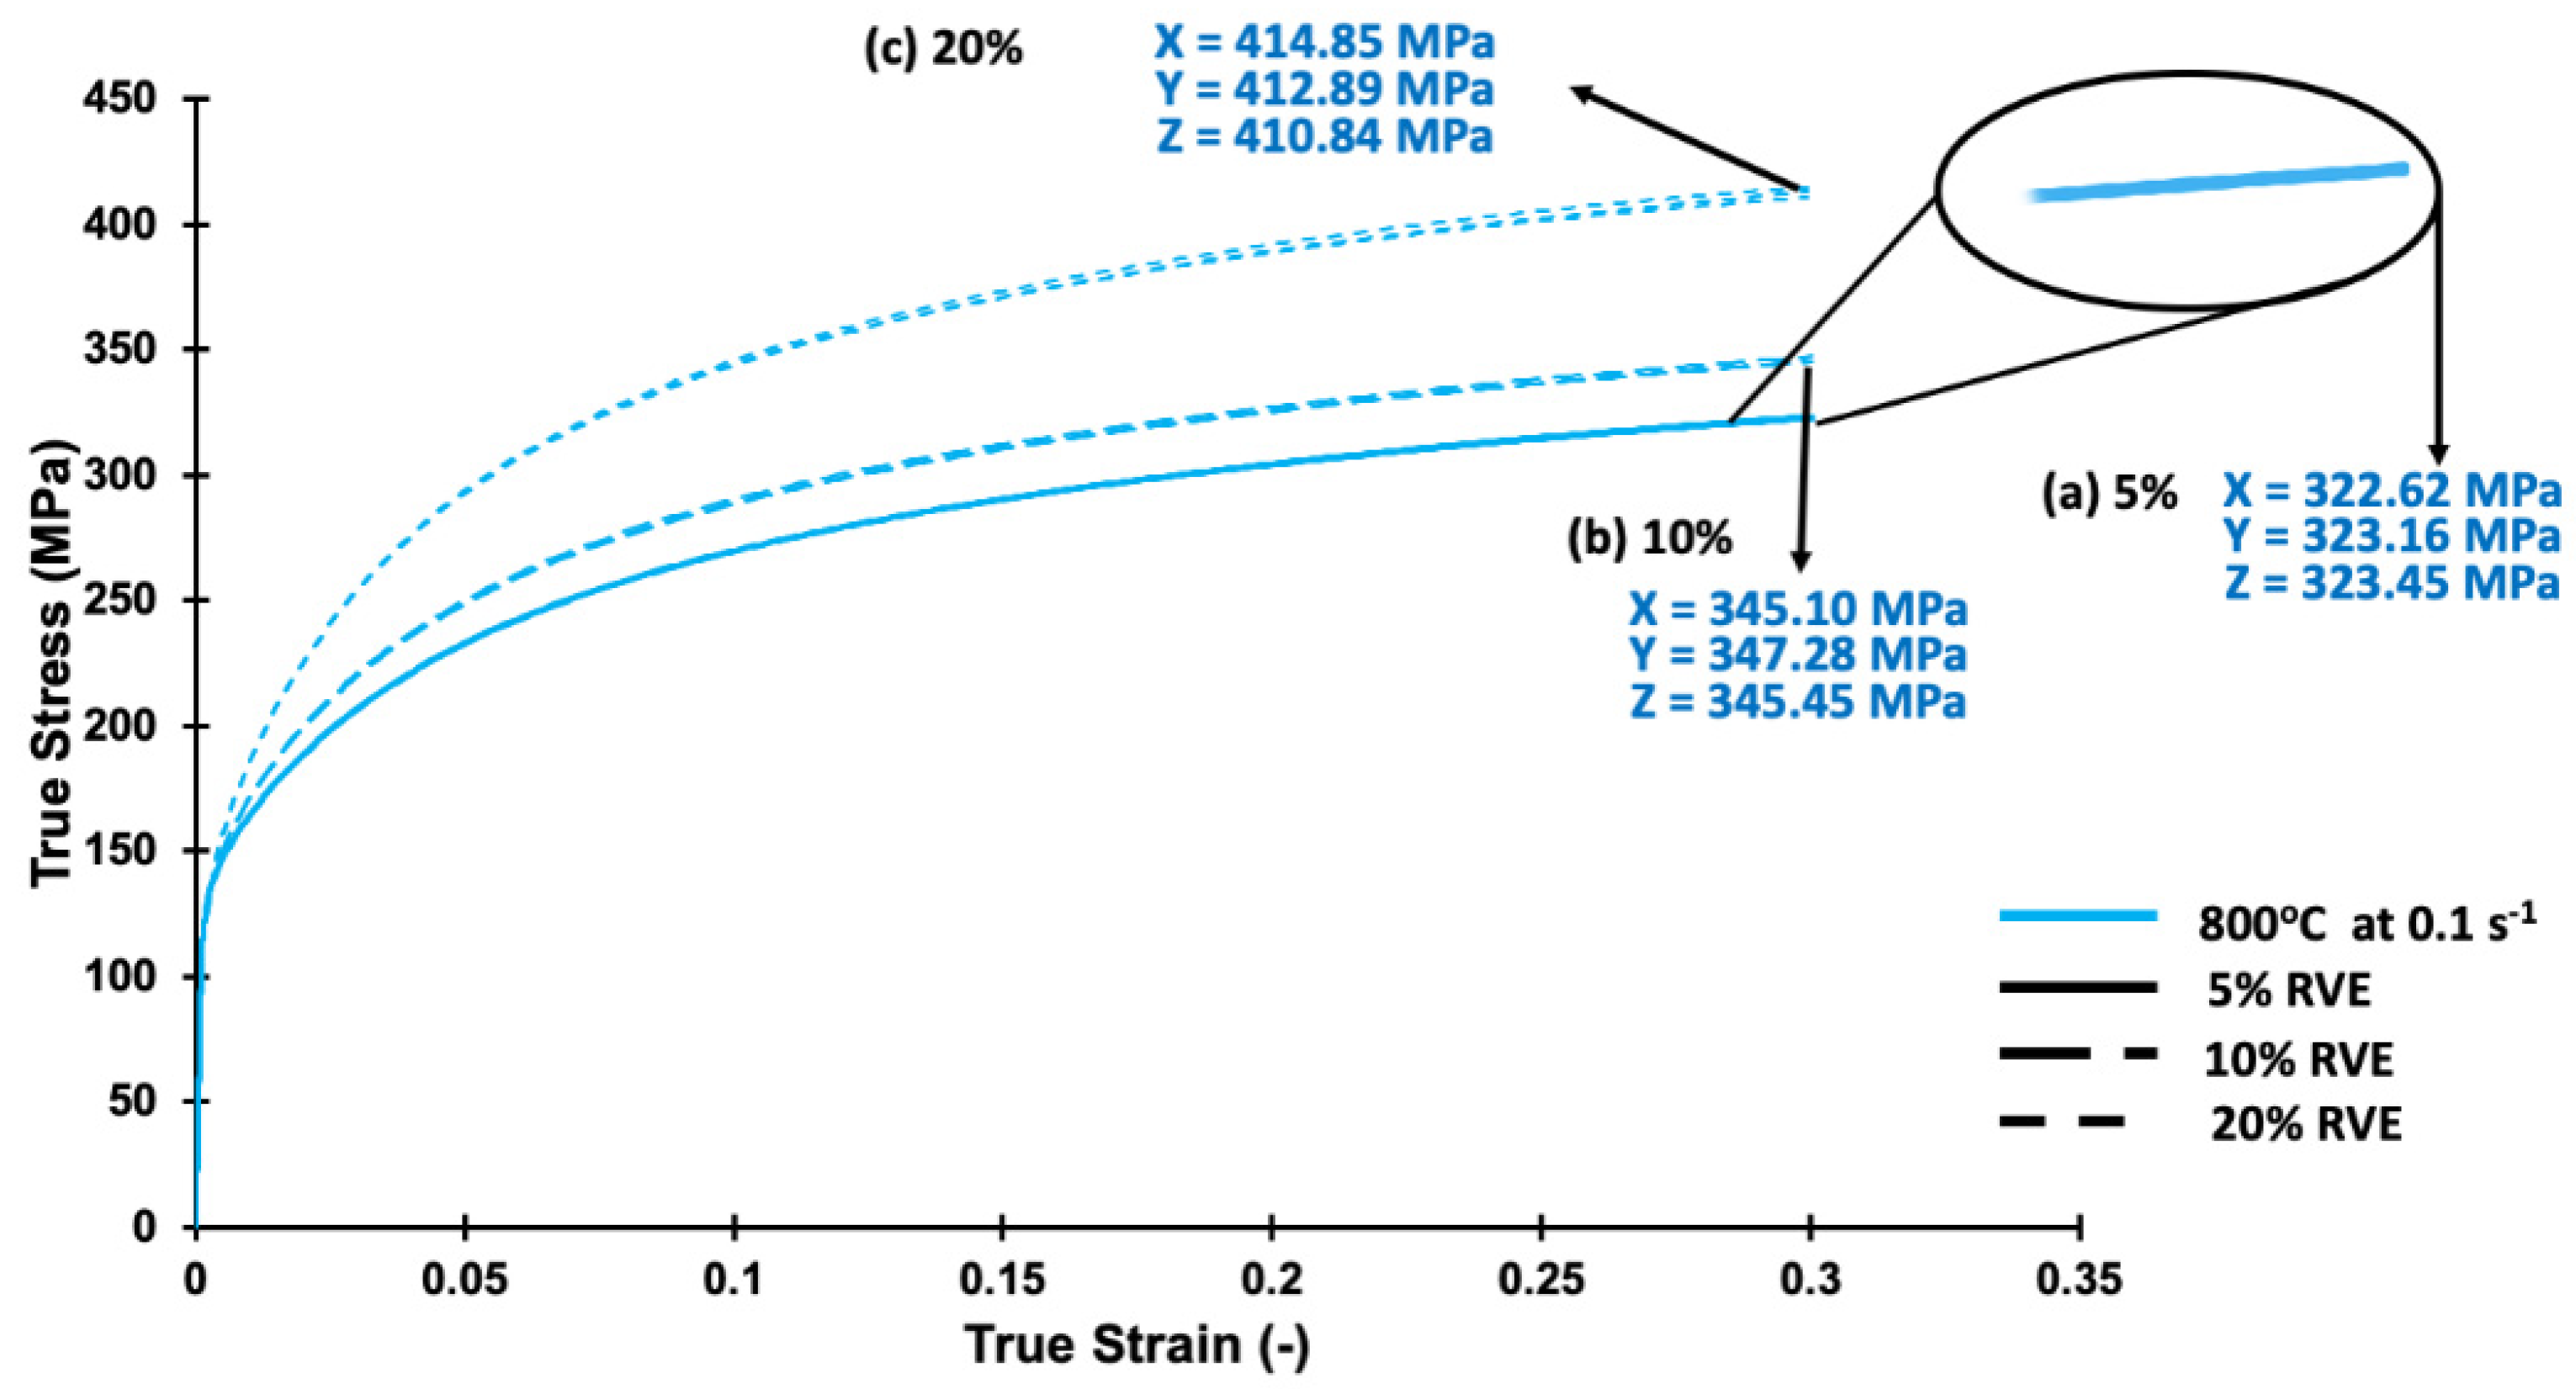
The austenite and zirconia phases are separately shown in Figure 3 to demonstrate the special distribution with the representative random orientation of each grain in the RVE. The generated RVEs were visualized in Paraview as a “.xdmf” file, and the “.geom” file output was opened in DAMASK for further processing. The size and grid resolution were reduced to 20 × 20 × 20 using the geom_rescale subroutine in the DAMASK library. The isotropic behavior of the RVE was verified, as shown in Figure 4. The computational time to record the raw data was reduced from 6 h to 2 h per simulation. The percentage deviation of the results in the XYZ loading direction increased with an increase in the concentration of the second-phase particles. The second phase concentration of 20% for the RVE at 0.3 global strain showed a maximum percentage deviation of approximately 0.97%. In comparison, the RVE with the second phase concentration of 5% and 10% showed deviations of 0.26% and 0.63%, respectively.
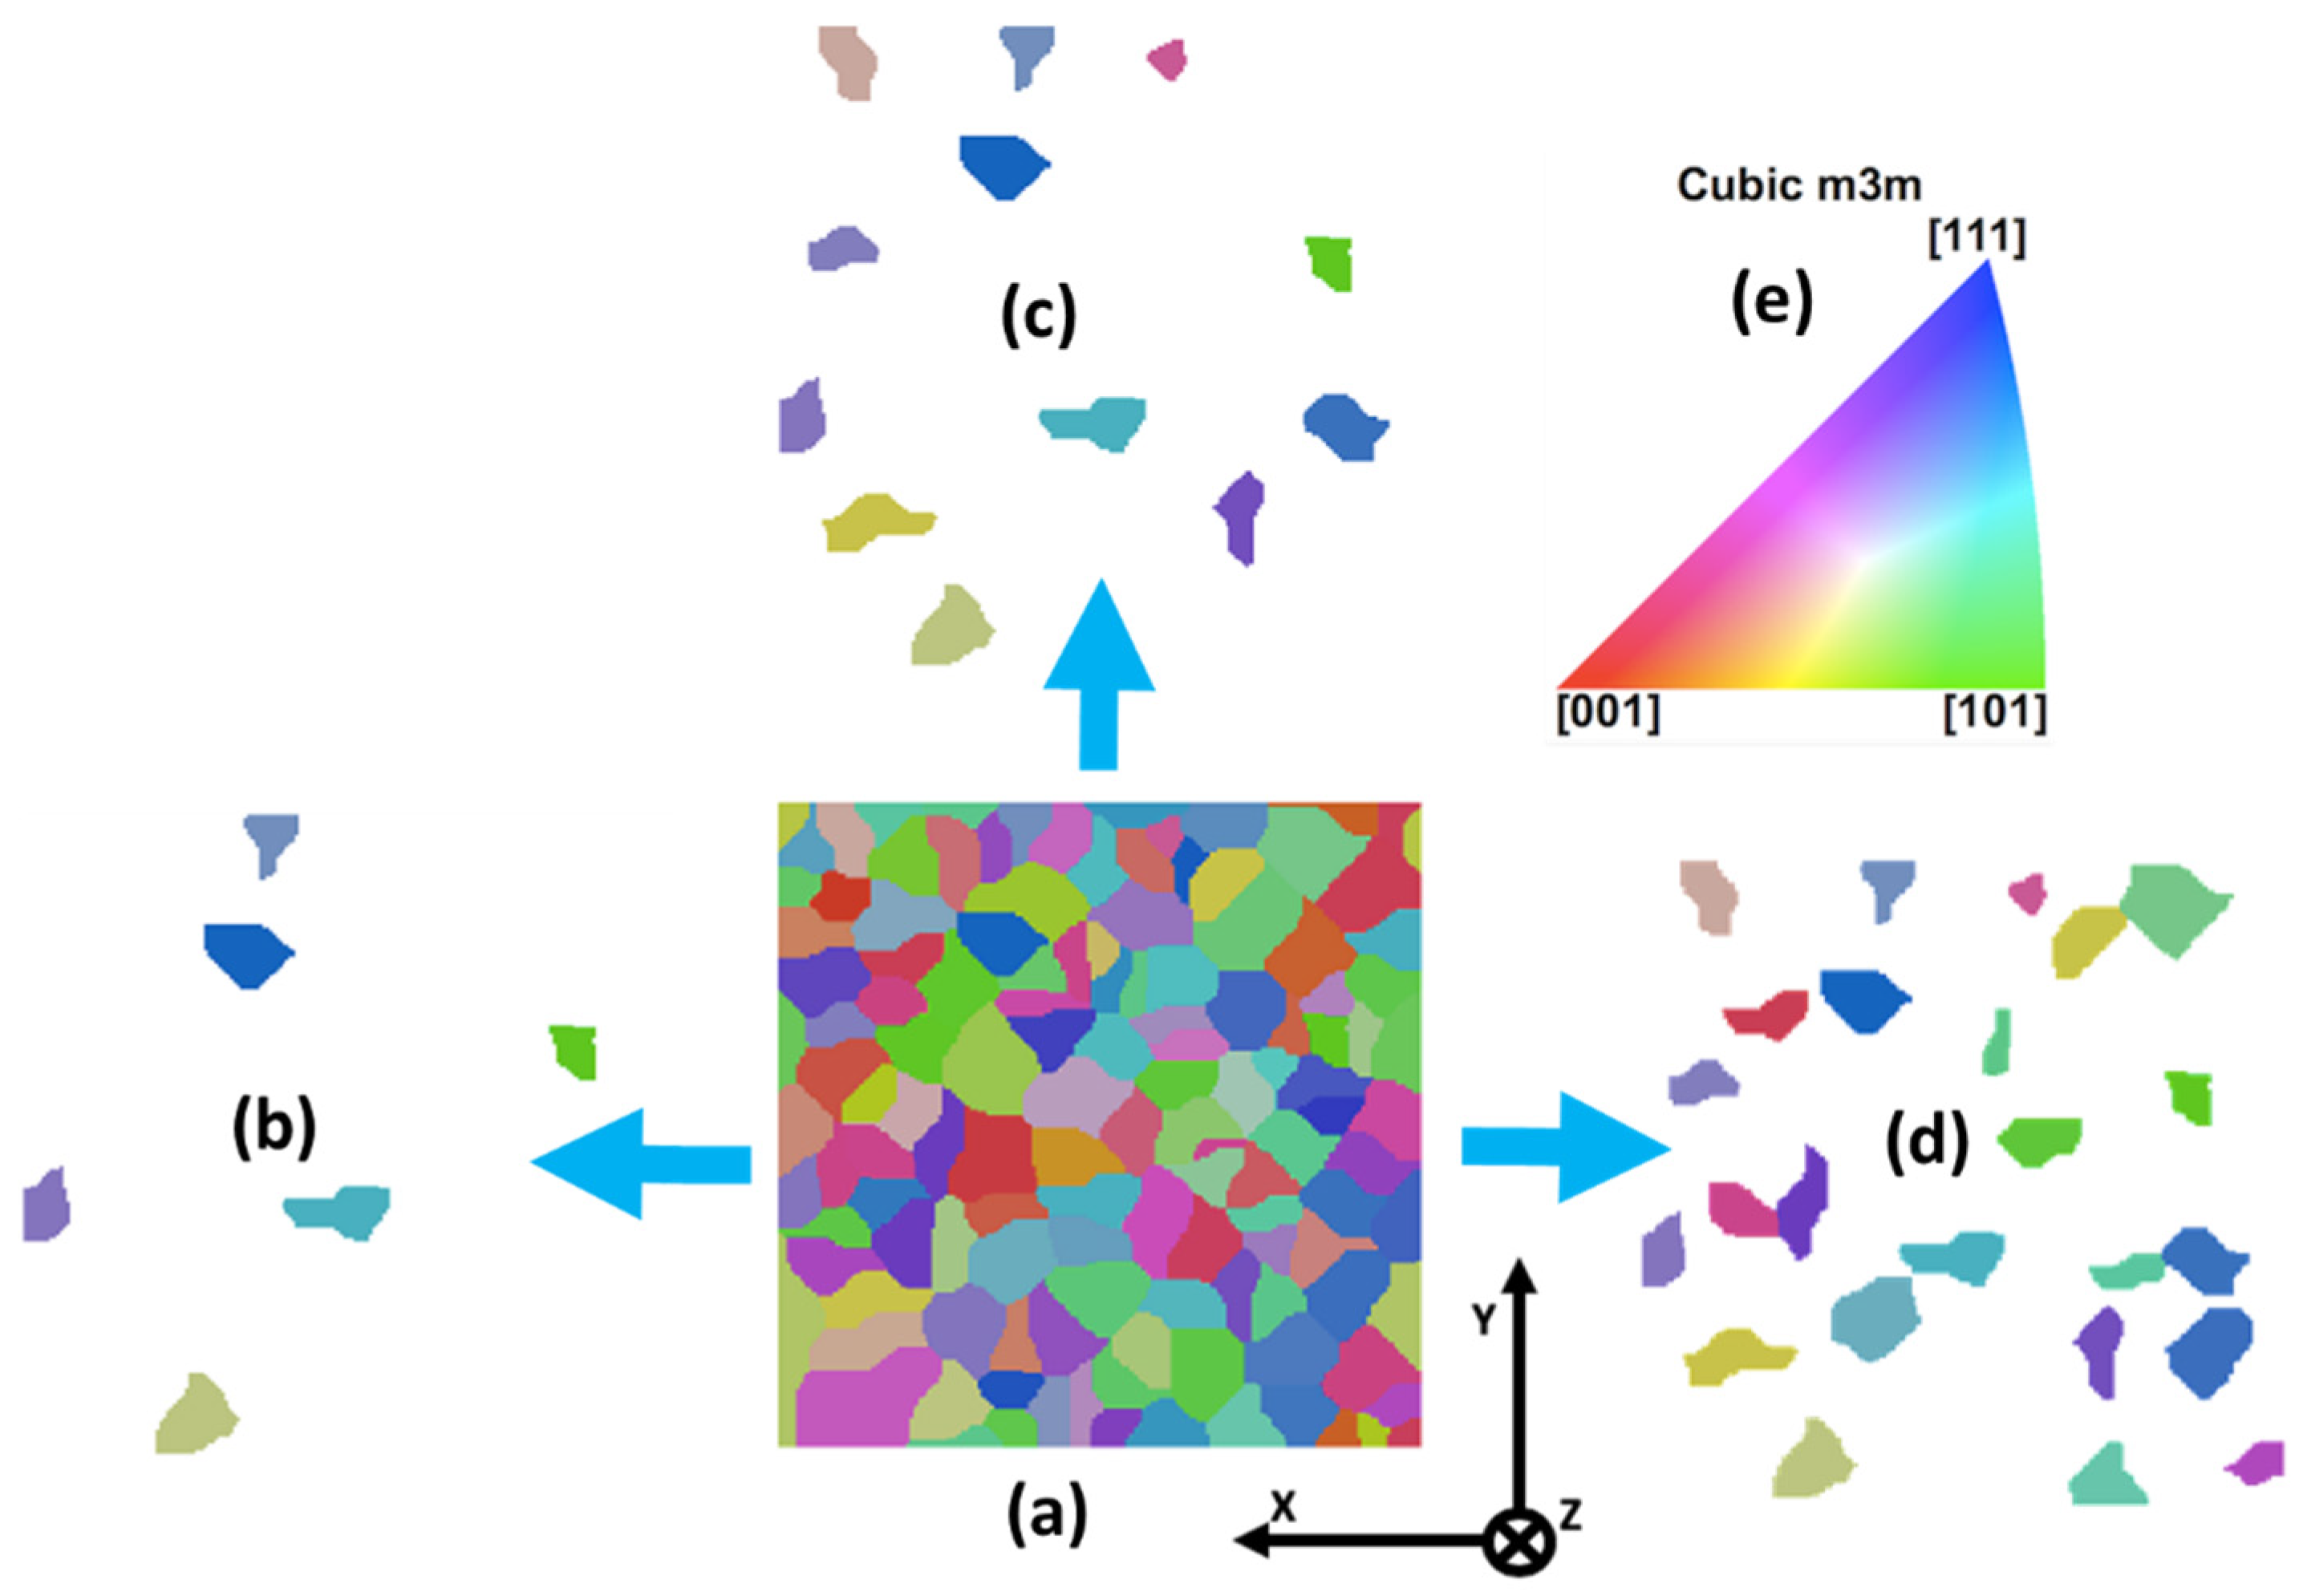
The 2D RVE with a size of 200 × 200 × 1 and 123 grains was built using the same technique [15] to analyze the local deformation behavior (Figure 5). The steel matrix was consistent with 5%, 10%, and 20% of the random grains assigned as zirconia particles. Although this method has some limitations, fixing the shape, position, size, and orientation of the austenite matrix grains and changing the neighborhood details makes it easier to compare its influence on the evolution of local deformation. Therefore, we used this method to generate RVEs with varying compositions.
All RVEs constructed and used in this study had periodic boundaries (edge features were wrapped around the RVE to avoid edge distortions) and were also simulated under periodic boundary conditions. This indicated that no free surfaces were present, which limited the emergence of unwanted deformation features near the edges of the RVEs during simulations.

2.2. Material Used and Data Collection

The chemical composition of the gas-atomized powder of TRIP steel X3CrMnNi16–7–6 and the partially stabilized zirconia (PSZ) of MgO is presented in Table 1 [24]. As this was the same base material used by other researchers, the compositions were not measured but cited appropriately.
In this study, austenite was assigned elastic-viscoplastic properties, and zirconia was assigned elastic properties [25] to the validated phenomenological power-law-based material models, as shown in Appendix A.1. within the structure of the DAMASK code [8]. The parameters of the material model were calibrated by fitting the curve to match the behavior of the experimental flow curve. However, calibration of the adjustment parameters is challenging. The data were post-processed for analyzing the stress–strain curves for austenite. Each curve was manually fitted with approximately 20 simulations for each fitting parameter. Simulations were run for the true global strain of 0.2 in small increments of 1110. The simulation flow curves were then compared with the experimental flow curves at 700–1200 °C and a strain rate of 0.1 s−1. The parameters of the calibrated material model for the austenite phase are presented in Table 2. The elastic matrix parameters were kept constant across the temperature range, assuming that they would not change significantly as they did not strongly affect the overall behavior of the material.
The formulated model did not account for the interphase boundaries and grain boundaries intrinsically. Instead, an ideal interphase interface was assumed for the transfer of stress or strain. The absence of modeling interphase interfaces or grain boundary motion can greatly affect the accuracy of the simulation results. We resolved this issue by including the effect of grain boundary and interface deformation in the shearing, hardening, and fitting parameters, that are shown in Table 2.
To calibrate the zirconia material model, the elastic stiffness constants and Hooke’s law were applied to simulate elastic behavior in the DAMASK framework. The elastic stiffness constants were calculated from Young’s modulus and a suitable value of Poisson’s ratio [26]. The slope of the experimental stress–strain curve in the elastic region provided the values of Young’s modulus. These values were calculated using a suitable statistical method (see Appendix B). The elastic stiffness constants were calculated using Equations (A20)–(A22). The identified parameters of the elastic material model for zirconia at different temperatures are presented in Table 3.
The fitted experimental flow curves and the simulation flow curves for austenite and zirconia are shown in Figure 6. In case of austenite (Figure 6b), dynamic softening was observed in the earlier strain (0.3) at 1200 °C compared to that at other temperatures. In case of zirconia, the numerical outcomes matched with the experimental observations at high temperatures but were significantly different at lower temperatures (Figure 6b). The statistical fitting of slope values is analyzed in Appendix B, and these statistically identified values were used in the simulations. As the slopes of experimental and numerical values are statistically similar, their absolute values are different at different strains and therefore a large difference at lower temperatures is apparent. However, as the zirconia particles do not undergo high strains during deformation this difference does not affect the simulation outcome significantly.

2.3. Boundary Conditions, Processing, and Post-processing

In this study, the uniaxial compression loading along the x-direction was considered to be a boundary condition. The periodic boundary conditions used in the simulations can be represented as a rate of deformation tensor as follows:
F ˙ ij = [ A 0 0 0 0 0 0 ] s 1
Similarly, the first Piola–Kirchhoff stress tensor corresponding to uniaxial compression in the x-direction can be represented as follows:
P ij = [ 0 0 ] Pa
Here, “A” represents the strain rate values applied to the chosen RVE, i.e., 0.001, 0.01, 0.1, 1, 10, and 100 s−1, F ˙ ij represents the coefficient of the macroscopic rate of the deformation gradient, P ij represents the coefficient of the macroscopic first Piola–Kirchhoff stress tensor, and “*” represents the component with complementary conditions. The load files were designed to run simulations up to 0.2 true strain for global results and up to 0.1 true strain for local results. For composite simulations with a higher number of second-phase particles, a higher number of increments was recorded.
The raw data obtained from the results of the numerical simulations were further post-processed with built-in subroutines in DAMASK. The simulation data were visualized in Microsoft Excel through global stress–strain curves and also in Paraview [23] to image the local simulation results. The process maps were developed from the obtained datasets in the MATLAB platform using the formulations provided in Appendix A.2.

3. Results

In this study, simulations on TRIP steel MMC with 0%, 5%, 10%, and 20% zirconia composite were conducted at 700–1200 °C and strain rates of 0.001–100 s−1. The parameters of the calibrated material model for austenite and zirconia were used to run the simulations for the composite material. Then, 3D isotropic RVEs were generated to study the global deformation behavior of the material. The 2D RVEs were developed to maintain a fixed austenite matrix, and random grains were assigned as zirconia particles to observe their effect on the matrix for local deformation behavior. We focused on the structural building of such investigations based on the simulation results obtained by statistical data processing. The TRIP steel MMC results were analyzed independently in the following section. In the Discussion section, we compare their similarities and differences with the results presented in published studies.

3.1. Deformation Behavior of TRIP Steel Composite

3.1.1. Global Behavior

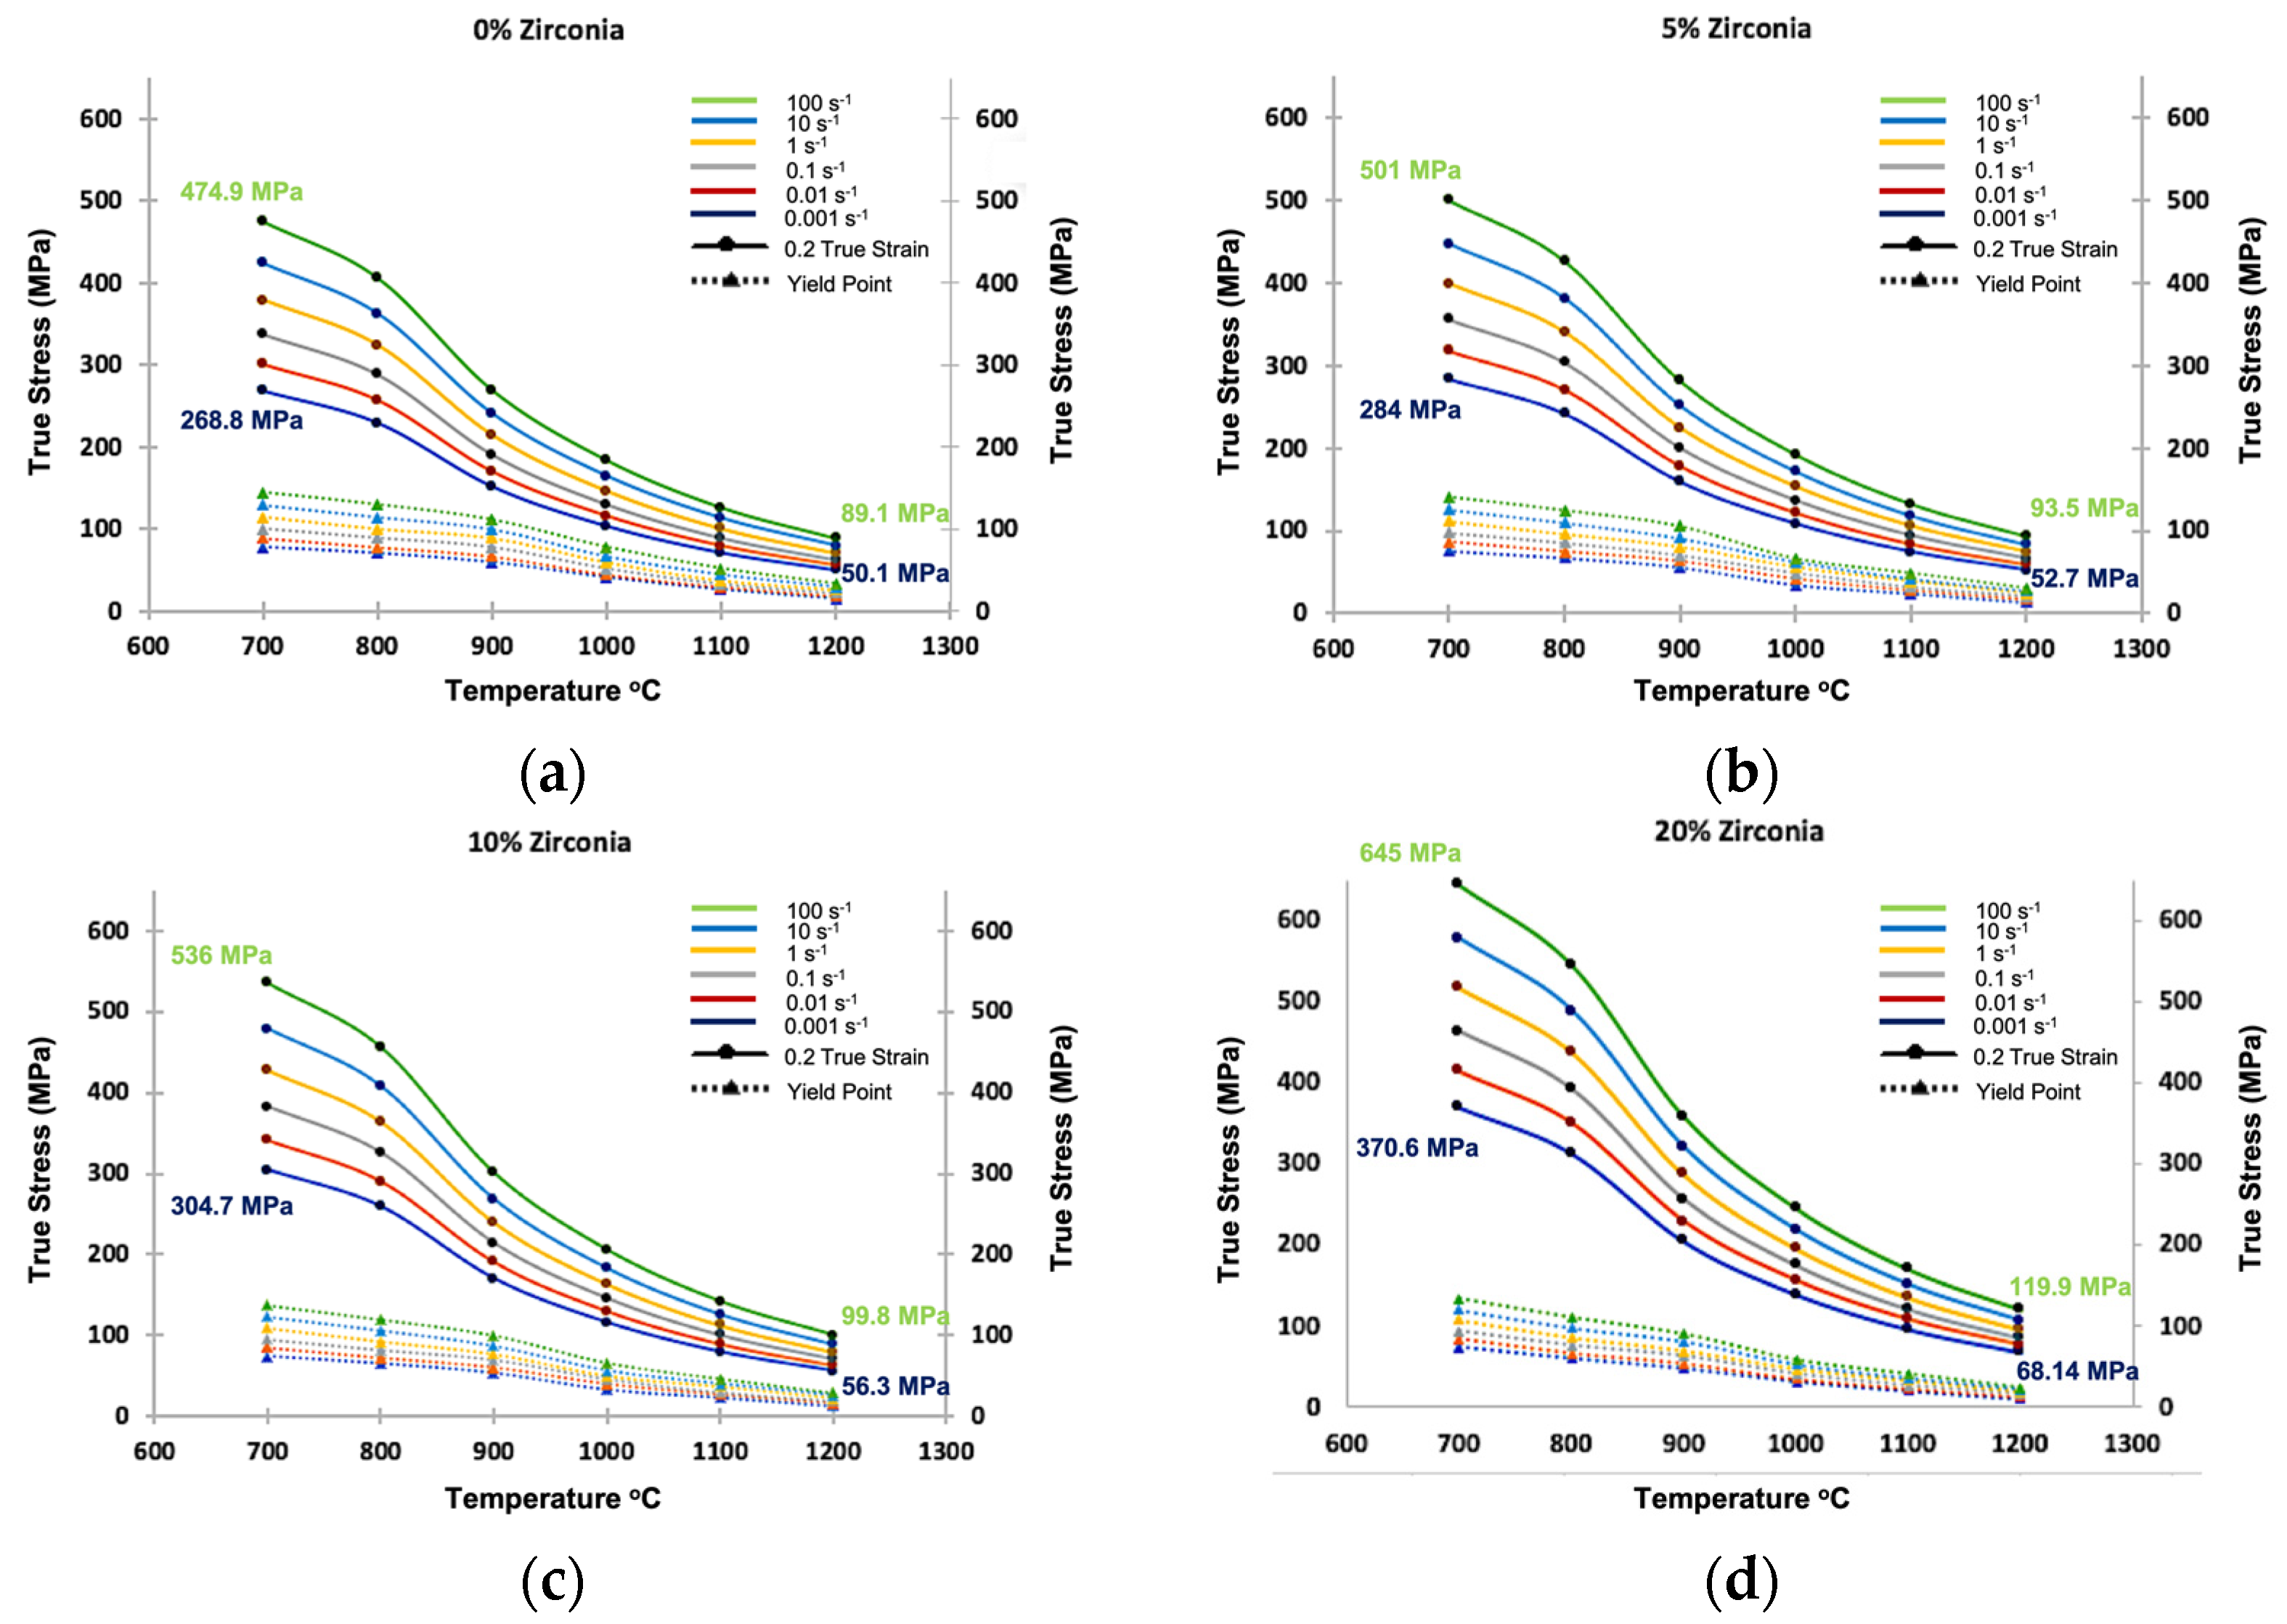
In this study, six temperature values and six strain rates were considered for a composite material to produce 36 flow curves for one material. Because the simulations were complex and massive, representing the results in a meaningful way was challenging. Therefore, we compared the flow curves at the yield point and the true strain to visualize the changes so that the effect of the amount of zirconia particles could be determined. For example, when the concentration increased from 0% to 20%, the global stress in the composite increased approximately by 30% at the true strain (Figure 7).
The yield stress and flow stress values decreased across all compositions as the temperature increased from 700 °C to 1200 °C. The yield stress and flow stress followed the reverse sigmoid function, which was more pronounced as the zirconia content and the applied strain rate increased. Under warm deformation conditions, the applied strain rate significantly affected the yielding and flow stress behavior of the material, whereas, at high working temperatures, no significant difference in the yield and flow stress was found with changes in the strain rate.

3.1.2. Process Maps

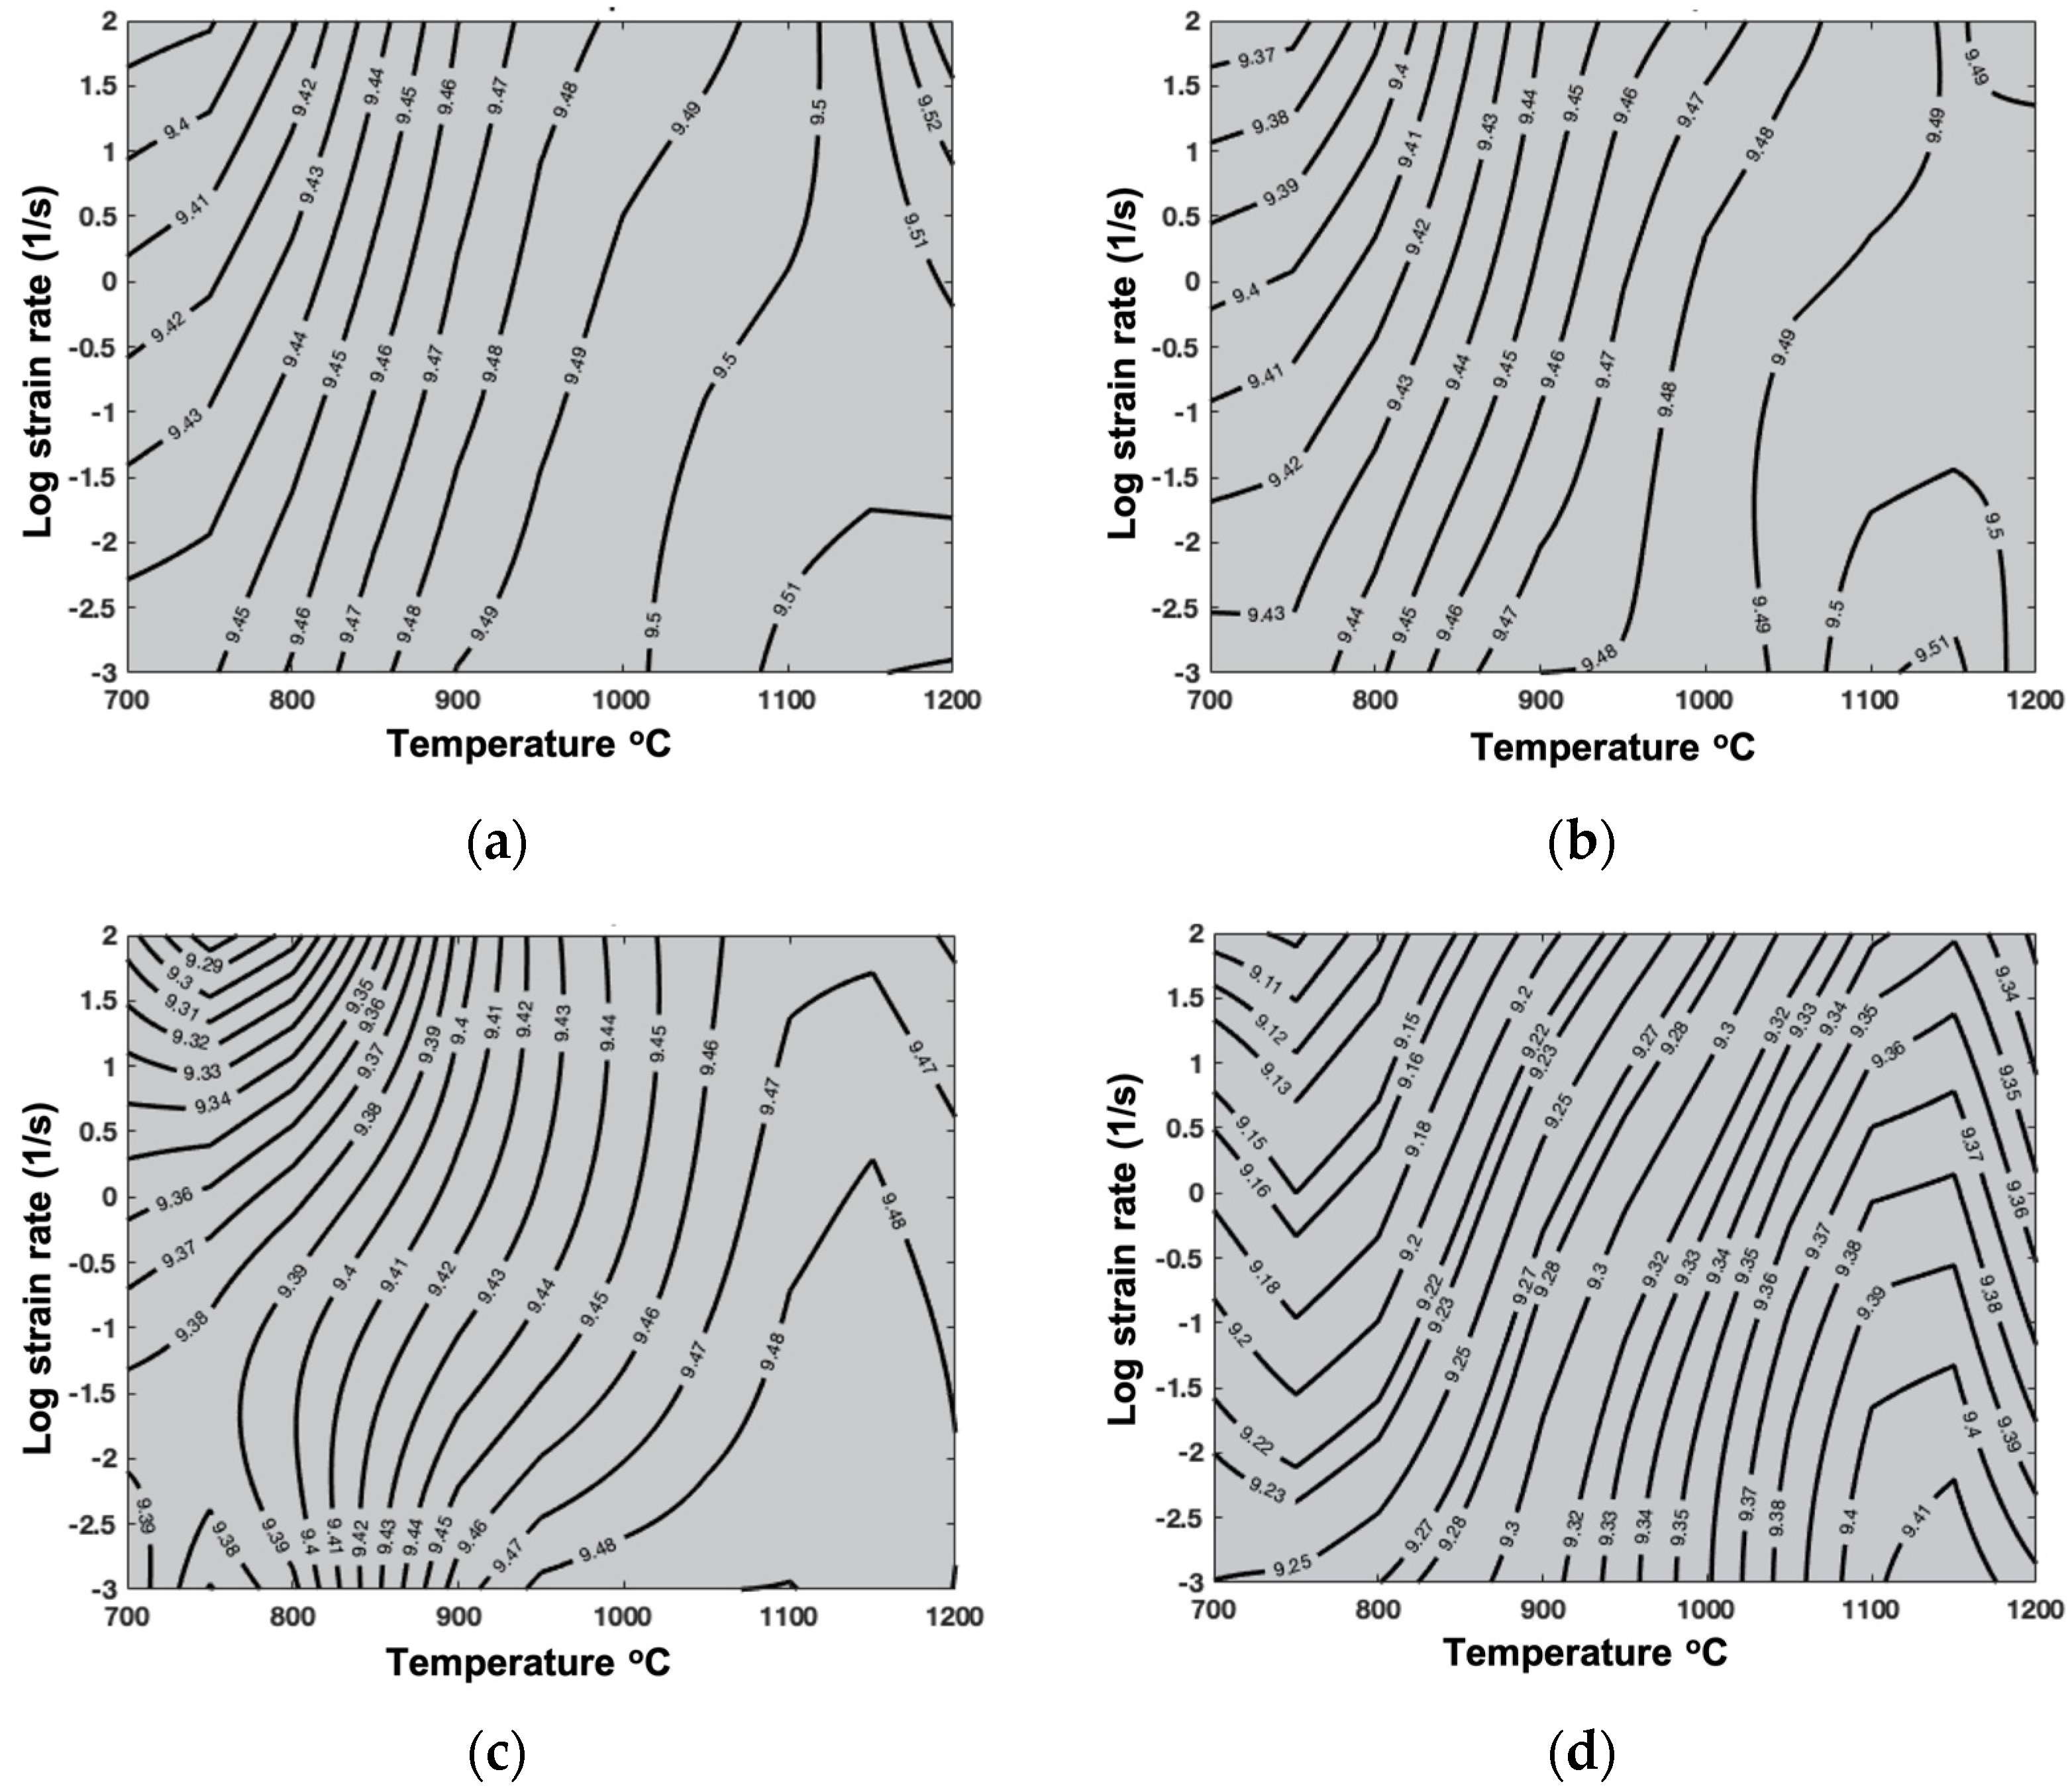
The process maps generated based on the simulation results at 0.2 true global strain are shown in Figure 8. The efficiency decreased as the percentage of zirconia increased in the composite material, and the decrease in efficiency corresponded to a decrease in the workability of the material. The efficiency of power dissipation decreased at high strain rates and increased at low strain rates, which was also reported in other studies [22,27].
The process maps obtained from numerical simulations also showed that only stable regions and no zones of instability were recorded. This effect probably occurred because the DAMASK crystal plasticity code does not include dynamic recrystallization [12]. The true stress either increased or remained unchanged in the hardening region in the simulation.

3.2. Local Results

3.2.1. Local Stress and Strain Maps

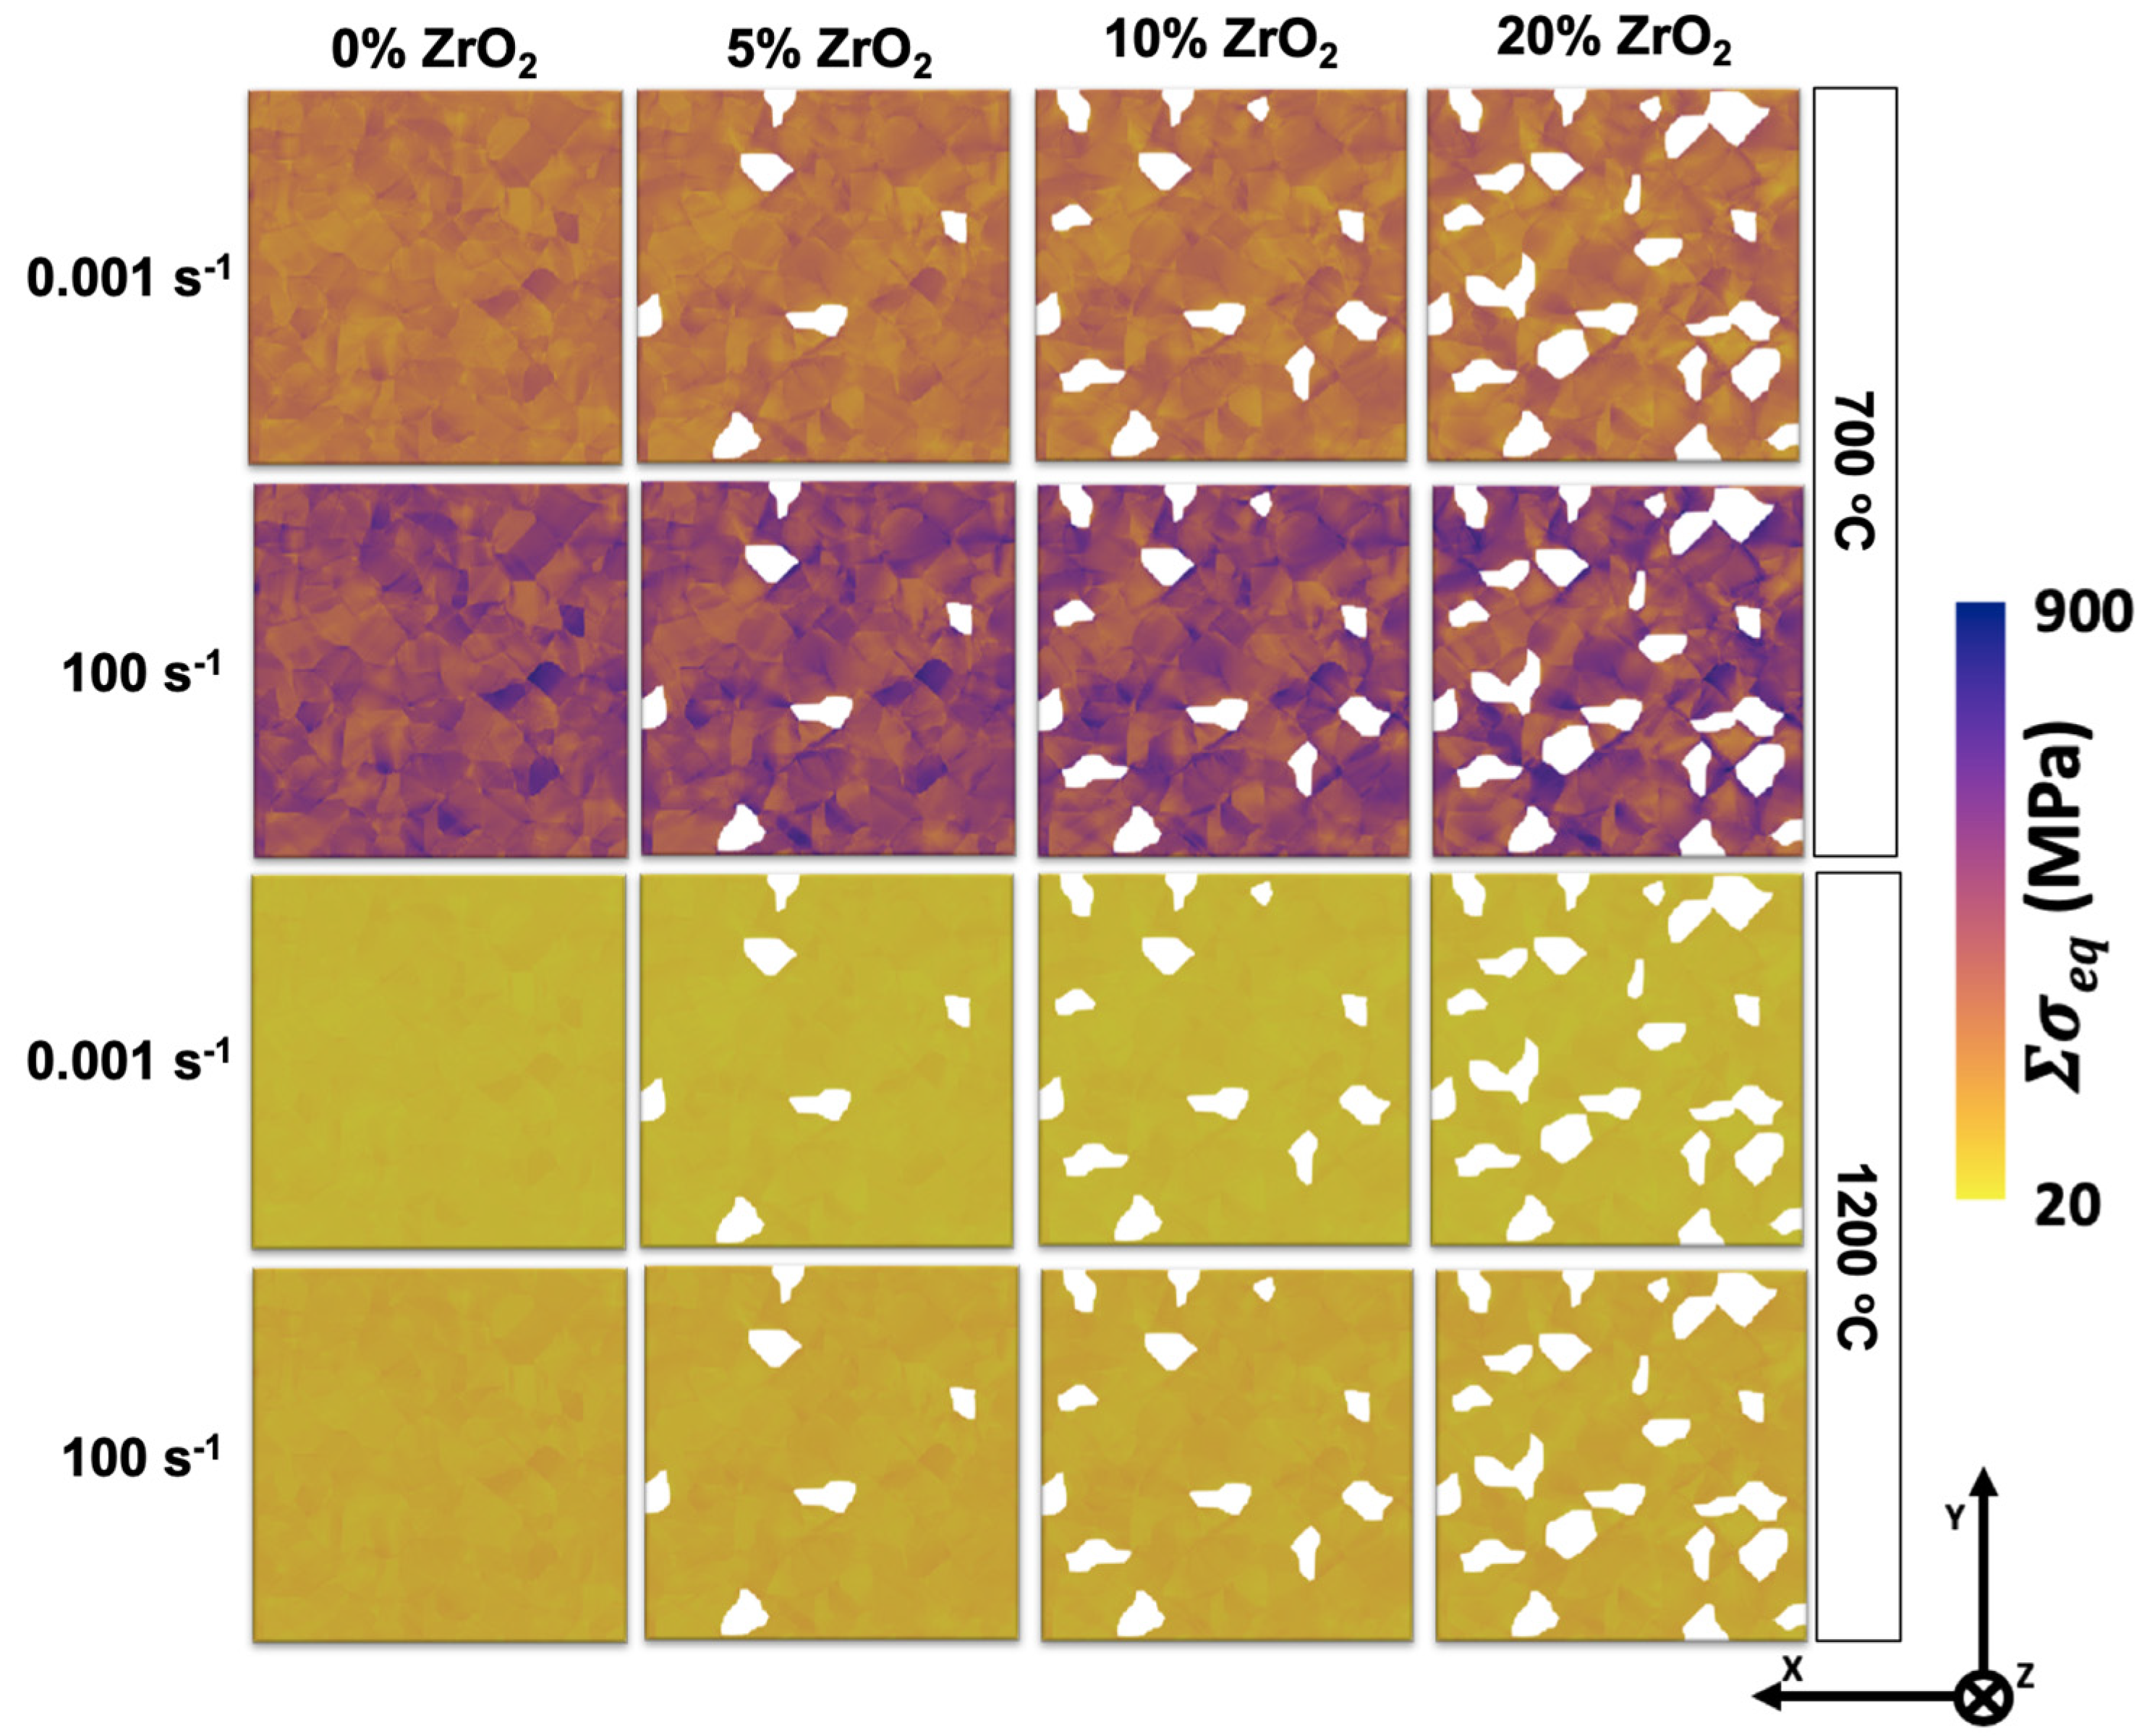
The evolution of local stress on the top surface of 2D RVEs at 0.1 true strain are shown in Figure 9. To show distinct differences in the results, extreme temperatures (700 and 1200 °C), and strain rates (0.001 and 100 s−1) were selected. In all materials, the average stress values of zirconia particles were approximately 1.5–2.3 GPa at 700 °C and 100 s−1, which was considerably higher than those of austenite particles (~0.45–0.5 GPa). Therefore, to avoid scale distortion while visualizing the stress distribution, the zirconia particles are not shown in these maps.
The stress distribution became heterogeneous after the zirconia particles were included, and the stress concentration was higher at the zirconia/austenite interface. The stress distribution in the whole matrix was non-uniform, as some grains had high stress and some had very low stress.
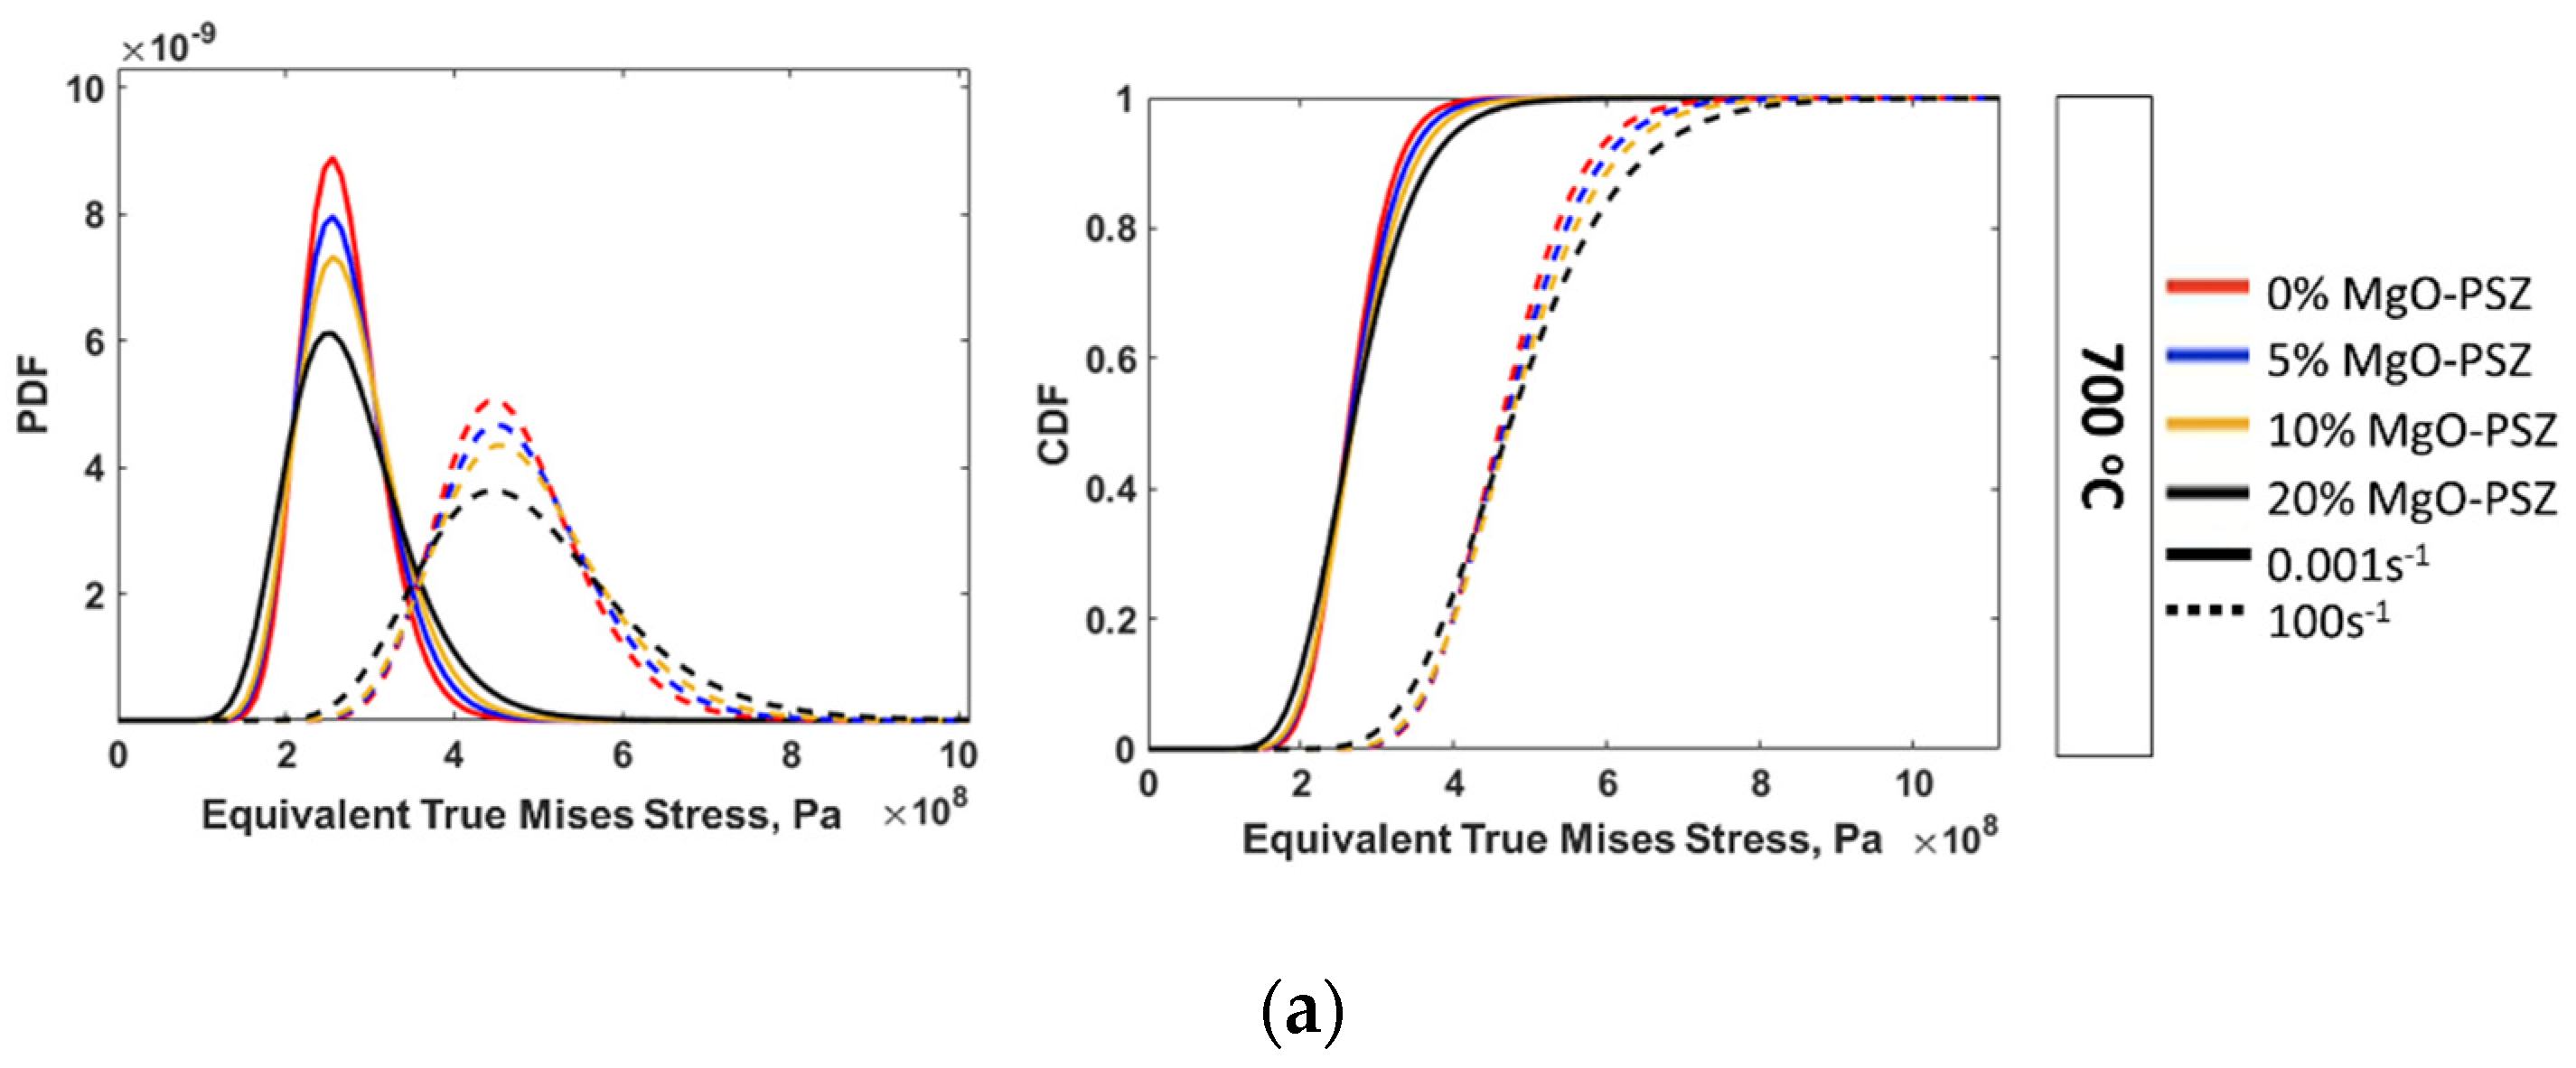
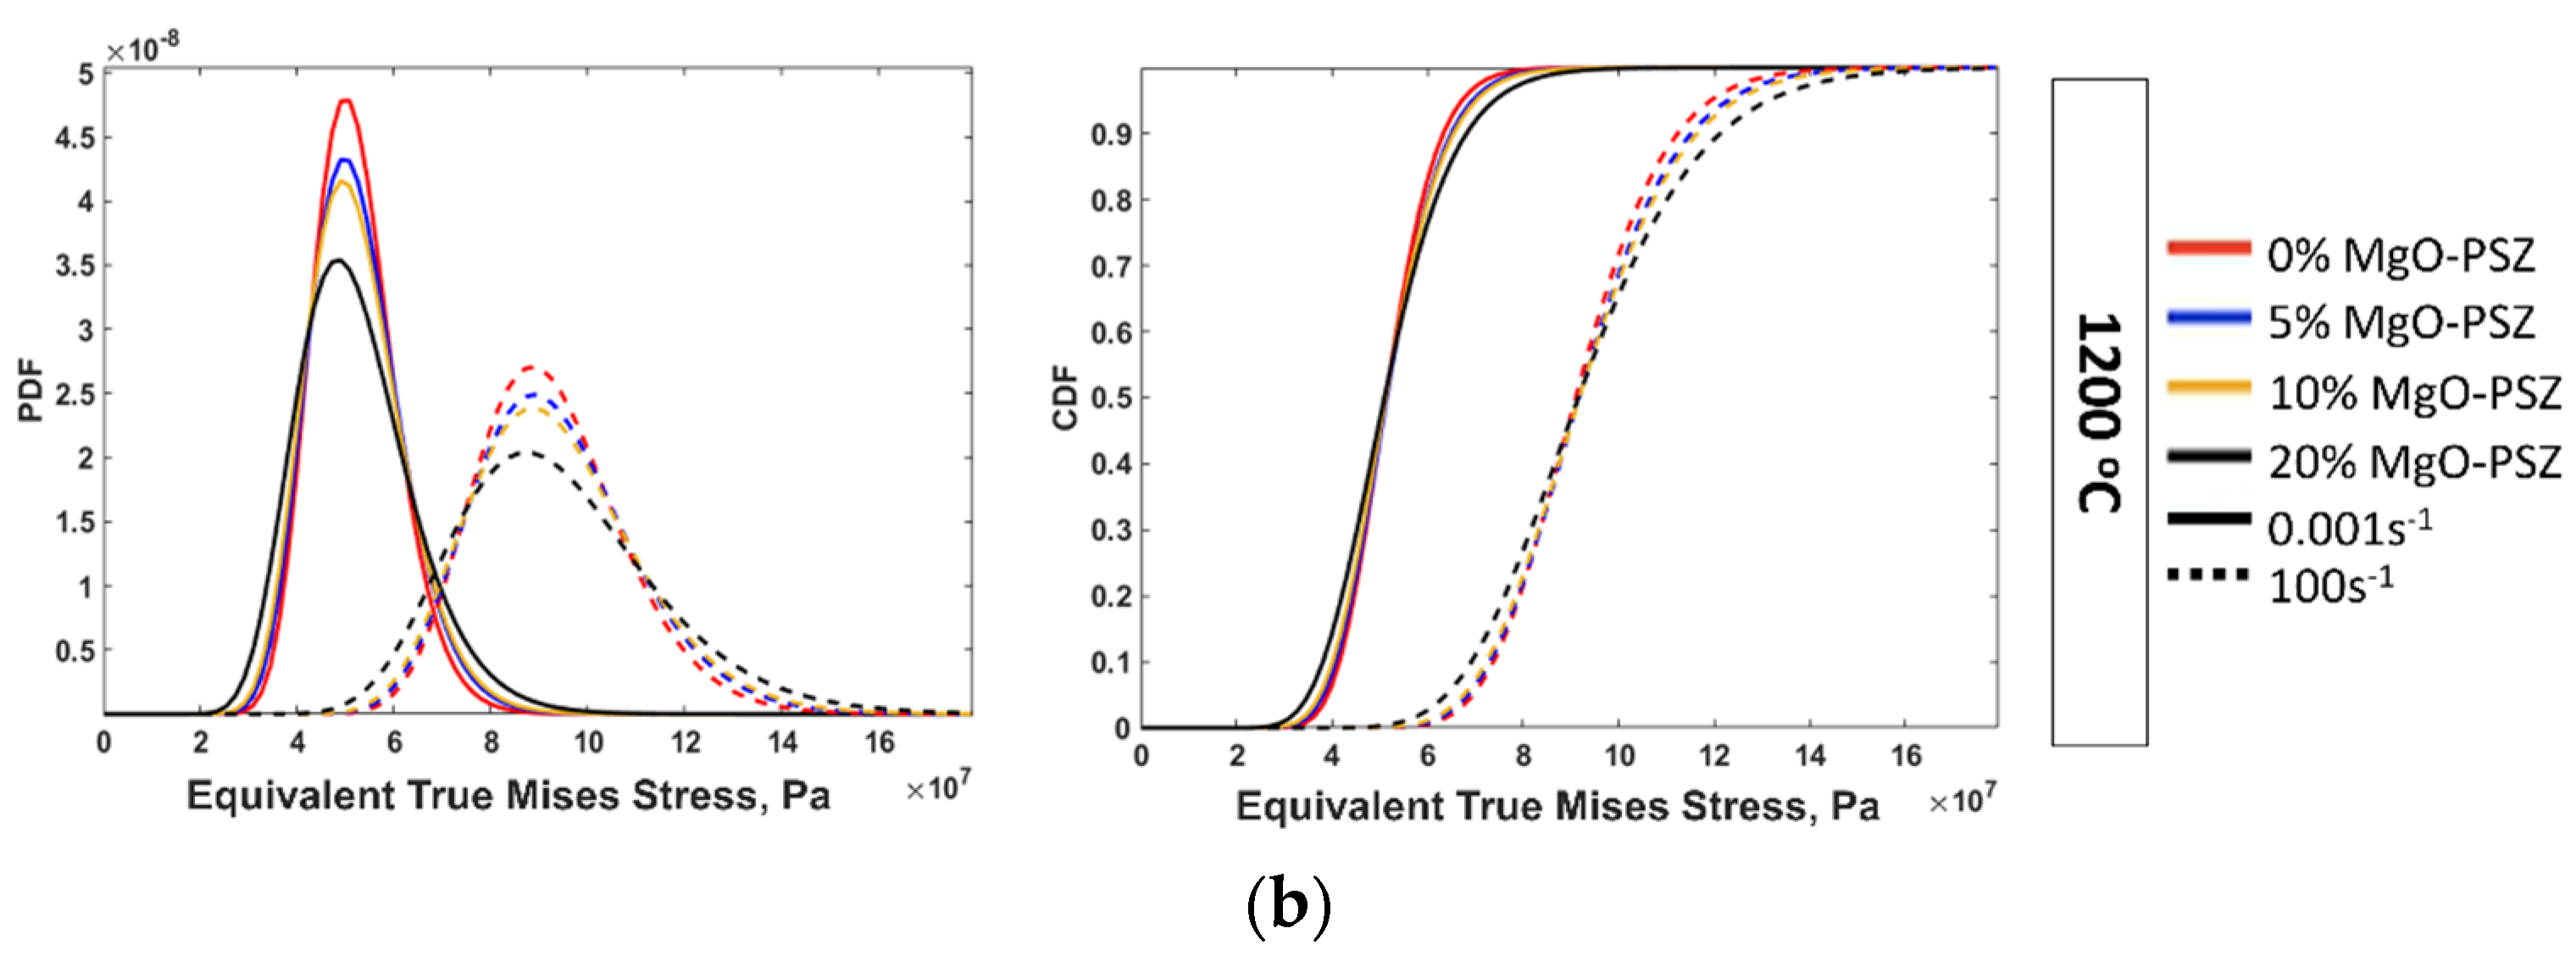
The stress distribution in RVEs was statistically analyzed to better understand the influence of zirconia particles addition in the material. The representation of the data as a probability density function (PDF) and a cumulative distribution function (CDF) can help to compare the simulation results of different materials quantitatively. The PDF and CDF for true stress are shown in Figure 10, where the true stress (in Pascal (Pa)) developed at a global strain.
The PDF and CDF at 700 °C and strain rates of 0.001 s−1 and 100 s−1 are shown in Figure 10a. The maximum stress points were around 0.26 GPa at 0.001 s−1 and 0.46 GPa at 100 s−1 for all compounds. The PDF and CDF at 1200 °C and strain rates of 0.001 s−1 and 100 s−1 are shown in Figure 10b. The maximum stress points were around 0.056 GPa at 0.001 s−1 and 0.095 GPa at 100 s−1 for all composites. In both cases, the distributions were relatively wider when the concentration of zirconia was higher in the austenite matrix. To clearly show the distributions, the scales in Figure 10a,b are of different orders.
The local strain maps are shown in Figure 11 with a true strain. The highest strain was recorded within the boundaries of the zirconia and austenite grains; however, the cumulative strain did not change in the matrix. The morphology and distribution of zirconia particles affected the distribution of local stress and strain during plastic deformation.
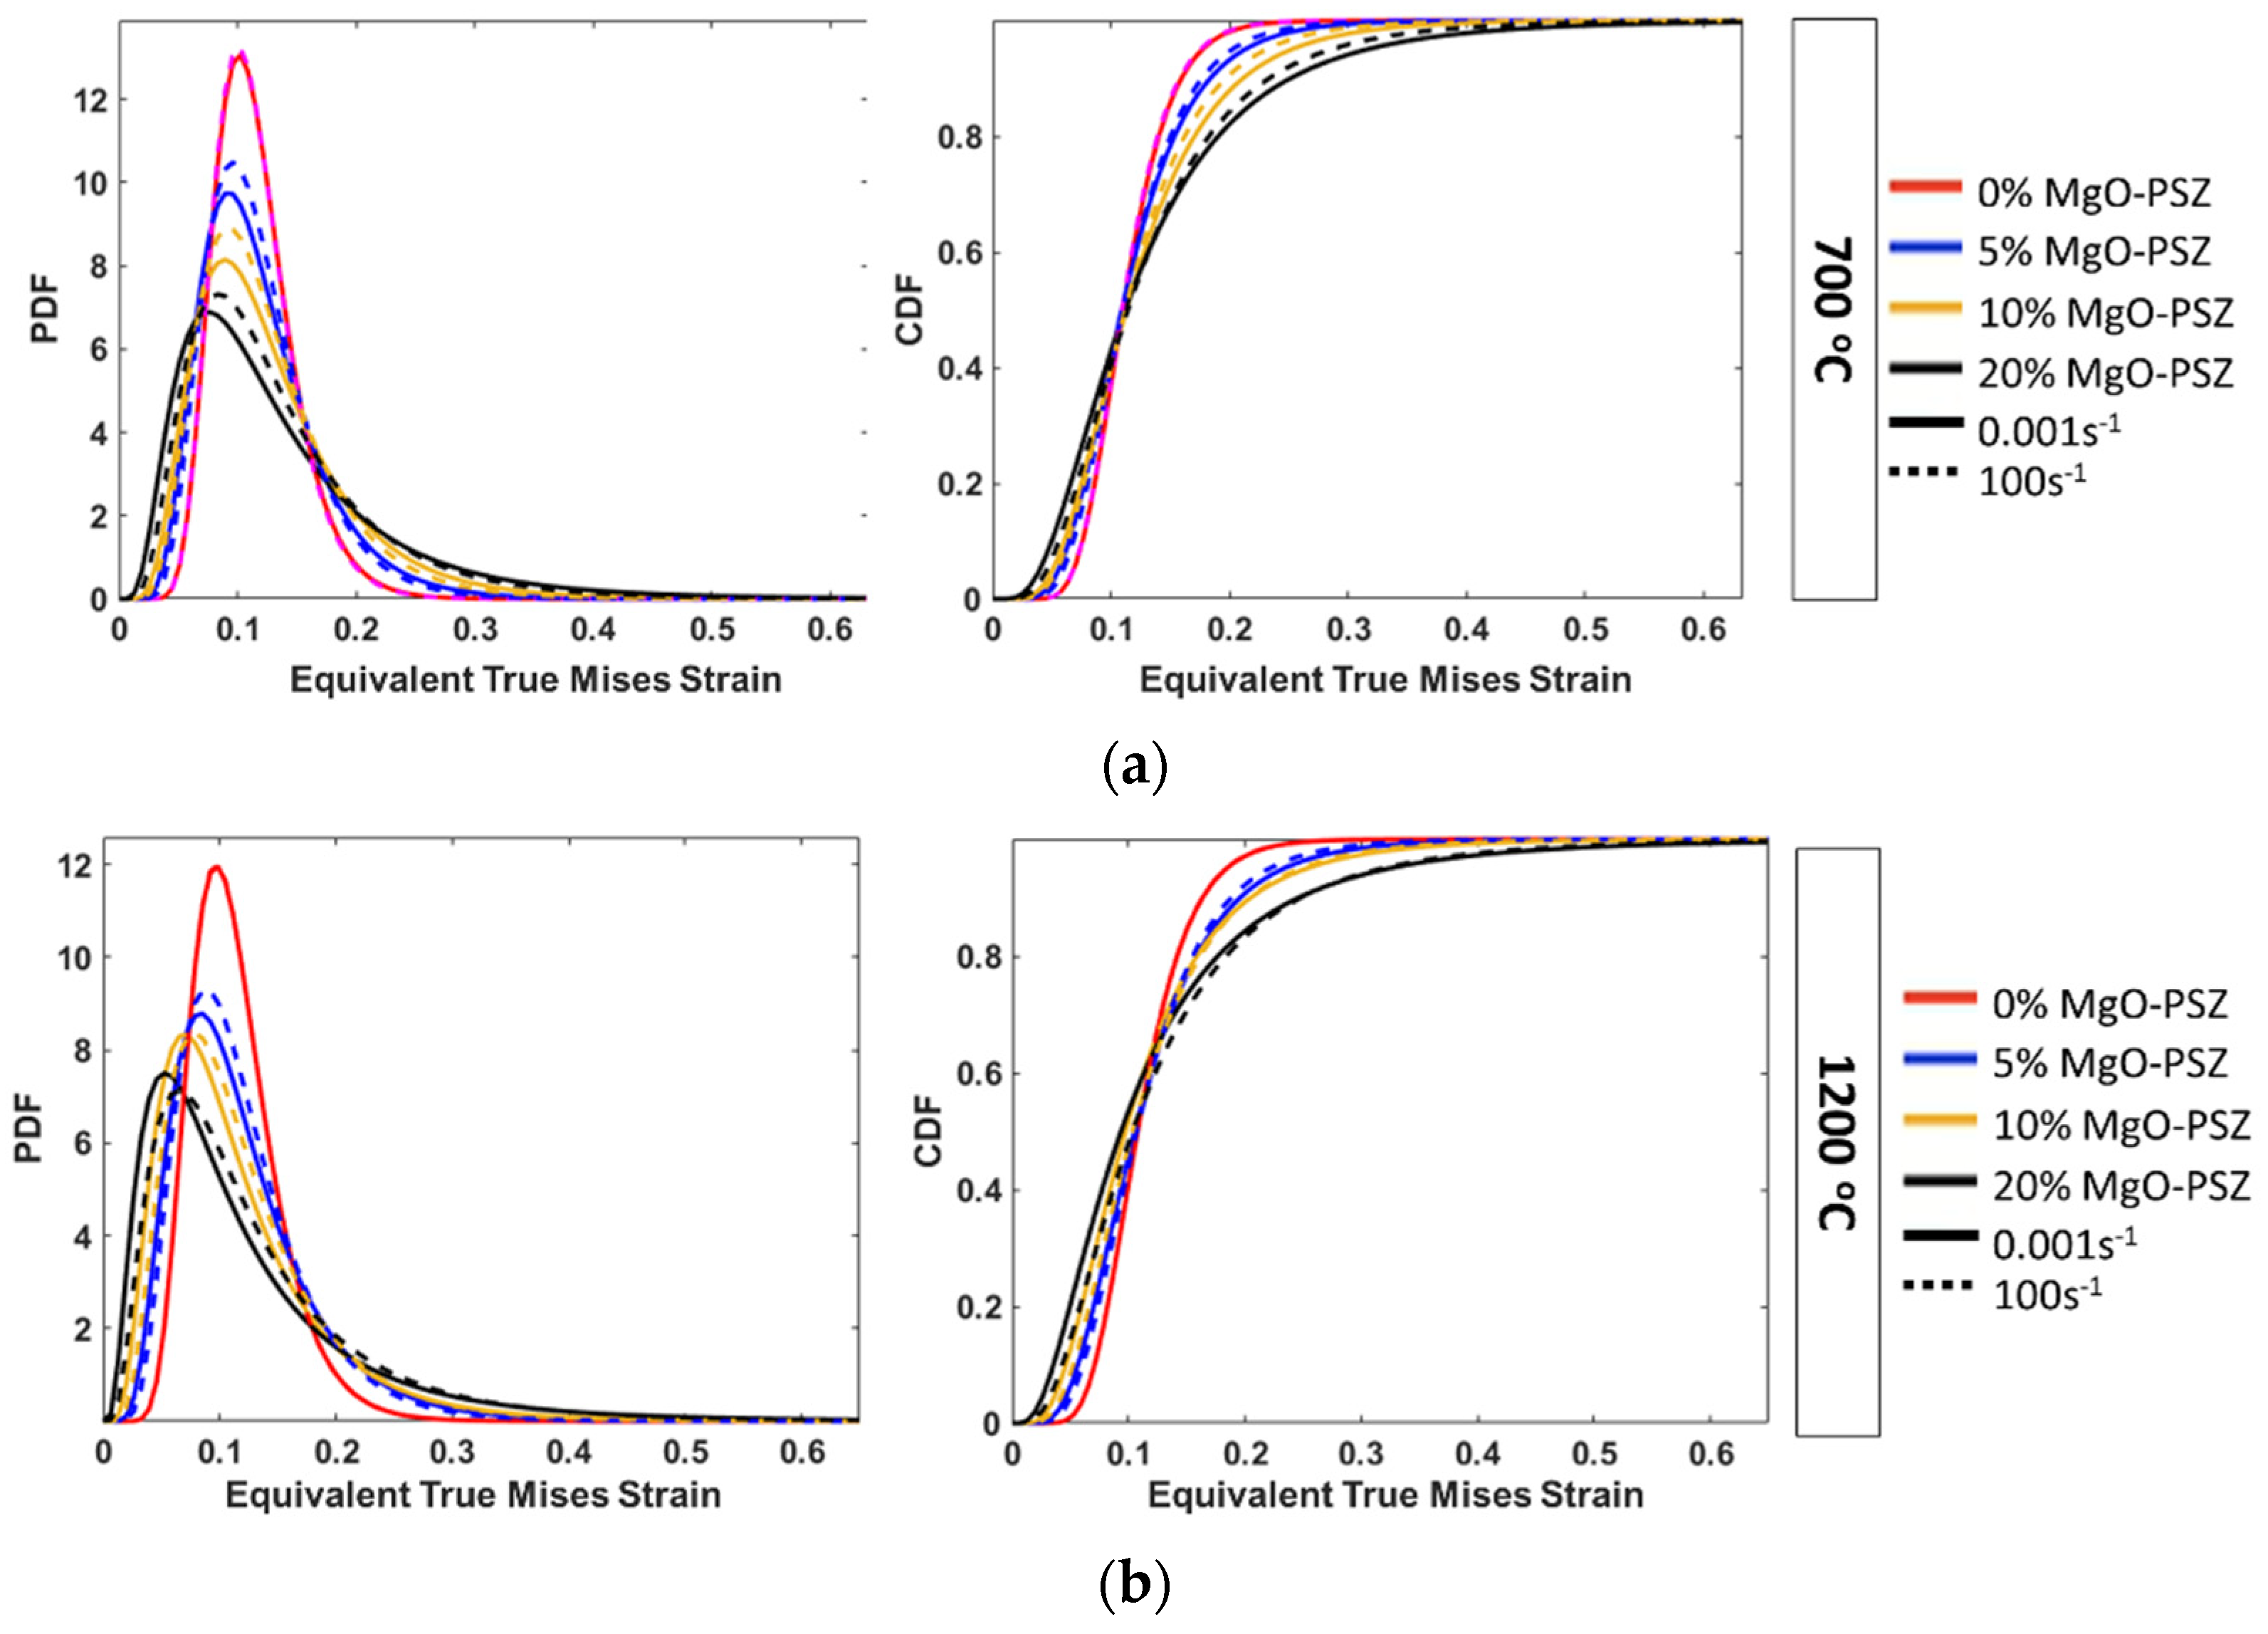
The graphs of the PDF and CDF for the local strain maps are shown in Figure 12. A similar trend was observed for 0% zirconia at strain rates of 0.001 s−1 and 100 s−1. An increase in zirconia inclusions resulted in lower distribution peak values and slightly wider dispersion. The composite also showed high local strain points in the matrix, which might cause material failure.

3.2.2. Local Stress Triaxiality Map

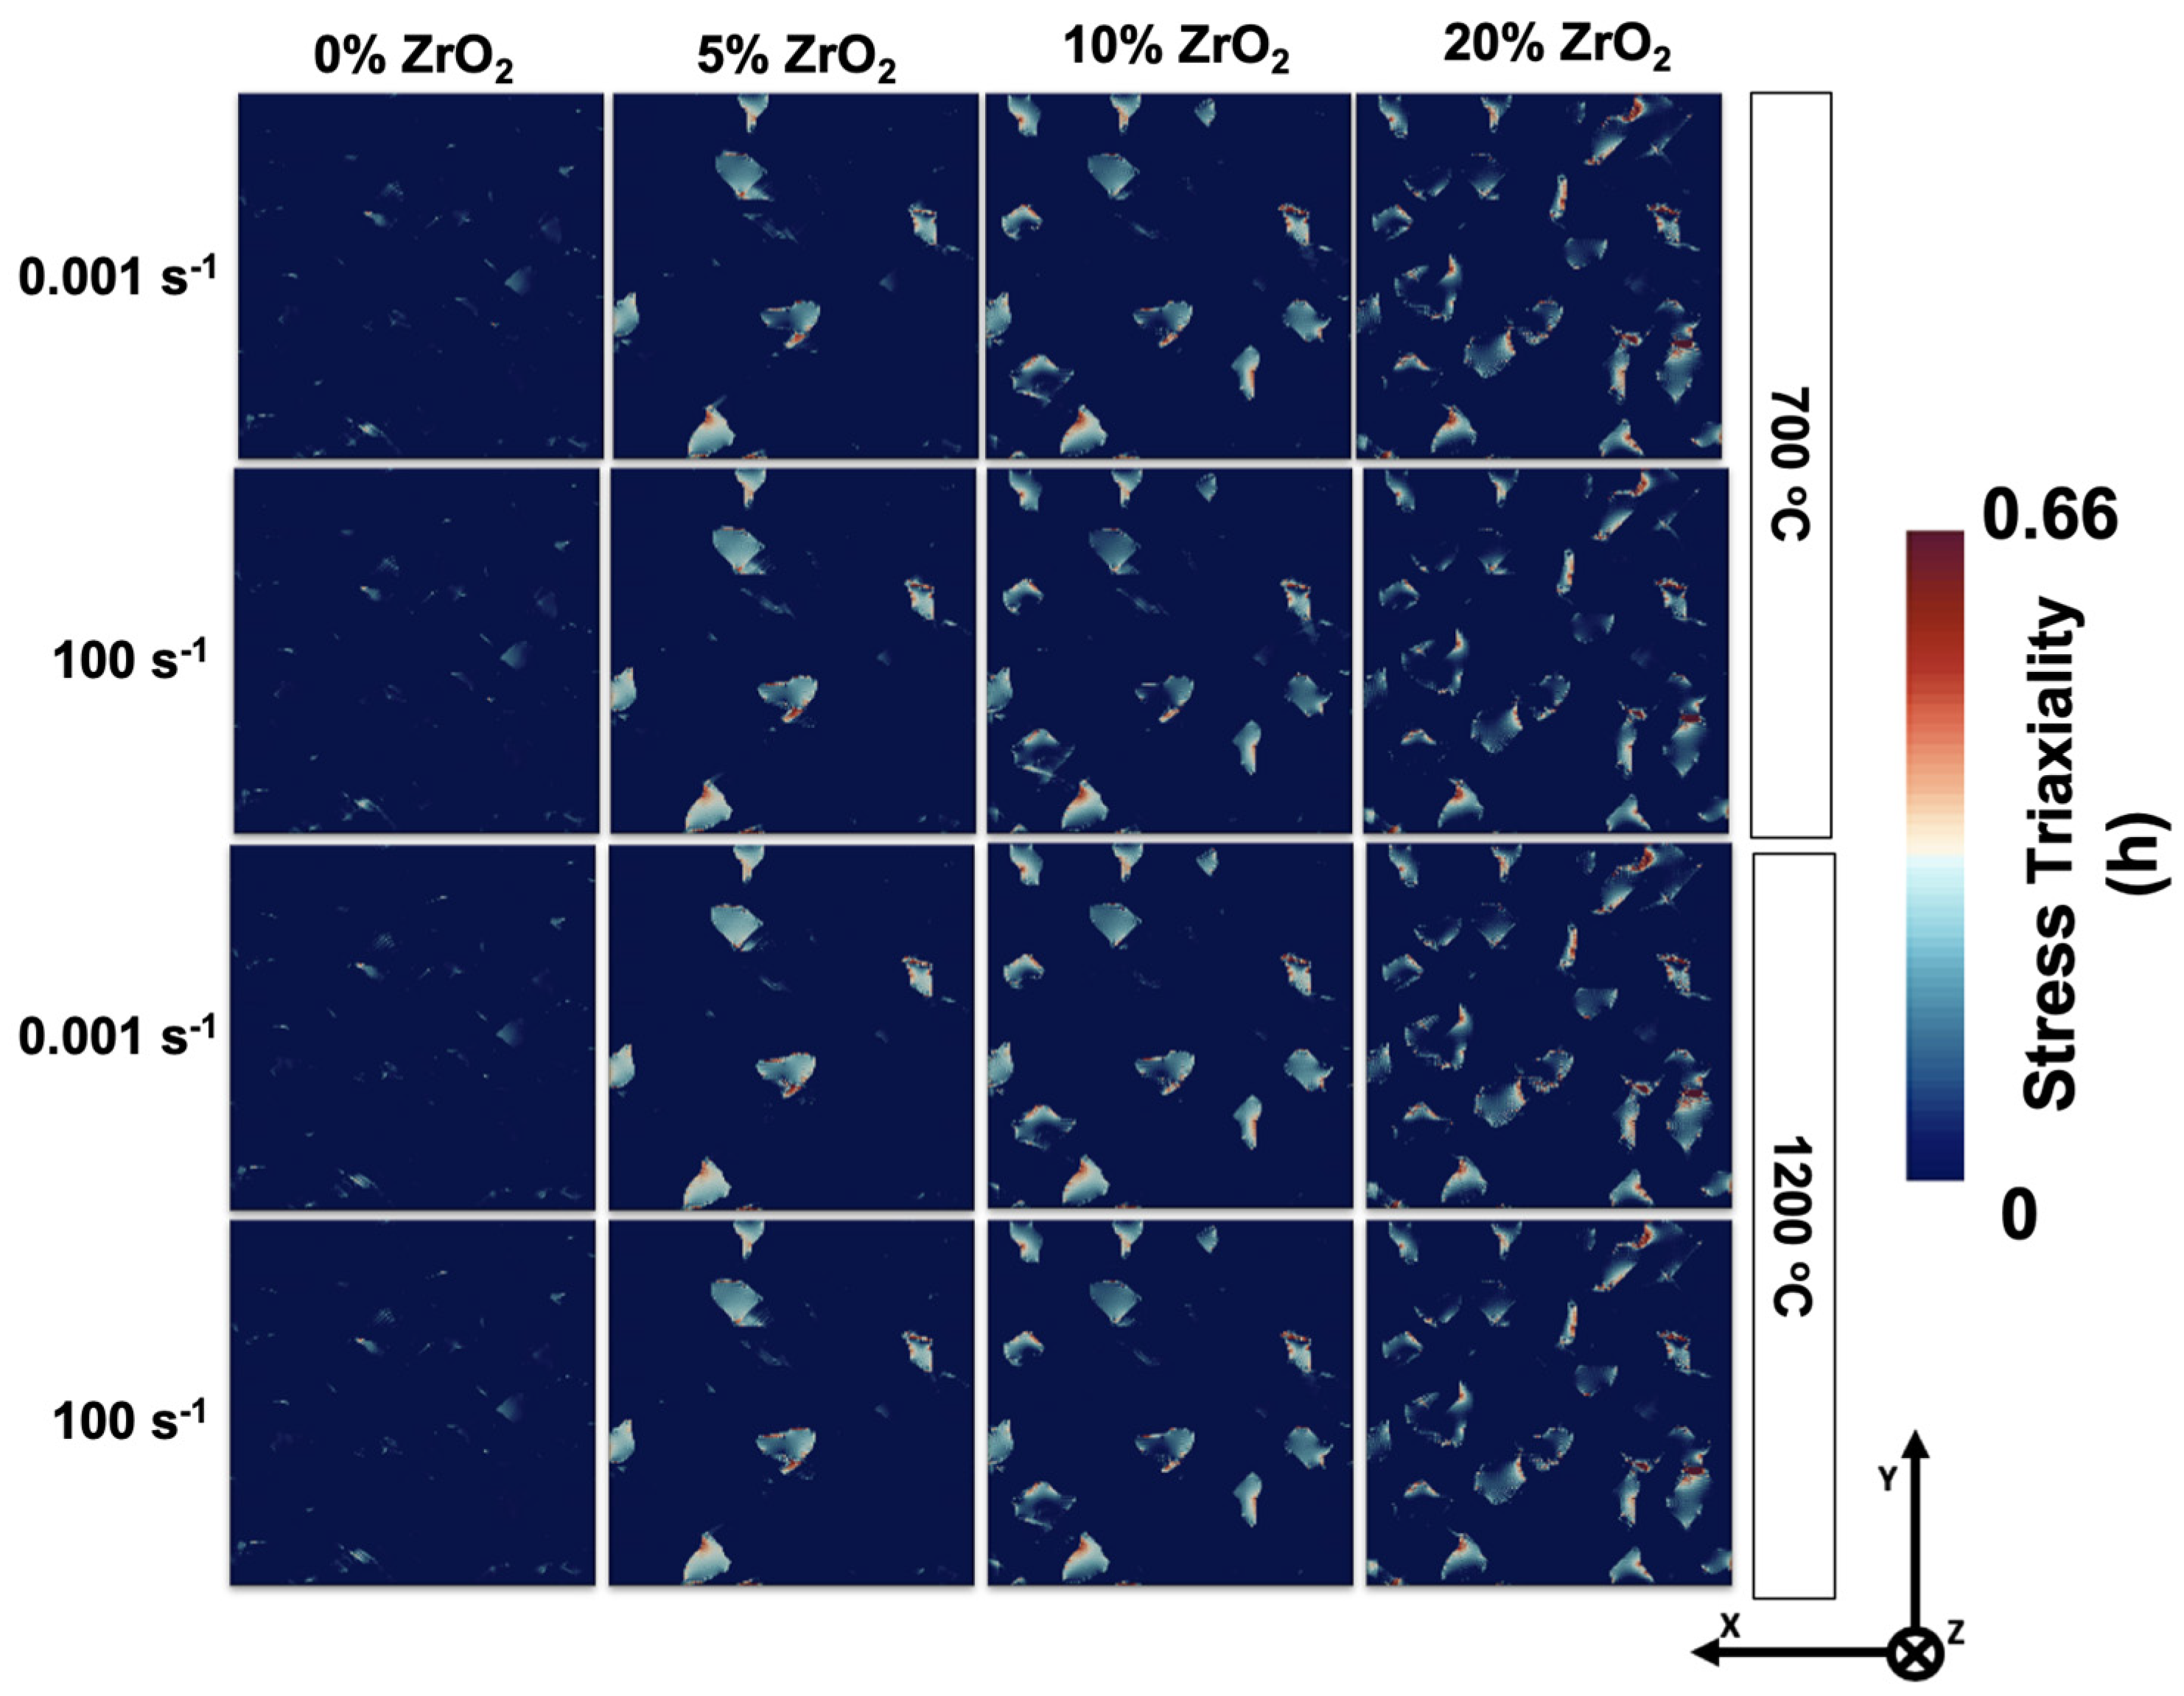
The triaxial local stress behavior of the 2D RVE for TRIP steel composites is shown in Figure 13. The stress triaxiality values (0.66) were higher at the interface between austenite grains and zirconia particles than in the whole matrix. The increase in the triaxial stress values corresponded to the higher values of hydrostatic stress, which triggered faster reshaping of or damage to the material and vice versa. Higher values caused brittle damage, while lower values caused ductile damage [28]. Hydrostatic stress can drive the nucleation of the void, and a higher value of hydrostatic stress indicates a faster increase in the growth of the dimension of the void.
Deviatoric stress is also responsible for changing the shape or geometry of these voids [29]. This might be attributed to the weak degradation at these interfaces and on the zirconia particles. The presence of more zirconia particles, such as that in a 20% compound, can cause the material to fail sooner because there are more zones of high triaxiality.

4. Discussion

In this study, the parameters of the fitted material model for TRIP steel and zirconia were calibrated by comparing the stress–strain behavior of the experimental results. In the simulation model, zirconia particles were assigned elastic properties. By comparing the results of numerical simulations and experiments, we found that at higher temperatures, dynamic softening occurred at lower strain values (Figure 6a). This might be related to the limitations of the DAMASK simulation model, which could not show dynamic softening and dynamic recrystallization (DRX) [12]. Previous studies have shown that a phase field (PF) model is needed to model DRX, which helps to understand the evolution of the microstructure or grain growth. Some studies have investigated ways to couple FFT-based models with the PF model to show DRX. Due to a few limitations [30], the model becomes complicated and unsuitable for studying dual-phase materials. To overcome this problem, process maps were developed at low true strain values of 0.2.
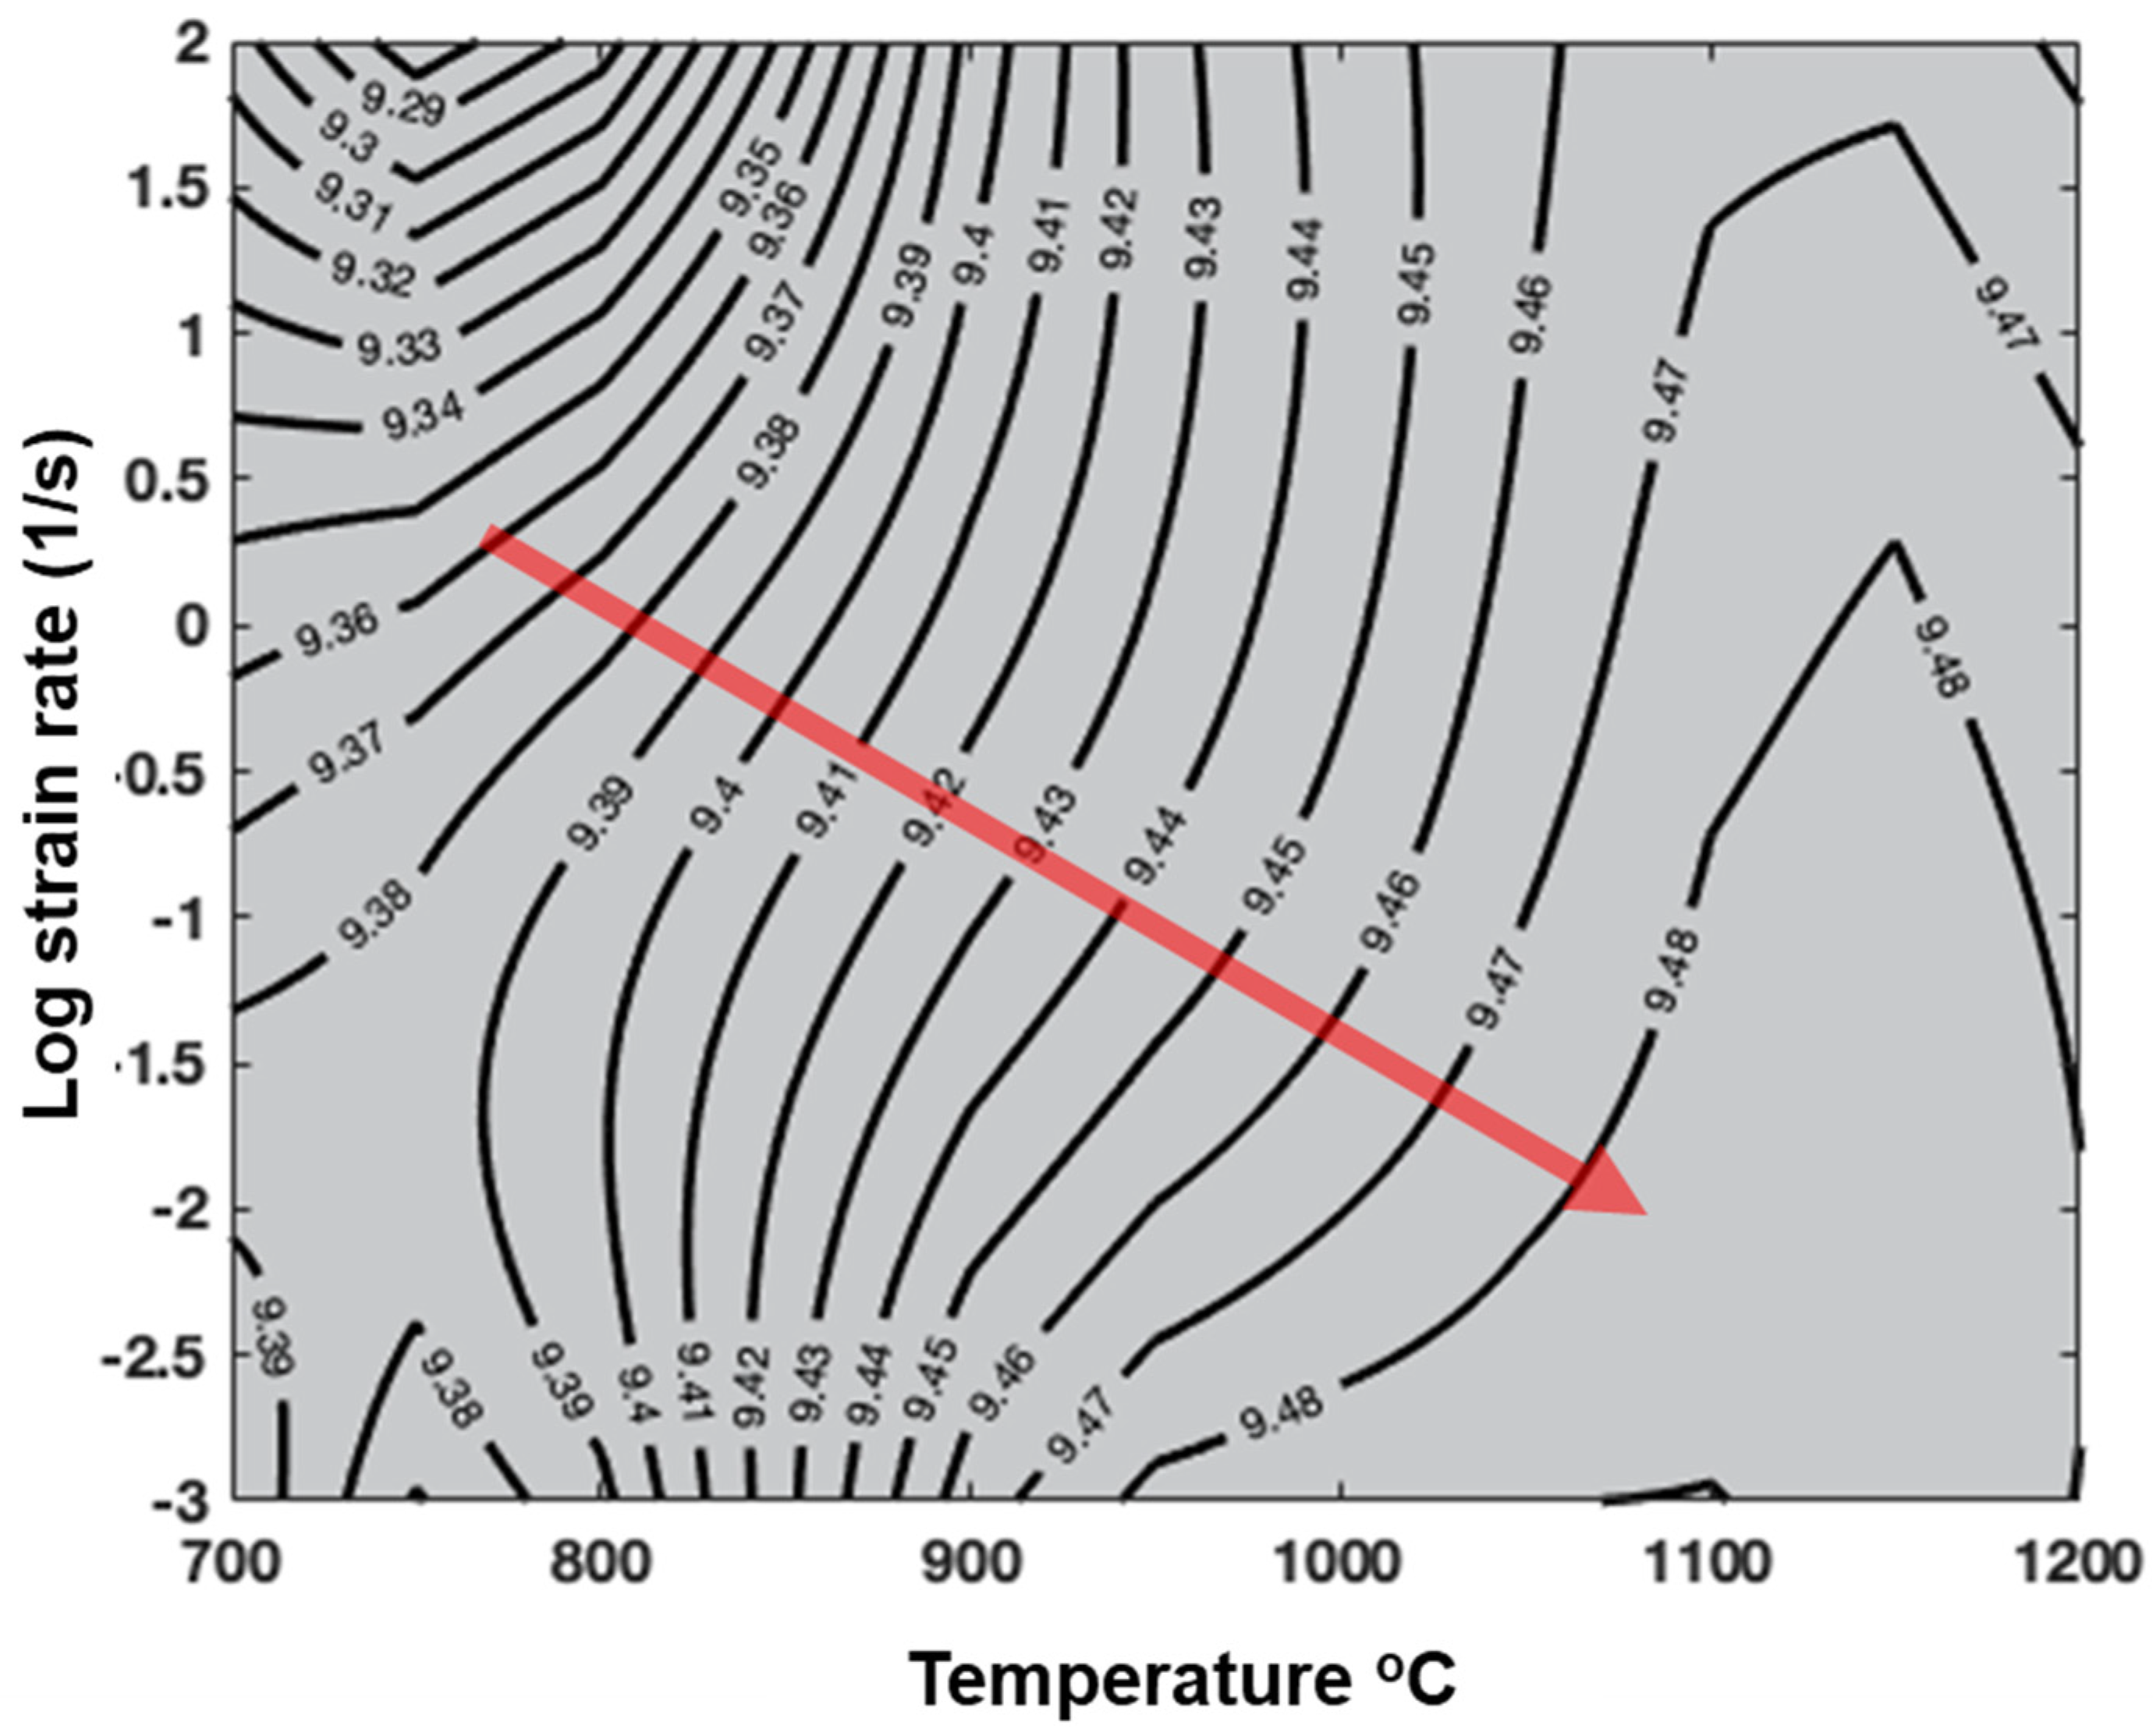
The process maps generated experimentally for compressible and incompressible TRIP steel MMCs using data from previous studies and those from the results of the numerical simulations in this study were similar. For example, the process maps for TRIP steel with 10% zirconia obtained from a study by Guk et al. [31] compared to those obtained from the simulations of this study are shown in Figure 14. The efficiency of power dissipation increased as we moved diagonally from the region of high strain rate and from low to high temperatures. A similar pattern was reported in a study by Kirschner et al. [17] regarding the process map for compressible TRIP steel with 5% zirconia and 10% residual porosity. A comparative trend between the results of the study by Kirschner et al. [17] and the simulation results of this study (Figure 15) is observed. When current trends are compared with previously published data, it is observed that the process maps obtained from the experiments were similar to the maps from the simulation results. However, the values of the efficiency of power dissipation varied among different materials.
In this study, we proposed an approach for developing process maps from numerical simulation data. Our results might help researchers when the CP and PF models for dual-phase materials coupled together are robust enough to closely mimic the thermomechanical behavior of the material at high temperatures.

5. Conclusions

In this study, we proposed a methodology to construct a process map based on the results of simulations. Crystal plasticity-based simulations were performed in DAMASK using an elasto-viscoplastic phenomenological model for austenitic matrix and Hooke’s elastic model for zirconia particles on TRIP steel MMCs with 0%, 5%, 10%, and 20% zirconia particle composites. The parameters of the material model were calibrated based on the experimental results for austenite and zirconia at 700 and 1200 °C and a strain rate of 0.1 s−1. The models of austenite and zirconia materials were calibrated to perform numerical simulations for composite materials. The global results were post-processed and process maps were developed. Similarly, local stress–strain and stress triaxiality maps were created to investigate deformation behavior with appropriate boundary conditions. Based on the findings of this study, we drew the following conclusions:
  • The proposed methodology for creating process maps might assist researchers in estimating process maps of zirconia-reinforced TRIP steel MMCs based on virtual laboratory setups with different microstructural attributes.
  • In this study, isotropic 3D 20 × 20 × 20 RVEs were proposed for global deformation behavior with 5%, 10%, and 20% second-phase particles. These RVEs behaved isotopically and yielded simulation results independent of the geometry and mesh dependence. Such RVEs might be used for calibrating model parameters by other researchers.
  • The modulus of elasticity for zirconia particles at different temperatures was determined by performing statistical analyses on the experimental data. For this, a four-point moving average of the experimentally determined slope values was selected from the entire dataset in the elastic zone. Although the identified values had a similar slope, they deviated from experimental observations significantly at temperatures below 900 °C.
  • At 0.2 strain, the value of global true stress was 30% higher for the composite containing 20% zirconia compared to the value of global true stress of pure TRIP steel matrix at all temperatures.
  • The phenomenological power law did not exhibit the experimentally observed dynamic softening behavior, which is why the identified process maps did not reflect the zones of instability. This limitation might be addressed in future studies by the inclusion of dynamic softening and recrystallization in this formulation.
  • By performing qualitative analysis, we found that the efficiency of power dissipation decreased with an increase in the zirconia concentration, which reduced its formability.
  • For comparing the inclusion of zirconia particles, statistical analysis of the simulation results presented as PDFs and CDFs for each material might be helpful. By performing this analysis, we found that the corresponding stress and strain heterogeneity increased significantly as the number of zirconia inclusions in a fixed steel matrix increased.
  • The zirconia particles exhibited the highest stress–strain partitioning at the ceramic/matrix interface, which probably caused interface decohesion in this material. The zirconia particles experienced the highest stress and the least strain during deformation.
  • The local stress triaxiality maps showed that increasing the percentage of zirconia in the composite increased the value of the stress triaxiality factor. This corresponded to an increase in the hydrostatic stress in the material, which might cause faster evolution of local damage.

Author Contributions

Conceptualization, M.A. and F.Q.; methodology, M.A. and S.T.; software, M.A., S.T. and F.Q.; validation, M.A. and S.T.; formal analysis, F.Q., S.G. and C.O.; investigation, M.A., F.Q., S.G. and S.T.; resources, F.Q., C.O. and S.G.; data curation, M.A. and S.T.; writing—original draft preparation, M.A., F.Q., S.G., C.O. and U.P.; writing—review and editing, M.A., F.Q., S.T., C.O., S.G., C.C. and U.P.; visualization, M.A. and S.T.; supervision, F.Q., C.O., C.C. and S.G.; project administration, S.G., C.O., C.C. and U.P.; funding acquisition, U.P. and C.C. All authors have read and agreed to the published version of the manuscript.

Funding

This research did not receive external funding.

Data Availability Statement

The simulation data are not publicly available but can be shared upon request.

Acknowledgments

The authors acknowledge the DAAD Faculty Development for Candidates (Balochistan), 2016 (57245990) HRDI-UESTP/UET funding scheme in cooperation with the Higher Education Commission of Pakistan (HEC) for sponsoring the stay of Faisal Qayyum at IMF TU Freiberg. This work was carried out with the DFG-funded collaborative research group TRIP Matrix Composites (SFB 799). We thank the German Research Foundation (DFG) for the financial support of SFB 799. The authors also acknowledge the support of Markus Kirschner for his help with the process map calculations. Finally, the relevant authorities at Universität Duisburg-Essen, Germany, and TU BAF Germany are greatly acknowledged for providing research exchange opportunities to Muhammad Ali. He completed a Master’s thesis at the Institute of Metal Forming, TU BAF Germany.

Conflicts of Interest

The authors declare no conflict of interest.

Nomenclature

Acronym
SymbolDescription
2DTwo-Dimensional
3DThree-Dimensional
CPCrystal Plasticity
CPFEMCrystal Plasticity Finite Element Method
CPUCentral Processing Unit
CDFCumulative Distribution Function
DAMASKDüsseldorf Advanced Materials Simulation Kit
DMMDynamic Material Model
DRXDynamic Recrystallization
FFTFast Fourier Transform
GHzGiga Hertz
MMCMetal Matrix Composite
MPaMega Pascal
PDFProbability Density Function
PFPhase Field
RVERepresentative Volume Element
TRIPTransformation Induced Plasticity

Appendix A

Appendix A.1. Phenomenological Power Law

For the austenite matrix, a crystal plasticity phenomenological power law is used in the work. In crystal plasticity simulation, the multiplicative decomposition of deformation gradient is defined as follows,
F = F e F p
where F e indicates the rigid body rotations and elastic deformation of the lattice. F p represents plastic deformation gradient and for the evolution of plastic deformation. To develop the kinematics of the finite deformations, the spatial gradient of total velocity, L is required for time rate of the deformation gradient, F ˙ and is defined as follows,
L = F ˙ F 1
where F 1 = F p 1 F e 1 . The L could be decomposed into elastic velocity gradient, L e , and plastic velocity gradient, L p , by combining Equations (A1) and (A2) as follows,
L = F ˙ e F e 1 + F e ( F ˙ p F p 1 ) F e 1 = L e + F e L p F e 1
As shown, the plastic deformation evolves as follows,
F ˙ p = L p F p
In the case of phenomenological constitutive models, the dislocation slip is regarded as the only deformation mechanism. Thus, the plastic velocity gradient, L p , could be expressed as sum of the shear rates on all slip system as follows,
L p = α = 1 n γ ˙ α m α n α
where m α and n α are unit vectors for the slip direction and normal to the slip plane of system α . n is the number of slip system. In addition, γ ˙ α is the shearing rate on the slip system α . Considering the phenomenological models, the shearing rate, γ ˙ α can be derived as,
γ ˙ α = γ ˙ 0 | τ α S α | n sgn ( τ α )
where γ ˙ 0 is the reference shearing rate, τ α is resolved shear stress, S α is initial slip resistance, n is stress exponent as stated in Table 2.
The evolution of slip resistance can be derived as,
S ˙ α = q α β [ h 0 ( 1 S α S s ) w ] | γ ˙ β |
where q α β is the measure for latent hardening, h 0 is slip hardening parameter, S s is slip hardening parameter which is assumed to be identical for all slip systems owing to the underlying characteristic dislocation reactions, and w is curve fitting parameter.

Appendix A.2. Dynamic Material Model

According to DMM, at a given temperature in hot work on the material, the dissipated power by the workpiece can be represented in the following equation [32]:
P = σ ε ˙ = 0 ε ˙ σ d ε ˙ + 0 σ ε ˙ d σ = G + J
where σ is the stress and ε ˙ is the strain rate. The first integral part is called the G content, which corresponds to the conduction entropy owing to the change in temperature due to plastic flow into colder parts of the material. The second part is called the J co-content, as it is a complementary part of the G content related to microstructural dissipations [22]. The representation of G and J can be seen in Figure A1 [5].
Figure A1. (a) Schematic representation of the constitutive equation in a non-linear dissipator (b) Ideal linear dissipator [5].
Metals 12 02174 g0a1
For plastically deforming material, the relationship between strain rate and stress can be expressed as a power law.
σ = K ε ˙ m
where K is the material fitting parameter and m is the sensitivity of the strain rate. Assume that K and m have a very weak dependence on ε ˙ over a narrow range [22]. Using Equation (A9), it is possible to represent parameters G and J numerically:
G = 0 ε ˙ σ d ε ˙ = σ ε ˙ m + 1
J = 0 ε ˙ ε ˙ d σ = σ ε ˙ m m + 1
The sensitivity of the strain rate can be derived through the stress partial derivative of the logarithm to the logarithm of strain as follows from Equation (A9)
d J d G = ε ˙ d σ σ d ε ˙ = log e ( σ ) log e ( ε ˙ ) = log 10 ( σ ) log 10 ( ε ˙ ) = m
The relationship of log 10 σ and log 10 ε ˙ can be solved by curve fitting the cubic polynomial equation as follows:
log 10 σ = a + b log 10 ε ˙ + c log 10 ε ˙ 2 + d log 10 ε ˙ 3
Here (a, b, c, and d) are the curve fitting constants depending on the temperature and strain rate. The slope of a curve between log 10 σ and log 10 ε ˙ can be defined as strain rate sensitivity m, which can be represented as the following equation:
m = log 10 ( σ ) log 10 ( ε ˙ ) = b + 2 c log 10 ε ˙ + 3 d log 10 ε ˙ 2
When m = 1, as in Figure A1b, the material exhibits the maximum possible power dissipation, the part of the J becomes Jmax, and Equation (A11) can be represented as
J max = σ ε ˙ 2
Therefore, the efficiency of power dissipation can be calculated from Equations (A11) and (A15) as follows:
η = J J max = 2 m m + 1
If the rate of entropy production or dissipation of power during suitable workability does not evolve according to the input process parameters in terms of strain rate and temperature, then the energy flow becomes localized and causes instability in the system. The flow instabilities can be related to adiabatic shear bands, flow localization, dynamic recrystallization (DRX), dynamic strain aging, etc. According to Ziegler [32], a stable flow will occur if the system justifies the inequality of Equation (A17):
D R < D R
where R = ε ˙   ε ˙ , and D is the dissipation function that crosses the cocontent J of the dissipative system, that is, D = J. Ref. [22] further simplified Equation (A17) and formulated dimensionless instability criteria as in Equation (A18).
ξ ( ε ˙ ) = log 10 ( m m + 1 ) log 10 ε ˙ + m < 0
Substituting the value of m from Equation (A14) into Equation (A18), the simplified form of the instability parameter can be represented as follows:
ξ ( ε ˙ ) = 2 c + 2 d log 10 ε ˙ ( m + 1 ) ( m ) log e 10 + m < 0
The simplified parameter shown in Equation (A12) represents instability in the system if the values are less than zero. Like the efficiency of power dissipation, the instability criteria are influenced by strain rate and temperature. Therefore, m can be calculated from Equation (A14), and the values of the efficiencies and instability parameters from Equations (A16) and (A19) can be plotted on the 2D or 3D contour plot as the third axis, where the x-axis represents the temperature and the y-axis shows log10 of the strain rate.

Appendix B. Zirconia Material Model Parameters Calculations
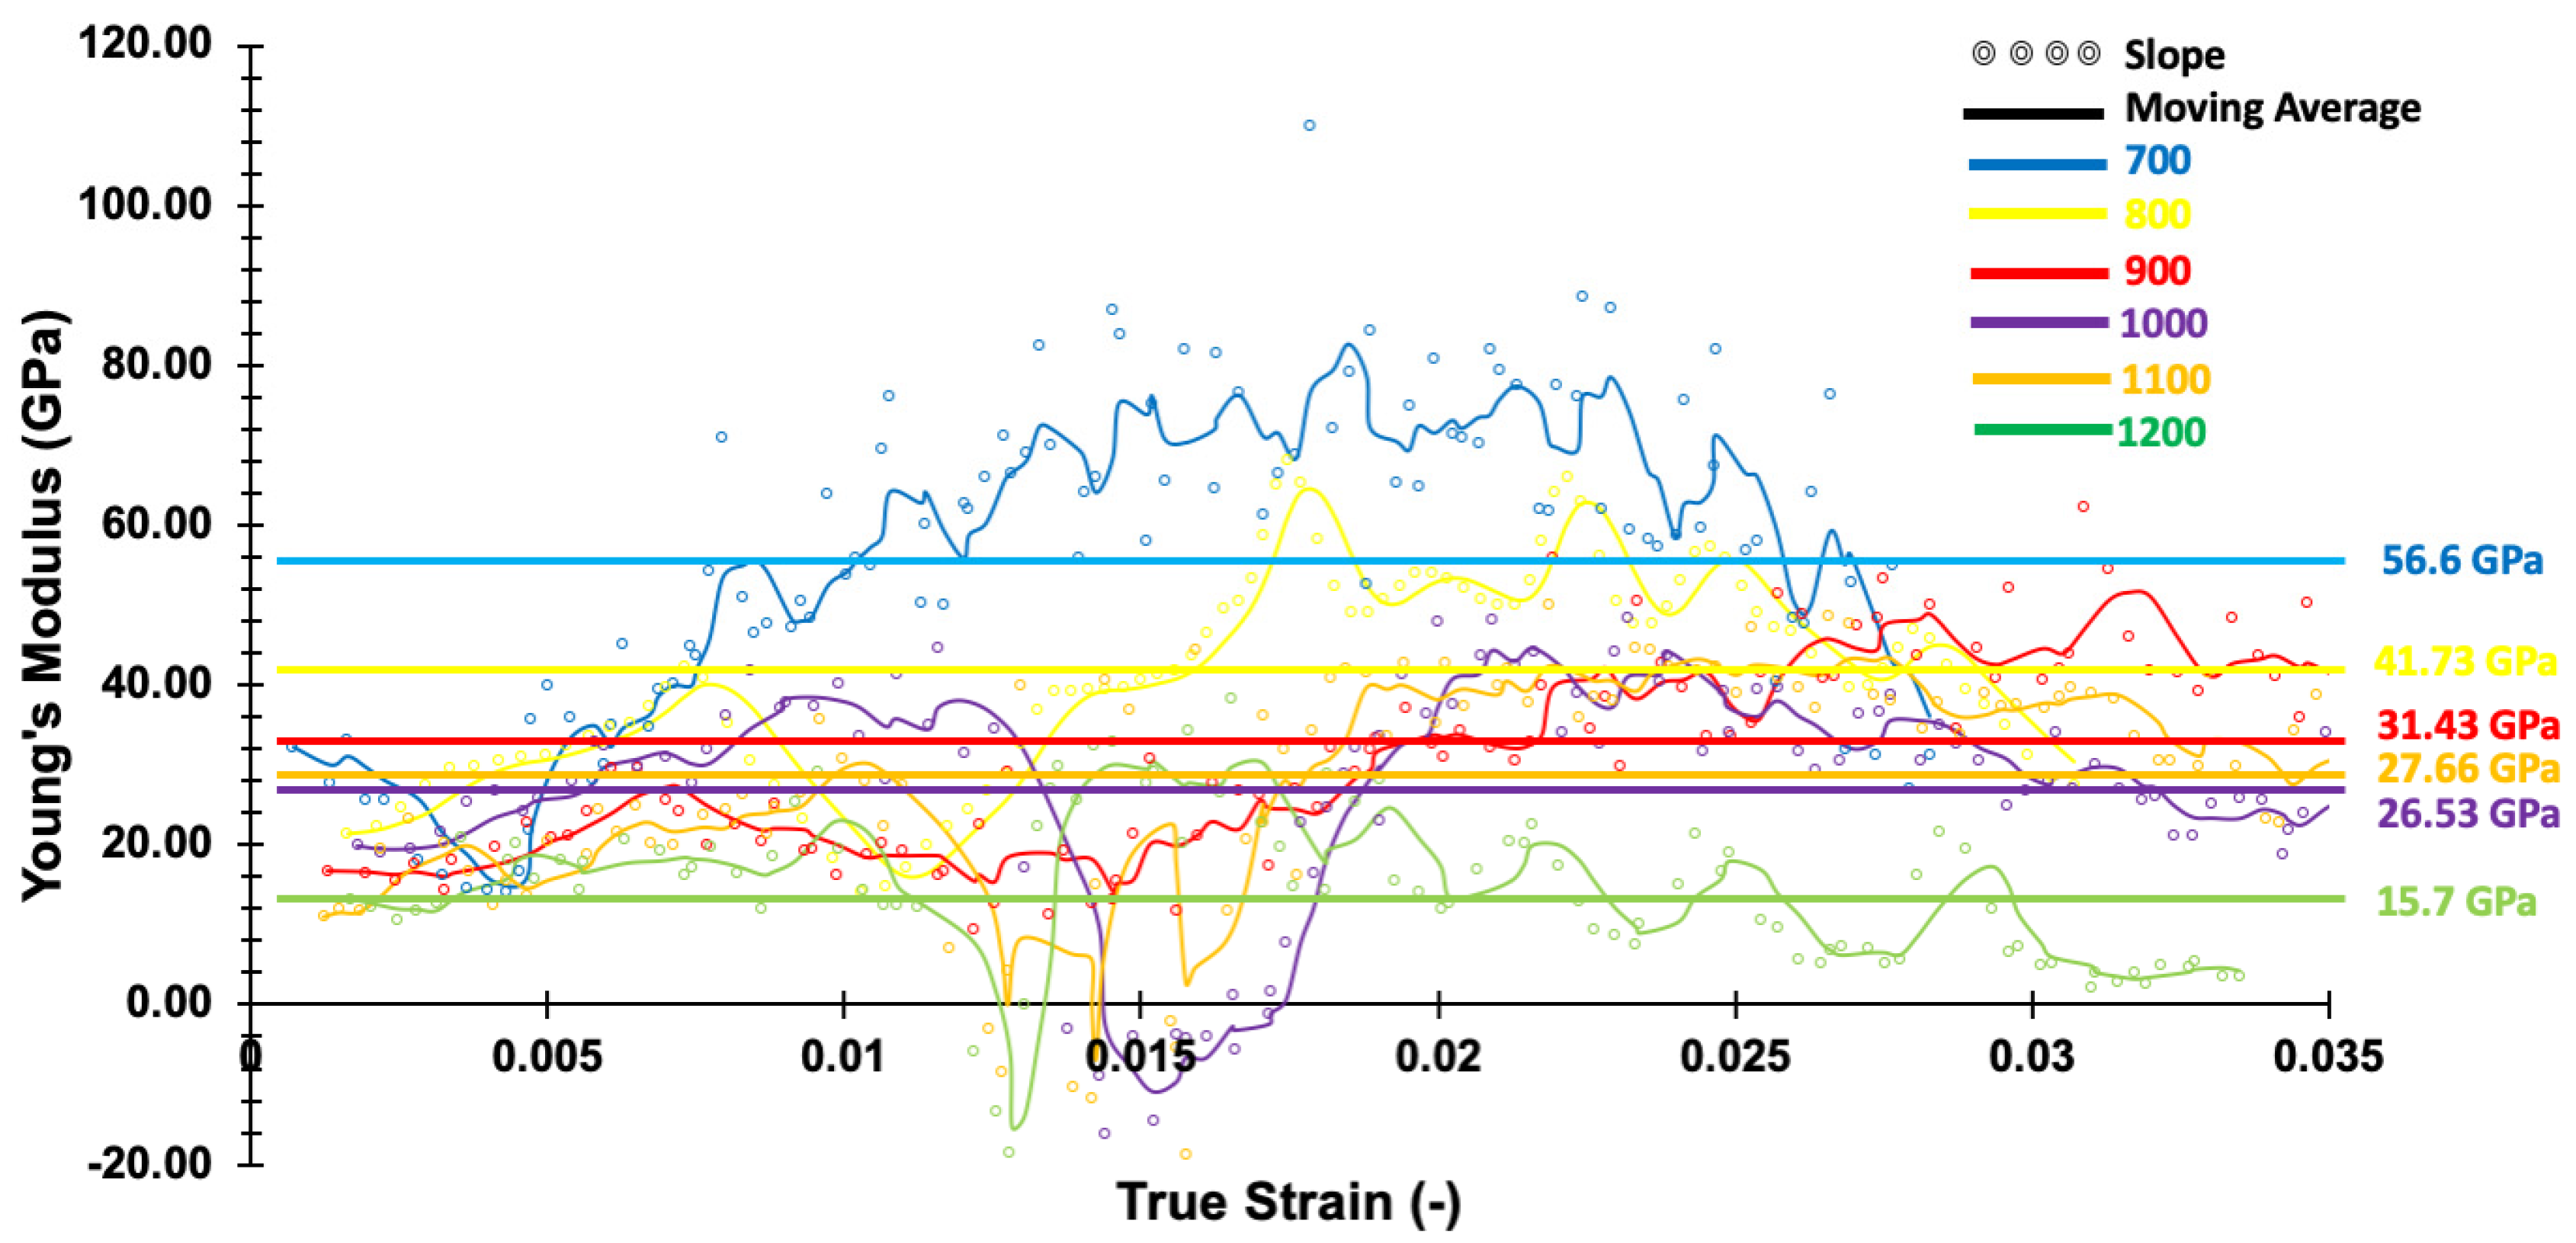
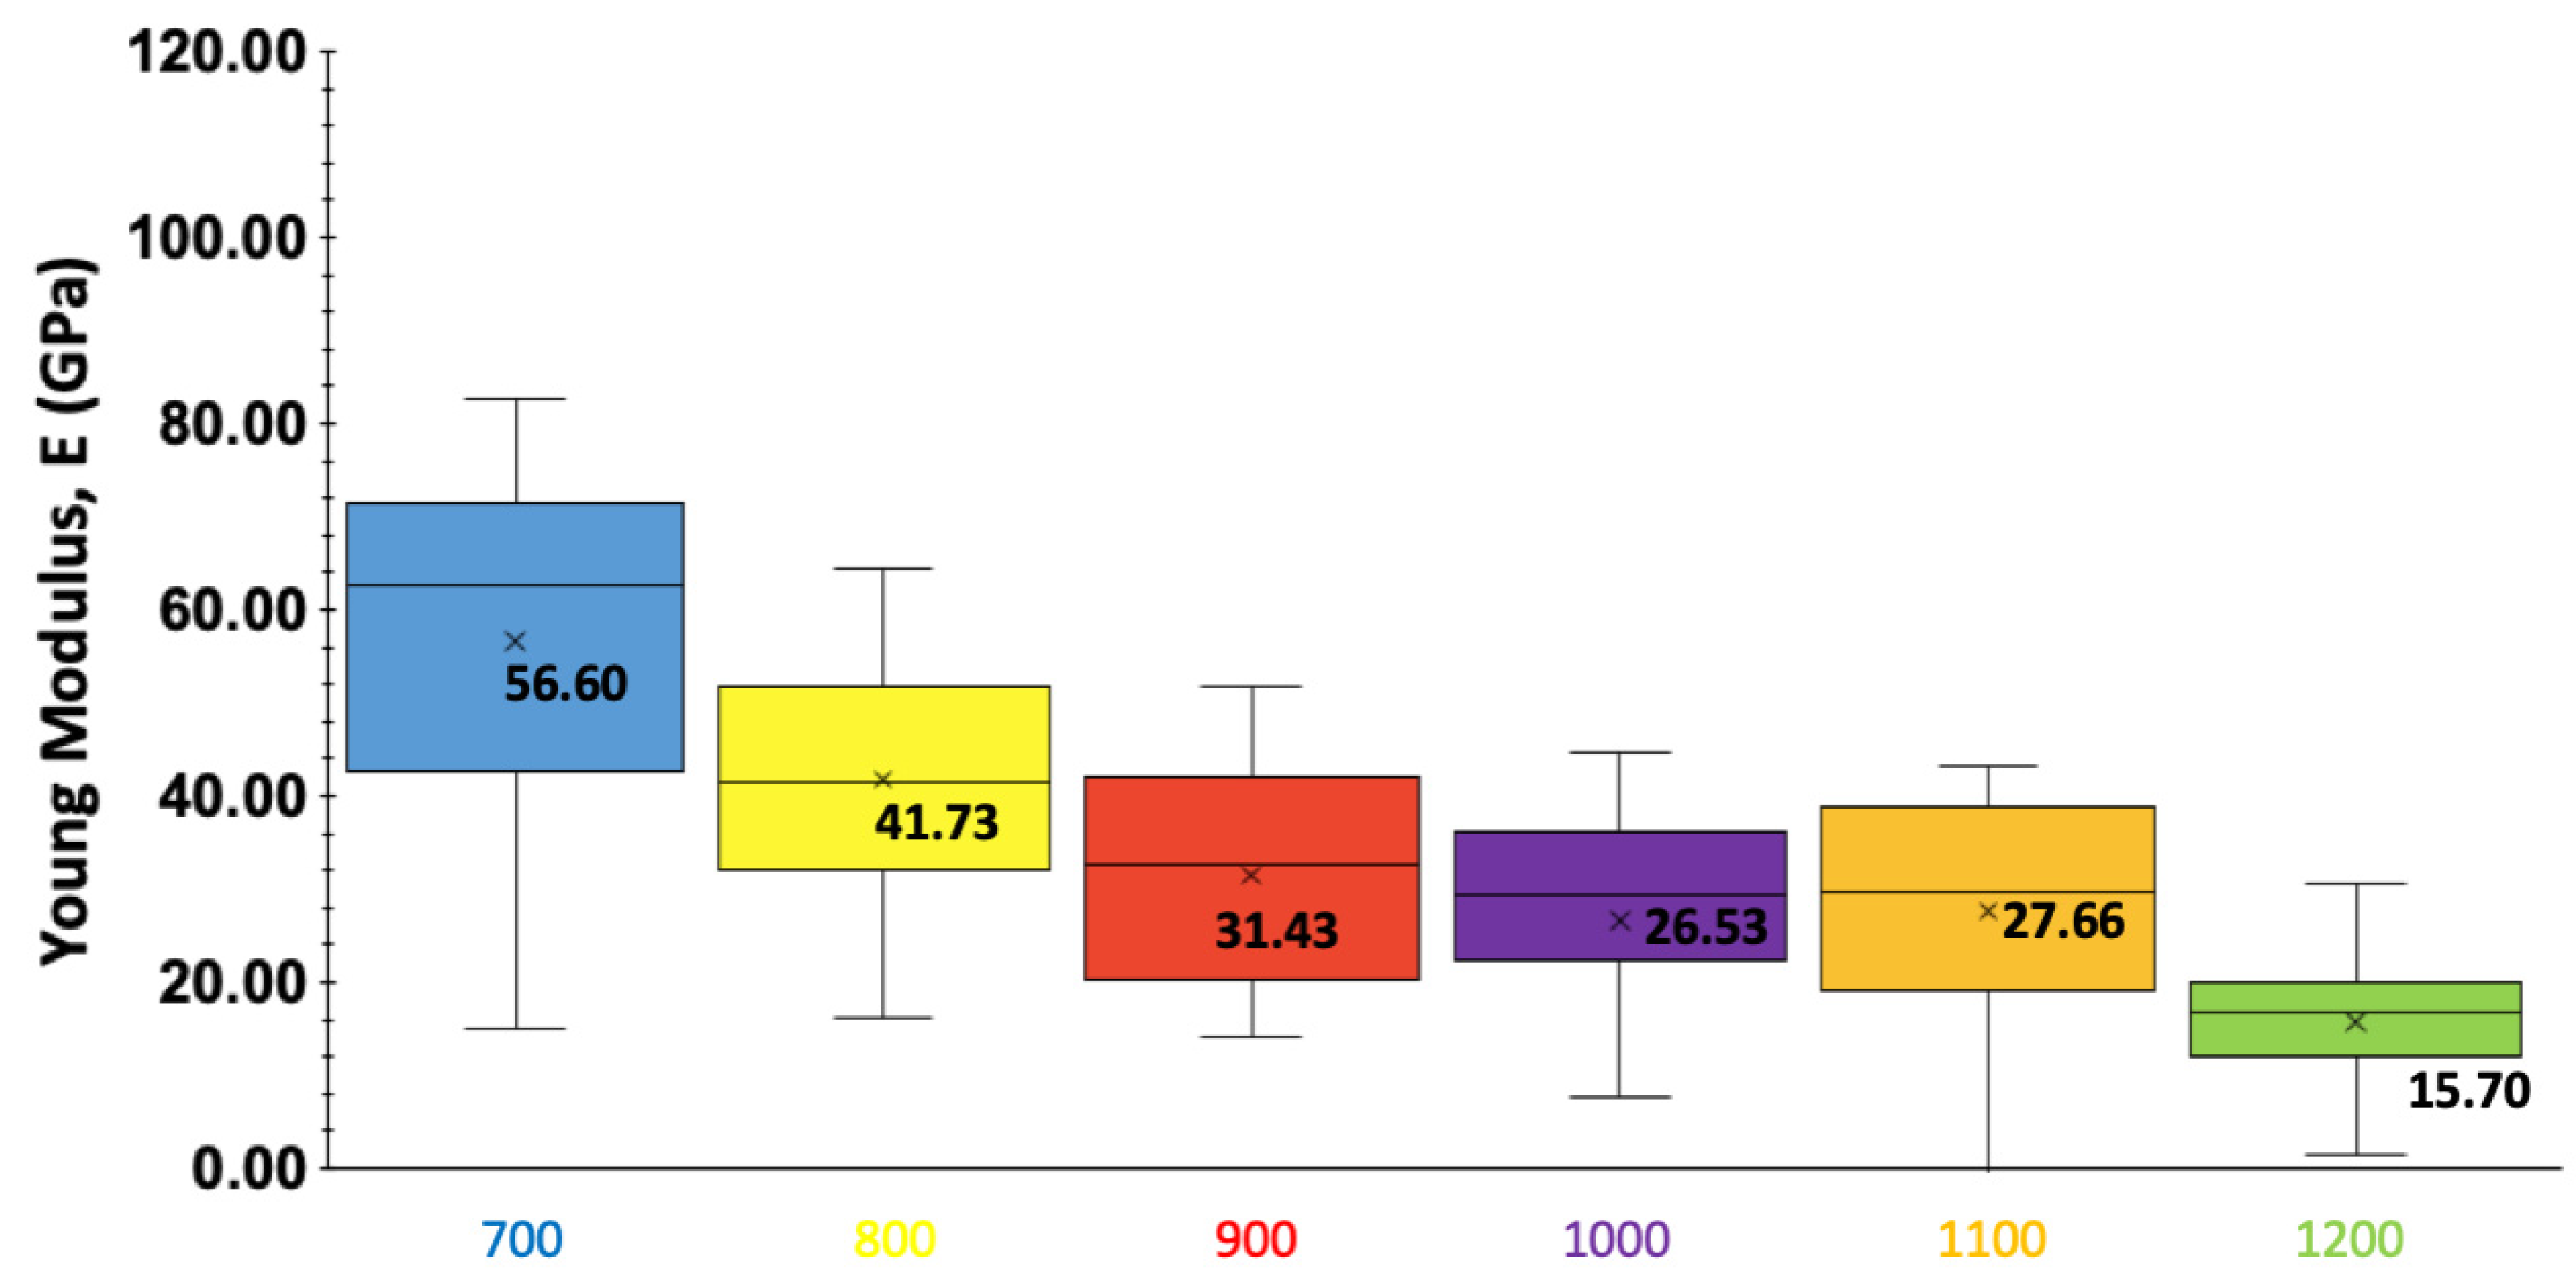
The following assumptions were made to compute the value of the Young’s modulus using an appropriate statistical methodology. Figure A2 shows the slope and four-point moving average graph of four points for the experimental flow curves in the entire elastic zone of zirconia at temperatures ranging from 700 to 1200 °C at a strain rate of 0.1 s−1. The box plot was used to select a suitable value for Young’s modulus (GPa) from the experimental data in Figure 6b, and the average values for Young’s modulus (GPa) chosen at the respective temperature are shown in Figure A3.
Figure A2. Slope and four-point moving average values in elastic region in GPa.
Metals 12 02174 g0a2
Figure A3. Average values of Young’s modulus (GPa) in box plot representation at different temperatures in degrees Celsius. Different colors in the figure represent different temperatures and their corresponding box plots.
Metals 12 02174 g0a3
The elements of the stiffness matrix (C11, C12, and C44) for isotropic elements are calculated from Equations (A20)–(A22) [33,34].
C 11 = E ( 1 υ ) ( 1 + υ ) ( 1 2 υ )
C 12 = E υ ( 1 + υ ) ( 1 2 υ )
C 44 = C 11 C 12 2

References

  1. Miracle, D. Metal matrix composites–from science to technological significance. Compos. Sci. Technol. 2005, 65, 2526–2540. [Google Scholar] [CrossRef]
  2. Weigelt, C.; Aneziris, C.; Ehinger, D.; Eckner, R.; Krüger, L.; Ullrich, C.; Rafaja, D. Effect of zirconia and aluminium titanate on the mechanical properties of transformation-induced plasticity-matrix composite materials. J. Compos. Mater. 2015, 49, 3567–3579. [Google Scholar] [CrossRef]
  3. Springer, P.; Prahl, U. Characterisation of mechanical behavior of 18CrNiMo7-6 steel with and without nb under warm forging conditions through processing maps analysis. J. Mater. Process. Technol. 2016, 237, 216–234. [Google Scholar] [CrossRef]
  4. Prasad, Y.; Gegel, H.; Doraivelu, S.; Malas, J.; Morgan, J.; Lark, K.; Barker, D. Modeling of dynamic material behavior in hot deformation: Forging of Ti-6242. Metall. Trans. A 1984, 15, 1883–1892. [Google Scholar] [CrossRef]
  5. Li, J.; Li, F.; An, Y. Characterization of Hot Deformation Behavior for Pure Aluminum Using 3D Processing Maps. High Temp. Mater. Process. 2018, 37, 929–942. [Google Scholar] [CrossRef]
  6. Qayyum, F.; Guk, S.; Kawalla, R.; Prahl, U. On Attempting to Create a Virtual Laboratory for Application-Oriented Microstructural Optimization of Multi-Phase Materials. Appl. Sci. 2021, 11, 1506. [Google Scholar] [CrossRef]
  7. Bruschi, S.; Altan, T.; Banabic, D.; Bariani, P.; Brosius, A.; Cao, J.; Ghiotti, A.; Khraisheh, M.; Merklein, M.; Tekkaya, A. Testing and modelling of material behaviour and formability in sheet metal forming. CIRP Ann. 2014, 63, 727–749. [Google Scholar] [CrossRef]
  8. Eisenlohr, P.; Diehl, M.; Lebensohn, R.A.; Roters, F. A spectral method solution to crystal elasto-viscoplasticity at finite strains. Int. J. Plast. 2013, 46, 37–53. [Google Scholar] [CrossRef]
  9. Roters, F.; Eisenlohr, P.; Hantcherli, L.; Tjahjanto, D.D.; Bieler, T.R.; Raabe, D. Overview of constitutive laws, kinematics, homogenization and multiscale methods in crystal plasticity finite-element modeling: Theory, experiments, applications. Acta Mater. 2010, 58, 1152–1211. [Google Scholar] [CrossRef]
  10. Roters, F.; Eisenlohr, P.; Kords, C.; Tjahjanto, D.; Diehl, M.; Raabe, D. DAMASK: The Düsseldorf Advanced MAterial Simulation Kit for studying crystal plasticity using an FE based or a spectral numerical solver. Procedia Iutam 2012, 3, 3–10. [Google Scholar] [CrossRef]
  11. Zhang, H.; Diehl, M.; Roters, F.; Raabe, D. A virtual laboratory using high resolution crystal plasticity simulations to determine the initial yield surface for sheet metal forming operations. Int. J. Plast. 2016, 80, 111–138. [Google Scholar] [CrossRef]
  12. Roters, F.; Diehl, M.; Shanthraj, P.; Eisenlohr, P.; Reuber, C.; Wong, S.L.; Maiti, T.; Ebrahimi, A.; Hochrainer, T.; Fabritius, H.-O. DAMASK–The Düsseldorf Advanced Material Simulation Kit for modeling multi-physics crystal plasticity, thermal, and damage phenomena from the single crystal up to the component scale. Comput. Mater. Sci. 2019, 158, 420–478. [Google Scholar] [CrossRef]
  13. Qayyum, F.; Umar, M.; Guk, S.; Schmidtchen, M.; Kawalla, R.; Prahl, U. Effect of the 3rd Dimension within the Representative Volume Element (RVE) on Damage Initiation and Propagation during Full-Phase Numerical Simulations of Single and Multi-Phase Steels. Materials 2020, 14, 42. [Google Scholar] [CrossRef]
  14. Qayyum, F.; Guk, S.; Prüger, S.; Schmidtchen, M.; Saenko, I.; Kiefer, B.; Kawalla, R.; Prahl, U. Investigating the local deformation and transformation behavior of sintered X3CrMnNi16-7-6 TRIP steel using a calibrated crystal plasticity-based numerical simulation model. Int. J. Mater. Res. 2020, 111, 392–404. [Google Scholar] [CrossRef]
  15. Qayyum, F.; Chaudhry, A.A.; Guk, S.; Schmidtchen, M.; Kawalla, R.; Prahl, U. Effect of 3D Representative Volume Element (RVE) Thickness on Stress and Strain Partitioning in Crystal Plasticity Simulations of Multi-Phase Materials. Crystals 2020, 10, 944. [Google Scholar] [CrossRef]
  16. Khan, U.; Hussain, A.; Shah, M.; Shuaib, M.; Qayyum, F. Investigation of Mechanical Properties Based on Grain Growth and Microstructure Evolution of Alumina Ceramics during Two Step Sintering Process; IOP Conference Series: Materials Science and Engineering; IOP Publishing: Bristol, UK, 2016; p. 012046. [Google Scholar]
  17. Kirschner, M.; Guk, S.; Kawalla, R.; Prahl, U. Further Development of Process Maps for TRIP Matrix Composites during Powder Forging; Materials Science Forum; Trans. Tech. Publications: Stafa-Zurich, Switzerland, 2019; pp. 15–23. [Google Scholar]
  18. Decker, S. Entwicklung der Mikrostruktur und der Mechanischen Eigenschaften eines Mg-PSZ-Partikelverstärkten TRIP-Matrix-Composits während Spark Plasma Sintering; Logos Verlag Berlin GmbH: Berlin, Germany, 2015. [Google Scholar]
  19. Reckziegel, A. Properties and Applications of High-Performance Ceramics Made of Zirconia; Aliaxis Utilities and Industry: Mannheim, Germany, 2015. [Google Scholar]
  20. Martin, S.; Decker, S.; Krüger, L.; Martin, U.; Rafaja, D. Microstructure Changes in TRIP Steel/Mg-PSZ Composites Induced by Low Compressive Deformation. Adv. Eng. Mater. 2013, 15, 600–608. [Google Scholar] [CrossRef]
  21. Groeber, M.A.; Jackson, M.A. DREAM.3D: A Digital Representation Environment for the Analysis of Microstructure in 3D. Integr. Mater. Manuf. Innov. 2014, 3, 56–72. [Google Scholar] [CrossRef] [Green Version]
  22. Prasad, Y.; Rao, K.; Sasidhar, S. Hot Working Guide: A Compendium of Processing Maps; ASM International: Almere, The Netherlands, 2015. [Google Scholar]
  23. Ahrens, J.; Geveci, B.; Law, C. Paraview: An End-User Tool for Large Data Visualization; Los Alamos National Laboratory: Los Alamos, NM, USA, 2005. [Google Scholar]
  24. Kirschner, M.; Guk, S.; Kawalla, R.; Prahl, U. Powder Forging of Presintered TRIP-Matrix Composites. In Austenitic TRIP/TWIP Steels and Steel-Zirconia Composites; Springer: Berlin/Heidelberg, Germany, 2020; pp. 223–255. [Google Scholar]
  25. Qayyum, F.; Guk, S.; Schmidtchen, M.; Kawalla, R.; Prahl, U. Modeling the local deformation and transformation behavior of cast X8CrMnNi16-6-6 TRIP steel and 10% Mg-PSZ composite using a continuum mechanics-based crystal plasticity model. Crystals 2020, 10, 221. [Google Scholar] [CrossRef] [Green Version]
  26. Reyes-Morel, P.E.; Chen, I.W. Stress-Biased Anisotropic Microcracking in Zirconia Polycrystals. J. Am. Ceram. Soc. 1990, 73, 1026–1033. [Google Scholar] [CrossRef] [Green Version]
  27. Zhu, Y.; Zeng, W.; Feng, F.; Sun, Y.; Han, Y.; Zhou, Y. Characterization of hot deformation behavior of as-cast TC21 titanium alloy using processing map. Mater. Sci. Eng. A 2011, 528, 1757–1763. [Google Scholar] [CrossRef]
  28. Landes, J.D.; McCabe, D.E. Fracture Mechanics: Twenty-Fourth Volume; ASTM International: Philadelphia, PA, USA, 1994; Volume 1207. [Google Scholar]
  29. Giglio, M.; Manes, A.; Vigano, F. Ductile fracture locus of Ti–6Al–4V titanium alloy. Int. J. Mech. Sci. 2012, 54, 121–135. [Google Scholar] [CrossRef]
  30. Zhao, P.; Song En Low, T.; Wang, Y.; Niezgoda, S.R. An integrated full-field model of concurrent plastic deformation and microstructure evolution: Application to 3D simulation of dynamic recrystallization in polycrystalline copper. Int. J. Plast. 2016, 80, 38–55. [Google Scholar] [CrossRef]
  31. Guk, S.; Milisova, D.; Pranke, K. Influence of Deformation Conditions on the Microstructure and Formability of Sintered Mg-PSZ Reinforced TRIP-Matrix-Composites; Key Engineering Materials; Trans. Tech. Publications: Stafa-Zurich, Switzerland, 2016; pp. 86–96. [Google Scholar]
  32. Ziegler, H. Progress in Solid Mechanics; Sneddon, I.N., Hill, R., Eds.; North-Holland Publishing Company: New York, NY, USA, 1963. [Google Scholar]
  33. Pabst, W.; Ticha, G.; Gregorová, E. Effective elastic properties of alumina-zirconia composite ceramics-Part 3. Calculation of elastic moduli of polycrystalline alumina and zirconia from monocrystal data. Ceram. Silik. 2004, 48, 41–48. [Google Scholar]
  34. Vliet, K. Mechanical Behavior of Materials; v. 3.22; Massachusetts Institute of Technology: Cambridge, MA, USA, 2008. [Google Scholar]
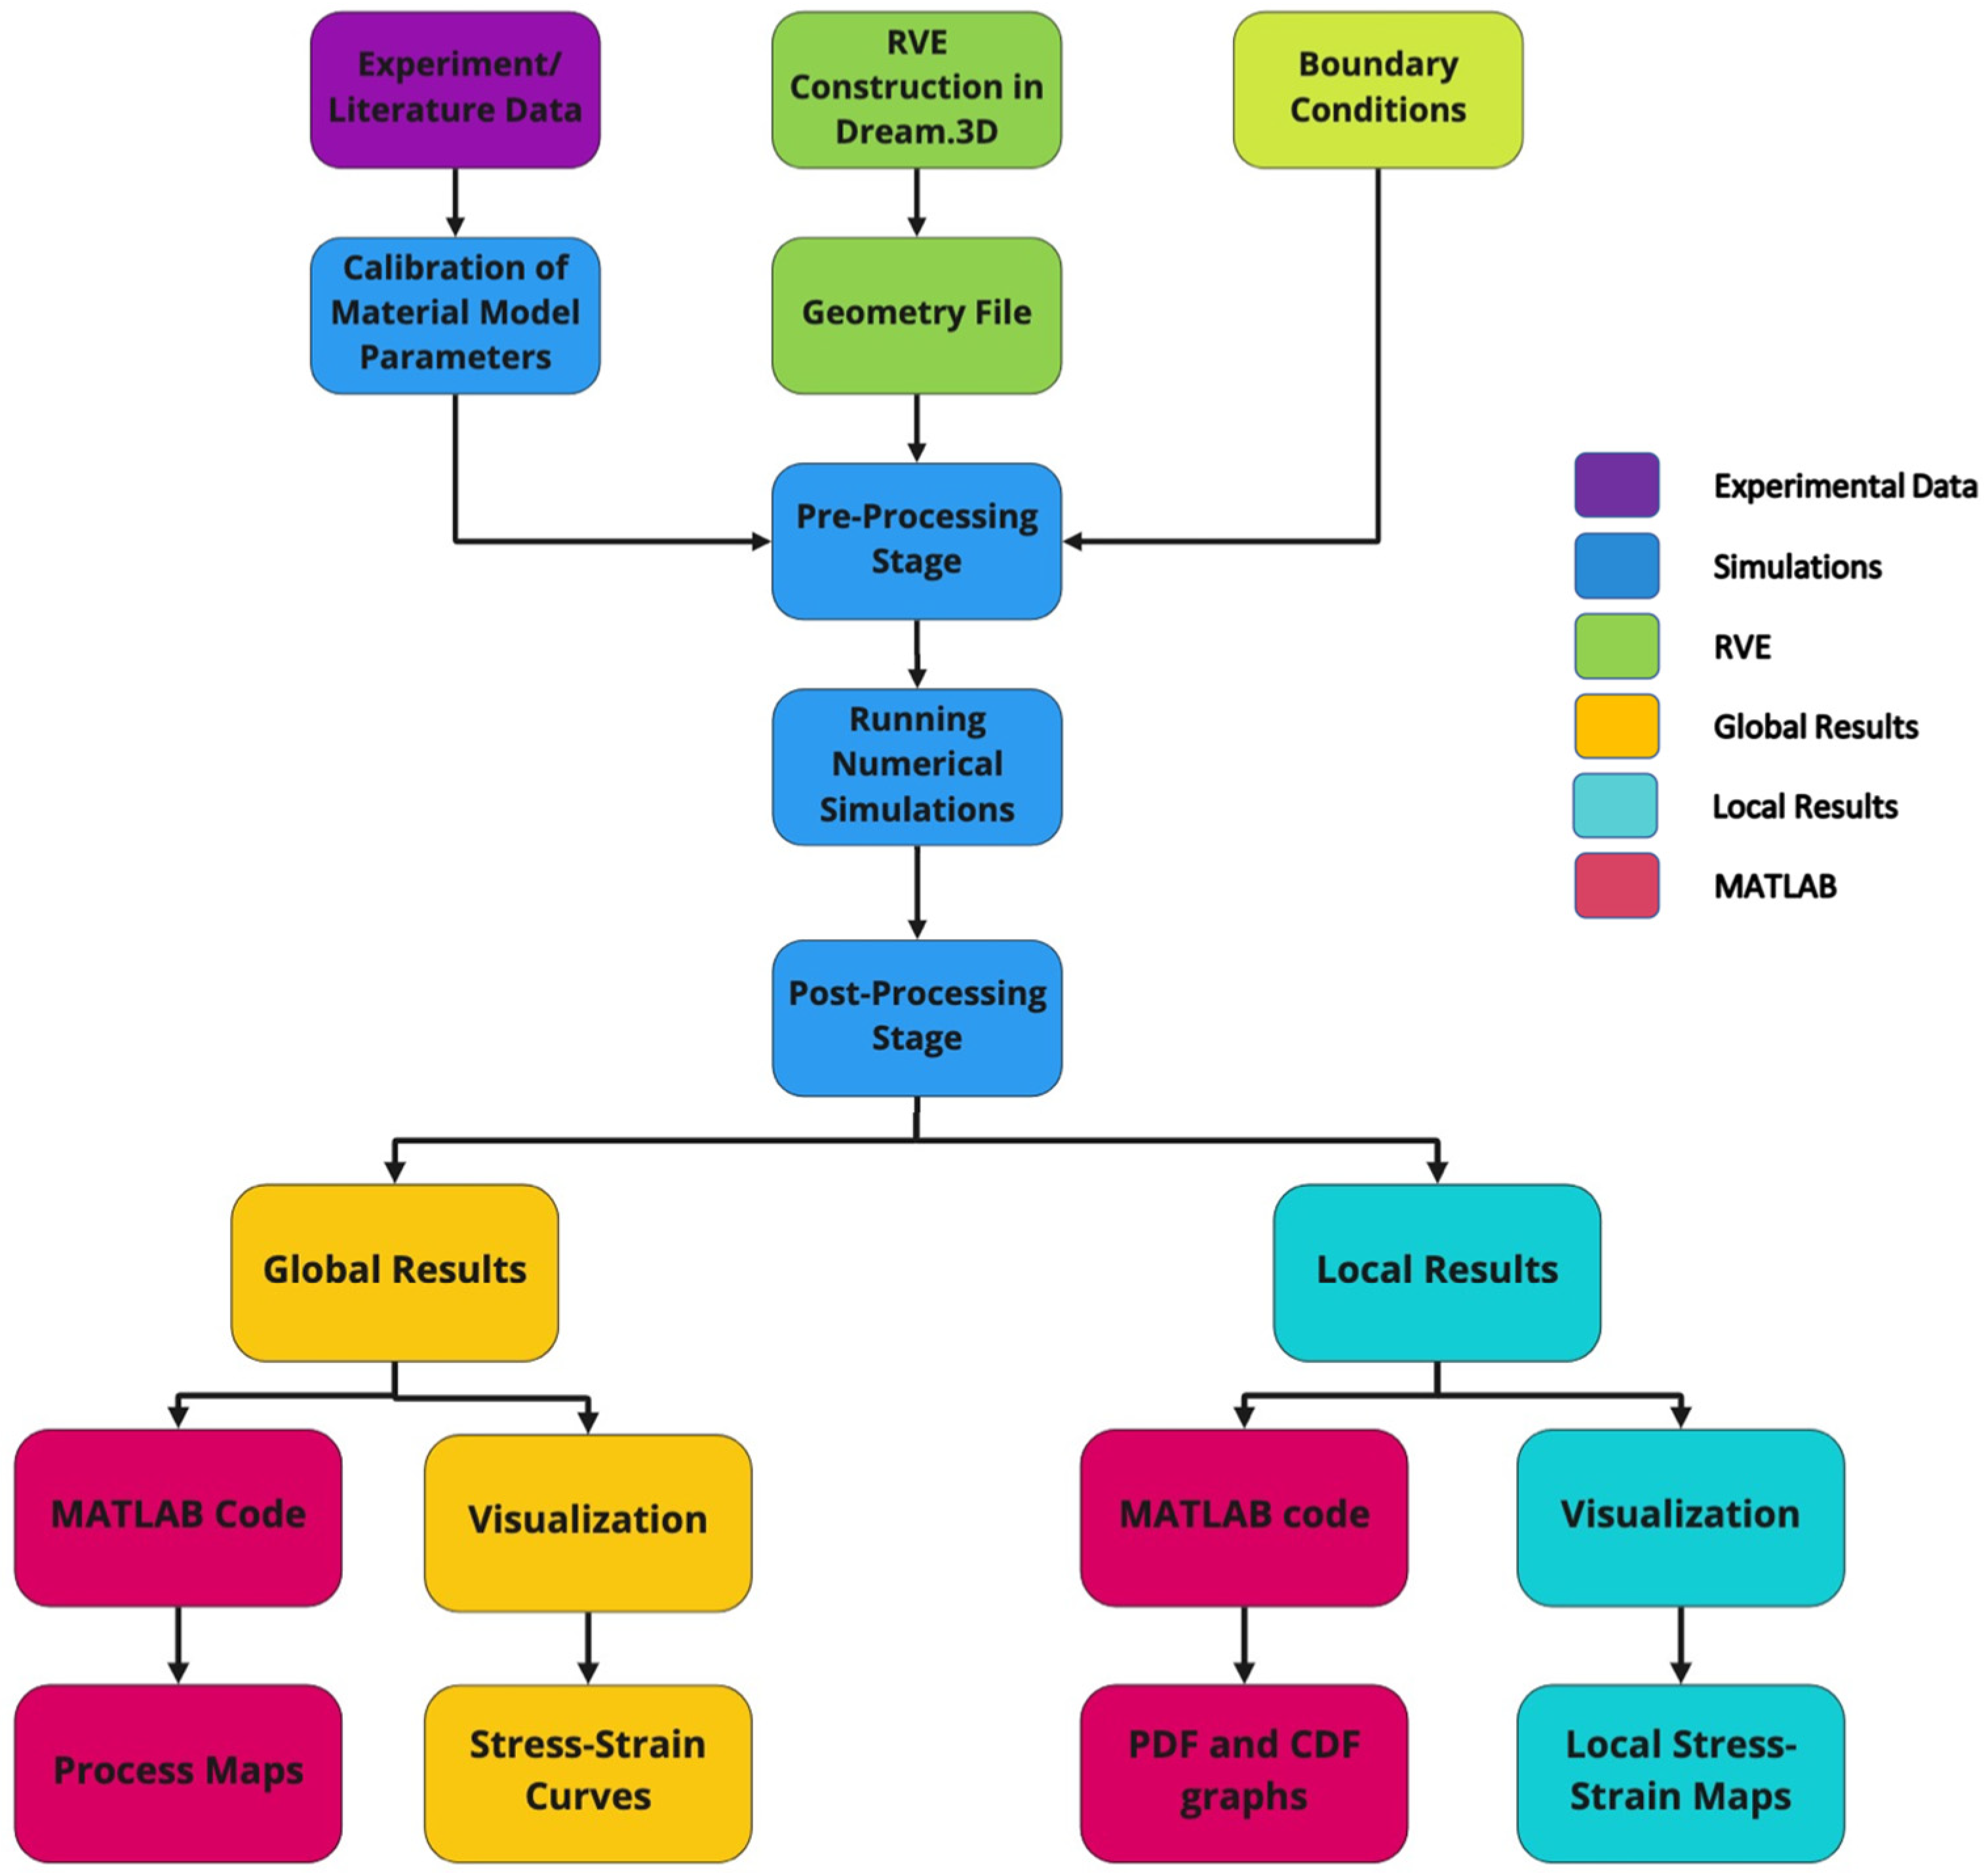
Figure 1. The flow chart shows the methodology adopted and the data flow in this study.
Metals 12 02174 g001
Figure 2. A single-phase isotropic RVE [14] is shown, where each color represents a different grain according to the given IPF legend along the z-axis.
Metals 12 02174 g002
Figure 3. A multiphase RVE was generated in Dream.3D for composite, (a1,b1,c1) corresponding austenite matrix (a2) 5% zirconia particles, (b2) 10% zirconia particles, and (c2) 20% zirconia particles. Each color represents a separate grain with orientation assigned according to the given IPF legend.
Metals 12 02174 g003
Figure 4. The stress values along the XYZ direction at 800 °C and a strain rate of 0.1 s−1 showed an isotropic behavior in all cases; (a) 5% zirconia particles RVE, (b) 10% zirconia particles RVE, and (c) 20% zirconia particles RVE. The blue lines overlapped with the underlying flow curves.
Metals 12 02174 g004
Figure 5. Selection of RVEs for creating local maps; (a) 100% austenite matrix (b) 5% zirconia particles, (c) 10% zirconia particles, (d) 20% zirconia particles, and (e) the IPF color scheme.
Metals 12 02174 g005
Figure 6. (a) Comparison of the experimental and simulation results for (a) austenite showing dynamic softening at 1200 °C, (b) zirconia at 700–1200 °C with a strain rate of 0.1 s−1.
Metals 12 02174 g006
Figure 7. Comparison of flow stress values in MPa based on the simulation results at the yield point and 0.2 deformation for composites with (a) 0% zirconia, (b) 5% zirconia, (c) 10% zirconia, and (d) 20% zirconia particles.
Metals 12 02174 g007
Figure 8. Process maps of the simulation results at a global true strain value of 0.2 with (a) 0% zirconia, (b) 5% zirconia, (c) 10% zirconia, and (d) 20% zirconia.
Metals 12 02174 g008
Figure 9. Local stress distribution maps at true strain and 700 and 1200 °C for strain rates of 0.001 and 100 s−1.
Metals 12 02174 g009
Figure 10. The PDF and CDF for austenite grains against true stress at 0.1 global strain at (a) 700 °C and (b) 1200 °C.
Metals 12 02174 g010aMetals 12 02174 g010b
Figure 11. Local strain distribution maps at 0.1 true strain and 700 and 1200 °C for 0.001 and 100 s−1 strain rate.
Metals 12 02174 g011
Figure 12. PDF and CDF for austenite grains against true strain at 0.1 global strain and (a) 700 °C and (b) 1200 °C.
Metals 12 02174 g012
Figure 13. Triaxial local stress maps at 700 and 1200 °C, 0.1 true strain, and 0.001 and 100 s−1 strain rate.
Metals 12 02174 g013
Figure 14. Process maps for TRIP steel composite with 10% zirconia constructed using the results of simulations. The trend of iso-lines shown by red arrow is comparable with the experimental trend published earlier by Guk et al. [31].
Metals 12 02174 g014
Figure 15. Process maps for TRIP steel with 5% zirconia constructed using the results of simulations. The trend of iso-lines shown by red arrow is comparable with the experimental trend of similar material with 10% residual porosity published earlier by Kirchner et al. [17].
Metals 12 02174 g015
Table 1. The chemical composition of the gas X3CrMnNi16–7–6 atomized TRIP steel (Fe balance) and Zirconia by weight [24].
TRIP SteelCSiMnSCrMoNiNAlNbTi
wt.%0.031.07.2<0.0116.3<0.016.60.090.040.021<0.01
ZirconiaZrO2HfO2MgOSiO2Al2O3CaOTiO2Y2O3
wt.%bal.1.853.250.11.580.060.130.13
Table 2. The calibrated austenite matrix phenomenological material model parameters for different temperatures.
Parameter DefinitionSymbol700 °C800 °C900 °C1000 °C1100 °C1200 °CUnit
First elastic stiffness constant with normal strainC11124.8GPa
Second elastic stiffness constant with normal strainC1253.5GPa
First, elastic stiffness constant with shear strainC4435.7GPa
Initial shear resistance on [111]So [111]464136251812.5MPa
Saturation shear resistance on [111]S [111]12010063422921MPa
Slip hardening parameterho850830780685440220MPa
Stress exponentn20-
Curve fitting parameterw2.5-
Table 3. The calculated material model parameters for zirconia.
Parameter DefinitionSymbol700 °C800 °C900 °C1000 °C1100 °C1200 °CUnit
Young’s ModulusE56.641.7331.4326.5327.6615.7GPa
Poisson’s Ratio Valuev0.3-
First elastic stiffness constant with normal strainC1176.1956.1842.3135.7137.2321.13GPa
Second elastic stiffness constant with normal strainC1232.6524.0818.1315.3115.969.06GPa
First, elastic stiffness constant with shear strainC4421.7716.0512.0910.2010.646.04GPa
Publisher’s Note: MDPI stays neutral with regard to jurisdictional claims in published maps and institutional affiliations.