Article

Multiple Glass Transitions in Bismuth and Tin beyond Melting Temperatures

by
Robert F. Tournier
UPR 3228 Centre National de la Recherche Scientifique, Laboratoire National des Champs Magnétiques Intenses, European Magnetic Field Laboratory, Institut National des Sciences Appliquées de Toulouse, Université Grenoble Alpes, F-31400 Toulouse, France
Metals 2022, 12(12), 2085; https://doi.org/10.3390/met12122085
Submission received: 22 October 2022 / Revised: 1 December 2022 / Accepted: 1 December 2022 / Published: 5 December 2022
(This article belongs to the Section Crystallography and Applications of Metallic Materials)

Abstract

:
Liquid-liquid transitions were discovered above the melting temperature (Tm) in Bi and Sn up to 2 Tm, viewed as glass transitions at Tg = Tn+ > Tm of composites nucleated at Tx < Tm and fully melted at Tn+. A glassy fraction (f) disappeared at 784 K in Sn. (Tn+) increases with singular values of (f) depending on Tx with (f) attaining 100% at Tg = Tn+ = 2 Tm. The nonclassical model of homogeneous nucleation is used to predict Tx, Tn+ and the specific heat. The singular values of (f) leading to (Tn+) correspond to percolation thresholds of configurons in glassy phases. A phase diagram of glassy fractions occurring in molten elements is proposed. The same value of (Tx) can lead to multiple (Tg). Values of (Tg = Tn+) can be higher than (2 Tm) for Tx/Tm < 0.7069. A specific heat equal to zero is predicted after cooling from T ≤ 2 Tm and would correspond to a glassy phase. Weak glassy fractions are nucleated near (Tn+) after full melting at (Tm) without transition at (Tx). Resistivity decreases were observed after thermal cycling between solid and liquid states with weak and successive values of (f) due to Tx/Tm < 0.7069.

Graphical Abstract

1. Introduction

Liquid-liquid phase transitions occur in glass-forming melts at temperatures Tn+ above Tm, the equilibrium thermodynamic melting transition of crystals [1,2,3,4,5,6,7,8,9,10,11,12,13,14,15,16,17,18,19,20,21,22]. These transitions often result from the separation of two liquid states, occurring in all supercooled materials at a temperature Tx < Tm, including pure elements in which two liquid phases of the same composition coexist. A liquid fraction crystallizes at Tx and melts at Tm while the complementary glassy fraction melts at Tn+ = Tg [22,23,24]. The purpose of this publication is to relate all the liquid-liquid transitions, occurring above the melting temperature (Tm) in Bi and Sn up to (2 Tm), and beyond, to glass transition temperatures [1,3,4]. A weak glassy fraction disappeared at 784 K in Sn as recently observed with specific heat measurements [5]. Here, we recall that (Tn+) increases with singular values of (f) depending on Tx and we examine if (f) can attain 100% at Tg = Tn+ = 2 Tm in Bi and Sn as already envisaged for a component of Cu46Zr46Al8 melt [12,23].
Molecular dynamics simulations were employed to study the thermodynamics and kinetics of the glass transition and crystallization in deeply undercooled liquid Ag and Ag-Cu at high cooling rates of the order of 1012 K/s [25,26]. A first order transition from the liquid-phase (L) to a metastable, heterogeneous phase called G-phase was observed, leading to a glassy phase below the recovery temperature Tn+ of the enthalpy above Tm. The L–G transition occurred by nucleation of the G-phase from the L-phase. The lowest glass transition temperature of liquid-phase (L) depends on its Lindemann coefficient and is much weaker than the nucleation temperature of G-phase [27,28,29,30]. Increasing the heating rate increased the glass transition temperature of liquid (L). A first order transition from liquid (L) to G-glass was observed, when a supercooled liquid evolved isothermally below its melting temperature at deep undercooling [26]. Several simulations of G-phases in various elements showed full melting heat Hm at various temperatures Tn+ = Tg in Ag [25], in Zr [31], in Cu and in Fe [32]. The values of Tn+ were determined from singular values of G-phase frozen enthalpy, employing the nonclassical homogeneous nucleation (NCHN) model to predict Tx, Tn+ and the enthalpy. Singular values of (f) leading to (Tn+) correspond to percolation thresholds of broken bonds (configurons) leading to glassy phases during cooling below Tn+ [24,29,30,33,34].
The high undercooling rates of bulk liquid elements have been known for many years [35]. Consequently, we plan to confirm, in this publication, that the nucleation of G-phases and their glass transition temperatures above Tm are observable without employing heating and cooling rates of the order of 1010 to 1013 K/s to escape from crystallization. A phase diagram of glassy fractions, occurring in molten elements at Tx < Tm, is proposed, completing the diagram already established for Tx > Tm [30] in agreement with previous molecular dynamics simulations [25,26,31,32]. The specific heat values at Tg = Tn+ is predicted up to Tg = 2 Tm where a glassy phase transition is expected. The density far above Tm depends on the formation time of bonds increasing glassy phase fractions. Resistivity decreases are due to the increase in (f) in these liquids [4].

2. Diagram of Glassy Phases

Three liquid states are present in all melts with complementary enthalpies introduced in the classical Gibbs free energy change which are equal to εlsHm, εgsHm and ΔεlgHm [36], with Hm being the melting enthalpy. The coefficient (εls) is attached to the initial liquid state before adding new atomic bonds induced by cooling while (εgs) is obtained by including them. The coefficient Δεlg, equal to the difference (εls − εgs), is attributed to the formation of a new liquid state describing the contribution of new bonds. For liquid elements, that are easily crystallized, the liquid enthalpy coefficients obey to the following [27,30]:
ε ls = ε ls 0 ( 1 θ 2 θ 0 m 2 ) = ε l s 0 ( 1 2.25   θ 2 ) ,
ε gs = ε gs 0 ( 1 θ 2 / θ 0 g 2 ) = ε g s 0 ( 1 θ 2 )
ε lg ( θ ) = [ ε ls ε gs ] = 1.25 ε gs 0 θ 2 ,
where θ0m = −2/3 and θ0g = −1 are the reduced Vogel–Fulcher–Tammann (VFT) temperatures in liquid elements for which the minimum value of Tg is fixed by the Lindemann coefficient (δls) of each element [27]. Equation (3) is transformed into Equation (4) for the minimum value of εls0 = εgs0:
ε l g = 1.25   ε g s 0   θ g 2 ,
where ε l g g) is the latent heat coefficient, accompanying the glass transition during the first cooling and the formation of Phase 3 below the percolation threshold of bonds. The partial breaking of bonds during reheating occurs without latent heat [2]. This type of enthalpy relaxation due to the development of bonds below the percolation threshold at Tg was observed after quenching glass-forming melts in amorphous state and heating them at 20 K/min [37,38,39,40,41,42]. After these relaxation phenomena, the glass transition occurs without latent heat.
Coefficient minima (εlso) and (εgso) were initially determined to be equal to 0.217 [43]. They were the average of many liquid element coefficients deduced from the undercooling rate of each of them corresponding to the mean value 0.103 of their Lindemann coefficient [27,28,29]. The number 2.25, initially equal to 2.5 in Equation (1), consequently, fixed the VFT temperature to Tm/3 [44]. It appeared later that (Δεlg) in Equation (3) is the enthalpy coefficient of a true thermodynamic phase called “Phase 3” discovered for the first time in supercooled water [45,46,47]. It is now a generic name that we extend to all glassy phases, and to those resulting from a first-order transition [37]. Phase 3 could be the congruent bond lattice predicted for disordered oxide systems [48], extended later to critical packing density formation applied to broken bonds (configurons), producing the glass transitions at Tg<<< [33,49]. A fraction (Δεlg) of atomic bonds equal to various percolation thresholds still exists up to Tn+, in all glass-forming melts [23,34,50]. Phase 3 results from the formation of configuron phases [50].
A configuron is an elementary configurational excitation in an amorphous material, formed by breaking of a chemical bond (or transformation of an atom from one to another atomic shell) and the associated strain-releasing local adjustment of centers of atomic vibration [48]. For metals, evidence on configuron formation was first demonstrated by Iwashita et al. [51]. The temperature dependence of configuron contents is provided by Gibbs statistics [52,53]. The melting of an amorphous solid differs from the melting of a crystal. Glasses, on heating continuously, change most of their properties to those of a liquid-like state in contrast to crystals, where such changes occur abruptly at a fixed temperature (the melting point) which is explained by the high mobility of broken bonds tending to condense on irregularities of crystals, such as surfaces and inclusions. Therefore, there are no discontinuities in the volume and entropy changes at Tg [33].
The NCHN model predicted the formation conditions of glacial phases (Phase 3) in Ag-Cu and Ag liquids at various heating rates as previously described by molecular dynamics (MD) simulations, showing full melting at Tn+ = 1.119 Tm for Zr, 1.126 Tm for Ag, 1.219 Tm for Fe and 1.354 Tm for Cu [25,26,31,32]. These phenomena are governed by singular values of the enthalpy Δεlg of glassy Phase 3, formed at nucleation temperatures TnG [29,30].
Two families of nucleation temperatures are provided in Equations (5) and (6) where θn- is equal to two opposite values of θg because εgs is a function of θ2 in Equation (2):
θ n = θ g = ± ( ε g s 2 ) 3 ,
θ n + = ε
where Δε is equal to singular values of the enthalpy coefficient (−Δεlg) of Phase 3.
There are two methods to produce a glassy phase from an enthalpy coefficient equal to (−Δε). The first predicts the undercooling temperature for each value of Δε. These nucleation temperatures (θx) are calculated using the (NCHN) model applied to Liquid 2:
ε gs ( θ = 0 ) = ( 3 θ x + 2 ε ) / ( 1 θ x 2 θ 0 g 2 )
where θ0g2 = 1. For Δε = 0, a second order-like phase transition temperature takes place at Tg during heating for the minimum value of εgs0. Values of θx for various values of Δε are deduced for the same value of εgs0. Consequently, Equation (6) demonstrates that enthalpy above θx is constant and equal to −ΔεHm, belongs to a glassy fraction with a zero specific heat. The glass transition at (Tn+) is not accompanied during the first heating by the latent heat recovery (+Δε Hm).
Glassy phases, formed at θx after undercooling, lead to glassy phase fractions which are volume fractions occupied by the glassy phases with θg = θn+ = Δε in agreement with Equation (6). It has been shown that the set theory provides clear evidence of structural differences between glasses and melts; both glassy and liquid structures near Tg are disordered, however they have different Hausdorff–Besicovitch dimensions [54]. The set theory, as a branch of mathematical logic that studies abstract sets, can be used to characterize the configuron phase formed in amorphous materials out of broken chemical bonds termed configurons. Glasses have a 3D geometry of bonds with point-type broken bonds with a 0D geometry and, because of that, they exhibit a solid-like behavior. The configuron phase behaves differently in glasses and melts, forming a condensed phase in melts and occurring as a gaseous phase in glasses. It therefore has different Hausdorff–Besicovitch dimensions in melts and glasses [55]. The stepwise change in the Hausdorff–Besicovitch dimension of the set of configurons is due to the formation of the macroscopic (condensed fractal cluster) configuron phase above the Tg and as a result has the appearance of a kink in the first sharp diffraction minimum of scattered X-ray or neutrons [56].
The formation of a glassy fraction is accompanied by a crystallized fraction (1 − Δε). A composite crystal–glass is built below Tm with a melting enthalpy (1 − Δε) Hm and a missing enthalpy (Δε Hm) recovered at Tn+ [23]. The glassy phase fraction is not destroyed at Tm and depends on the sample thermal history and the last value of Δε obtained at Tx during heating.
The minimum glass transition at Tg is masked by spontaneous crystallization of liquid element and determined with Equation (7) using Δε = 0 and the minimum value of εgso = εlso, depending on the Lindemann coefficient δls of each element [27]:
ε g s 0 = ε l s 0 = ( 1 + δ l s ) 2 1
In Figure 1, a second method is used to calculate new values of θx during heating. Each value of θg varying from −0.5 to 2 corresponds to a value of Tg/Tm between 0.5 and 3. All ratios Tg/Tm, represented in Figure 1, would be those of phases resulting from a first-order transition at Tx, with Tx and Tg depending on heating rates. Applying Equation (7) determines the value of εgs0 = εls0, (positive or negative [23]), for each (θg) and Δε = 0. Each first-order transition at θx respects Δε = θn+ = θg > 0, in agreement with Equation (6). Negative values of θg (Tg/Tm < 1) are higher than θx because Tg/Tm is always higher than Tx/Tm. The values of (θx) obtained with Equation (7) are weaker than those predicted in Figure 1 along the dashed curve.
The two lines between Tg/Tm = 0.5 and 1.5 are symmetrical with respect to 1. There are five values of Tg/Tm for Tx/Tm higher than 0.7069, and three values of Tg/Tm for Tx/Tm < 0.7069, depending on the singular values of Δε determined by each thermal history. For Tx/Tm = 0.7069, Tg/Tm = 1.475. Note that the NCHN model predicts nucleation temperatures at Tn+ > 2 Tm, ignoring the structure of these new ordered phases. We assume that glassy phases are formed.

3. Diagram Applications

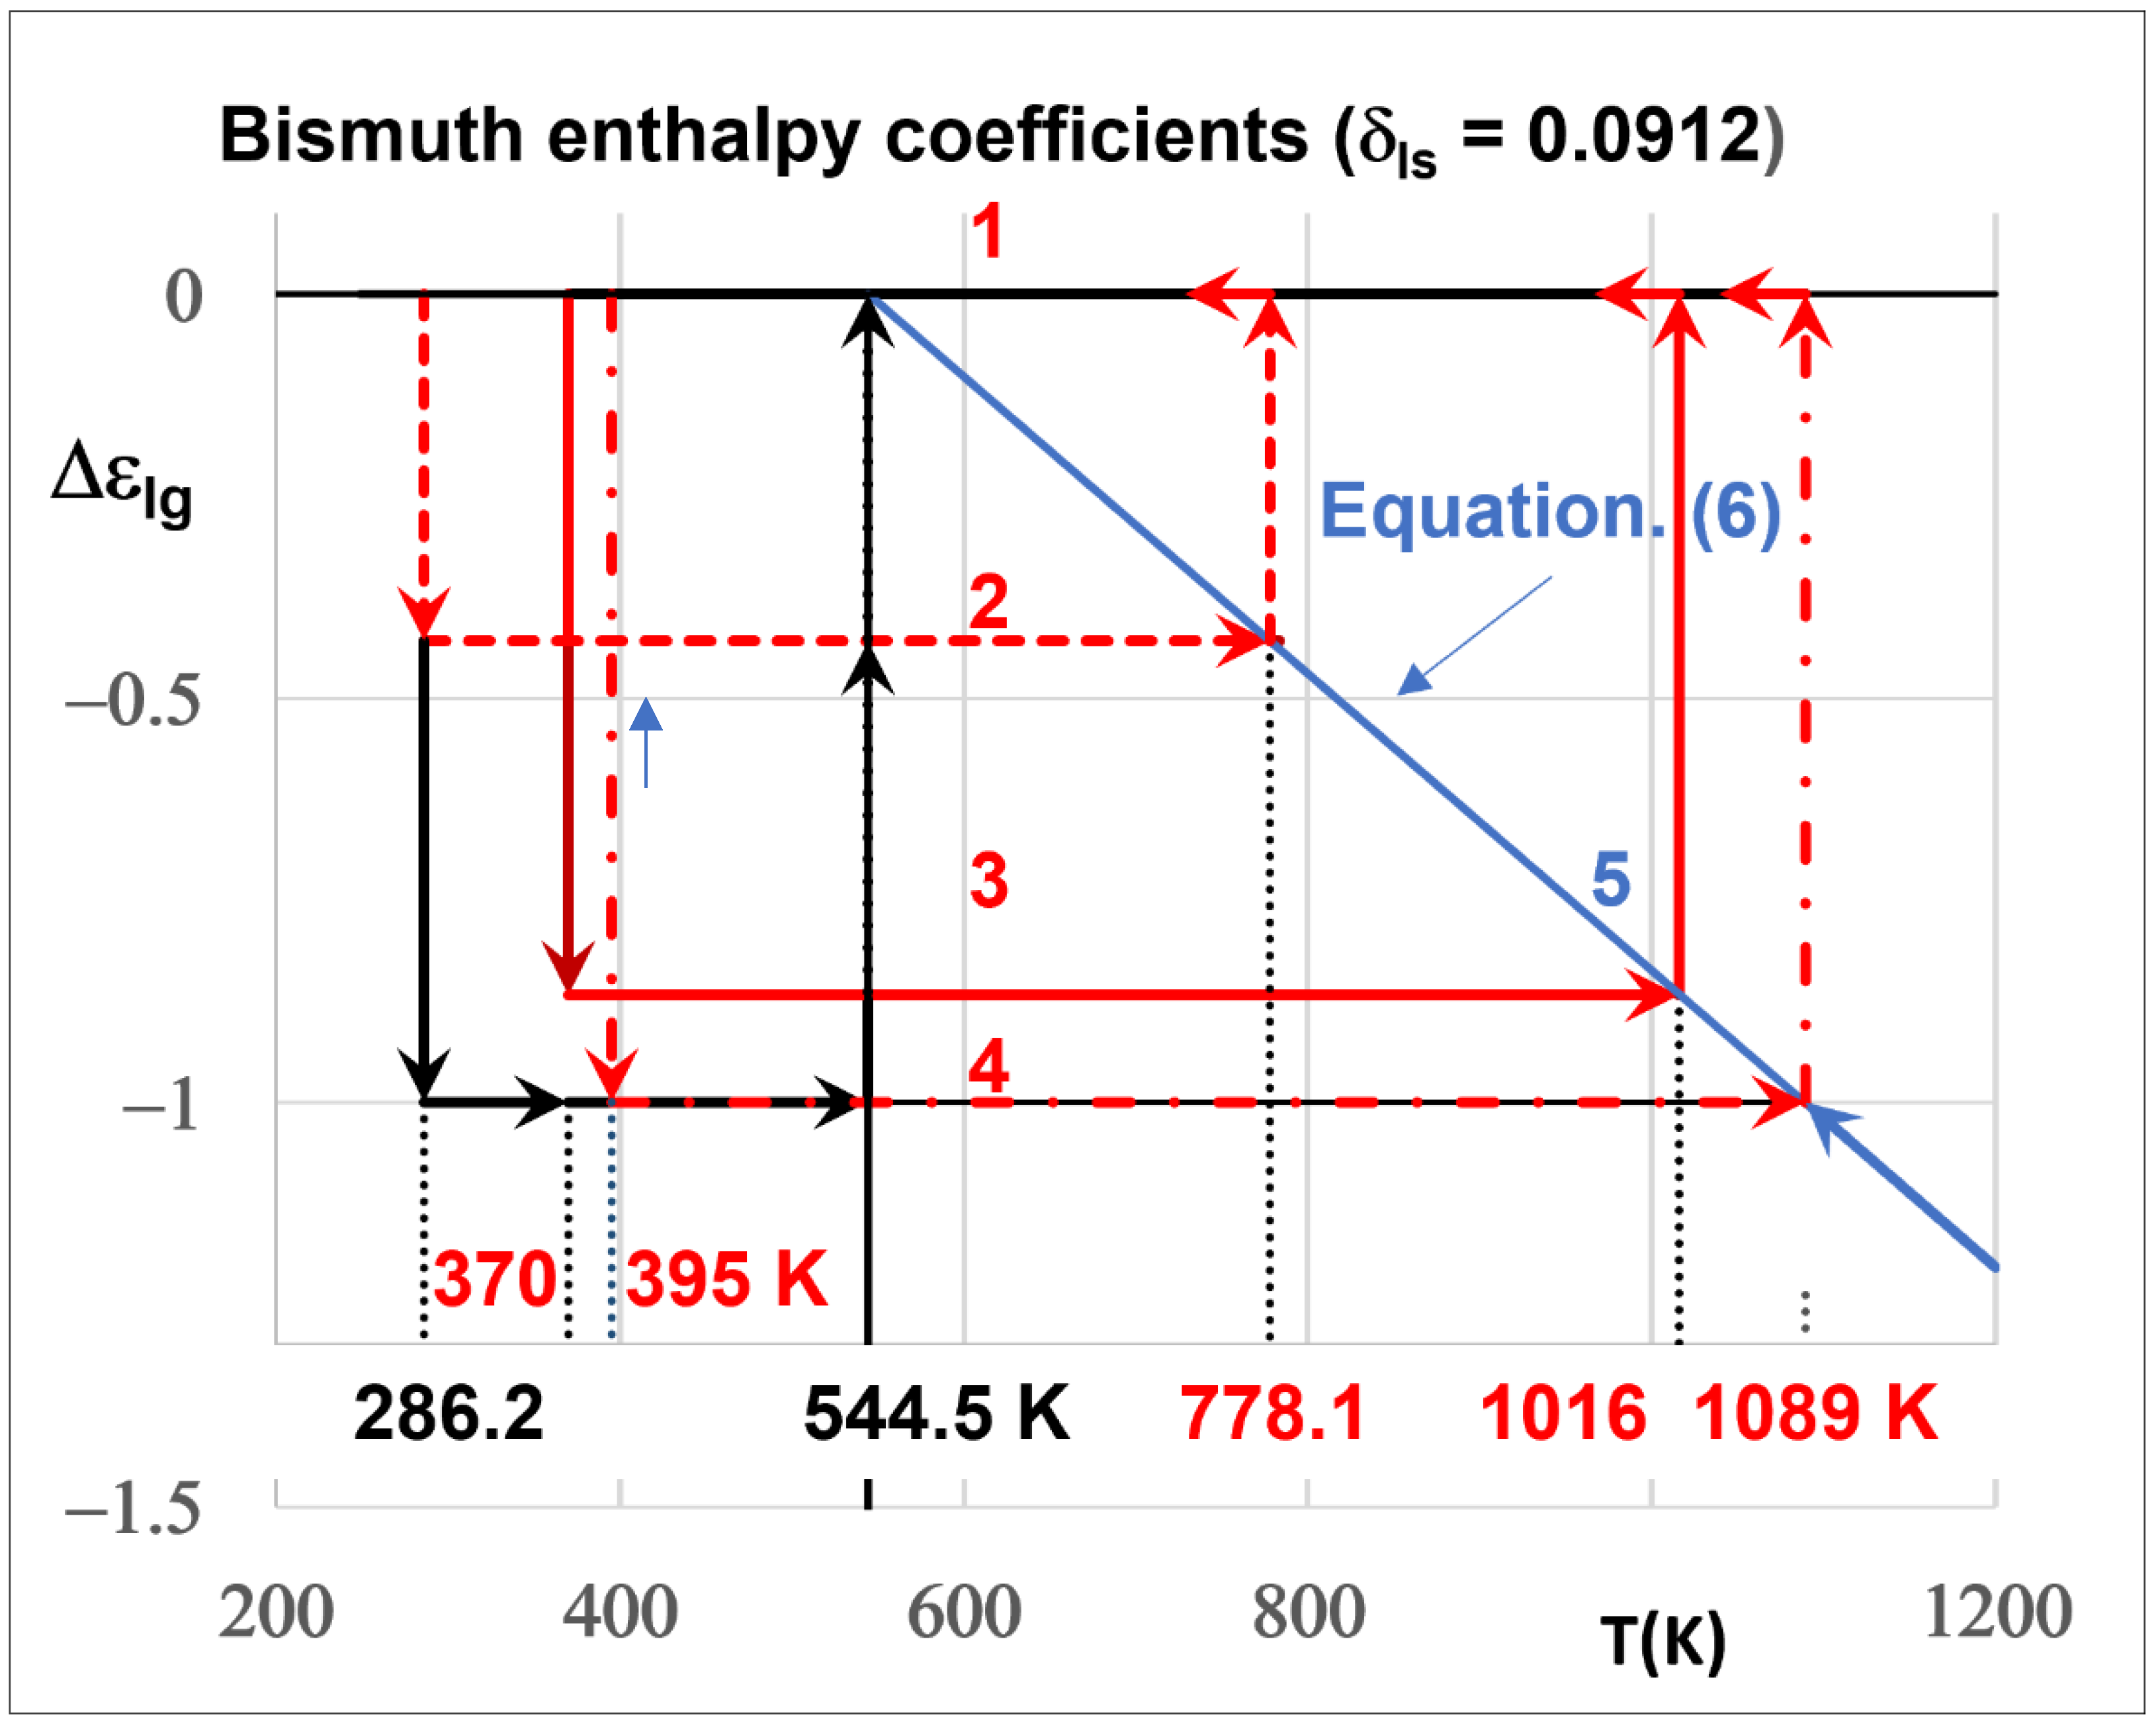
Liquid-liquid transitions in bismuth were observed along lines (1,2,4,5) in Figure 1, by several authors using differential scanning calorimetry (DSC) or differential thermal analysis (DTA) at various heating rates. In fact, this leads to vitreous transitions at Tg/Tm = 1.4291, 1.4384, 1.8675 and 2 for Tx/Tm = 0.70811, 0.70767, 0.80681 and 1, respectively, without recovery of the endothermic heat (Δε Hm) at these temperatures [1,3,4]. The value of εgs0 for bismuth was equal to 0.1907 corresponding to δls = 0.0912 [23].
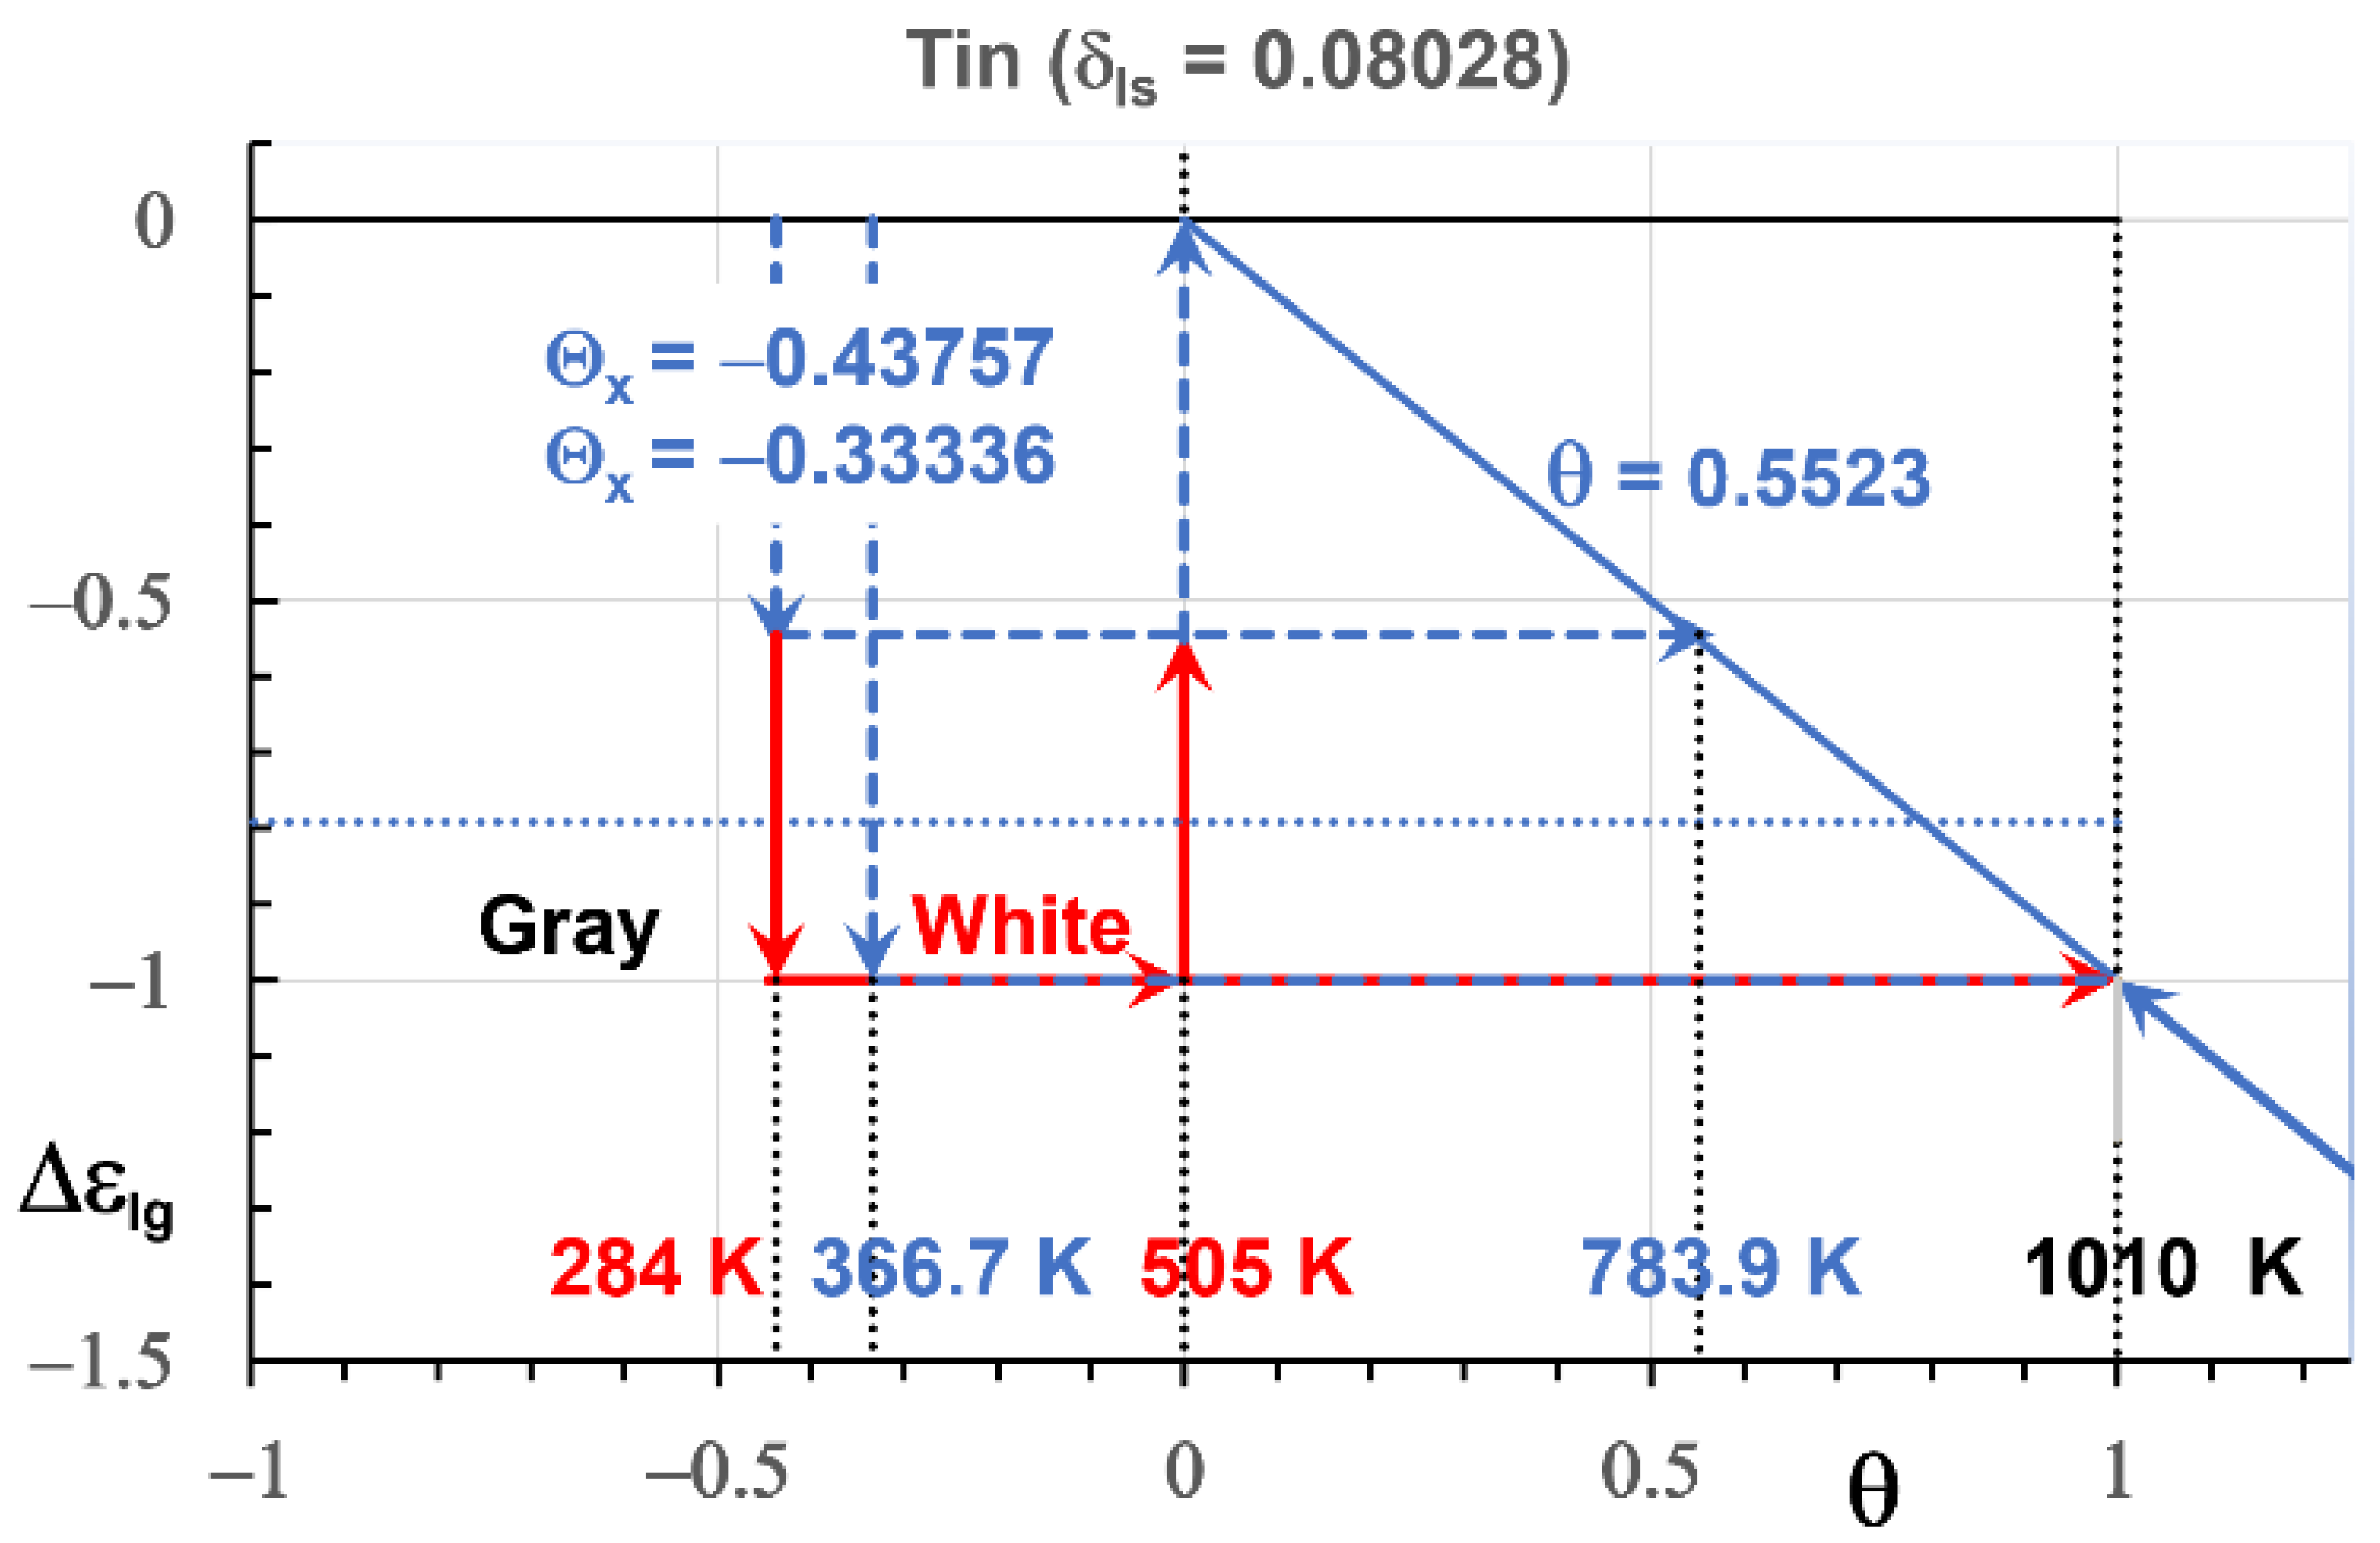
The vertical lines (3,5) in Figure 1 are those of tin and correspond to Tg/Tm = 1.5523 (Tg = 783.9 K) and 2 (Tg = 2 Tm). The horizontal line Tx/Tm = 0.71022 determines Tg/Tm = 1.5523. Two liquid-liquid transitions, occurring at Tg/Tm = 1.5523 and 2 are known up until now. Only Tg/Tm = 1.5523 is characterized as a glass transition [5].
The Bi glass transition was not reproduced at Tg/Tm = 2 during cooling because all bonds were erased during heating far above Tg/Tm = 2, as observed with the heating and cooling rates of 2 K/min [4]
In contrast, the Sn transition at Tg/Tm = 2.168, during heating, disappeared during cooling and gave rise to a new transition at Tg/Tm = 1.832, characterizing a first-order transition at Tg/Tm = 2, and observing that [(2.168 + 1.832)/2 = 2] with heating and cooling rates of 7.5 K/min [3]. The first-order transition at Tg/Tm = 1.832 (Tg = 652 °C) was reproduced during the second heating and cooling at 10 °C/min and could correspond to Δε = 0.832.
The resistivity measurements [4] after the second heating were much weaker than those obtained during the first heating of Sn and Bi. At the highest temperature T = 2.28 Tm, the ordered fractions did not disappear because Tg is expected to be on the order of 3 Tm. The resistivity decreases were equal to 22% for tin and 16.7% for Bi.

4. Singular Enthalpy Coefficients

We examine the case where the glassy phase is formed at Tx. Characteristic values of Δεlg (θ) = −Δε at various temperatures Tx would correspond to various percolation thresholds of configurons. The enthalpy coefficient (Δεlg = −Δε) of Phase 3 is constant up to Tn+ = Tg. The transition at Tg leads to a new liquid state with Δεlg linearly decreasing with temperature in agreement with Equation (6). Consequently, the melt-specific heat, being proportional to the derivative (Δεlg/dT), undergoes a jump equal to Δε Hm/Tm at Tg = Tn+.

4.1. Bismuth

The weakest glass transition temperature of bismuth was predicted at Tg = 202.46 K [23]. The singular enthalpy coefficients Δε were determined: Δεlg = 0, Δεlg0 = 0.1907, −Δεlgg) = 0.094065, −Δεlg0m = −2/3) = 0.10594, −Δεlg (θ = −1) = 0.238375 and Δεlg = −1. The experimental coefficients (Δε) giving rise to θn+ = 778/544.5 −1 = 0.429 and 784.6/544.5 −1 = 0.44096 were obtained with a heating rate of 5 K/min and were nearly equal to the theoretical values (0.42908 = 0.1907 + 0.23838) and (0.43838 = 0.094065 + 0.10594 + 0.23838) [1]. In Figure 2, these two transitions are nucleated at Tx = 286.2 and 288 K during undercooling. Only the transition at T = 286.2 K is represented, leading to the horizontal line (2) up to Tg = 778.1 K. The observed coefficient Δε = 0.8675 [3], nucleated at T = 370 K, was equal to the sum (0.42908 + 0.43838) up to Tg = 1016 K along Line (3) [23]. The coefficient (Δε = 1) along Line (4), nucleated at 395 K, without crystallization at Tm, disappears at Tg = 2 Tm = 1089 K. We expect, by reversing heating to cooling at a reduced temperature slightly lower than Tg, that the enthalpy coefficient Δεlg = −Δε will fall to zero after an incubation time, starting from a glassy fraction equal to Δε.
The enthalpy coefficient variation of Phase 3 along Line (5) in Figure 2, obeying to Equation (6), is obtained after a transition at Tg = Tn+ followed by continuous heating through the various glass transitions. The latent heat (Δε Hm) would be recovered by reversing heating to cooling slightly below Tg.

4.2. Tin

The weakest glass transition temperature of tin is Tg = 185.2 K (θg = −0.63332), applying Equations (7) and (8) for Δεgs0 = 0.167, (δls = 0.08028). The singular enthalpy coefficients of liquid tin are Δεlg = 0, Δεlg0 = 0.167, −Δεlgg) = 0.08373, −Δεlg0m = −2/3) = 0.09278, −Δεlg (θ = −1) = 0.20875 and −Δεlg = 1. A sum of all basic coefficients leads to Δε = 0.5523. Here, too, the combination of singular enthalpy coefficients determines the glass transition at Tg/Tm.
In Figure 3, the transition occurring at Tx = 284 K (θx = −0.43757) gives rise to a glassy fraction f = 0.5523 and a glass transition at Tg/Tm = 1.5523 (Tg = 783.9 K) calculated with εgs0 = 0.167 and Equations (6) and (7). The temperature (284 K) separates two crystalline phases corresponding to gray and white tin. The temperature Tx = 284 K, corresponding to the melting temperature Tm ≅ 284 K of gray tin, is difficult to observe because of the concomitant formation of a glass phase at the same temperature [57]. Above 284 K, the liquid fraction of gray phase is a glass with Tg = 783.9 K, coexisting with a crystallized fraction (1 − 0.5523 = 0.4477) of white tin up to Tm. A glass transition temperature was observed in tin at Tg ≅ 780 K, confirming the existence of a glassy fraction above Tm [5]. The glassy phase corresponding to f = Δε = 1 would be nucleated at Tx = 366.7 K and heated without crystallization at Tm, up to Tg = 2 Tm = 1010 K. We will see that the glass transition at 1010 K observed by resistivity measurements is reversible [4].
As a conclusion of this chapter, the existence of singular glassy fractions (f) in liquid Bi and Sn is predicted. Liquid-liquid transitions are observed and occur at the predicted glass transition temperatures. The latent heat (Δε Hm) is absent during heating as expected for glass transitions and could be present by reversing heating to cooling slightly below Tg.

5. Experimental Densities of Bi and Sn during Heating

Density varies linearly with increasing temperature, T (K), above Tm in liquid elements [3,57,58,59,60,61]:
d = d 0 a T .
where d0 is a density at 0 K. In general, density measurements were made after melting the crystalline phase in the absence of temperature Tx resulting from undercooling and reheating. Nevertheless, liquid-liquid transitions were observed with heating rates between 0.1 and 20 °C/min at temperatures (Tn+) [23]. Consequently, new atomic bonds are induced by relaxation of liquid state near Tn+ [22]. The singular coefficient Δε belonging to lower enthalpy phases determines the temperature Tn+ = Tg. Bond formation gives rise, at very low heating rate, to weak endothermic latent heat, dispersing the liquid density measurements above Tm. Density, d, is expected to be reduced for bismuth and increased for tin by this enthalpy relaxation up to Tg = 2 Tm. Then, Equation (9) can be written as a function of θ = Δε, applying Equations (4) and (6):
d = d 0 a T m   ( 1 + θ n + ) = d 0 a T m   ( 1 ± ε l g ) .
Density measurements would lead to dispersed results because they would be dependent on the measurement time and on the amplitude of the relaxed enthalpy.

5.1. Bismuth Density

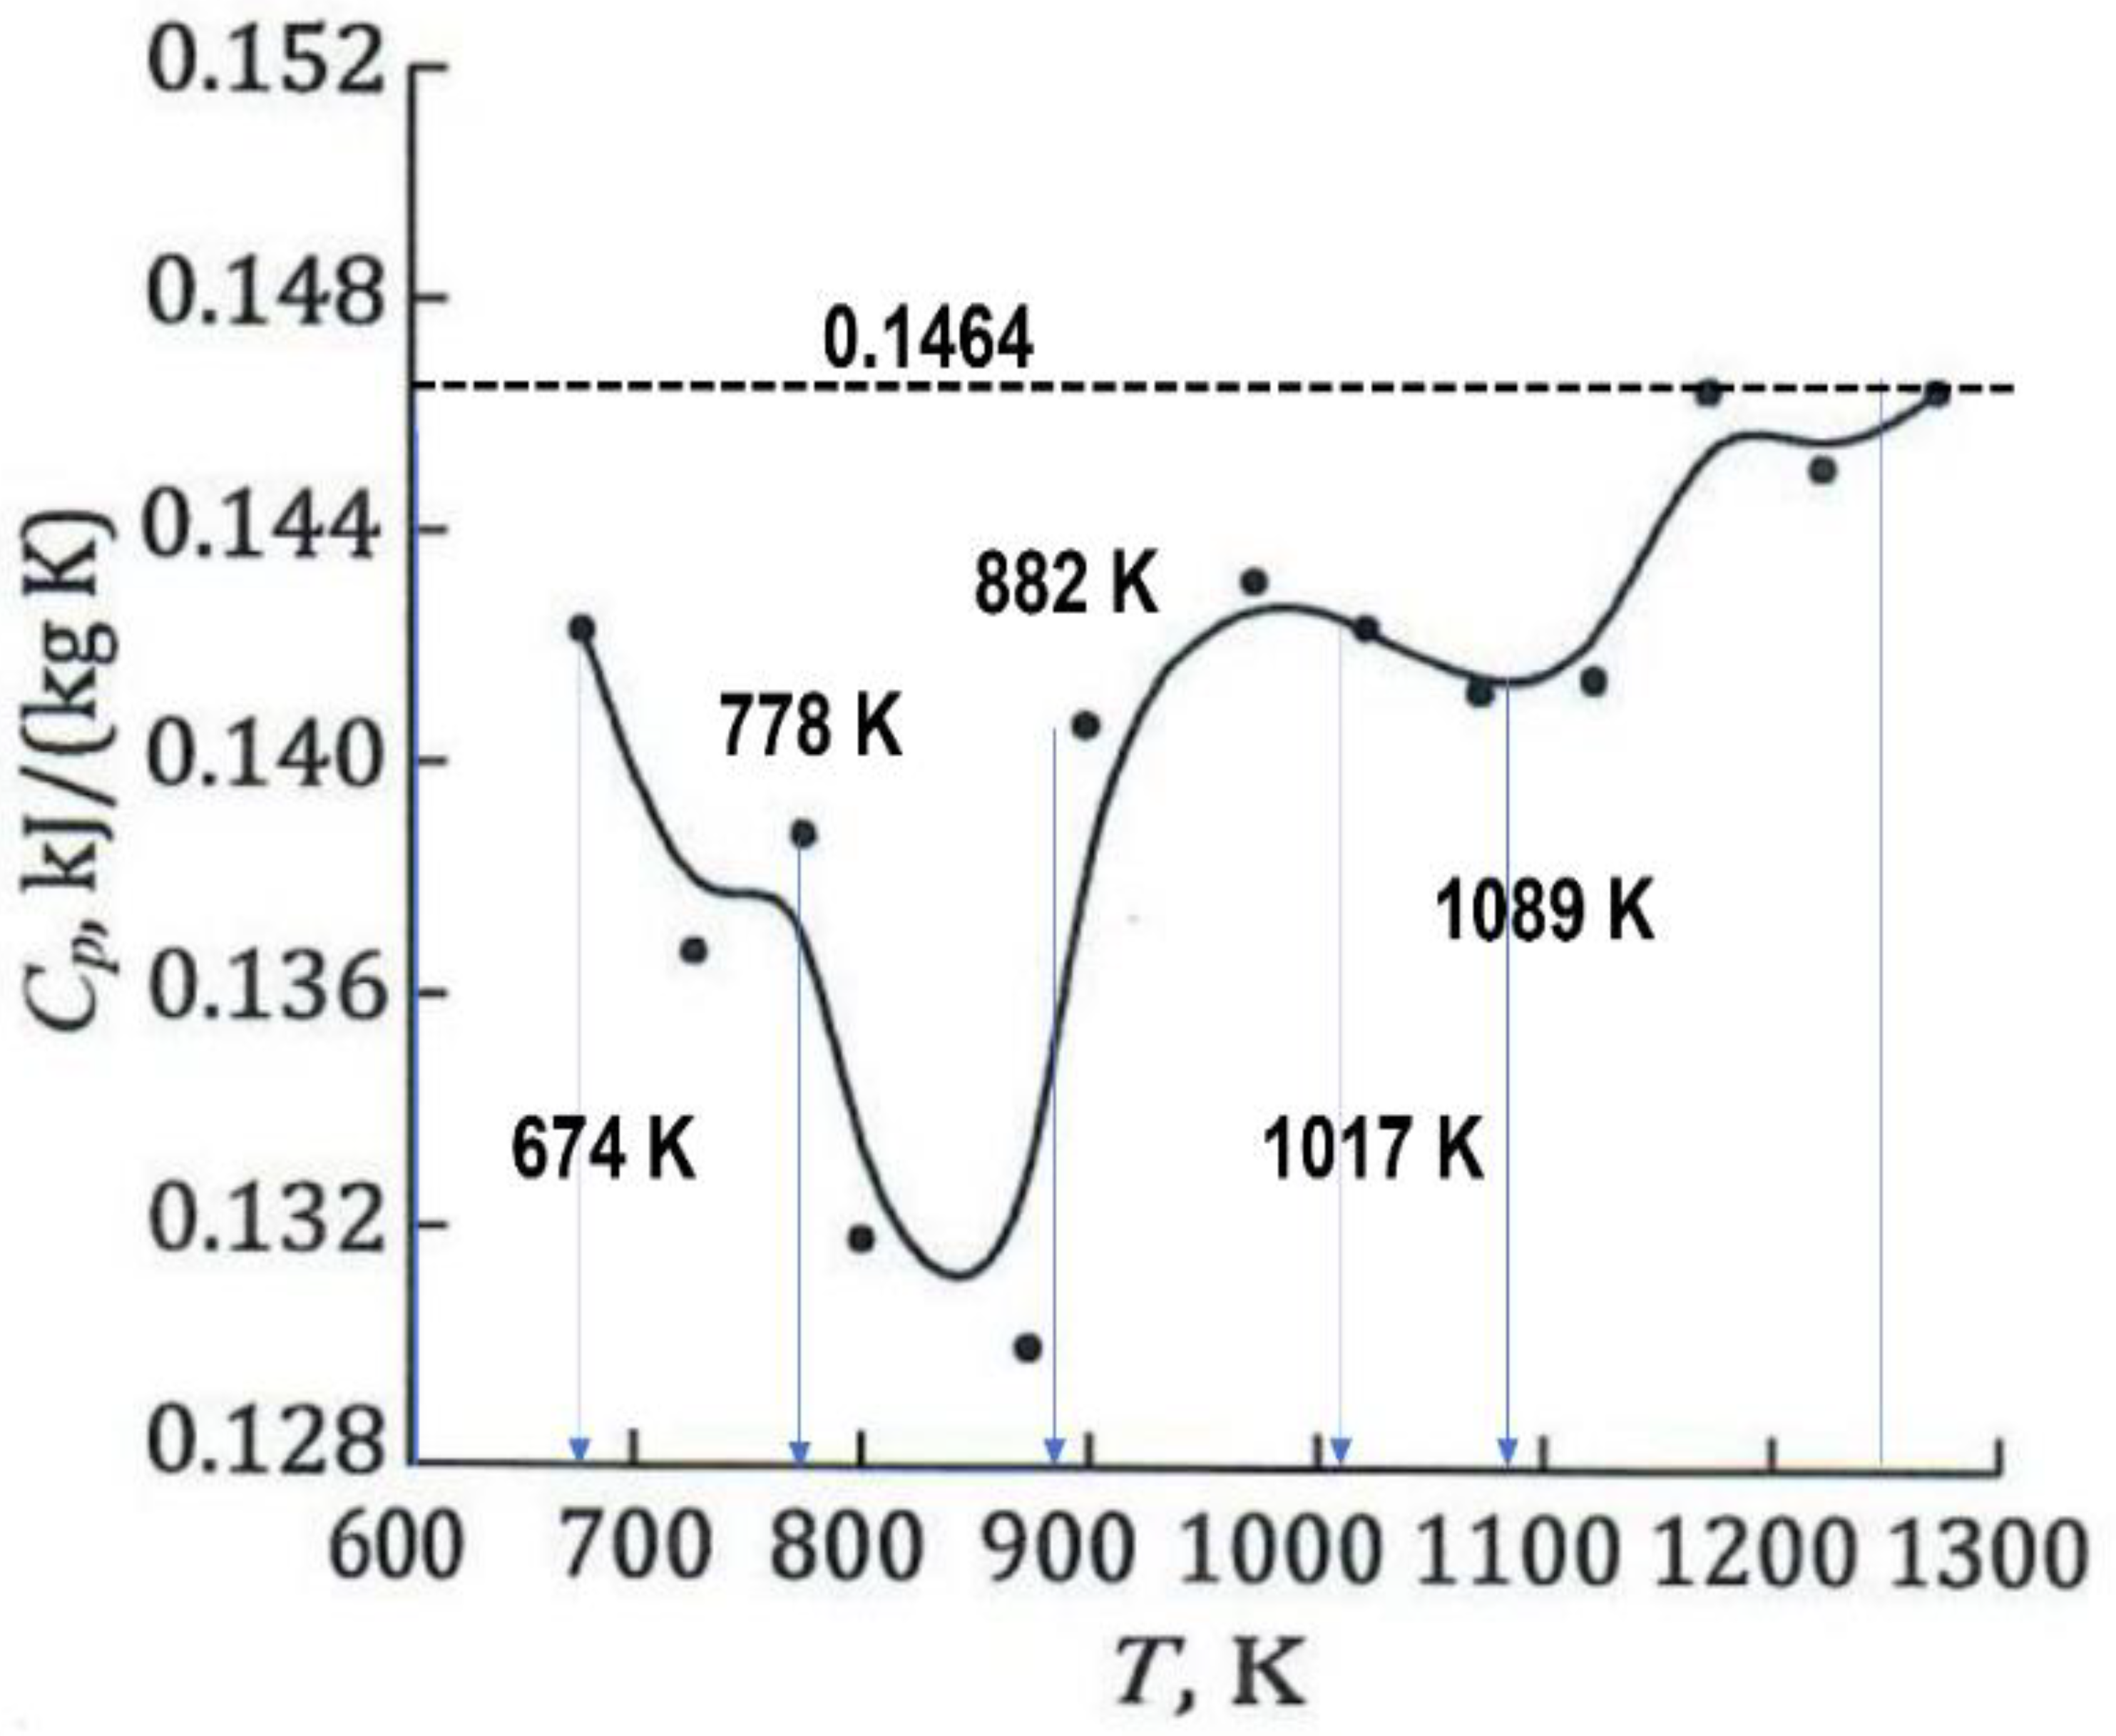
The specific heat of bismuth above Tm, measured point after point [62], is strongly dispersed as reproduced in Figure 4. Few singular values of Tn+ are indicated. The deepest one occurs at 862 K (Δε = 2 × 0.23838 + 0.10594 = 0.5827) and the highest ones at 1017 K (Δε = 0.8675) and 1089 K (Δε = 1). The specific heat (0.147 J/K/g) at Tm is recovered at 1180 K showing that the transition width at 1089 K is about 100 K in this case. These results show that the dispersion of measurements attains 12%, and that these weak glassy fractions induced by relaxation have glass transition temperatures equal to Tn+. Consequently, liquid-liquid transitions observed around each temperature Tn+ would correspond to fractions much weaker than the singular value (Δε) associated with Tn+ Dispersion is expected for density measurements below the line defined by Equation (9).
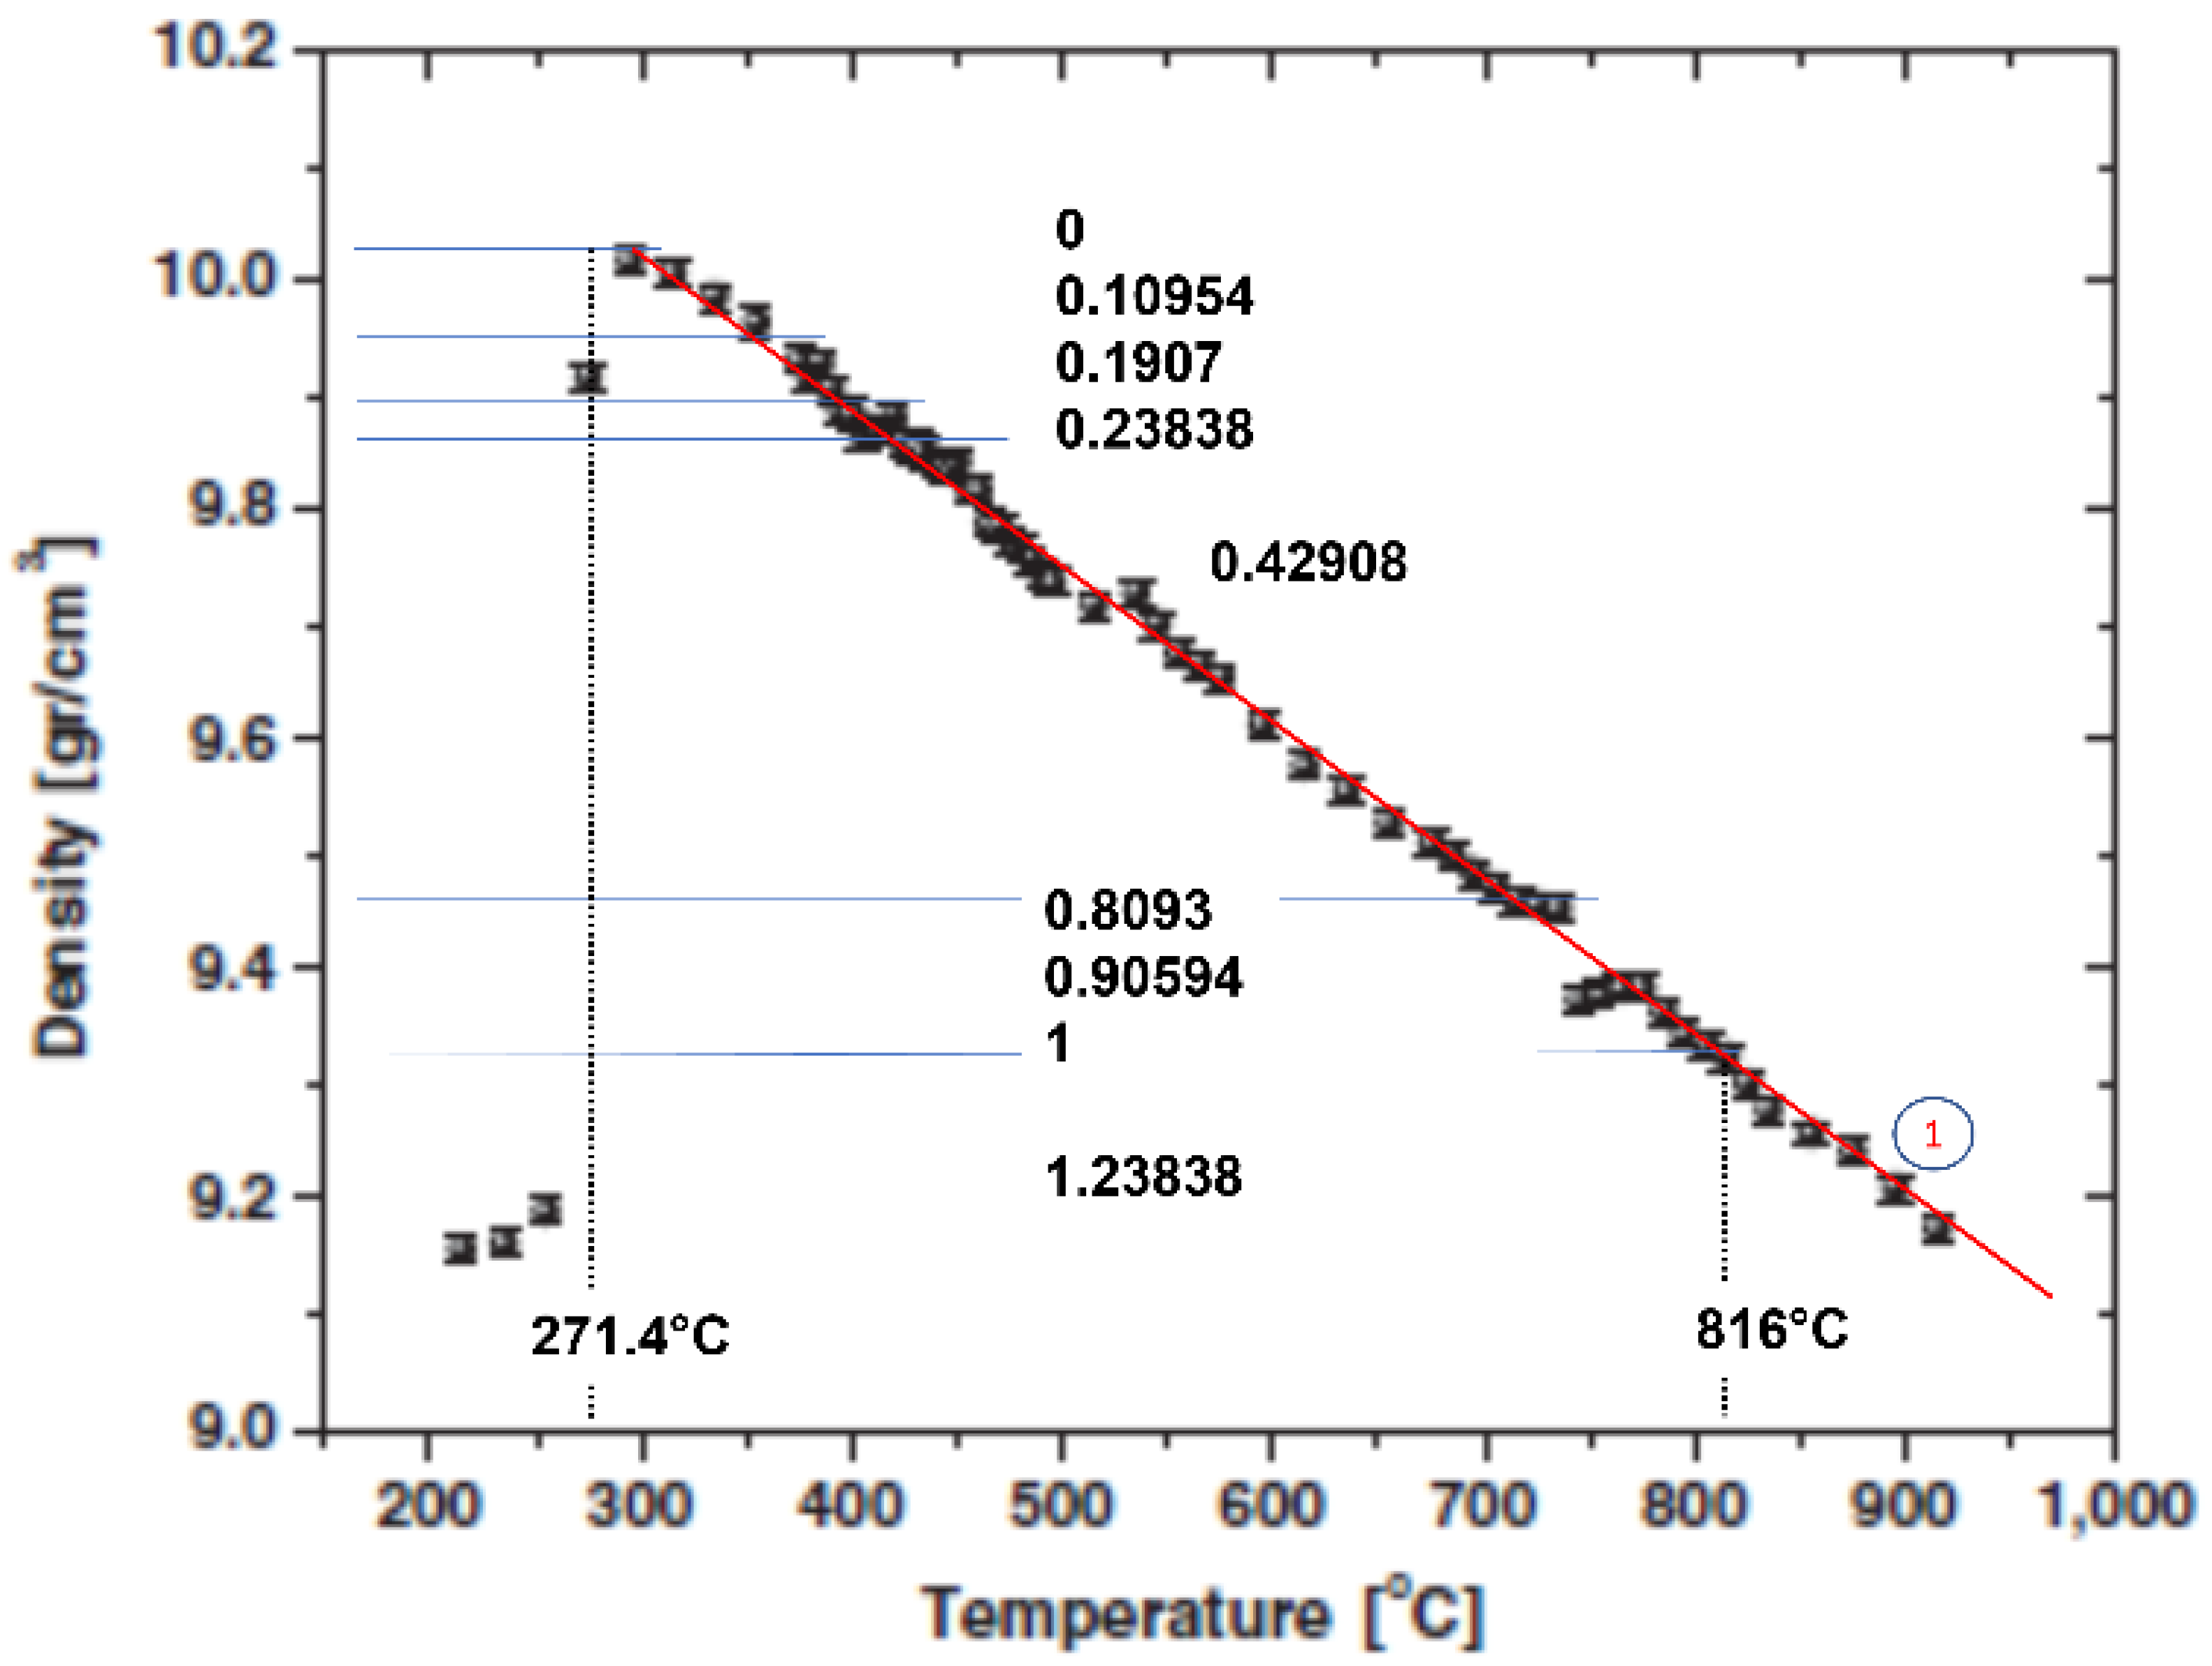
The density of liquid bismuth was measured by gamma attenuation from the melting point to 1000 °C in discrete steps of 5 °C and reproduced in Figure 5 [3]. Values of density were stabilized at singular coefficients, 0.42908, 0.8093 and 0.90594, each of them being a sum of basic coefficients corresponding to a glassy phase. A transition between 0.8093 and 0.90594, occurring at 1.8675 Tm (743.8 °C) was observed by DTA at 0.1 °C/min.
The density change at Tm corresponds to a melting heat of 1.23838 Hm instead of Hm, because it contains the enthalpy (0.23838 Hm) provided by Equation (4), which corresponds to the initial formation of Phase 3 for Tg/Tm = 1 as shown in Figure 1. There is no visible transition in Figure 5 at T = 2 Tm as shown by the quasi-continuity of the density.

5.2. Tin Density

The density of tin is represented by Lines (1–3) in Figure 6: solid tin, Line (1) [60], and liquid tin, Lines (2) [59] and (3) [63]. Lines (2,3) are chosen among measurements with only 50 kg/m3 of error reviewed by Alchagirov and Chochaeva [59]. The difference in density, 82 kg/m3 at 2 Tm is higher than the measurement error. Lines (2,3) could represent two liquid densities that are parallel and separated by approximately 75 kg/m3 or less inside the measurement error. This phenomenon, if confirmed, would be associated with the presence of a weak glassy fraction f << 0.20875 from 0 K to 2 Tm and beyond as predicted. The density change at Tm and the melting heat depend on the thermal history and may include glassy fractions that are melted at very high temperatures beyond 3 Tm as predicted by the glassy phase diagram.

6. The Heat Capacities during Heating

The specific heat (Cp) is reduced by a contribution (ΔCp) above Tm during heating in the presence of a glassy fraction f = Δε after an enthalpy change (−Δε Hm) and a first-order transition at Tx:
δ C p = T ( δ S / δ θ ) p ( δ θ / δ T ) p = T S m / T m
where S = ε H m / T m   = θ H m / T m represents the entropy of the glassy phase fraction at Tn+ with Δε = θ, applying Equation (6). There is no specific heat and density added in the absence of glassy fraction for Δε = 0 in all liquids. Equation (11) is not applied in the absence of first-order transition at Tx.
Applying Equation (11) leads to Cp = 0 at Tg = 2 Tm,
For Sn:
C p = 28.43 0.0563 × ( T T m   ) ,
with Hm = 7179 J/mole [64] and Tm = 505 K.
At Tm, Cp = 28.43 J/mole in agreement with Chen’s measurements [65] after adding 0.9 mJ/mole corresponding to the electronic specific heat contribution of tin [66].
For Bi:
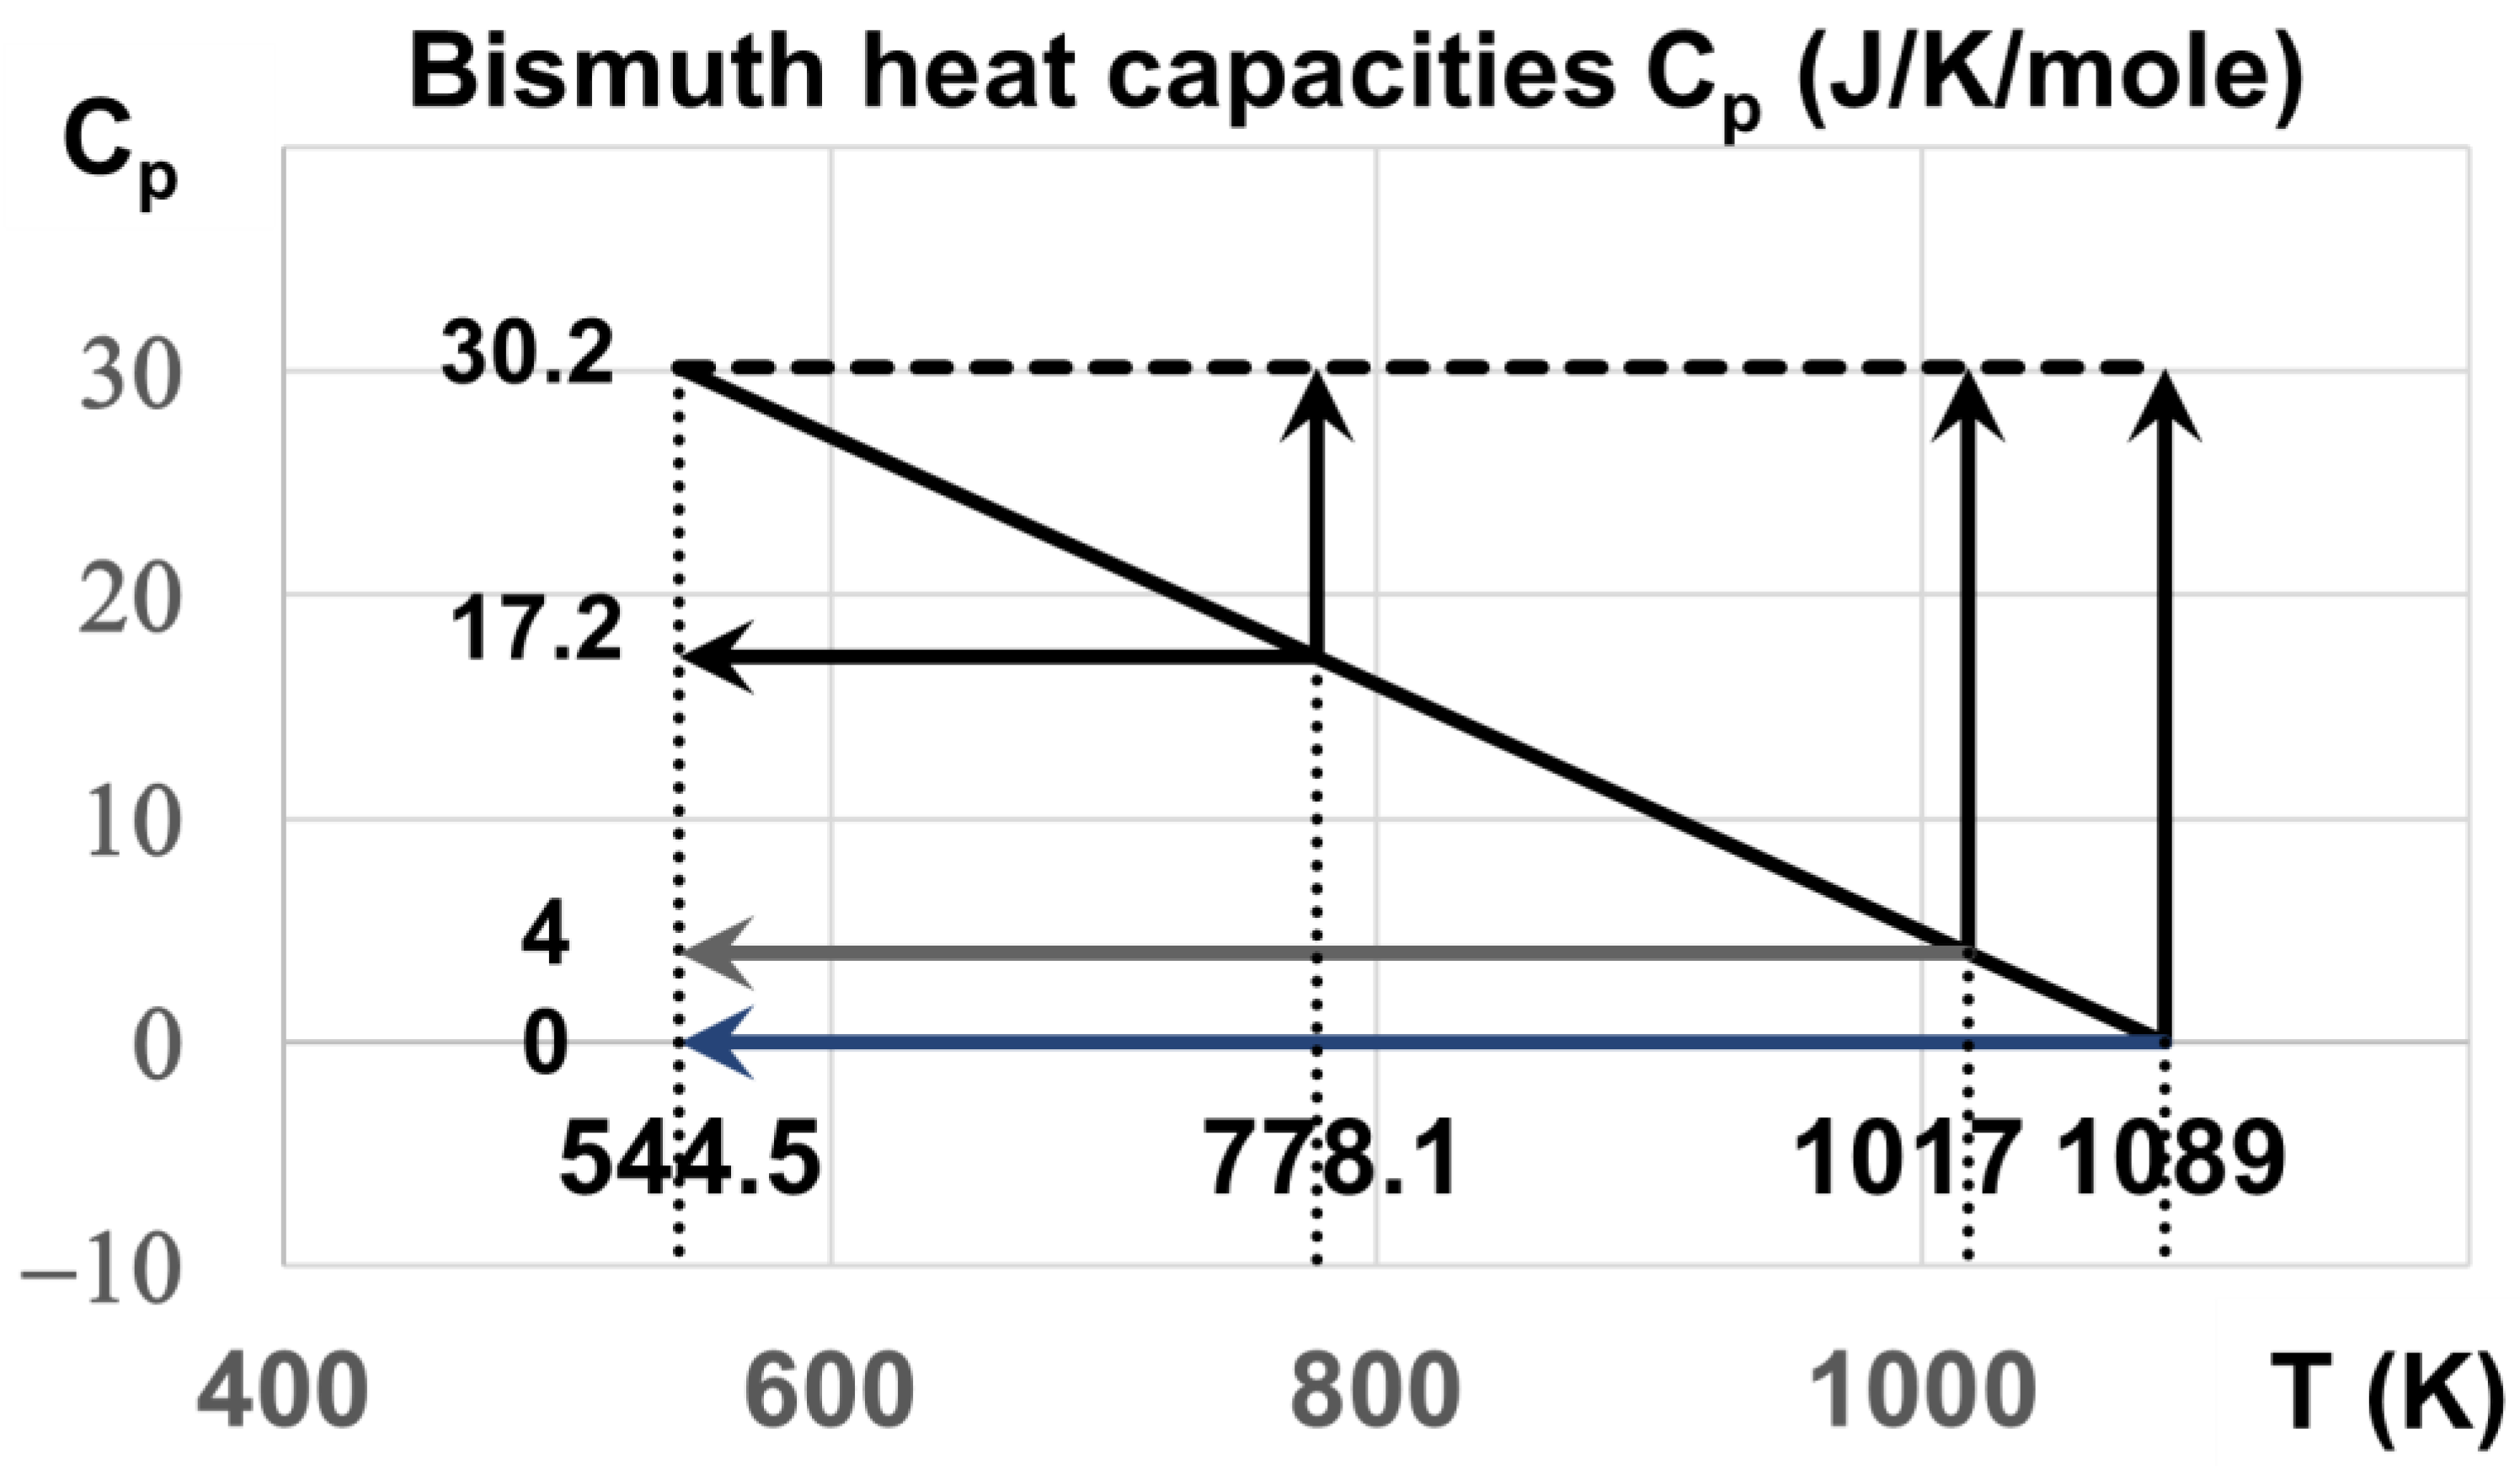
C p = 30.2 0.05546 ( T T m ) ,
with Tm = 544.5 K. At Tm, Cp = 30.2 J/mole [67] is used to determine Hm = 8613 J/mole. The measured melting enthalpy is 1.23838 Hm leading to 10,662 J/mole inside an uncertainty of measurements varying from 10,480 to 11,300 J/mole [68].
The constants 28.43 and 30.2 J/K/mole are values of Cp at Tm in the absence of glassy phases. These heat capacities are equal to zero at T = 2 Tm and to 28.43 and 30.2 J/mole at temperatures higher than 2 Tm as shown for Sn and Bi in Figure 7 and Figure 8. When a fraction (f) of liquid is no longer in a glassy state above the temperature (T), (Cp) linearly decreases from 28.43 for Sn to zero and from 30.2 J/K/mole to zero for Bi. These specific heat variations, expected during heating, are plotted as a function of temperature for Sn and Bi in Figure 7 and Figure 8 without latent heat recovery as expected for glass transitions.

7. Other Experimental Observations of Glassy States above Tm

7.1. In Tin

A glass transition was detected for the first time around 783.9 K in agreement with our predictions [5]. This transition induced a specific heat jump of about 1.8 J/K/mole instead of 28.4 J/K/mole corresponding to a glassy fraction f ≅ 1.8/28.4 = 6.3%. This glassy fraction was induced in a “stepwise-scanning mode: the temperature during the thermal equilibration stage changed with time and gradually approached a constant value in about 60 min”. The peak of ΔCp, observed during this slow heating, accompanied by critical phenomena, could be attributed to the thermodynamic transition of configurons [33,69]. The jump of ΔCp measured at 4 K/min was weaker because the nucleation time of new bonds was much lower.

7.2. In Bismuth

DTA at 0.1 °C/min reveals an endothermic latent heat of the order of 20 to 100 J/mole [3] at Tg =1.8675 Tm. A transition width (ΔT) of 200 K was observed at 1089 K by resistivity measurements with 2 °C/min and a width (ΔT = 10 K) expected for R = 0.1 °C/min [4]. We attribute this liquid-liquid transition to a glassy fraction transition of the order of 6.6% with 20 J/mole and 33% with 100 J/mole] assuming a transition width of 10 K. A second endothermic heat was observed by DTA at T = 2 Tm = 1089 K corresponding to a second glass transition and to the enthalpy relaxed during 720 min between 1017 and 1089 K.
Configuron thermodynamic transition was revealed by structural changes at the glass transition via radial distribution functions [56,70]. The first sharp diffraction minimum in the pair distribution function was shown to contain information on structural changes in amorphous materials at the glass transition temperature (Tg). An additional feature of such configuron transition was determined by measuring the temperature dependence of the structure factor of molten bismuth, −S(q)” [3]. The authors observed, in their neutron diffraction analysis, an additional feature in the measurement that appeared around the melting temperature of bismuth. “Pair distribution function curves (g(r)) were calculated for each (S(q)) measurement”. “At and above melting, both the S(q) and g(r) curves were characterized by a shoulder located on the high q and r side of the first peak, respectively”. The temperature dependence of the coordination numbers lead to the number of atoms contributed by the shoulder, NShoulder(T). The derivative of NShoulder with respect to temperature, showed a discontinuity at the transition point at 1089 K, and was associated with this temperature-driven transformation and a structural change. This structural change is a signature of the thermodynamic transition of configurons [33].

7.3. BiSb20 wt%

DSC revealed that Cp was equal to zero at 1070 °C with a heating rate of 20 °C/min [4]. From our model, we deduce that the glassy fraction (f) was 100%. The liquidus temperature of this alloy is 425 °C (698 K). The glass transition, occurring at 1070 °C (1343 K), was weaker than 2 Tm = 1396 K. The specific heat increased from 1070 °C to 1123 °C without latent heat. The transition width (2000 K) is expected to be 10 times wider than at 2 K/min. Consequently, the recovery of ΔCp, for a temperature increase of 53 K, is of the order of 53/2000 ≅ 2.6% of its value at Tm. We conclude that the glassy fraction (f = 100%) was induced at a temperature Tx < Tm. As a result, the rapid increase of the heating rate would have to induce the first order transition at Tx < Tm. This experiment showed for the first time that a glassy phase of 100% can be obtained with a heating rate of 20 K/min. The latent heat equal to Hm is not recovered as predicted in Figure 7.

7.4. InSn80 wt%

An internal friction method was used to study the structural changes of InSn80 wt% [71]. This alloy has a melting temperature of about 190°C (463 K) and a glass transition temperature expected at 2 Tm = 926 K (653 °C). A minimum of internal friction occurs at 625 °C and a maximum at 700 °C. Based on the results of a diffraction experiment around 700 °C, the liquid structures before and after the peak are very different [4]. “Before the change, there are residual covalent bonds of solid tin in the melt and during the transition, the residual bonds are broken and at the same time, new atomic bonds build up, with a relatively uniform melt forming”. This description provided by [4] is known to be due to the percolation threshold of configurons [33].

7.5. PbSn61.9 wt%

This eutectic composition has a melting temperature of 183 °C (456 K). The highest glass transition temperature is predicted at 912 K (639 °C). The internal friction has a maximum at 670 °C and a minimum at 560 °C with a heating rate of 2.5 °C/min and a maximum at 712 °C and a minimum at 600 °C with 6 °C/min. This liquid-liquid transition temperature increases with the heating rate as observed in all glasses [4].

8. Another Method to Stabilize Glassy States above (2 Tm)

A process was described by Zu F.Q. [4], ignoring at this time that resistivity decreases could be due to the formation of glassy fractions, added after several cooling cycles to various temperatures Tx < Tm, followed by successive reheating as shown in Figure 9. Each value of Tx/Tm < 0.7069 lead to a glass transition much higher than 2 Tm as shown by the glassy phase diagram of Figure 1. These various reheating cycles enriched the total glassy fraction as shown by resistivity reductions of 40% after three heating of Cu-Sb76.5 wt%, of 22% in tin and 16.7% in bismuth after two heating cycles. In addition, depending on heating rate, another glass transition occurs at Tm < Tn+ < 2 Tm in various alloys such as InSn80 wt%, InBi32 wt% at R = 3 °C/min and CuSb76.5 wt% at 5 °C/min. They were due to the formation of very weak glassy fractions (f), depending on heating and cooling rates. The residual resistivity is equal to 100 µΩ·cm at Tm during the first heating. Consequently, the formation of high glassy fractions with Tg >> 2 Tm could be attained after adding new thermal cycles, leading to a maximum resistivity fall. Reheating cycles could stabilize the glassy phase above (Tn+ = 2 Tm).

9. Conclusions

Liquid-liquid transitions are observed below and above Tm.
First-order transitions, predicted by the NCHN model, occur at Tx < Tm, building glassy phase fractions (f = Δε) and crystallized fractions (1 − Δε) after supercooling the melt. Melting of glassy fractions occurs at temperatures Tn+ > Tm at the percolation threshold of bonds. One of them induces a glass enthalpy equal to the melting enthalpy (Δε = 1) and a zero specific heat, without crystallized fraction, up to the glass transition (Tg = 2 Tm). All glassy fractions are expected to have enthalpies equal to zero, after reversing heating to cooling below Tn+ and a long time of incubation at a temperature close to Tg.
Liquid-liquid transitions between the melting temperature (Tm) and (2 Tm) are observed in the absence of first order transition at Tx < Tm and are reminiscent of glassy fractions (f) formed at temperatures (Tx) weaker than (Tm) through first-order transitions. These weak fractions correspond to singular values (Δε) of enthalpy coefficients (Δεlg (θ) = −Δε) of a new phase called “Phase 3”, and to typical percolation thresholds of configurons at various temperatures (Tn+ = Tg). These fractions are slowly induced near (Tn+) by relaxation in the absence of first order transition prior to melting.
All these liquid-liquid transitions above Tm are glass transitions.
Several situations are encountered in bismuth and tin:
(1)
After melting Bi and Sn at T = Tm, weak fractions (f) were built by slow heating (0.1 °C/min for Bi and one hour between each measurement for Sn) and melted at θg = θn+ = (Tn+ − Tm)/Tm = Δε. Liquid-liquid transitions were observed at 1.8675 Tm for bismuth and 1.5523 Tm for Sn. The glassy character of these transitions is confirmed by structural transitions that we attribute to the melting of configurons. An observed glass transition in Sn was also characterized by a weak specific heat jump predicted by the NCHN model and a peak at 1.5523 Tm due to the thermodynamic character of a transition obeying critical exponents associated with configuron percolation. There is no endothermic latent heat (Δε Hm) during heating.
(2)
After melting Bi and Sn at T = Tm, transitions were also observed at T = 2 Tm by DTA and (or) resistivity that we consider as new glass transitions. The transition was reversible only for Sn. A weak endothermic heat instead of Hm was observed for Bi at 2 Tm. The glassy states of Bi and Sn could have a density equal to that of the liquid at Tm only after reversing heating to cooling and a long incubation time close to Tm.
(3)
After melting Bi at T = Tm, high-resolution measurements of the density showed the existence of singular values corresponding to those of the enthalpy of Phase 3. The melting heat at Tm corresponds to 1.23838 Hm instead of Hm including, in addition, the latent heat of glassy phase as predicted by the NCHN model.
(4)
A glassy phase diagram is proposed for systems having their lowest transition determined by their Lindemann coefficients. Each first order transition at Tx < Tm leads to multiple glass transitions. The possible existence of weak glassy fractions (f) for Tx/Tm < 0.7069, with glass transition temperatures much higher than (2 Tm) is envisaged (beyond (3 Tm) for f < 22.45%). Resistivity measurements showed decreases in Bi and Sn from Tm to 2 Tm and beyond, after thermal cycling between undercooled liquid and solid states.
(5)
The glassy phase formations at Tx are accompanied by latent heats, without being recovered at Tn+ with (Tm < Tn+ < 2 Tm) during heating. Predictions of their contribution equal to (θn+ Hm/Tm) are proposed for Tn+ = Tg ≤ 2 Tm. The heat capacity linearly decreases down to zero when Δε increases up to 1 (Tn+ = 2 Tm). An enthalpy equal to zero, down to Tm, would be induced by reversing heating to cooling from a temperature slightly weaker than Tg = Tn+. We show, for the first time, that the liquid-specific heat is constant between Tm and 2 Tm in the absence of glassy phase.
(6)
The stability of glassy fractions for Tx/Tm < 0.7069 can be very high because their (Tg) could be much higher than (2 Tm) as proved by resistivity decreases observed up to 2 Tm and beyond in Bi and Sn. The glassy fraction (f) is enhanced by successive thermal cycles between solid and liquid states. Each new glassy fraction could be added and could reinforce the total glassy fraction at very high temperatures up to f ≤ 100%.

Funding

This research received no external funding.

Institutional Review Board Statement

Not applicable.

Informed Consent Statement

Not applicable.

Acknowledgments

The author acknowledge Michael Ojovan for his comments on the condensed phase of configurons.

Conflicts of Interest

The author declares no conflict of interest.

References

  1. Wang, L.; Bian, X.; Liu, J. Discontinuous structural phase transition of liquid metal and alloys. Phys. Lett. A 2004, 326, 429–435. [Google Scholar] [CrossRef]
  2. Yue, Y. Experimental evidence for the existence of an ordered structure in a silicate liquid above its liquidus temperature. J. Non-Cryst. Sol. 2004, 345, 523–527. [Google Scholar] [CrossRef]
  3. Greenberg, Y.; Yahel, E.; Caspi, E.M.; Benmore, C.; Beuneu, B.; Dariel, M.P.; Makov, G. Evidence for a temperature-driven structural transition in liquid bismuth. EPL 2009, 86, 36004. [Google Scholar] [CrossRef]
  4. Zu, F.-Q. Temperature-Induced Liquid-Liquid Transition in Metallic Melts: A Brief Review on the New Physical Phenomenon. Metals 2015, 5, 395–417. [Google Scholar] [CrossRef] [Green Version]
  5. Xu, L.; Wang, Z.; Chen, J.; Chen, S.; Yang, W.; Ren, Y.; Zuo, X.; Zeng, J.; Wu, Q.; Sheng, H. Folded network and structural transition in molten tin. Nat. Commun. 2022, 13, 126. [Google Scholar] [CrossRef]
  6. Wang, J.; Li, J.; Hu, R.; Kou, H.; Beaugnon, E. Evidence for the structure transition in a liquid Co-Sn alloy by in-situ magnetization measurement. Mater. Lett. 2015, 145, 261–263. [Google Scholar] [CrossRef]
  7. He, Y.-X.; Li, J.; Wang, J.; Kou, H.; Beaugnon, E. Liquid-liquid structure transition and nucleation in undercooled Co-B eutectic alloys. Appl. Phys. A 2017, 123, 391. [Google Scholar] [CrossRef]
  8. He, Y.-X.; Li, J.-S.; Wang, J.; Beaugnon, E. Liquid-liquid structure transition in metallic melt and its impact on solidification: A review. Trans. Nonferr. Met. Soc. China 2020, 30, 2293–2310. [Google Scholar] [CrossRef]
  9. Qiu, X.; Li, J.; Wang, J.; Guo, T.; Kou, H.; Beaugnon, E. Effect of liquid-liquid structure transition on the nucleation in undercooled Co-Sn eutectic alloy. Mater. Chem. Phys. 2016, 170, 261–265. [Google Scholar] [CrossRef]
  10. Bennett, T.D.; Yue, Y.; Li, P.; Qiao, A.; Tao, H.Z.; Greaves, N.G.; Richards, T.; Lanpronti, G.I.; Redfern, S.A.T.; Blanc, F.; et al. Melt-quenched glasses of metal-organic frameworks. J. Am. Chem. Soc. 2016, 138, 3484–3492. [Google Scholar] [CrossRef]
  11. Wang, J.; He, Y.; Li, J.; Li, C.; Kou, H.; Zhang, P.; Beaugnon, E. Nucleation of supercooled Co melts under a high magnetic field. Mater. Chem. Phys. 2019, 225, 133–136. [Google Scholar] [CrossRef]
  12. Zhou, C.; Hu, L.; Sun, Q.; Qin, J.; Brian, X.; Yue, Y. Indication of liquid-liquid phase transition in CuZr-based melts. Appl. Phys. Lett. 2013, 103, 171904. [Google Scholar] [CrossRef]
  13. Kim, Y.H.; Kiraga, K.; Inoue, A.; Masumoto, T.; Jo, H.H. Crystallization and high mechanical strengthof Al-based amorphous alloys. Mater. Trans. 1994, 35, 293–302. [Google Scholar] [CrossRef] [Green Version]
  14. Hu, Q.; Sheng, H.C.; Fu, M.W.; Zeng, X.R. Influence of melt temperature on the Invar effect in (Fe71.2B.024Y4.8)96Nb4 bulk metallic glasses. J. Mater. Sci. 2019, 48, 6900–6906. [Google Scholar]
  15. Popel, P.S.; Chikova, O.A.; Matveev, V.M. Metastable colloidal states of liquid metallic solutions. High Temp. Mater. Proc. 1995, 4, 219–233. [Google Scholar] [CrossRef]
  16. Jiang, H.-R.; Bochtler, B.; Riegler, X.-S.; Wei, S.S.; Neuber, N.; Frey, M.; Gallino, I.; Busch, R.; Shen, J. Thermodynamic and kinetic studies of the Cu-Zr-Al(-Sn) bulk metallic glasses. J. Alloy. Compd. 2020, 844, 156126. [Google Scholar] [CrossRef]
  17. Wei, S.; Yang, F.; Bednarcik, J.; Kaban, I.; Shuleshova, O.; Meyer, A.; Busch, R. Liquid-liquid transition in a strong bulk metallic glass-forming liquid. Nat. Commun. 2013, 4, 2083. [Google Scholar] [CrossRef] [Green Version]
  18. Lan, S.; Ren, Y.; Wei, X.Y.; Wang, B.; Gilbert, E.P.; Shibayama, T.; Watanabe, S.; Ohnuma, M.; Wang, X.-L. Hidden amorphous phase and reentrant supercooled liquid in Pd-Ni-P metallic glass. Nat. Commun. 2017, 8, 14679. [Google Scholar] [CrossRef] [Green Version]
  19. Yang, B.; Perepezko, J.H.; Schmeltzer, J.W.P.; Gao, Y.; Schick, C. Dependence of crystal nucleation on prior liquid overheating by differential fast scanning calorimeter. J. Chem. Phys. 2014, 140, 104513. [Google Scholar] [CrossRef]
  20. Xu, W.; Sandor, M.T.; Yu, Y.; Ke, H.-B.; Zhang, H.P.; Li, M.-Z.; Wang, W.-H.; Liu, L.; Wu, Y. Evidence of liquid-liquid transition in glass-forming La50Al35Ni15 melt above liquidus temperature. Nat. Commun. 2015, 6, 7696. [Google Scholar] [CrossRef] [Green Version]
  21. Chen, E.-Y.; Peng, S.-X.; Michiel, M.D.; Vaughan, G.B.M.; Yu, Y.; Yu, H.-B.; Ruta, B.; Wei, S.; Liu, L. Glass-forming ability correlated with the liquid-liquid transition in Pd42.5Ni42.5P15 alloy. Scr. Mater. 2021, 193, 117–121. [Google Scholar] [CrossRef]
  22. Tournier, R.F.; Ojovan, M.I. Building and breaking bonds by homogenous nucleation in glass-forming melts leading to three liquid states. Materials 2021, 14, 2287. [Google Scholar] [CrossRef] [PubMed]
  23. Tournier, R.F.; Ojovan, M.I. Multiple melting temperatures in glass-forming melts. Sustainability 2022, 14, 2351. [Google Scholar] [CrossRef]
  24. Tournier, R.F. Liquid-liquid transitions due to melting temperatures of residual glassy phases expected in Pt57Cu23P20. Asp. Min. Miner. Sc. 2022, 8, 979–989. [Google Scholar]
  25. An, Q.; Johnson, W.L.; Samwer, K.; Corona, S.L.; Goddard, W.A., III. First-order transition in liquid Ag to the heterogeneous G-Phase. J. Phys. Chem. Lett. 2020, 11, 632–645. [Google Scholar] [CrossRef] [PubMed] [Green Version]
  26. An, Q.; Johnson, W.L.; Samwer, K.; Corona, S.L.; Goddard, W.A., III. Formation of two glass phases in binary Cu-Ag liquid. Acta Mater. 2020, 195, 274–281. [Google Scholar] [CrossRef]
  27. Tournier, R.F. Lindemann’s rule applied to the melting of crystals and ultra-stable glasses. Chem. Phys. Lett. 2016, 651, 198–202, Erratum in: 2017, 675, 174. [Google Scholar] [CrossRef] [Green Version]
  28. Vopson, M.M.; Rugers, N.; Hepburn, I. The generalized Lindemann Melting coefficient. Sol. State Commun. 2020, 318, 113977. [Google Scholar] [CrossRef]
  29. Tournier, R.F. Validation of non-classical homogeneous nucleation model for G-glass and L-glass formations in liquid elements with recent molecular dynamics simulations. Scr. Mater. 2021, 199, 113859. [Google Scholar] [CrossRef]
  30. Tournier, R.F.; Ojovan, M.I. Prediction of second melting temperatures already observed in pure elements by molecular dynamics simulations. Materials 2021, 14, 6509. [Google Scholar] [CrossRef]
  31. Becker, S.; Devijver, E.; Molinier, R.; Jakse, N. Glass-forming ability of elemental zirconium. Phys. Rev. B 2020, 102, 104205. [Google Scholar] [CrossRef]
  32. Bazlov, A.I.; Louzguine-Luzguin, D.V. Crystallization of FCC and BCC liquid metals studied by molecular dynamics simulation. Metals 2020, 10, 1532. [Google Scholar]
  33. Ojovan, M.I. Ordering and structural changes at the glass-liquid transition. J. Non-Cryst. Sol. 2013, 382, 79. [Google Scholar] [CrossRef]
  34. Hasmy, A.; Ispas, S.; Hehlen, B. Percolation transitions in compressed SiO2 Glasses. Nature 2021, 599, 65. [Google Scholar] [CrossRef] [PubMed]
  35. Vinet, P.; Magnusson, V.; Frederikssen, H.; Desré, P.J. Correlations between surface and interface energies with respect to crystal nucleation. J. Colloid Interface Sci. 2002, 255, 363–374. [Google Scholar] [CrossRef]
  36. Tournier, R.F. Fragile-to-fragile liquid transition at Tg and stable-glass phase nucleation rate maximum at the Kauzmann temperature. Physica B 2014, 454, 253–271. [Google Scholar] [CrossRef] [Green Version]
  37. Tournier, R.F. First-order transitions in glasses and melts induced by solid superclusters nucleated by homogeneous nucleation instead of surface melting. Chem. Phys. 2019, 524, 40–54. [Google Scholar] [CrossRef] [Green Version]
  38. Jiang, Q.K.; Wang, X.D.; Nie, X.P.; Zhang, G.Q.; Ma, H.; Fecht, H.J.; Bendnarck, J.; Franz, H.; Liu, Y.G.; Cao, Q.P.; et al. Zr-(Cu,Ag)-Al bulk metallic glasses. Acta Mater. 2008, 56, 1785–1796. [Google Scholar] [CrossRef] [Green Version]
  39. Hu, C.; Zhang, C.; Yue, Y. Thermodynamic anomaly of the sub-Tg relaxation in hyperquenched metallic glasses. J. Chem. Phys. 2013, 138, 174508. [Google Scholar] [CrossRef]
  40. Wang, L.-M.; Borick, S.; Angell, C.A. An electrospray technique for hyperquenched glass calorimetry studies: Propylene glycol and di-n-butylphthalate. J. Non-Cryst. Sol. 2007, 353, 3829–3837. [Google Scholar] [CrossRef]
  41. Inoue, A.; Zhang, T.; Masumoto, T. The structural relaxation and glass transition of La-Al-Ni and Zr-Al-Cu amorphous alloys with a significant supercooled liquid region. J. Non-Cryst. Sol. 1992, 150, 396. [Google Scholar] [CrossRef]
  42. Hornboll, L.; Yue, Y. Enthalpy relaxation in hyperquenched glasses of different fragility. J. Non-Cryst. Sol. 2008, 354, 1832–1870. [Google Scholar] [CrossRef]
  43. Tournier, R.F. Presence of intrinsic growth nuclei in overheated and undercooled liquid elements. Physica B 2007, 392, 79–91. [Google Scholar] [CrossRef]
  44. Perepezko, J.H.; Paik, J.S. Rapidly Solidified Amorphous and Crystalline Alloys; Kear, B.H., Gessen, B.G., Coehen, M., Eds.; Elsevier Science: New York, NY, USA, 1982; pp. 42–63. [Google Scholar]
  45. Tournier, R.F. Predicting glass-to-glass and liquid-to-liquid phase transitions in supercooled water using non-classical nucleation theory. Chem. Phys. 2018, 500, 45–53. [Google Scholar] [CrossRef] [Green Version]
  46. Tournier, R.F. Amorphous ices. In Encyclopedia of Glass Science, Technology, History, and Culture; Richet, P., Ed.; Wiley & Sons: Hoboken, NJ, USA, 2021; Volume 1, Chapter 3.14. [Google Scholar]
  47. Tournier, R.F. Homogeneous nucleation of phase transformations in supercooled water. Physica B 2020, 579, 411895. [Google Scholar] [CrossRef]
  48. Angell, C.A.; Rao, K.J. Configurational excitations in condensed matter and the “bond lattice”. Model for the liquid-glass transition. J. Chem. Phys. 1972, 57, 470–481. [Google Scholar] [CrossRef]
  49. Ozhovan, M.I. Topological characteristics of bonds in SiO2 and GeO2 oxide systems at glass-liquid transition. J. Exp. Theor. Phys. 2006, 103, 819–829. [Google Scholar] [CrossRef]
  50. Tournier, R.F.; Ojovan, M.I. Undercooled phase behind the glass phase with superheated medium-eange order above glass transition temperature. Physica B 2021, 602, 412542. [Google Scholar] [CrossRef]
  51. Iwashita, T.; Micholson, D.M.; Egami, T. Elementary excitations and crossover phenomenon in liquids. Phys. Rev. Lett. 2013, 110, 205504. [Google Scholar] [CrossRef] [Green Version]
  52. Ojovan, M.I.; Lee, W.E. Connectivity and glass transition in disordered oxide systems. J. Non-Cryst. Sol. 2010, 356, 2534–2540. [Google Scholar] [CrossRef]
  53. Ojovan, M.I. The modified random network (MRN) model within the configuron theory percolation (CPT) of glass transition. Ceramics 2021, 4, 121–134. [Google Scholar] [CrossRef]
  54. Ojovan, M.I.; Tournier, R.F. On structural rearrangements near the glass transition temperature in amorphous silica. Materials 2021, 14, 5235. [Google Scholar] [CrossRef] [PubMed]
  55. Ojovan, M.I. Glass formation. In Encyclopedia of Glass Science, Technology, History, and Culture; Conradt, P., Takada, R., Dyon, A., Richet, J., Eds.; Wiley: Hoboken, NJ, USA, 2021; Chapter 3.1; pp. 249–259. [Google Scholar] [CrossRef]
  56. Ojovan, M.I.; Louzguine Luzgin, D.V. Revealing Structural Changes at Glass Transition via Radial Distribution Functions. J. Phys. Chem. 2020, 124, 3186–3194. [Google Scholar] [CrossRef] [PubMed]
  57. Khvan, A.V.; Babkina, T.; Dinsdale, A.T.; Usprenskaya, I.A.; Farthushna, I.V.; Druzhinina, A.T.; Sysdikova, A.B.; Belov, M.P.; Belov, M.P.; Abrikosov, I.A. Thermodynamic properties of Tin: Part I: Experimental investigations, ab-initio modelling of alpha-, beta-phase and a thermodynamic description for pure metal in solid and liquid state from 0 K. Calphad 2019, 65, 50–72. [Google Scholar] [CrossRef]
  58. Kozyrev, N.V.; Gordeev, V.V. Thermodynamic characterization and equation of state for solid and liquid lead. Metals 2022, 12, 16. [Google Scholar] [CrossRef]
  59. Alchagirov, B.B.; Chochaeva, A. Temperature dependence of the density of liquid tin. High Temp. 2000, 38, 44–48. [Google Scholar] [CrossRef]
  60. Kamiya, A.; Terasaki, H.; Kondo, T. Precise determination of the effect of temperature on the density of solid and liquid iron; nickel, and tin. Am. Mineral. 2021, 106, 1077–1082. [Google Scholar] [CrossRef]
  61. Assael, M.J.; Armyra, I.J. Reference data for the density and viscosity of liquid cadmium, cobalt, gallium, indium, mercury, silicon, thallium, and zinc. J. Phys. Chem. 2012, 42, 033101. [Google Scholar] [CrossRef] [Green Version]
  62. Stankus, S.V.; Savchenko, I.V.; Yatsuk, O.S. The caloric properties of liquid bismuth. High Temp. 2018, 56, 33–37. [Google Scholar] [CrossRef]
  63. Froberg, M.C.; Weber, R. Dichtemessugen an eisen-kupfe legierungen. Prch. Eisenhuttenw. 1964, 35, 877–899. [Google Scholar]
  64. Gronvold, F. Enthalpy of fusion and temperature of fusion of indium, and redetermination of the enthalpy of fusion of tin. J. Chem. Therm. 1993, 25, 1133–1144. [Google Scholar] [CrossRef]
  65. Chen, H.S.; Turnbull, D. The specific heat of tin and gallium in their stable and undercooled pure liquid states. Acta Metall. 1968, 16, 369–373. [Google Scholar] [CrossRef]
  66. Bryant, C.A.; Keesom, P.H. Low temperature specific heat of indium and tin. Phys. Rev. 1961, 123, 491. [Google Scholar] [CrossRef]
  67. Badawi, W.A.; Brown-Acquaye, H.A.; Eid, A.E. Heat capacity and thermodynamic properties of bismuth in the range 333 to 923 K. Bull. Chem. Soc. Jpn. 1987, 60, 3765–3769. [Google Scholar] [CrossRef] [Green Version]
  68. Miller, R.R. Liquid Metal Handbook; OECD 2015 NEA N°7268; Nuclear Energy Agency: Paris, France, 1954. [Google Scholar]
  69. Ojovan, M.I. Viscosity and glass transition in amorphous oxides. Adv. Condens. Matter Phys. 2008, 2008, 817829. [Google Scholar] [CrossRef] [Green Version]
  70. Ojovan, M.I.; Louzguine-Luzgin, D.V. On structural rearrangement during the vitrification of molten copper. Materials 2022, 15, 1313. [Google Scholar] [CrossRef]
  71. Zhu, Z.G.; Zu, F.Q.; Guo, L.J.; Zhang, B. Internal friction method: Suitable also for structural changes of liquids. Mater. Sci. Eng. A. 2004, 370, 427–430. [Google Scholar] [CrossRef]
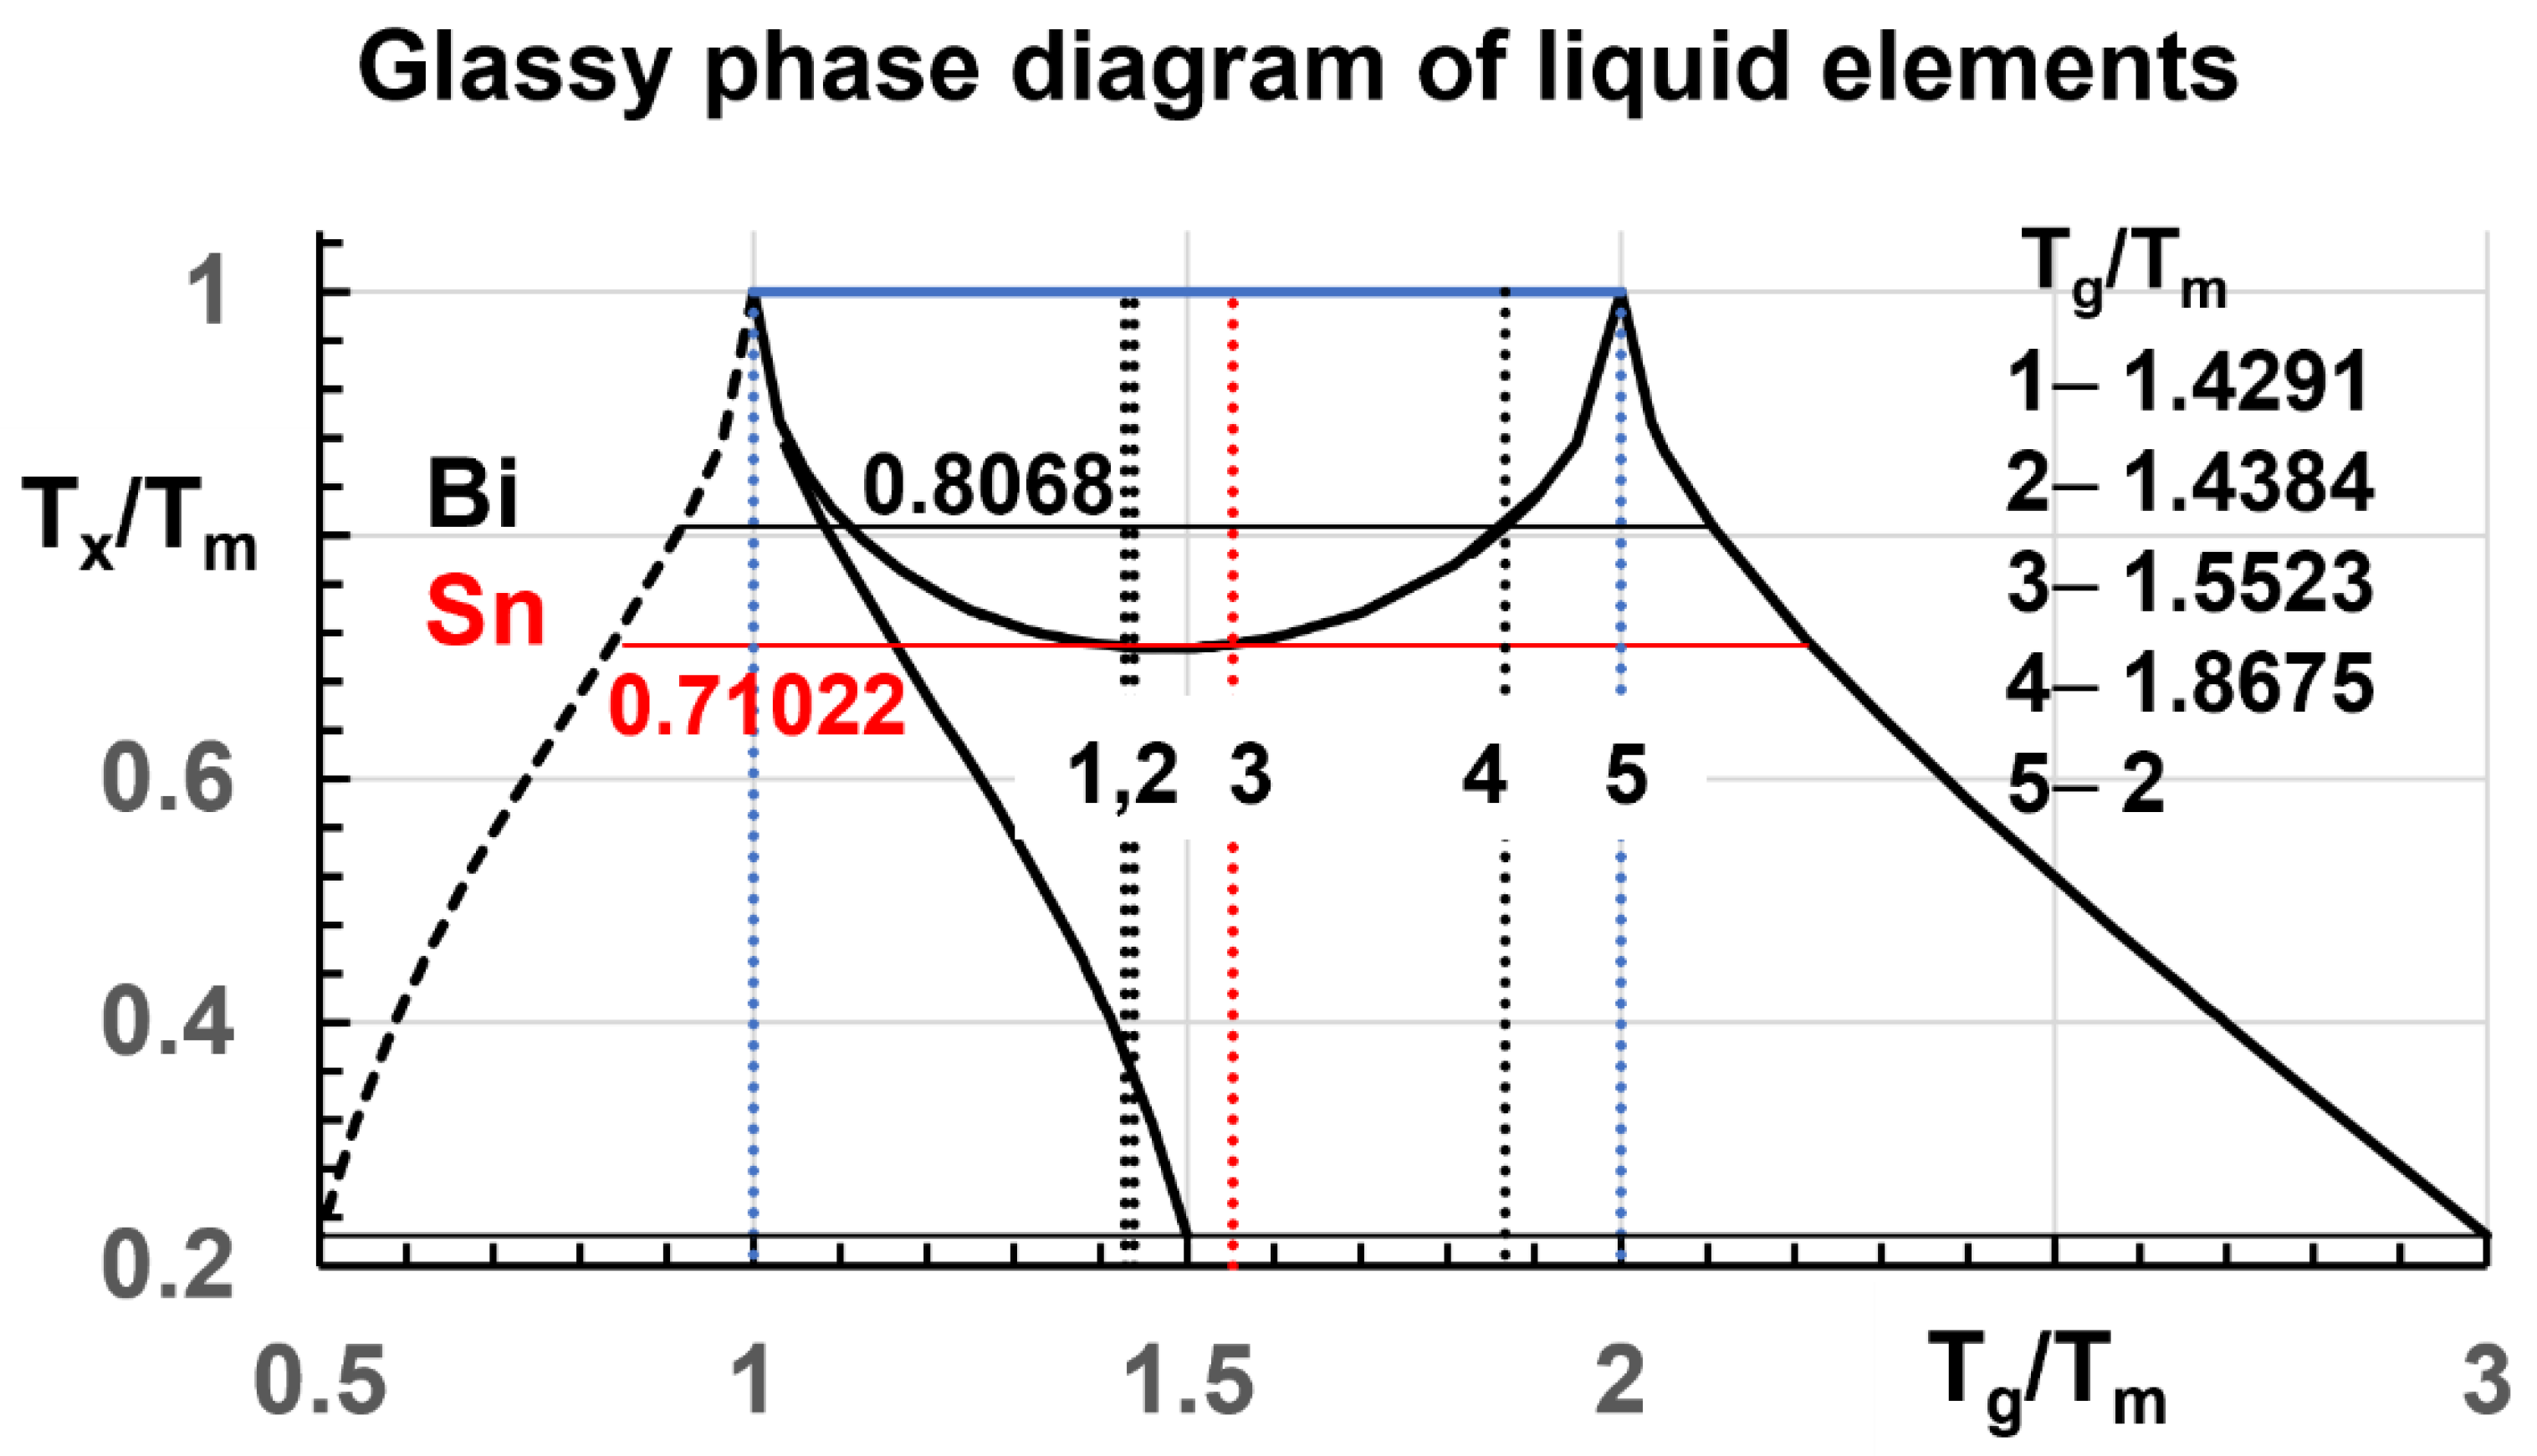
Figure 1. Glassy phase diagram (Tg/Tm) resulting from first-order transitions at Tx/Tm during heating of liquid elements. Valuable for all glass transitions due to Lindemann coefficients. For Bi, Tx/Tm = 0.8068 revealing Tg/Tm = 1.8675 as observed from differential thermal analysis (DTA). For Sn, Tx/Tm = 0.71022 reveals Tg/Tm = 1.5523. For Tx/Tm > 0.7069, there are five glass transitions. For Tx/Tm < 0.7069, the number of glass transitions is equal to 3. (Tg/Tm) can be higher than 2. Transitions at Tg/Tm = 1.4291 and 1.4384 are initiated by other (Tx/Tm) values. Tg/Tm = 0.5, 1.5 and 3 for Tx/Tm = 0.22451. For Tx/Tm = 1, transitions were observed at Tg/Tm with latent heat much weaker than (Δε Hm) above Tm.
Metals 12 02085 g001
Figure 2. Bismuth glassy phase fractions f = Δε expected after undercooling and reheating. Four liquid-liquid transitions at Tn+ = Tg after reheating were observed. Horizontal lines: 1 − Δεlg = 0 of glassy fractions; 2 − Δε = θn+ = θg = 0.42908 up to Tg = 778 K, 0.43838 up to Tg = 783 K, (not represented); 3 − Δε= 0.8675 up to Tg = 1016 K; 4 − Δε = 1 up to Tg = 1089 K without crystallization at Tm. Vertical lines: Tx = 286.2 K leading to Δε = 0.42908 and a crystallized fraction (1 − Δε = 0.057092); Tx = 370 K leading to Δε = 0.8675 and a crystallized fraction (1 − Δε = 0.1325); Tx = 395 K leading to Δε = 1; Tm = 544.5 K: melting of crystallized fractions; Tn+ = 778.1 K; Tn+ = 1016 K; Tn+ = Tg = 2; Tm = 1089 K. The glass transitions leading to Δεlg = 0 would be observed by reversing heating to cooling slightly below Tg. Line (5) represents Equation (6).
Metals 12 02085 g002
Figure 3. Tin glassy phase fraction f = Δε expected after undercooling and reheating. Tx = 284 K (θx = −0.43757), leading to a liquid-liquid transition at Tn+ = Tg = 783.9 K after reheating. (Δε = 0.5523) corresponding to the enthalpy coefficient of the gray phase. The crystallized fraction (1 − Δε) of the white phase is (0.4477). The glassy phase with Tg = 2 Tm = 1010 K and Δε = 1 is nucleated at Tx = 366.7 K (θx = −0.33336) and heated without crystallization at Tm.
Metals 12 02085 g003
Figure 4. Specific heat of bismuth above Tm. Reproduced from [62] with permission of Springer Ed. The line Cp = 0.1464 KJ/ (Kg K) leading to the value of Cp at Tm = 505 K is added. The specific heat is constant from Tm to 2 Tm in the absence of relaxed enthalpy. Tg = 674 K for Δε = 0.23838 + 0.09401 = 0.3324, Tg = 778 K for Δε = (0.42908 = 0.1907 + 0.23838), Tg = 882 K for Δε = (0.429 + 0.23838 + 0.09456 = 0.761), Tg = 1017 K for Δε = 0.8675, Tg = 1089 K for Δε = 1.
Metals 12 02085 g004
Figure 5. Bismuth density versus temperature, T (°C). Reproduced with authorization of EPL, EPI [3]. The density variation between Tm (K) and 2 Tm (K) is equal to the density change at Tm while the enthalpy coefficient varies from 0 to 1. Singular values of the enthalpy coefficient are added to the original figure. Line (1) is the density before enthalpy relaxation of glassy phases. A melting heat, 1.23853 Hm includes the latent heat of the glassy fraction occurring for Tg/Tm = 1 in the phase diagram of Figure 1.
Metals 12 02085 g005
Figure 6. Tin density (d) in Kg/m3, versus T (K). Line (1) [60]; Line (2) [59]; Line (3) [63]. Tx = 284 K, the glass formation temperature after undercooling and the melting temperature of gray tin. 2 Tm = 1010 K.
Metals 12 02085 g006
Figure 7. Heat capacities of bismuth in J/K/mole. Cp = 30.2 from T = 544.5 to 1089 K in the absence of glass phase. Cp = 17.2 from Tm = 544.5 to Tg = 778.1 K in the presence of glassy fraction f = 42.908%. Cp = 4 from Tm = 544.5 to Tg = 1017 K in the presence of a glassy fraction f = 86.75%. Cp = 0 for f = 100%. Heating beyond Tg, leads to Cp = 30.2 inside the transition width. Cooling from a temperature slightly below Tg leads to the glassy state.
Metals 12 02085 g007
Figure 8. Heat capacities of tin in J/K/mole. Cp = 28.43 from T = 505 to 1010 K in the absence of glassy phase. Cp = 12.7 from Tm = 505 to Tg = 783.9 K in the presence of glassy fraction f = 55.23%. Cp = 0 for f = 100%. Heating beyond Tg, leads to Cp = 28.43 inside the transition width. Cooling from a temperature slightly below Tg leads to the glassy state.
Metals 12 02085 g008
Figure 9. Resistivity falls of Cu-Sb 76.5 wt% after thermal cycling. Reproduced from [4].
Metals 12 02085 g009
Publisher’s Note: MDPI stays neutral with regard to jurisdictional claims in published maps and institutional affiliations.