Article

Influence of Vanadium Extraction Converter Process Optimization on Vanadium Extraction Effect

1
Metallurgical Technology Institute, Central Iron and Steel Research Institute Co., Ltd., Beijing 100081, China
2
Steelmaking Plant, Sichuan Desheng Group Vanadium and Titanium Co., Ltd., Leshan 614900, China
*
Author to whom correspondence should be addressed.
Metals 2022, 12(12), 2061; https://doi.org/10.3390/met12122061
Submission received: 17 September 2022 / Revised: 18 November 2022 / Accepted: 20 November 2022 / Published: 29 November 2022
(This article belongs to the Section Extractive Metallurgy)

Abstract

:
In view of the problem of low bottom-blowing stirring intensity and easy blockage in the use of capillary bricks, the bottom-blowing gas supply element of circular seam was used. The results of water model experiments shows that the suitable bottom-blowing element was arranged on the circumference 0.45D away from the center of the furnace bottom (where D is the diameter of the converter bottom). The best blowing process parameters for vanadium extraction from hot metal were are obtained in different periods. The industrial test results shows that the average values of vanadium content in semi-steel and metallic iron content in vanadium slag were 0.033 wt% and 22.39 wt%, respectively, after process optimization, which were 0.003 wt% and 5.25 wt% lower than those before process optimization. The average value of vanadium oxide content in vanadium slag was 18.54 wt%, an increase of 0.2 wt% compared with the one before process optimization. This shows that after the process was optimized, the kinetic conditions of the molten bath were improved, and the vanadium oxide reaction was more sufficient. An additional 5210 tons of vanadium slag could be produced each year, and better economic benefits could be obtained.

1. Introduction

Vanadium extraction by means of oxygen blowing in a converter is currently one of the effective methods for extracting vanadium from vanadium-containing hot metal. That is, the vanadium in the metal is oxidized by blowing oxygen from the top lance, and the vanadium in the hot metal is oxidized to vanadium oxide as much as possible [1,2,3]. At the same time, the oxidized hot metal also needs to be used as a raw material for subsequent steelmaking. Therefore, the production of vanadium slag with high vanadium content and semi-steel with sufficient carbon content and temperature in the vanadium extraction furnace is a prerequisite to ensure the smooth production of the vanadium extraction converter and the decarburization converter.
Many scholars have performed a lot of research on the blowing process of vanadium extraction from hot metal [4,5,6,7,8,9,10,11,12,13,14,15]. The characteristics of vanadium slag in the process of vanadium extraction from hot metal have been studied, including how to control the composition of FeO-SiO2-based vanadium slag [4]. The saturated solubility of magnesium oxide in vanadium slag and its influencing factors have been explored [5]. The relationship between slag basicity and iron oxide in vanadium slag mineral phase has been analyzed [6]. The influence of the mass ratio of calcium oxide to vanadium oxide on the yield of vanadium has been systematically studied [7,8,9,10]. The selection of the oxidation temperature between carbon and vanadium has been mainly studied in the blowing process [11]. How to improve the kinetic conditions of the molten bath [12] and establish a kinetic model for the oxidation of metallic vanadium has been studied [13]. At the same time, a new process of blowing CO2–O2 mixed gas into the molten bath has been developed [14,15,16].
The vanadium extracting converter of a plant uses capillary bricks in the vanadium extracting process, which often results in clogging. At the same time, the strength of the bottom-blowing gas supply is generally about 0.02 Nm3/t∙min, which cannot meet the agitation strength of the hot metal containing vanadium on the molten bath. The main problem in the vanadium extraction process is that the residual vanadium of semi-steel is relatively high, with an average residual vanadium content of 0.037 wt% and a fluctuation range from 0.012 to 0.087 wt%. The average content of metallic iron in vanadium slag is 27.64 wt%, and the fluctuating range is from 22.21 to 35.06 wt%. The average content of vanadium oxide in vanadium slag is 18.34 wt%, and the fluctuation range is from 16.84 to 20.18 wt%.
The bottom-blowing gas supply element of circular seam [17,18] has been widely used in the hot-metal smelting process, but they have been rarely used in vanadium-containing hot-metal smelting. Compared with capillary bricks, the circular seam gas supply element is supplied with gas by the circular seam, as shown in Figure 1. Its characteristics are that it is not easily blocked and that the stainless-steel high-strength ball head seal at the end is connected to the metal hose, which can prevent gas leakage in long-term use and further ensure that the bottom-blowing gas flow rate in the whole furnace meets the process requirements.
In this paper, a circular seam gas supply element was used to replace the capillary bricks. The process parameters of a vanadium extraction converter were optimized using the results of water model experiments and were implemented in an industrial test. Through experimental research, the purposes of increasing vanadium oxide content in vanadium slag and reducing metal iron content in vanadium slag and vanadium content in semi-steel were achieved.

2. Experimental Equipment and Methods

2.1. Water Model Experiment

2.1.1. Experimental Equipment

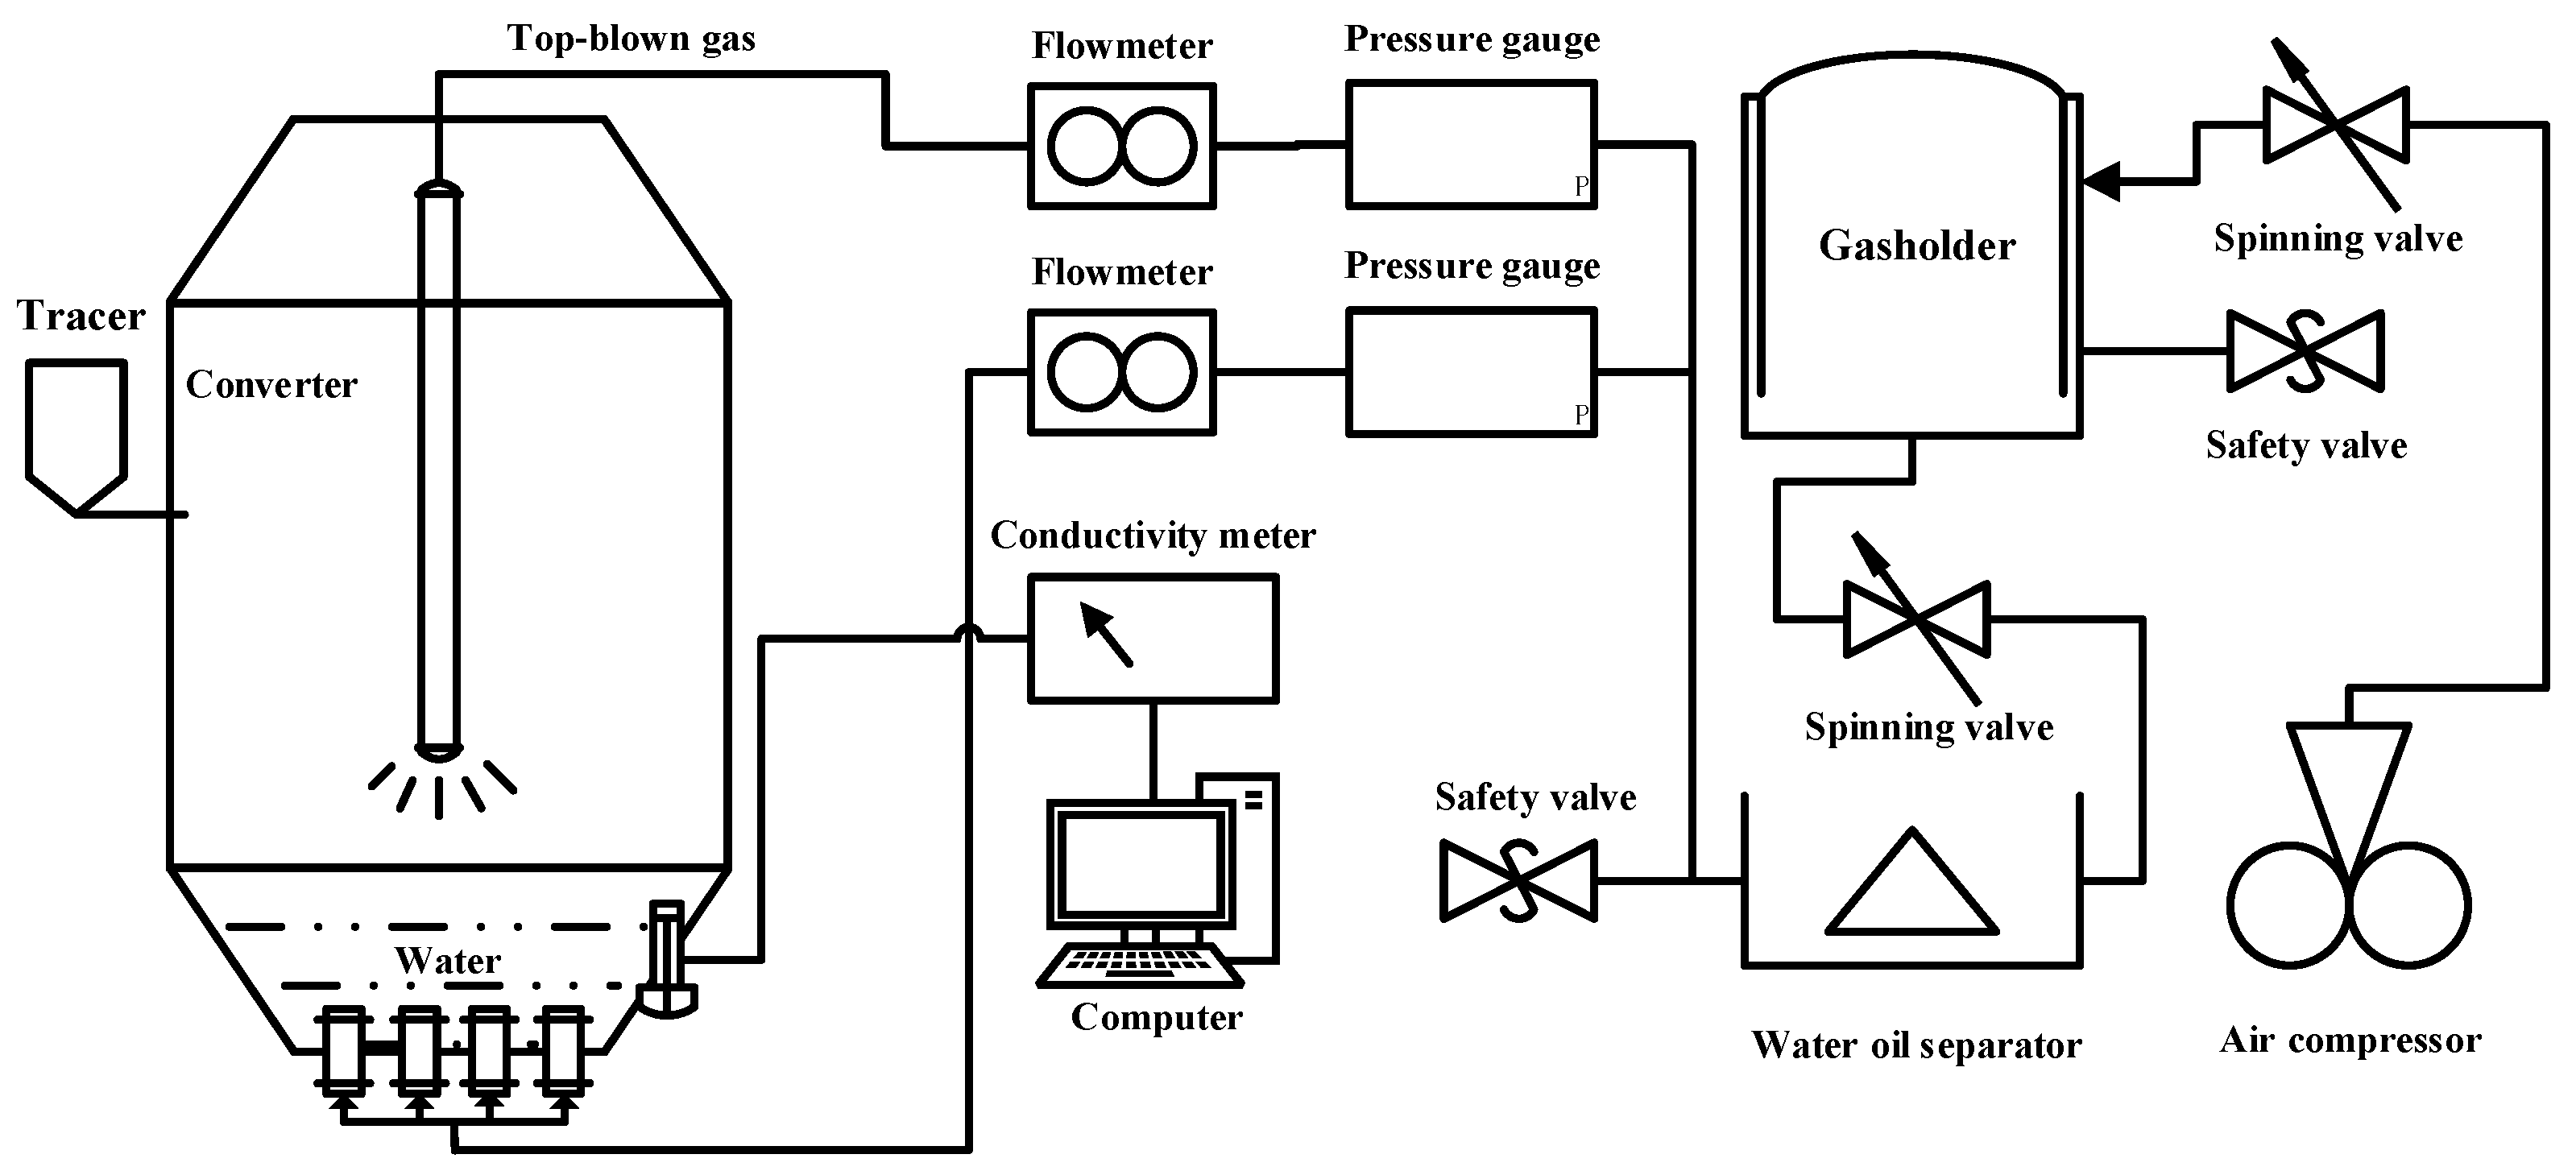
The 80 t vanadium extraction converter was selected as the prototype. According to the similar ratio of 1:4.7, the converter cold state model was made with plexiglass. Table 1 shows the relevant parameters of the converter prototype and model, and the experimental device diagram is shown in Figure 2.

2.1.2. Experimental Parameters

When establishing the kinetic similarity, it is necessary to ensure that the Froude criterion modified for the converter prototype is equal to the Froude criterion modified for the model, and the following equation is obtained [18].
F r = ρ g ν g 2 ρ L g d 0   ( Froude   criterion   modified )
ν a i r ν O 2 = ( ρ O 2 ρ a i r ) 1 2 ( ρ W ρ i ) 1 2 ( d M d P ) 1 2
where ν a i r and ν O 2 are the gas flow velocity at the nozzle outlet of the model and prototype oxygen lance, m∙s−1. ρ a i r and ρ O 2 are the gas densities in the model and prototype, kg∙m−3. ρ W and ρ i are the liquid densities in the model and prototype, kg∙m−3. d M and d P are oxygen lance nozzle outlet diameter in model and prototype, m.
The equation for calculating the gas flow in the model and prototype is as follows:
Q M Q P = ν a i r ν O 2 × ( d M d P ) 2
According to the actual operation data of the 80 t converter, the related parameters of the model kinetics were calculated as shown in Table 2. The number of nozzle holes in the oxygen lance in the experiment was three, the center angle was 11°, and the Mach number was 1.95.
According to Equations (1)–(3) and Table 2, the top blowing flow and bottom blowing flow in the experiment, as well as the arrangement of oxygen lance positions and bottom blowing, were calculated, as shown in Table 3.

2.1.3. Experimental Method

In order to characterize the ability of the oxygen lance and bottom blowing to stir the molten bath during the blowing process, the mixing time of the molten bath, the impact depth and the impact area of the oxygen lance were measured in the experiment. In the experiment, the mixing time, impact depth and area were measured in the water model according to the changes of the set top blowing flow, bottom blowing flow, oxygen lance position and bottom blowing element arrangement (as shown in Table 3).
The method of determining the mixing time of the molten bath was to add NaCl aqueous solution to the molten bath, and measure the conductivity change in the water through the conductivity meter on the other side of the molten bath. When the conductivity was stable, it was regarded as the molten bath mixing. The time from the aqueous solution to the molten bath mixing was called the molten bath mixing time, and each blowing stage was repeated six times, and the average value was taken. The method of determining the impact depth was to wait for the oxygen jet to stabilize, and the height from the upper surface of the molten bath to the oxygen jet at the bottom of the impact pit of the molten bath was called the impact depth. In the experiment, the impact depth was measured three times with a ruler, and the average value was taken. The maximum projected area of the impact crater formed by the oxygen jet in the molten bath was called the impact area. In the measurement, the impact crater edge depth ≥ 10 mm was considered as the effective impact area. All impact area data taken in the experiment were the effective impact area.

2.2. Industrial Test

2.2.1. Test Equipment and Process

The test was carried out in an 80 t vanadium extraction converter, the diameter of the molten bath was 3870 mm, and the depth of the molten bath was 1131 mm. The oxygen lance was a three-hole Lava tube nozzle, the Mach number was 1.92, the throat diameter was 33 mm, the outlet diameter was 41.8 mm, the center angle was 11°, the oxygen pressure was 0.8–0.9 Mpa, and the oxygen supply flow was 11,000–16,000 Nm3/h. Capillary bricks were adopted in the bottom blowing gas supply device. The quantity was 4, and the bottom blowing gas intensity was 0.02 Nm3/t∙min. In the process of vanadium extraction from hot metal, capillary bricks were often blocked, and the bottom blowing flow was low, which cannot meet the requirements of hot metal extraction for vanadium agitation in the molten bath. Therefore, the circular seam gas supply element was used in place of capillary bricks, see Figure 1.

2.2.2. Test Scheme

The process of extracting vanadium from hot metal was first to desulfurize the hot metal containing vanadium, and then entered the vanadium-extracting converter to extract the vanadium. The composition of hot metal was a carbon content of 3.27 to 4.63 wt%, the silicon content was from 0.08 to 0.77 wt%, phosphorus content of 0.033 to 0.22 wt%, the sulfur content was from 0.002 to 0.05 wt%, and vanadium content of 0.20 to 0.56 wt%.
In the process of vanadium extraction from hot metal, iron balls and pellets were used to cool down the temperature of the hot metal. The purpose was to prevent the temperature of the hot metal from rising too fast, which will cause a large amount of oxidation of the carbon content in the hot metal. At the end of blowing, the carbon content in the semi-steel was required to be from 3.0 to 3.6 wt%, the vanadium content was from 0.025 to 0.032 wt%, and the temperature was from 1320 to 1360 °C.
The semi-steel was poured into the hot metal ladle as the raw material for smelting clean molten steel. The content of vanadium oxide in the slag at the end of blowing was greater than 18 wt%, and the slag was poured into a slag tank as a raw material for extracting metallic vanadium, thereby realizing the efficient utilization of vanadium containing hot metal.
According to the results of the water model experiment, the industrial test scheme was determined, and the process before and after optimization was shown in Table 4.
After the process was optimized, the whole process was divided into three stages. The top blowing gas flow, the oxygen lance position and the bottom blowing gas flow were changed in each stage. The time interval for coolant addition has varied.

2.2.3. Test Methods

The test method was mainly to select steel samples and slag samples for the end point of vanadium extraction. The chemical composition of the steel sample was analyzed, and the slag sample was analyzed for its mineral composition by X-ray diffraction; then the mineral structure was observed under a microscope to obtain a semi-quantitative mineral phase composition.

3. Results

3.1. Determination of the Arrangement of Bottom Blowing Elements on the Bottom of the Converter

The bottom blowing element of the original design of the vanadium extraction converter was arranged on 0.60D. In order to optimize the design, the layouts of 0.40D, 0.45D and 0.53D were selected, respectively, as shown in Figure 3.
Figure 4 shows the effect of different bottom blowing element arrangements on the mixing time measured in the experiment. The meaning of A2C1D1 in the figure was that the top blowing gas flow was 12,000 Nm3/h, the oxygen lance position was 1.2 m, and the bottom blowing gas flow was 160 Nm3/h. A4C2D2 means that the top blowing gas flow was 14,000 Nm3/h, the oxygen lance position was 1.2 m, and the bottom blowing gas flow was 160 Nm3/h.
Under different oxygen jet and bottom blowing stirring conditions, when the bottom blowing elements were arranged at 0.40D and 0.45D, the melt bath mixing time was the shortest. However, considering that the vanadium slag in the vanadium extracting converter needed to be smelted three times before being poured out, a large amount of vanadium slag would be accumulated at the bottom of the converter.
If the bottom blowing element was too close to the bottom of the converter, a large amount of vanadium slag might be accumulated, causing the blockage of the bottom blowing gas element. Therefore, considering comprehensively, choosing 0.45D was more suitable for the process of vanadium extraction from hot metal.

3.2. Influence of Top Blowing Gas Flow, Oxygen Lance Position and Bottom Blowing Gas Flow on the Stirring Effect of Molten Bath

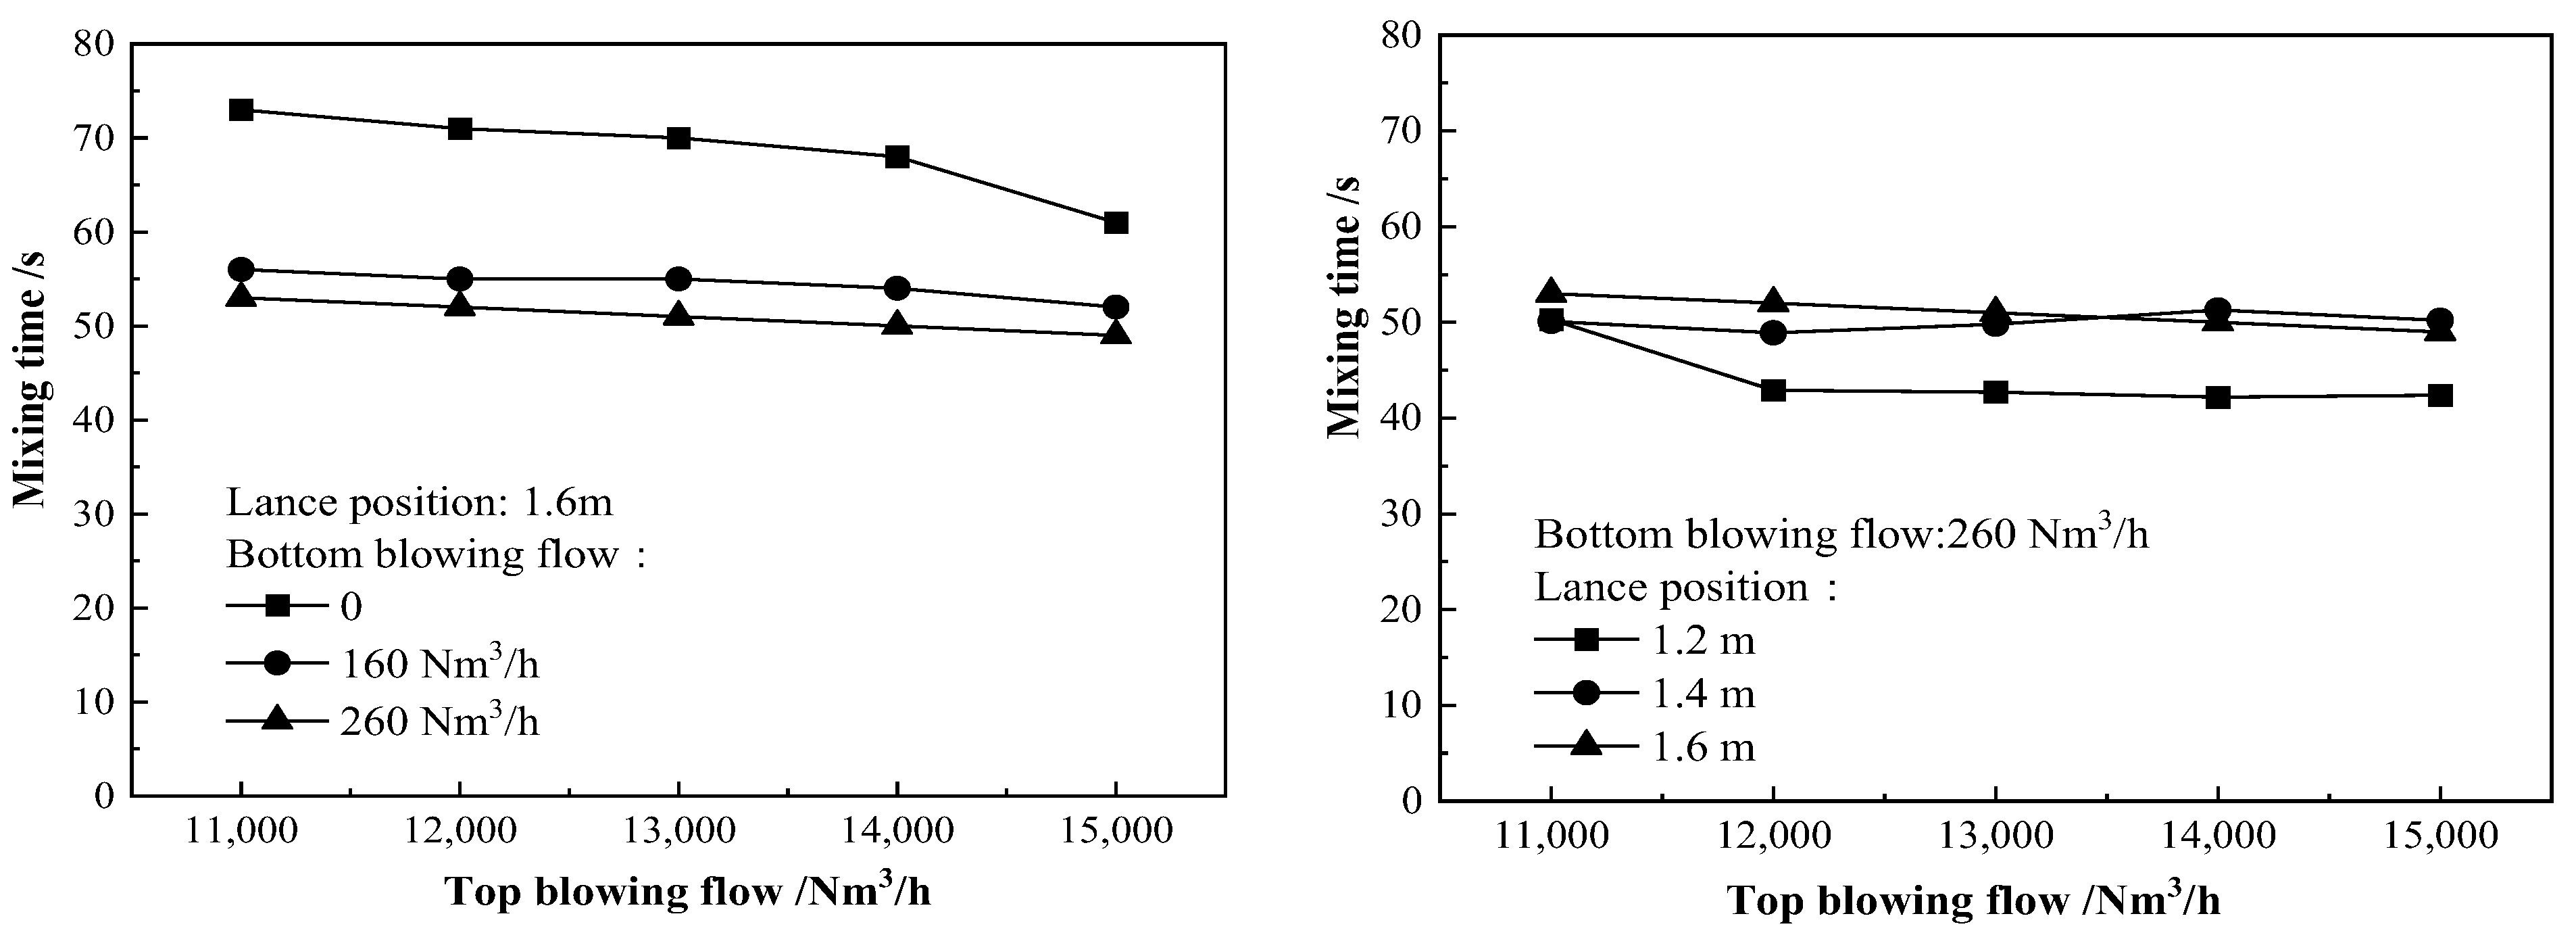
Figure 5 shows the effects of top blowing gas flow, oxygen lance position and bottom blowing gas flow on the mixing time of the molten bath. The bottom blowing gas flow had a great influence on the mixing time. The mixing time in the molten bath without bottom blowing gas stirring was obviously longer than that with bottom blowing stirring.
When the bottom blowing gas flow increased from 160 Nm3/h to 260 Nm3/h, the mixing time of the molten bath was further shortened. This shows that the bottom blowing gas agitation had a better uniform mixing effect on the molten bath, and with the increased bottom blowing gas flow, the uniform mixing time of the molten bath was shortened. When the top blowing gas flow was greater than 14,000 Nm3/h, the mixing time of the molten bath decreased significantly with the increase in the bottom blowing gas flow.
Figure 5 (right figure) shows the effect of oxygen lance position on the mixing time. When the oxygen lance position was 1.2 m, the mixing time of the molten bath could be significantly reduced. When the top blowing gas flow was changed from 11,000 to 15,000 Nm3/h, with the increase in top blowing gas flow, the effect on the mixing time was less significant than that of the bottom blowing gas flow.
The impact depth is an important index to measure the effect of the oxygen jet on the molten bath. With the increase in the top blowing gas flow, the impact depth becomes larger at different oxygen lance positions. When the oxygen lance position is lower, the impact depth is greater.
The impact area determines the degree of reaction of the oxygen jet to the slag-steel interface. When the oxygen lance position was higher, the impact area was also larger. When the top-blowing gas flow increased from 11,000 Nm3/h to 14,000 Nm3/h, the impact area had not changed much, but when the top blowing gas flow increased to 15,000 Nm3/h, the impact area increased significantly, as shown in Figure 6.

3.3. Effect of Vanadium Extraction from Hot Metal before and after Process Optimization

The bottom blowing process of vanadium extracting converter was optimized by using the circular seam bottom blowing gas supply element. After process optimization, with the increase in bottom blowing gas flow, the molten bath of vanadium extraction converter maintained a good stirring effect. The data before and after process optimization were compared, in which the data of the finished vanadium slag was 40 heats, and the data of semi-steel was 900 heats. The comparison of relevant process technical indicators is shown in Table 5.
After process optimization, the average vanadium oxide content of vanadium slag increased by 0.2 wt%. Under the condition that the vanadium content of hot metal was 0.33%, after the process optimization, the metal iron content of vanadium slag was significantly reduced, from an average of 27.64 wt% to 22.39 wt%. When the carbon content in the hot metal was 4.04 wt% and the oxygen consumption was 850 Nm3/heat, the carbon content in the semi-steel increased by 0.08 wt% on average after the process optimization. This shows that after the process optimization, the kinetic conditions of the molten bath were improved, and the vanadium oxygen reaction was more sufficient.
For the semi-steel composition, the vanadium content of the semi-steel was reduced by 0.003 wt% after the process optimization. Therefore, the bottom blowing stirring of the vanadium extraction converter was strengthened, and the vanadium content of the semi-steel was reduced, which was helpful to increase the vanadium content in the vanadium slag.
Before the process optimization, the bottom blowing element of the capillary bricks was easily blocked in use and erode rapidly. After the optimization of the process, the circular seam gas supply element was adopted. In terms of the use effect, there was no clogging phenomenon, and the flow and pressure of each branch pipe were relatively stable during use.
The output of vanadium slag was calculated as follows:
W0 = Ws × (1 − Wi) × (V)/(V0)
where W0 was vanadium slag output, Wi was vanadium slag weight, V was vanadium slag grade, V0 was standard vanadium slag grade.
The content of metallic iron in vanadium slag before and after optimization was 27.63 wt% and 22.39 wt%, the grades of vanadium slag were 18.34 wt% and 18.54 wt%, respectively, and the standard vanadium slag grade was 15%. Calculated based on the annual production of 70,000 tons of vanadium slag, after the process was optimized, an additional 5210 tons of vanadium slag can be produced each year, and based on the price of 1700 USD per ton of vanadium slag, economic benefits of 8,855,300 USD can be obtained.

4. Discussion

4.1. Variation of Molten Bath Stirring Energy after Process Optimization

The stirring effect of the oxygen jet on the molten bath is a combination of the top blowing gas flow, the bottom blowing gas flow and the oxygen lance position. Using the equation of molten bath stirring energy density, these factors are linked together to obtain the relationship between molten bath stirring energy and process parameters in the process of vanadium extraction from hot metal. The equation for stirring energy density [19,20] is:
ε T = 1.83 × 10 5 Q T 3 d 3 h V l
ε B = 14.25 Q B V l T l lg ( 1 + H 1.47 )
ε = ε B + 0.1 ε T
where QT is the top blowing gas flow, Nm3/min. d is the throat diameter of the oxygen lance, m. h is the oxygen lance position, m. Vl is the liquid volume of molten bath, m3. Tl is the temperature of the molten bath, K. H is the depth of molten bath, m. εT is the top blowing stirring energy density. W∙m−3; εB is the bottom blowing stirring energy density, W∙m−3.
From Equation (7), it can be seen that the effect of the top blowing gas on the stirring energy of the molten bath was 1/10 of that of the bottom-blowing gas, which was consistent with the research results of Kohtani T [21] on the stirring energy. He believed that most of the energy generated by the top blowing gas was consumed by the impingement liquid surface, and only 6 to 10% was converted into effective stirring power.
According to the changes of process parameters before and after optimization in Table 4, it was calculated that the average stirring energy of the molten bath before process optimization was 31.0 W/m3, and the variation range was from 24 to 45.23 W/m3. After process optimization, the molten bath stirring energy was 43.21 W/m3 on average, and the range was from 30.2 to 52.51 W/m3. This shows that the molten bath stirring effect after process optimization was greatly enhanced. The average mixing time of the molten bath before and after the process optimization measured in the water model experiment was 50 and 45 s, which was basically consistent with the calculation of the stirring energy.
In the initial stage of the vanadium extraction from the hot metal, it was beneficial to increase the fluidity of the molten bath by appropriately increasing the top blowing gas flow and reducing the position of the oxygen lance to increase the temperature of the molten bath. At this stage, the top blowing gas flow was chosen to be 14,000 Nm3/h, the oxygen lance position was from 1.4 to 1.5 m, and the bottom blowing gas flow was 160 Nm3/h. In the middle of the blowing process, appropriately reducing the top blowing flow and increasing the oxygen lance position would help prevent the temperature of the molten bath from rising too quickly. At this stage, the selected top blowing gas flow was from 12,000 to 13,000 m3/h, the oxygen lance position was 1.55 m, and the bottom blowing gas flow was 260 Nm3/h. In the later stage of blowing, the use of lower top blowing gas intensity and proper oxygen lance position helped to prevent the carbon content in the hot metal from oxidizing too quickly, and at the same time reduced the iron oxide content and metallic iron content in the vanadium slag. At this stage, the selected top blowing gas flow was from 12,000 to 13,000 m3/h, the oxygen lance position was 1.3 m, and the bottom blowing flow was 260 Nm3/h.
According to Equations (5)–(7), the stirring energy of the molten bath at each stage of smelting and the measured mixing time are shown in Table 6. The parameters in the process of vanadium extraction from hot metal were optimized by measuring the mixing time and calculating the stirring energy, which conformed to the chemical reaction and temperature changes in the process of vanadium extraction from hot metal, and improved the kinetic conditions of the molten bath as much as possible.

4.2. Analysis of Factors Affecting the Distribution Ratio of Vanadium

When the bottom blowing process of the vanadium extraction furnace was optimized, the transfer of vanadium in the hot metal to the slag was promoted. Therefore, the ratio of the vanadium content in the vanadium slag to the vanadium content in the hot metal can be used to evaluate the degree of vanadium in the hot metal entering the vanadium slag. The higher the distribution ratio of vanadium, the more vanadium in the hot metal entered the slag, which was more conducive to the generation of vanadium slag with high vanadium content, thereby improving the efficiency of vanadium extraction [16].
The distribution ratio of vanadium (Lv) was calculated as shown in Equation (8).
L v = 0.56 × W s × ( V 2 O 5 ) W h × [ V ] × 100 %
where Ws was the weight of the vanadium slag, t. Wh was the weight of the semi-steel, t. (V2O5) was vanadium oxide content in the vanadium slag, %. [V] was the vanadium content in the semi-steel, %.
Figure 7 shows the distribution ratio of vanadium obtained in the experiment. The vanadium distribution ratio after process optimization was increased by one compared with that before the process optimization, and the vanadium in the hot metal after the process optimization was more likely to enter the slag.
Figure 8 shows the factors that affect the distribution ratio of vanadium, and the test data were selected from the data after optimization. With the increase of oxygen consumption, the distribution ratio of vanadium increased obviously. The effect of the carbon content at the end-point on the distribution ratio of vanadium was not significant, and it tended to increase slightly. The distribution ratio of vanadium decreased with the increase in the endpoint temperature and the added coolant.
Based on the above data, linear regression was performed on the influencing factors of the vanadium distribution ratio, and the following relational expressions affecting the vanadium distribution ratio were obtained.
Lv = 0.67WO + 0.20[C] − 0.005T − 0.005WC + 8.01
where Lv was the distribution ratio of vanadium. WO was the oxygen consumption, Nm3/t. [C] was the carbon content at the end-point, wt%. T was the end point temperature, °C. WC was the weight of iron balls and pellets, kg/t.
According to the target of the current process blowing end point, the end point temperature was set from 1370 to 1390 °C, the carbon content was from 3.5 to 3.7 wt%, the weight of the iron balls and pellets was from 10 to 30 kg/t, and the oxygen consumption was from 11 to 12 Nm3/t. According to the calculation of Equation (9), the obtained distribution ratio of vanadium was above 9.18.

4.3. Changes in Slag Mineral Phase Composition before and after Process Optimization

In order to analyze the vanadium extraction process of the vanadium extraction furnace, it was very helpful to understand the chemical composition of the vanadium slag and its mineral phase composition in the process of vanadium extraction.
The composition changes of vanadium slag before and after process optimization were shown in Table 7. From the composition comparison, the content of iron oxide and metallic iron in the vanadium slag after the process optimization has been greatly reduced.
The XRD measurement result of vanadium slag is shown in Figure 9. Before process optimization, the mineral phase composition of vanadium slag was FeO∙V2O3 accounting for 76.1 wt%, 2FeO∙SiO2 accounting for 19.2 wt%, and Fe3O4 accounting for 4.7 wt%. After the process optimization, the mineral phase composition of vanadium slag was FeO∙V2O3, accounting for 85.3 wt%, CaO∙FeO∙2SiO2, accounting for 11.3 wt%, and FeO accounting for 3.4 wt%.
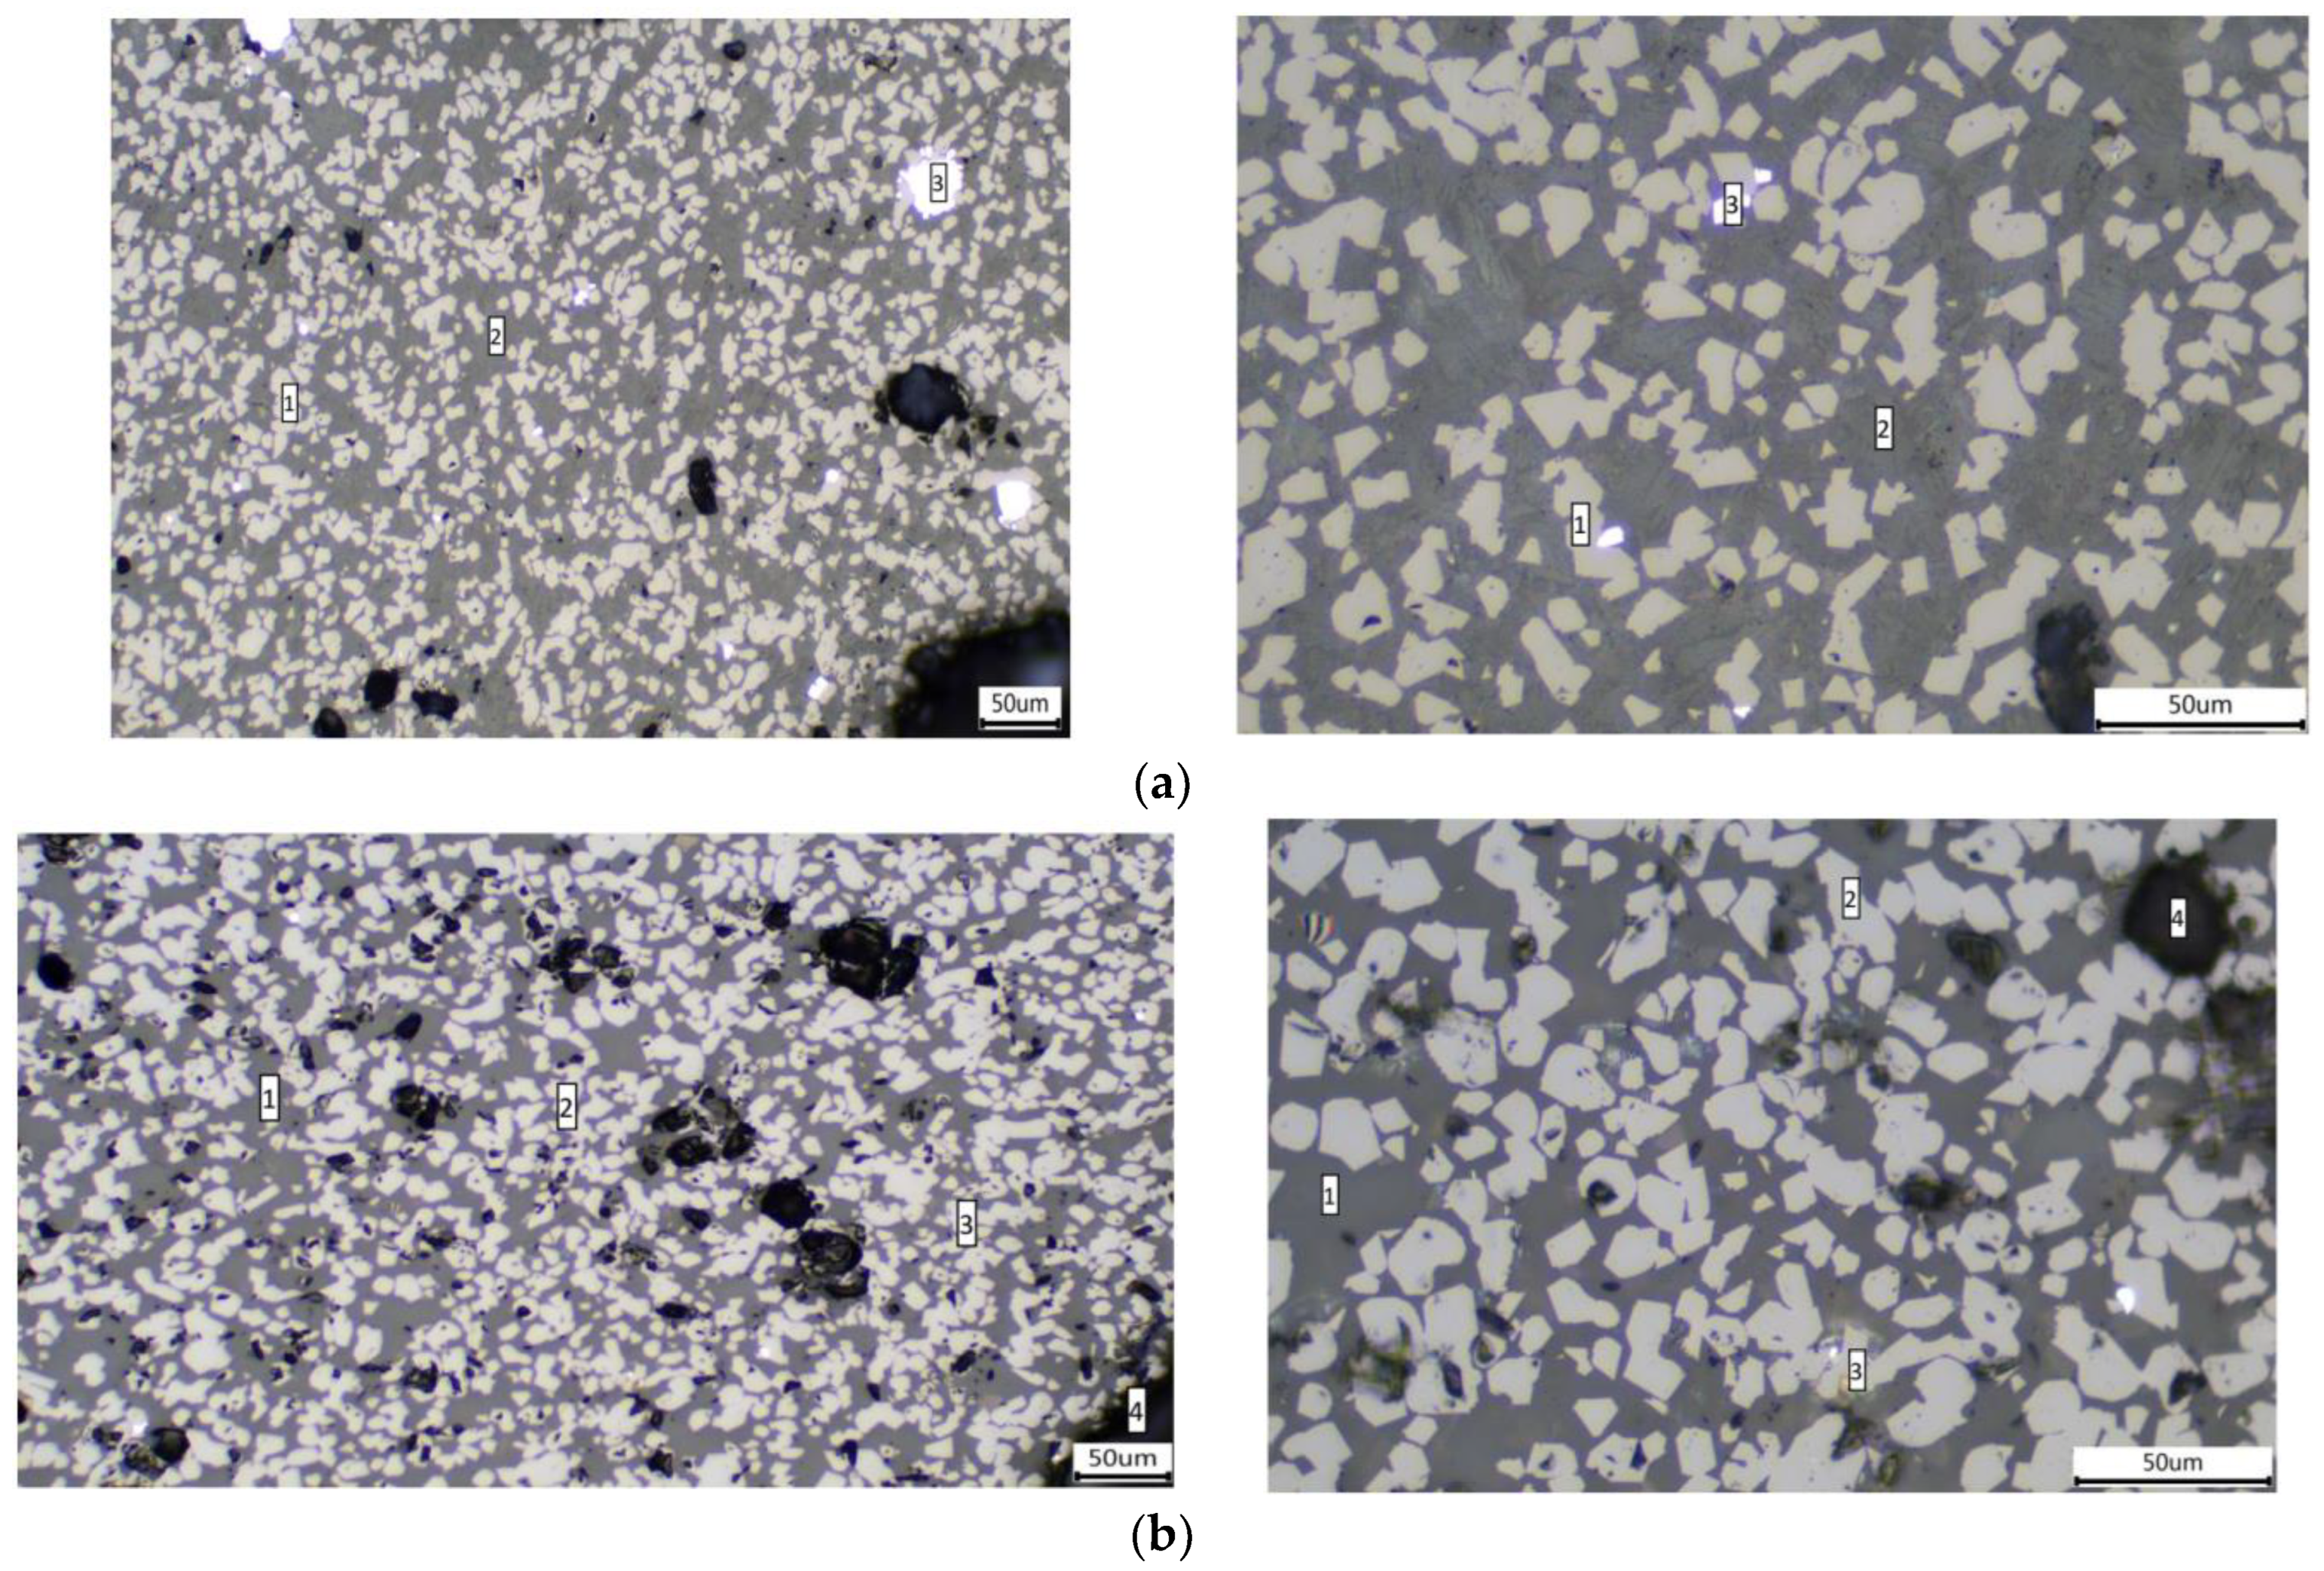
Figure 10 shows the mineral phase structure photos of vanadium slag before and after process optimization. Before the process optimization, the mineral phase composition of vanadium slag was mainly RO phase and FeO∙V2O5 phase. After the process optimization, the mineral phase composition of vanadium slag has not changed, and the metallic iron content contained in it has been greatly reduced.
According to the above analysis, the combination of vanadium oxide and iron oxide in vanadium slag can produce vanadium iron oxide. The reaction was as follows:
FeO(l) + V2O3(s) = FeO∙V2O3(s)    ΔG0 = −45190 + 16.32T
According to Equation (10), the following equation can be obtained.
lgXV2O3 = −2360/T + 0.85 − lgaFeO − lgγV2O3
According to the composition of vanadium slag, SiO2 was from 17 wt% to 18 wt%, CaO was from 3.9 wt% to 4.1 wt%, Cr2O3 was from 0.7 wt% to 0.8 wt%, V2O3 was from 16 wt% to 25 wt%, FeO was from 30 wt% to 40 wt%, M.Fe was from 15 wt% to 25 wt%. The activity coefficient of iron oxide and V2O3 of vanadium slag was selected as 1. Thus, the relationship between the iron oxide content and the vanadium oxide content of the vanadium slag can be obtained. In the temperature range of 1380–1400 °C, as the iron oxide content of the vanadium slag decreased, the vanadium oxide content decreased. When the iron oxide content of the vanadium slag was reduced from 40 wt% to 30 wt%, the V2O3 content in the vanadium slag increases by 3.5 wt% to 23.0 wt%.
Theoretically, the mass ratio of FeO to V2O3 was one when FeO∙V2O3 was generated. However, the current mass ratio of FeO to V2O3 was 1.5. It could be seen that by improving the stirring conditions of the bottom blowing and increasing the top blowing stirring intensity, the content of iron oxide and metallic iron in the vanadium slag was obviously reduced, which helped to increase the content of V2O3 in the vanadium slag.

5. Conclusions

In this paper, the effect of bottom blowing stirring of vanadium extraction furnace on vanadium extraction effects from vanadium-containing hot metal was determined by the water model experiment and industrial test, and the following conclusions were obtained:
  • The arrangement of the bottom blowing element was determined by the water model experiment. When the bottom blowing gas element was located at 0.45D (D was the diameter of the furnace bottom), the best stirring effect could be obtained.
  • The best blowing process parameters in the blowing process were determined: in the early stage of blowing, the top blowing gas flow was 14,000 Nm3/h, the oxygen lance position was from 1.4 to 1.5 m, and the bottom blowing gas flow was 160 Nm3/h. In the middle stage of blowing, the top blowing gas flow was from 12,000 to 13,000 Nm3/h, the oxygen lance position was 1.55 m, and the bottom blowing gas flow was 260 Nm3/h. In the later stage of blowing, the top blowing gas flow was from 13,000 to 13,500 Nm3/h, the oxygen lance position was 1.3 m and the bottom blowing gas flow was 260 Nm3/h.
  • After process optimization, the average value of vanadium content of semi-steel and metal iron content of vanadium slag were 0.033 wt% and 22.39 wt%, respectively, which were 0.003 wt% and 5.25 wt% lower than those before process optimization. The average vanadium oxide content of vanadium slag was 18.54 wt%, which was 0.2 wt% higher than that before process optimization. This shows that after the process optimization, the kinetic conditions of the molten bath were good, and the vanadium oxygen reaction was more sufficient.

Author Contributions

J.Z.: literature search, research design, data analysis, manuscript writing; W.W.: Experimental equipment support, experimental operation, data analysis; B.Z.: Research ideas support; X.L.: Data support and analysis; F.X.: Literature research, data analysis. All authors have read and agreed to the published version of the manuscript.

Funding

This research has been supported by Beijing Natural Science Foundation (2222040), Funded projects by the central government to guide local science and technology development funds (2020ZY0034) and Funded by Baotou Science and Technology Program (XM2021CXZX01).

Conflicts of Interest

The authors declare no conflict of interest.

References

  1. Shushi, Z.; Zhenyang, W.; Peng, H.; Jiating, R.; Jianliang, Z.; Jing, P. Distribution behavior of vanadium and titanium between hot metal and high titanium slag relevant to HIsmelt smelting condition. J. Mater. Res. Technol. 2022, 19, 4517–4524. [Google Scholar]
  2. Deng, R.; Xiao, H.; Xie, Z.; Liu, Z.; Yu, Q.; Chen, G.; Tao, C. A novel method for extracting vanadium by low temperature sodium roasting from converter vanadium slag. Chin. J. Chem. Eng. 2020, 28, 2208–2213. [Google Scholar] [CrossRef]
  3. Rui, Y.; Shaolong, L.; Yusi, C.; Jilin, H.; Jianxun, S.; Bin, Y. A critical review on extraction and refining of vanadium metal. Int. J. Refract. Met. Hard Mater. 2021, 101, 105696. [Google Scholar]
  4. Lindvall, M.; Berg, M.; Sichen, D. The effect of Al2O3, CaO and SiO2 on the Phase relationship in FeO-SiO2 based slag with 20 mass% vanadium. J. Sustain. Metall. 2017, 3, 289–299. [Google Scholar] [CrossRef] [Green Version]
  5. Diao, J.; Qiu, Y.-Y.; Lei, J.; Zhang, Q.; Tan, W.-F.; Li, H.-Y.; Xie, B. Study on Saturated Solubility of MgO in Converter Vanadium Slag. JOM 2020, 73, 999–1003. [Google Scholar] [CrossRef]
  6. Chen, L.; Diao, J.; Wang, G.; Xie, B. Assessment of Dephosphorization During Vanadium Extraction Process in Converter. JOM 2018, 70, 963–968. [Google Scholar] [CrossRef]
  7. Tatjana, J.; Elena, Y.; Klaus, H.; to Baben, M.; Guixuan, W.; Michael, M. Addition of V2O5 and V2O3 to the CaO–FeO–Fe2O3–MgO–SiO2 database for vanadium distribution and viscosity calculations. Calphad 2021, 74, 102284. [Google Scholar]
  8. Song, W.-C.; Li, H.; Zhu, F.-X.; Li, K.; Zheng, Q. Extraction of vanadium from molten vanadium bearing slag by oxidation with pure oxygen in the presence of CaO. Trans. Nonferrous Met. Soc. China 2014, 24, 2687–2694. [Google Scholar] [CrossRef]
  9. Wang, Y.-N.; Song, W.-C.; Li, H. Vanadium extraction and dephosphorization from V-bearing hot metal with fluxes containing CaO. J. Cent. South Univ. 2015, 22, 2887–2893. [Google Scholar] [CrossRef]
  10. Li, X.-S.; Xie, B. Extraction of vanadium from high calcium vanadium slag using direct roasting and soda leaching. Int. J. Miner. Metall. Mater. 2012, 19, 595–601. [Google Scholar] [CrossRef]
  11. Zhenyu, Z.; Ping, T. Optimization on Temperature Strategy of BOF Vanadium Extraction to Enhance Vanadium Yield with Minimum Carbon Loss. Metals 2021, 11, 906. [Google Scholar] [CrossRef]
  12. Liu, F.; Sun, D.; Zhu, R.; Dong, K.; Bai, R. Effect of Side-blowing Arrangement on Flow Field and Vanadium Extraction Rate in Converter Steelmaking Process. ISIJ Int. 2018, 58, 852–859. [Google Scholar] [CrossRef] [Green Version]
  13. Huang, W.; Yu, S.; Shen, X.; Xu, L.; Wang, N.; Chen, M. Kinetic study on the oxidation of elements in hot metal during vanadium extraction process. Steel Res. Int. 2016, 87, 1228–1237. [Google Scholar] [CrossRef]
  14. Du, W.-T.; Jiang, Q.; Chen, Z.; Liang, X.-P.; Wang, Y. Experimental Characterization of CO2 and CaCO3 Used in a Pyrometallurgical Vanadium-Extraction Process. JOM 2019, 71, 4925–4930. [Google Scholar] [CrossRef]
  15. Guo, Z.-L.; Wang, Y.; Qi, L.; Wang, S.-C. Study on the Effect of Different CO2–O2 Mixture Gas Blowing Modes on Vanadium Oxidation. In 10th International Symposium on High-Temperature Metallurgical Processing; Springer: Berlin/Heidelberg, Germany, 2019; pp. 787–794. [Google Scholar]
  16. Lindvall, M.; Tikka, J.; Berg, M.; Ye, G.; Sichen, D. Vanadium Extraction from a Fe–V (2.0 Mass%)–P (0.1 Mass%) Melt and Investigation of the Phase Relations in the Formed FeO–SiO2 -Based Slag with 20 Mass% V. J. Sustain. Metall. 2017, 3, 808–822. [Google Scholar] [CrossRef]
  17. Wu, W.; Zhu, Y.-C.; Pan, S.-M. Research on Large Converter Combined Blowing and Slag Splashing Technology. China Metall. 2013, 23, 1–4. [Google Scholar]
  18. Gao, Q.; Wu, W.; Zhao, J.-X. Cold Simulation of the Effect of Self-Rotating Oxygen Lance on the Mixing Time of Molten bath. J. Iron Steel Res. 2020, 32, 945–950. [Google Scholar]
  19. Zhang, H.-S.; Xiao, Z.-Q. Influence of slag/steel mixing state on mass transport rate. Iron Steel 1987, 22, 24–28. [Google Scholar]
  20. Kim, S.-H.; Fruehan, R.-J.; Guthrie, R.-I. Physical Model Studies of Slag/Metal Reactions in Gas Stirred Ladles—Determination of Critical Gas Flow Rate. Iron Steel Mak. 1993, 20, 71–76. [Google Scholar]
  21. Kohtani, T. On the metallurgical and blowing characteristics of LD-OB process. Steelmak. Process 1982, 65, 211–220. [Google Scholar]
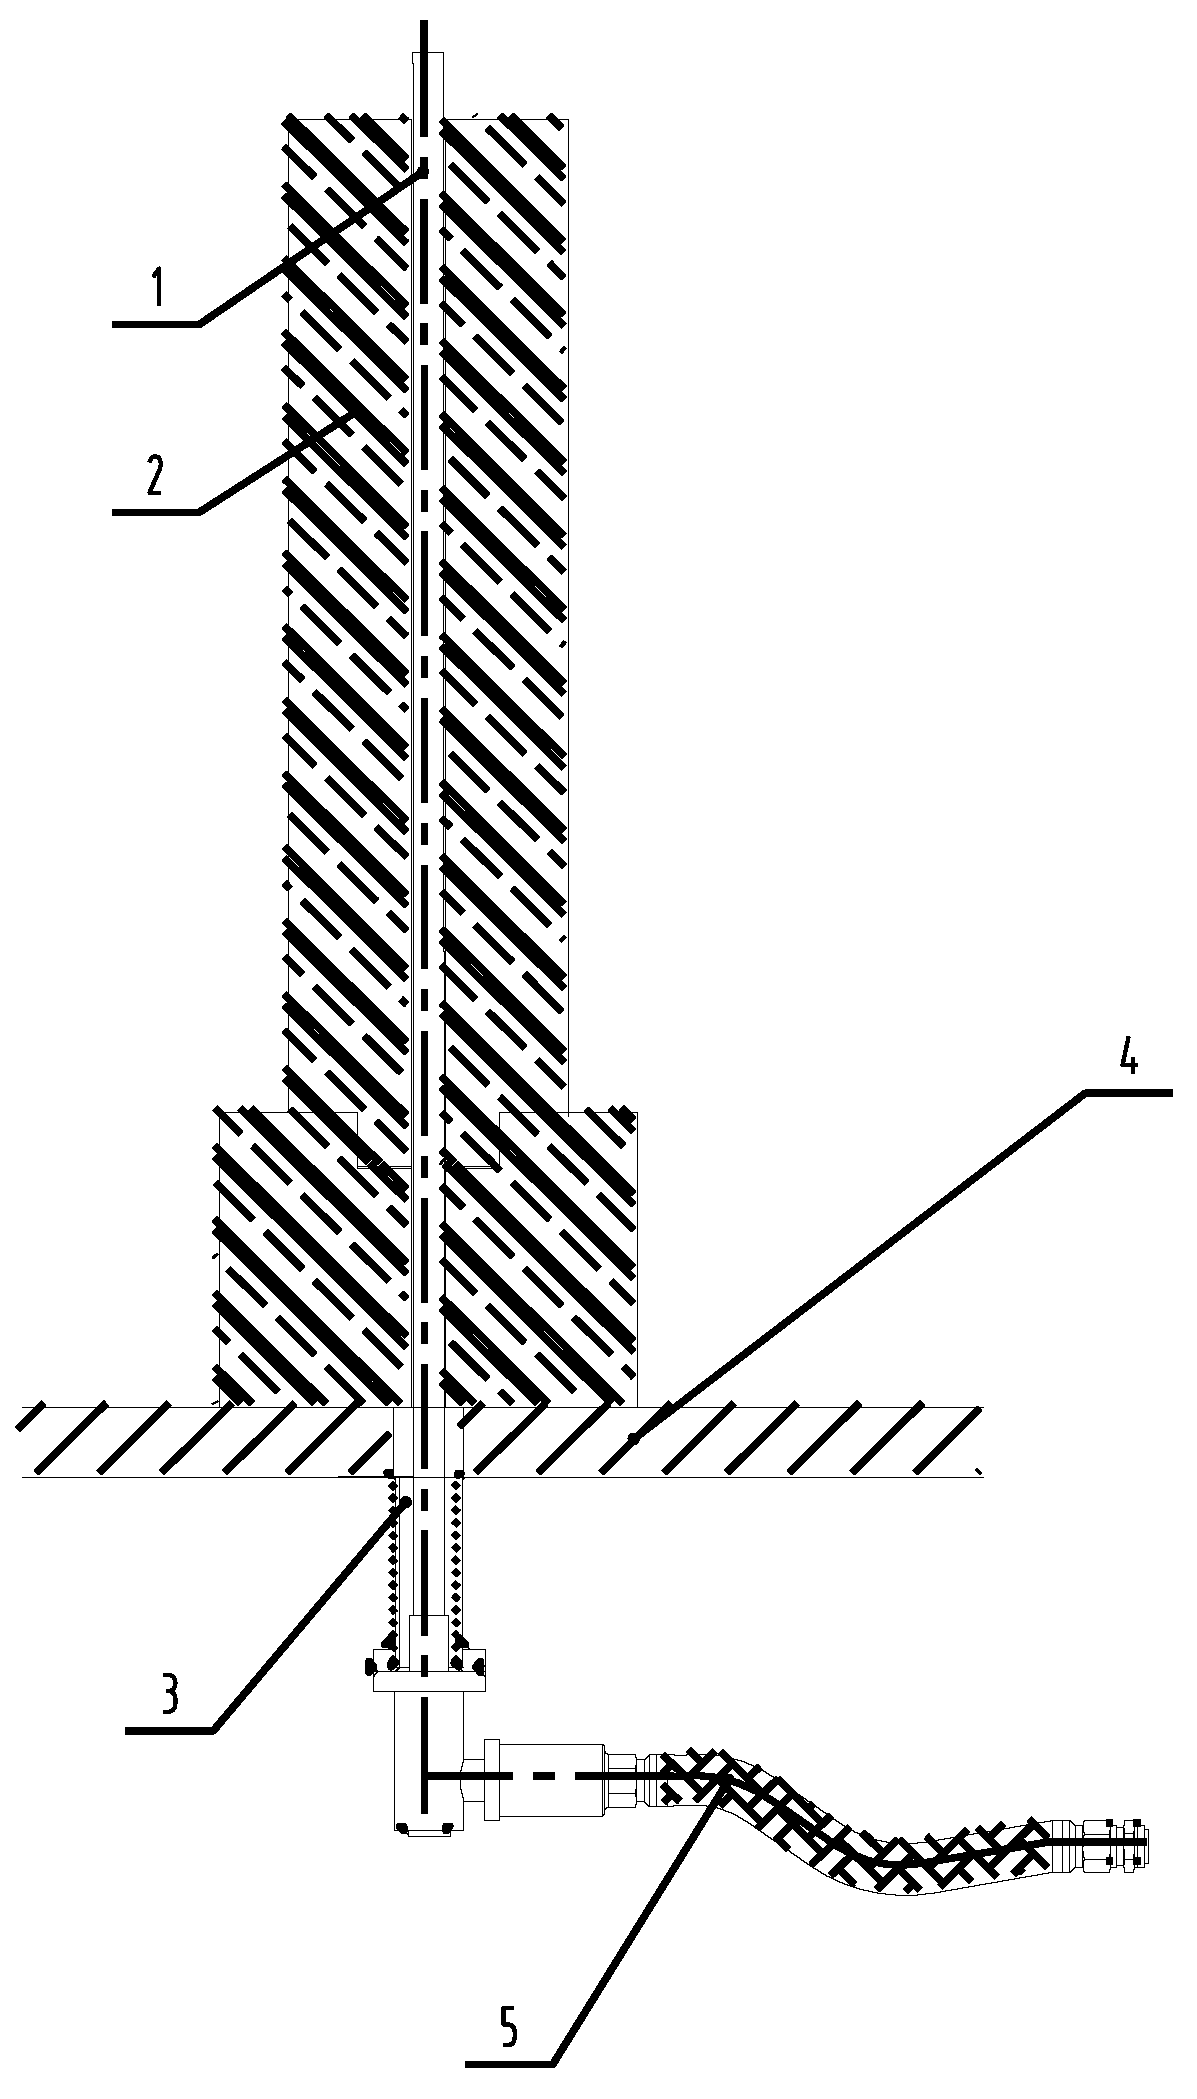
Figure 1. Schematic diagram of circular seam bottom-blowing gas supply element: 1—steel pipe; 2—brick; 3—refractory mud; 4–converter shell; 5–metal hose.
Metals 12 02061 g001
Figure 2. Diagram of the water model experimental device.
Metals 12 02061 g002
Figure 3. Layout of the bottom blowing element of the converter.
Metals 12 02061 g003
Figure 4. Determination of the effect of different bottom blowing element arrangements on the mixing time.
Metals 12 02061 g004
Figure 5. Effects of bottom blowing gas flow, top blowing gas flow and oxygen lance position on the mixing time of molten bath.
Metals 12 02061 g005
Figure 6. Variation of impact depth and impact area measured in the experiment.
Metals 12 02061 g006
Figure 7. Comparison of vanadium distribution ratio before and after process optimization.
Metals 12 02061 g007
Figure 8. Factors affecting the distribution ratio of vanadium.
Metals 12 02061 g008
Figure 9. XRD measurement of vanadium slag before and after process optimization.
Metals 12 02061 g009
Figure 10. The mineral phase structure photos of vanadium slag before and after process optimization. (a) 1-RO phase (40–45%); 2-FeO∙V2O3 (40–45%); 3-Mfe (5–10%); (b) 1-RO phase (40–45%); 2-FeO∙V2O3 (35–40%); 3-MFe (3–5%). Mineral phase composition of vanadium slag after process optimization.
Metals 12 02061 g010
Table 1. Comparison of main dimensions of converter prototype and model.
NamePrototypeModel
molten bath diameter/mm3540753
Converter height/mm71401519
Converter mouth diameter/mm2220472
Table 2. Kinetic parameters related to the converter prototype and model.
NameGas Density
/kg∙m−3
Liquid Density
/kg·m−3
Nozzle Throat Diameter/mmNozzle Outlet Diameter/mmMolten Bath Depth/mm
Prototype1.43700033.041.81131
Model1.2910007.028.89240
Table 3. Blowing parameters used in the water mold experiment.
Scheme CodeA1A2A3A4A5
Top blowing gas flow in prototype/Nm3∙h−111,00012,00013,00014,00015,000
Top blowing gas flow in the model/Nm3∙h−193.99102.53111.07119.61128.16
Scheme codeB1B2B3B4
Bottom gas element arrangement0.40D0.45D0.53D0.60D
Scheme codeC1C2
Bottom blowing gas flow in the prototype/Nm3∙h−1160260
Bottom blow gas flow in the model/Nm3∙h−11.251.63
Scheme codeD1D2D3
Oxygen lance position in prototype/mm120014001600
Oxygen lance position in the model/mm255233340
Table 4. Changes of blowing process before and after process optimization.
NameBottom Blowing Gas Supply
Element
Bottom Blowing Gas FlowTop Blowing Gas Flow and Oxygen Lance PositionCoolant Addition Time
Before optimizationThe capillary bricksThe bottom blowing flow of the whole process was 160 Nm3/hThe top blowing flow was from 11,000 to 15,000 Nm3/h, and the oxygen lance position was from 1.2 to 1.6 mIron balls and pellets were added in two times, every 2 min, and the addition is completed within 4 min.
after optimizationThe circular seam bottom blowing gas supply element0–220 s, bottom blowing flow was 160 Nm3/h; 220–280 s, the bottom blowing flow was 260 Nm3/h0–120 s, the top blowing flow was 14,000 Nm3/h, and the oxygen lance position was from 1.4 to 1.5 m;
120–220 s, the top blowing flow was from 12,000 to 13,000 Nm3/h, and the oxygen lance position was 1.55 m;
220–280 s, the top blowing flow was from 12,000 to 13,000 Nm3/h, the gun position was 1.3 m
Iron balls and pellets were added in three times, every 1 min, and the addition was completed within 3.5 min.
Table 5. Changes of main components and temperature of vanadium slag and semi-steel before and after process optimization.
ItemValueBefore Process
Optimization
After Process Optimization
(V2O5) in vanadium slagaverage value/wt%18.3418.54
variation range/wt%15.4–20.1815.7–20.2
metallic iron in vanadium slagaverage value/wt%27.6322.39
variation range/wt%22.2–35.0617.04–35.28
[C] in semi-steelaverage value/wt%3.283.36
variation range/wt%2.45–3.992.38–4.16
[V] in semi-steelaverage value/wt%0.0360.033
variation range/wt%0.012–0.0870.014–0.066
Semi-steel temperatureaverage value/℃13581351
variation range/℃1277–14581261–1449
Table 6. Stirring energy calculated and mixing time of molten bath measured at each stage of smelting.
StageTop Blowing Gas Flow/Nm3/hOxygen Lance
Position/m
Bottom Blowing Gas Flow/Nm3/hMixing Time/sStirring
Energy/W/m3
Early stage of blowing
(0–120 s)
14,0001.4–1.51604239.45–42.15
Middle stage of blowing
(120–220 s)
12,000–13,0001.552605025.78–32.02
Later stage of blowing (220–280 s)13,000–13,5001.32603837.65–41.83
Table 7. Changes of vanadium slag composition before and after process optimization/wt%.
NameCaOSiO2MgOFeOMnOV2O5M.Fe
Before optimization4.7812.381.2431.268.018.5617.28
After optimization4.5711.781.4424.317.821.6615.48
Publisher’s Note: MDPI stays neutral with regard to jurisdictional claims in published maps and institutional affiliations.