Article

Process Optimization for Up-Facing Surface Finish of AlSi10Mg Alloy Produced by Laser Powder Bed Fusion

Ji Hua Laboratory, Institute of Advanced Additive Manufacturing, Foshan 528010, China
*
Author to whom correspondence should be addressed.
Metals 2022, 12(12), 2053; https://doi.org/10.3390/met12122053
Submission received: 21 October 2022 / Revised: 25 November 2022 / Accepted: 26 November 2022 / Published: 29 November 2022

Abstract

:
This work investigates the effects of various processing parameters (laser power, scanning speed, hatch distance and beam offset) on the resultant inclined up-facing surface roughness of AlSi10Mg alloys produced by laser powder bed fusion (LPBF). A two-step approach, orthogonal test followed by the Doehlert matrix design (DMD) test is used to efficiently optimize the up-facing surface and contour parameters. The former method aims to determine the significance of variables while the latter one facilitates a rapid optimization. The results show that the interaction and interdependency among the parameters are of great significance to the obtainable surface roughness. Using a rational design of experiments, the optimized up-facing surface roughness of Ra of 5.4 μm is achieved. This is attributed to the elimination of the laser partition track and the reduction in irregularities at the edges of the parts. This work demonstrates an effective approach of experimental processing parameter optimization to improve the surface finish of LPBF parts.

1. Introduction

Laser powder bed fusion (LPBF) is a promising additive manufacturing (AM) technique that shows high potential for manufacturing fully dense metallic components with complex and customizable shapes. It has been successfully applied in aerospace, automotive and biomedical industries [1,2]. Though noticeable progress has been made in LPBF, some challenging issues still need addressing to allow for the full industrialization of LPBF as a manufacturing process. Particularly, near-net-shape parts made by LPBF usually have high surface roughness, resulting in time-consuming and resource-demanding post surface treatments to meet the delivery requirements [3,4]. Reducing the surface roughness of as-built products by the optimization of processing conditions is therefore desirable.
The distinctive processing manner of LPBF leads to the formation of four different types of surfaces depending on the orientations with respect to the build direction, namely, the top surface, the two side surfaces, the inclined up-facing and down-facing surfaces (Figure 1a). Specifically, top surfaces are formed by the last processed layer featuring overlapping laser scan tracks. Side surfaces are parallel to the build direction and exhibit the beginning and ending features of laser scan tracks. Inclined up-/down-facing surfaces are the surfaces with certain (non-normal) angles to the build direction, where the staircase effect (Figure 1b) plays an essential role in the formation of surface roughness. The surfaces of LPBF parts, in most conditions, have inclined angles toward the build direction rather than parallel or perpendicular to the processing direction. The combination of the staircase effect, powder particle attachment and edge effect results in higher surface roughness of inclined up-facing surfaces [5,6]. In addition to the staircase effect (Figure 1b), an inclined down-facing surface usually shows high surface roughness as larger melt pools are formed with more semi-melted powder particles attached to the surface and the slow local heat transfer to the surrounding powder bed [5].
There have been many studies on the minimization of surface roughness in LPBF products, and the majority of them focused on the side and top surfaces. The material systems of the related studies include stainless steel [7,8], Ni-based superalloys [9,10], Ti-based alloys [11,12,13,14,15], CoCr-based alloys [16,17] and aluminum alloys [18,19,20,21]. Generally, top surface quality can be improved when continuous scan tracks and sufficient overlap between adjacent tracks are achieved by adjusting parameters [22,23]. Side surface roughness reduction needs a lower energy input to minimize the semi-melted powder on the surface [24]. Some authors have investigated upward-facing inclined surfaces. Newton et al. [25] indicated that the amount of attached particles of Ti-6Al-4V parts in powder bed fusion is increasing with increasing surface slope angle. Chen et al. [26] reported that the surface roughness of the inclined surfaces is affected by the orientation of the surface to the center of the build platform.
Although many studies addressed the influence of processing parameters on the density and surface morphology of the final parts, most of them only varied the core parameters. However, the up-facing skin parameters and contour parameters also play significant roles on surface quality. Unfortunately, the mechanisms of inclined surface roughness evolution in the LPBF process are still not well-studied. In this regard, this work aims to provide a clear view on the effect of the up-facing skin parameters and contour scanning strategies in the context of inclined up-facing surfaces produced by LPBF from AlSi10Mg. Two steps of experimental investigations were conducted to understand the individual and interactive effects of varied factors on the surface roughness of up-facing surfaces. The evolution mechanism of surface roughness over varying parameters is discussed. This paper can shed light on potential strategies for the design and manufacturing of AlSi10Mg parts with high surface quality.

2. Experimental Procedures

2.1. Materials and LPBF Process

A near-spherical gas-atomized AlSi10Mg powder (Avimetal Powder Metallurgy Technology Co., Ltd., Beijing, China) with a size ranging from 15 to 53 μm was used for LPBF experiments. Specimens with inclined surfaces (Figure 2) were fabricated using commercial SLM equipment (Farsoon, 273M, Farsoon Technologies Co., Ltd., Changsha, China) equipped with a 500 W fiber laser and a spot size of 90 μm. The build plate was preheated to 80 °C before processing. The core parameters of specimens were kept constant (laser power of 380 W, scanning speed of 1800 mm/s and hatch distance of 0.189 mm). The layer thickness was 30 μm. The inclination angles of samples to the build plate were fixed at 45°.

2.2. Design of Experiments

2.2.1. Up-Facing Parameters Optimization

The up-facing skin parameters and contour parameters were investigated using the following design of experiment (DOE) methods. As shown in Figure 1a,c, the inclined up-facing surfaces were defined as the surfaces that face upwards and possess a non-normal angle with the build direction. To improve the surface finish on up-facing surfaces, a certain thickness near the surface (skin) was processed with parameters different from the core parameters. The thickness of up-facing surfaces was defined by LPBF machine programs by specifying the up-facing skin thickness, threshold d. Specifically, the cross-section area of layer N was compared with layer N − 1; if the area of layer N was larger than that of layer N − 1 and the upper surface length was larger than the threshold d, then the difference in the area between the two layers was defined as the up-facing skin.
Two DOE methods were used in sequence for the experimental study of the parameters. Firstly, an orthogonal test method was used for screening purposes with a small number of runs, i.e., to determine the importance of variables and their effects on the outcoming roughness value. Secondly, the Doehlert matrix design (DMD) was used for the optimization of parameters to identify a processing window where minimal surface roughness can be achieved. DMD is a type of response surface methodology; it requires a lesser number of experiments compared to central composite design (CCD) and Box–Behnken design (BBD) when the number of variables is 2, 4, 6 and 8 [26,27,28,29]. According to DMD, the total number of experimental combinations (N) is given by N = k2 + k + n0, where k is the number of independent variables and n0 is the number of repetitions center points. The experimental conditions designed with DMD are distributed around the center point with equal distance to the center and in between neighboring points, and therefore is also called uniform shell design.
The DOE matrix is defined by the number of variables and the coded values (Ci) of the experimental matrix. The relationship between coded and real values is given by [27]:
C i = ( X i X i 0 Δ X i ) α
where Ci is the coded value for the level of factor i, Xi is its real value in an experiment, X i 0 is the real value at the center of the experimental domain, Δ X i is the step of variation of the real value and α is the coded value limit for each factor.
Four up-facing skin parameters, namely laser power, scanning speed, hatch distance and beam offset, were investigated. The L25(54) orthogonal table with four factors and five levels was used, as seen in Table 1. After analyzing the results from the orthogonal tests, independent variables were further investigated in the next step of DMD experiment with more levels. The coded factors and different numbers of levels of Doehlert matrix were shown in Table 2. It is worth mentioning that the number of levels in a Doehlert design is not the same for all factors (Seen in Table 2). Therefore, the factors with the stronger effect are recommended to be set as the variable with more levels in order to obtain more information and achieve optimized results efficiently.

2.2.2. Contour Parameter Optimization

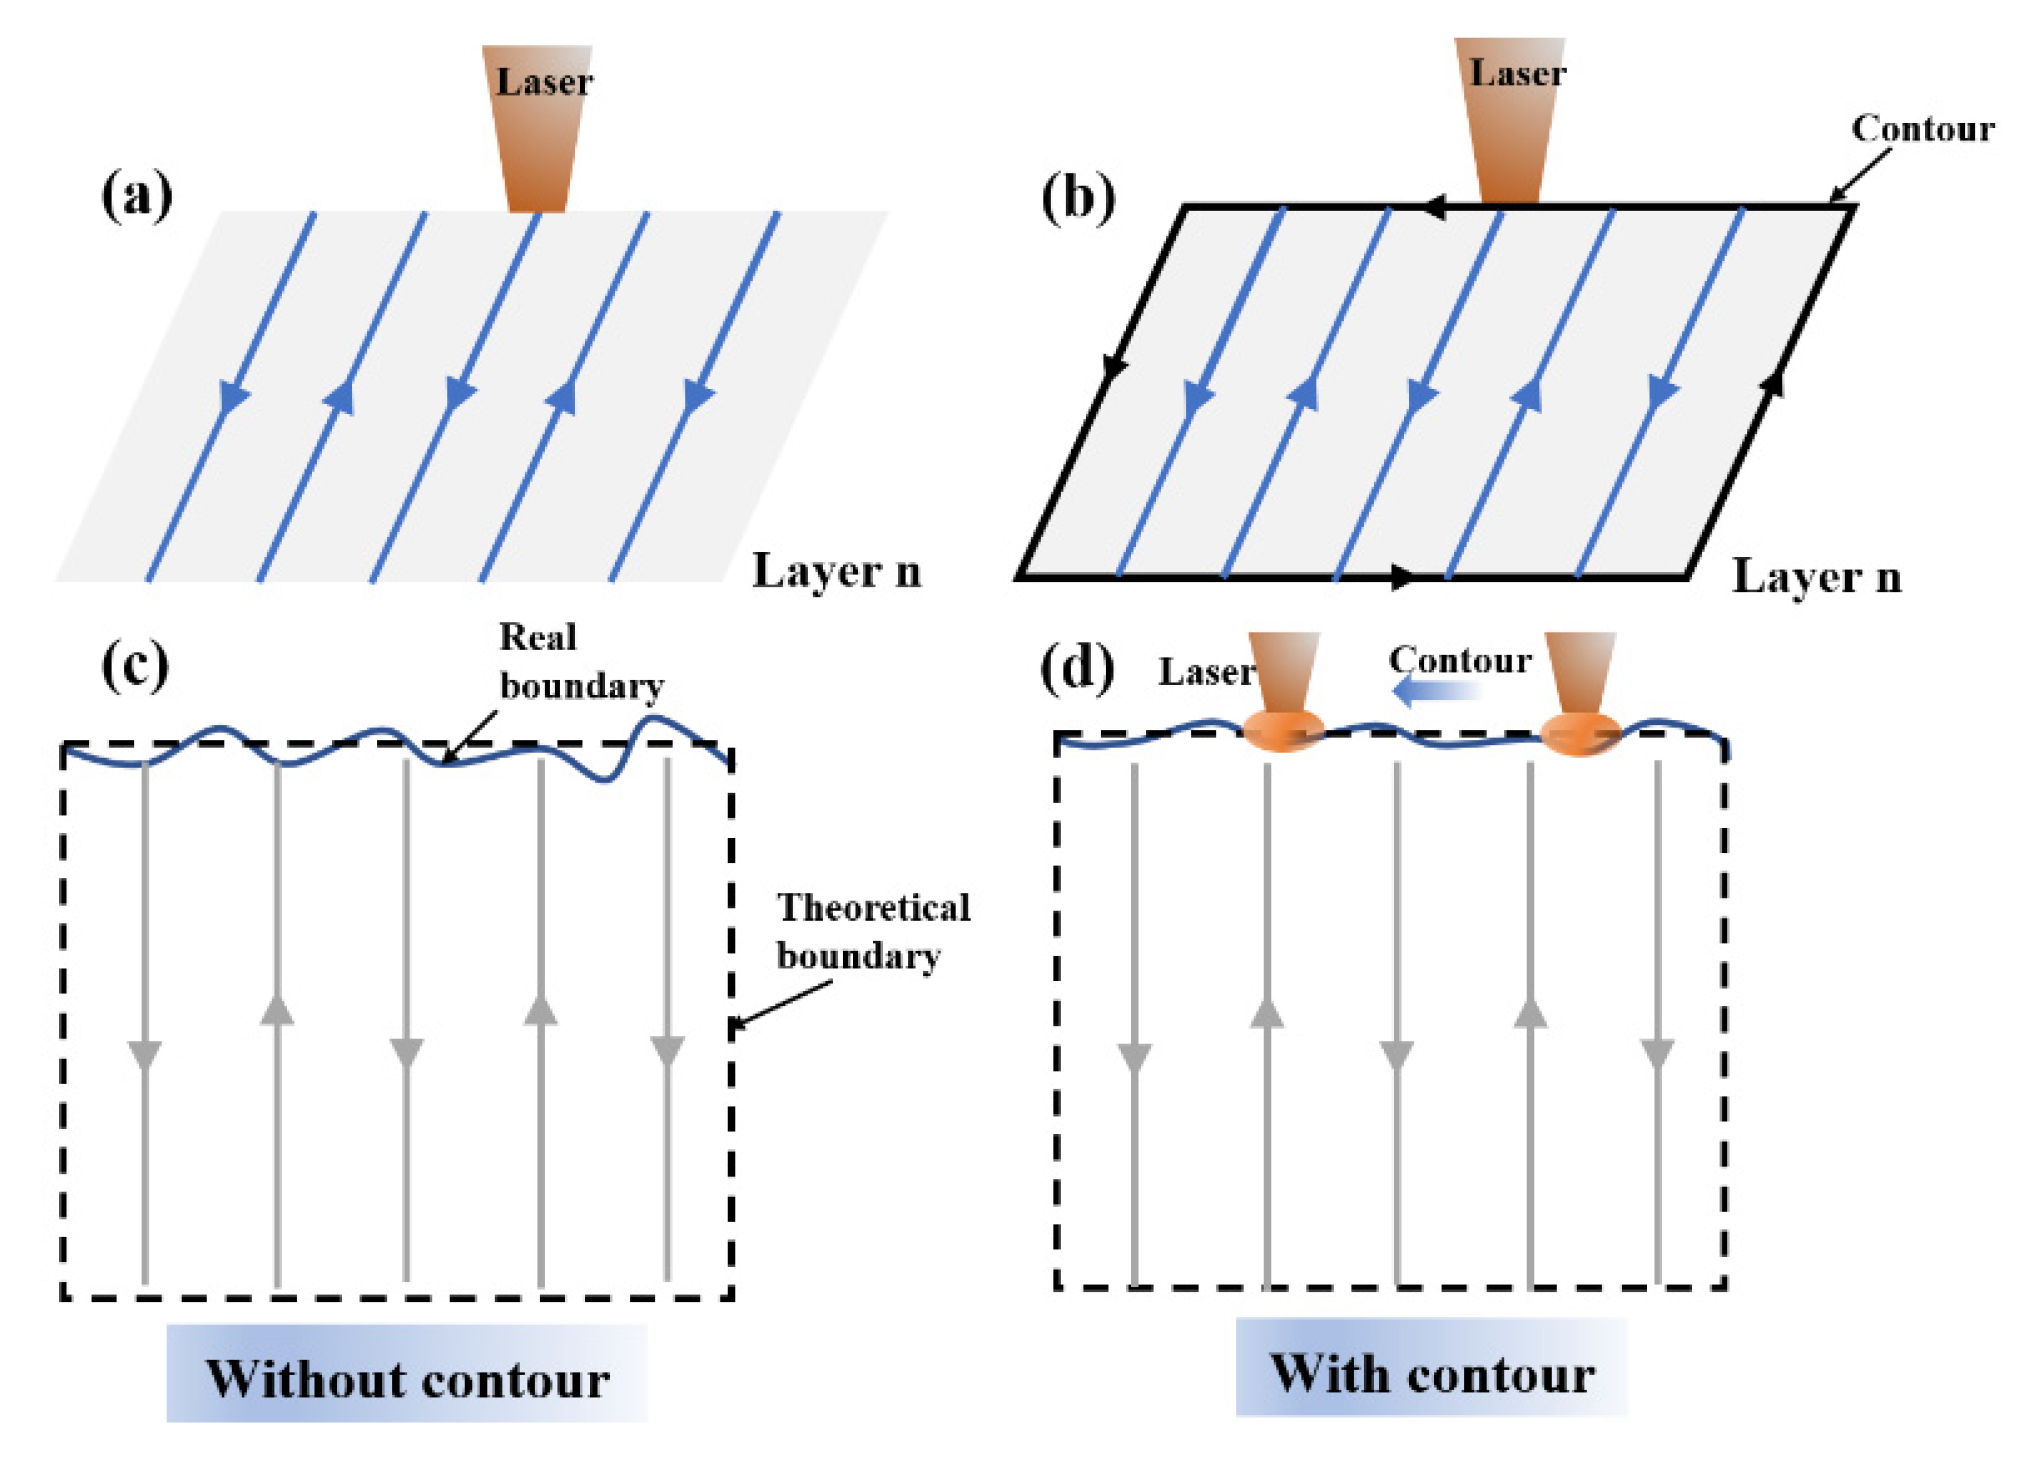
The surface quality of LPBF parts can be improved by contour scans [30]. As illustrated in Figure 3, the real boundary of each processed layer is where the laser scan tracks run, which creates undulation and attached particles. The contour scan direction is parallel to the edge and removes the surface irregularities by remelting the material on the very top surface.
Therefore, after the up-facing skin parameters were optimized, the contour parameters, including contour scanning speed and contour offset, were studied. The three factors and five levels in the orthogonal test table (L25(53)) are provided in Table 3.

2.3. Surface Quality Characterization

The sample surface roughness was measured by the stylus contact method using a Mitutoyo Surftest SJ-310 surface profilometer according to the ISO 25178 standard. All the surface roughness data are the average of three experimental results and the length of each measured line was 12 mm. The cross-sectional planes were ground and polished for optical microscopy (OM, OLYMPUS GX53, Olympus Corporation, Tokyo, Japan). Scanning electron microscopy (SEM, OLYMPUS TMI4000, Olympus Corporation, Tokyo, Japan) was used to observe the surface morphology. A laser scanning confocal microscope (OLS4100, OLYMPUS, Tokyo, Japan) with a 3D-image-acquisition function was used for characterizing the areal surface texture. The measured area was 2 mm × 6 mm.

3. Results and Discussion

3.1. Optimization of Up-Facing Skin Parameter

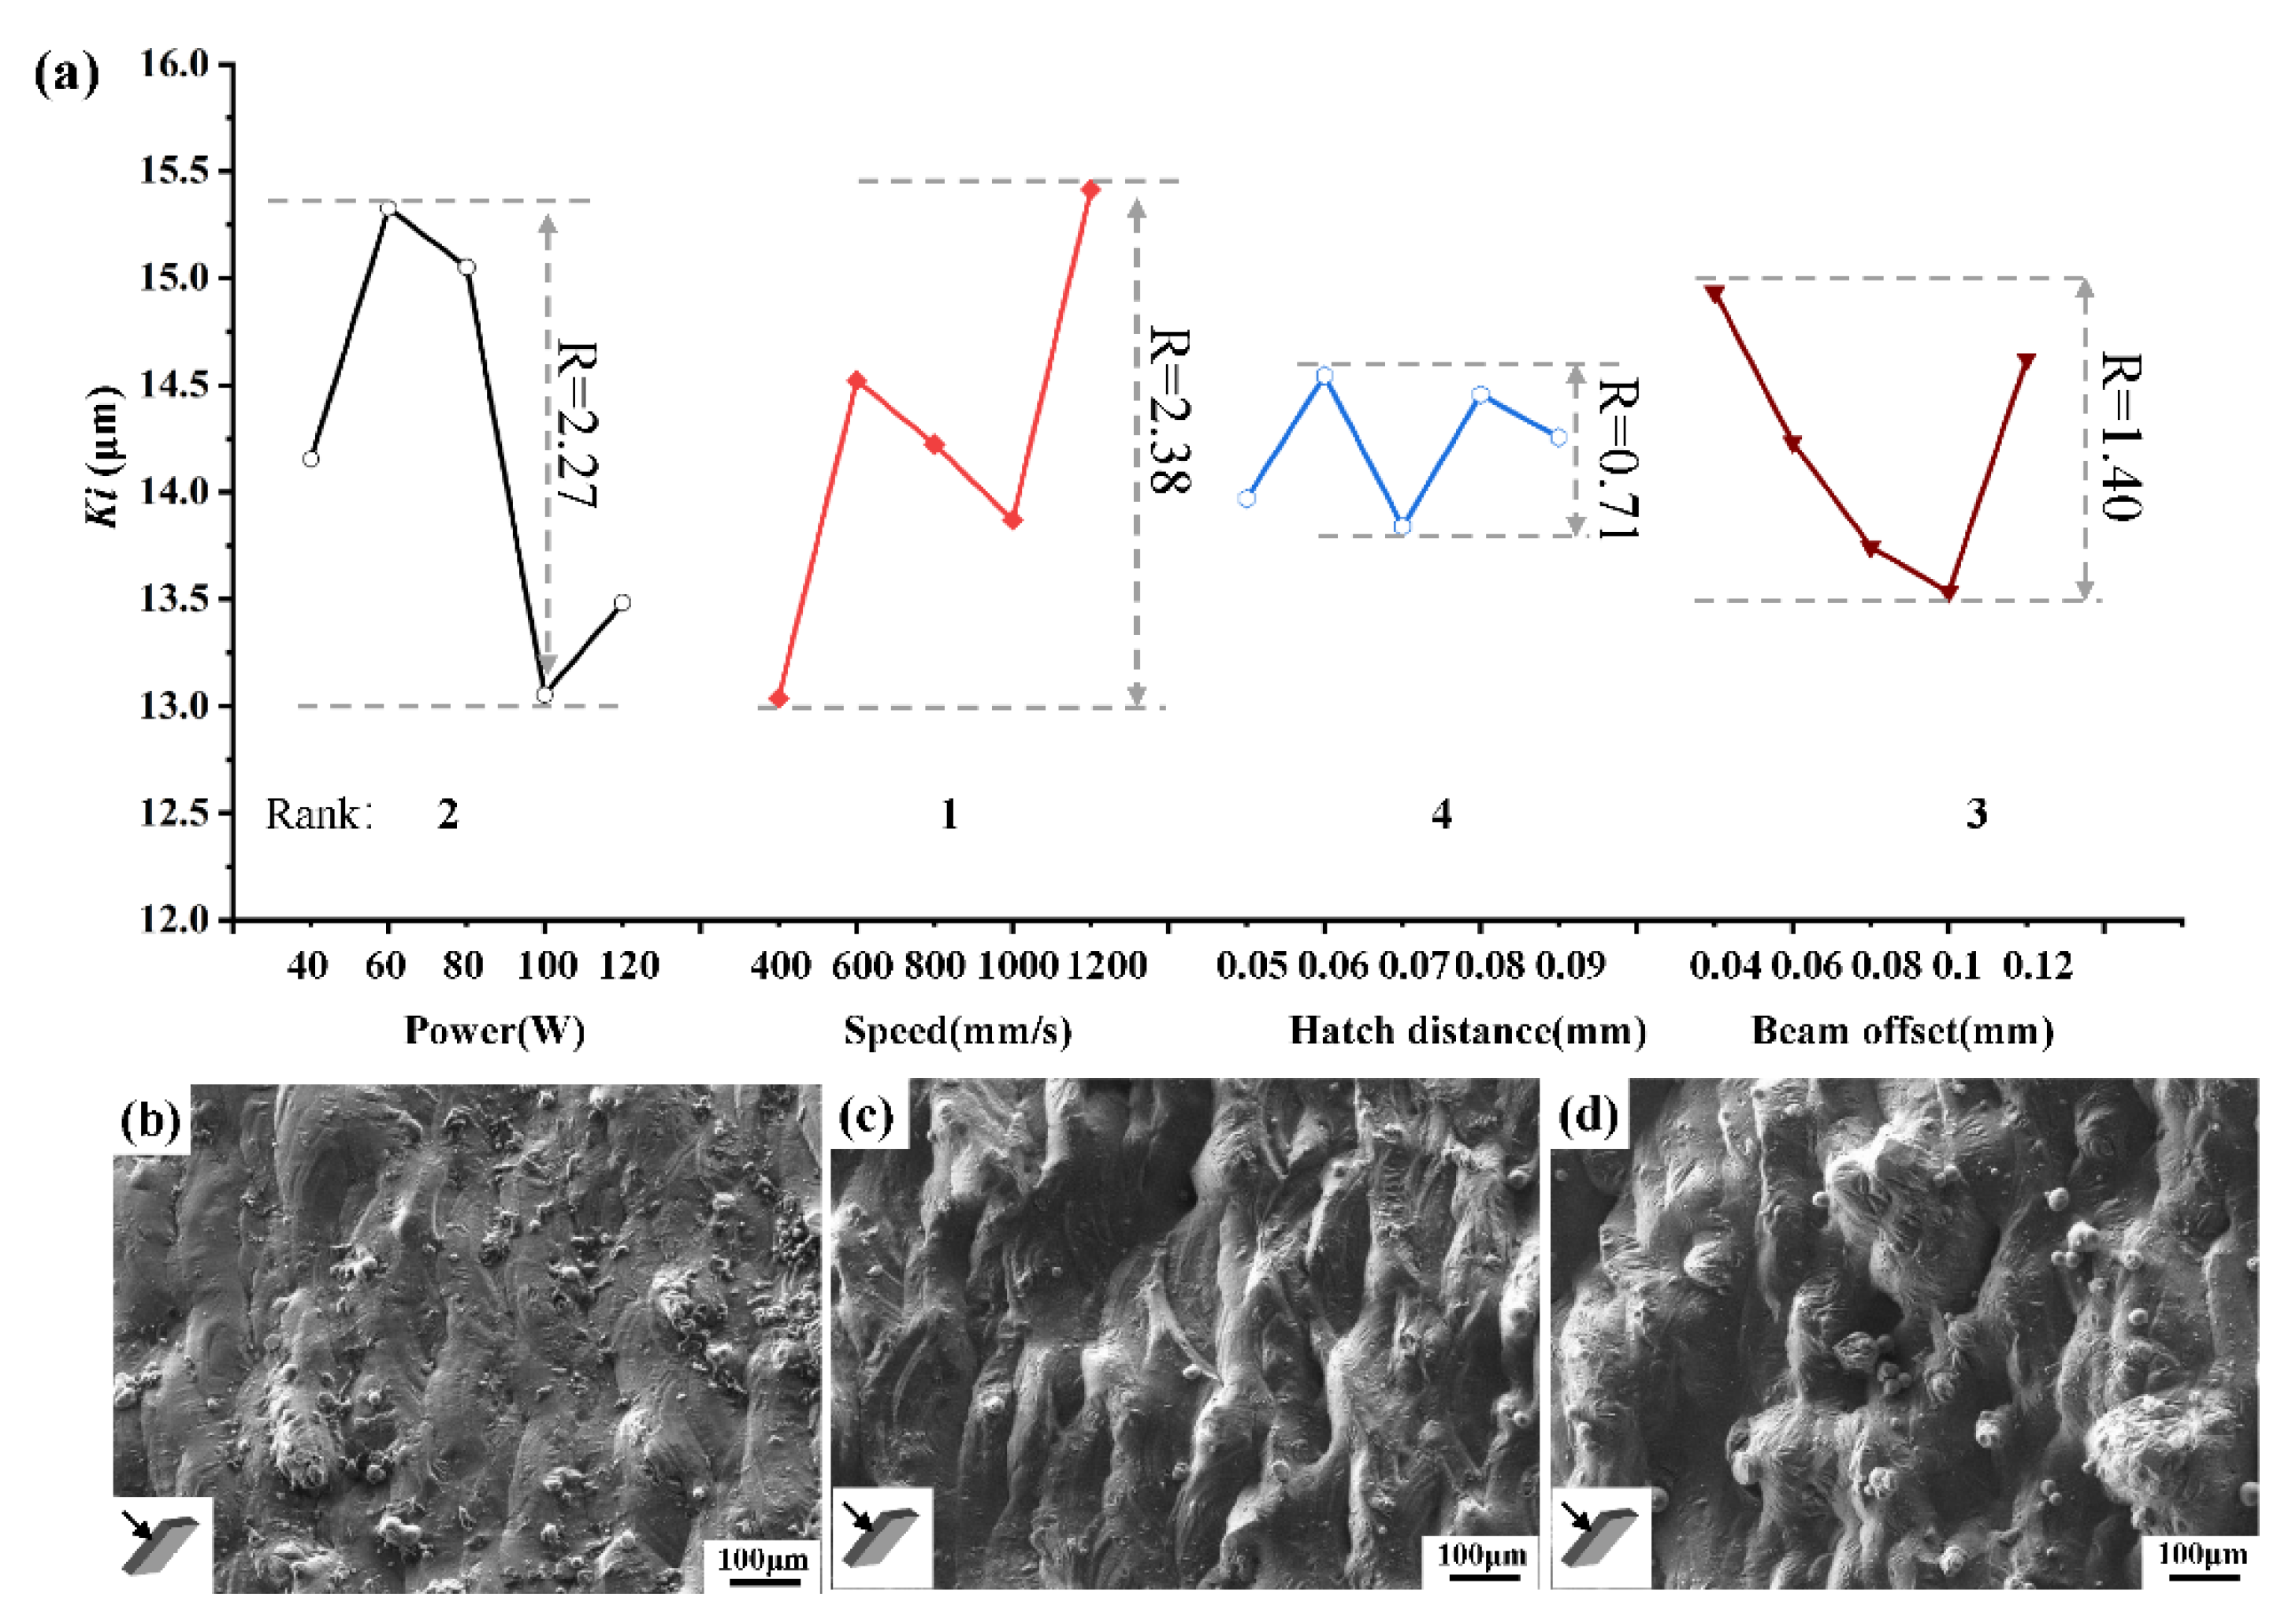
The parameters which differ from the core/infill parameters are applied on the inclined up-facing surface areas to obtain an improved surface quality. According to the orthogonal test table, 25 groups of LPBF AlSi10Mg samples were tested and the measured values of up-facing surface roughness are shown in Table 4. The range analysis and factor-level trend curves are shown in Table 5 and Figure 4a, respectively. The analysis shows that the scanning speed and laser power are the two most important factors that significantly affect the up-facing surface roughness, followed by hatch distance and beam offset. An increase in the scanning speed leads to a relatively high surface roughness, while higher laser power seems to decrease the roughness value. An Ra value lower than 12 μm is achieved only when the laser power is over 100 W. Therefore, high laser power and moderate scanning speed were adopted in the following optimization process.
The up-facing skin parameters were further optimized using DMD. According to the ranking order of the factors affecting surface roughness in the orthogonal test, laser power and scanning speed are set as coded factors B and C with seven levels, respectively. The beam offset is set as coded factor A with five levels, while hatch distance is set as coded factor D with three levels (Table 2). The number of central replicates is four to estimate the experimental variance. Therefore, the total number of experiments is 25 and the surface roughness result is provided in Table 6.
It can be seen from Table 6 and Figure 4b–d that surface finish is significantly reduced when using higher laser power and moderate scanning speed. The lowest surface roughness of 6.9 μm is obtained at a laser power of 193 W and scanning speed of 700 mm/s, which represents a 39.4% decrease compared with the optimized result from the orthogonal test (11.42 μm). According to Mumtaz et al. [9], the surface roughness Ra of LPBF parts could be reduced using a high laser power because the recoil pressure induced by the resultant higher laser energy input is able to flatten the melt pools and reduce ball formation. This is consistent with our results. Moreover, once the inclined surface is determined as an up-facing surface area (Figure 1c), specific parameters will be used. The stripe scanning strategy that is commonly used in the infill/core area will be suppressed to obtain a complete laser track rather than a partition track (Figure 5). By using higher laser power and an un-partition scanning strategy, the staircase effect can be eliminated to a large extent, thereby reducing the roughness.

3.2. Contour Parameter Optimization

Contour parameter optimization was conducted by applying the optimized up-facing skin parameters. According to the orthogonal test method, 25 combinations of contour parameters should be required, and the measured results of up-facing surface roughness are shown in Table 7. The experimental results are modeled by the Design-Expert program, and the fitting model is selected as the complete quadratic polynomial. Taking the interaction terms into account, the linear regression model with the surface roughness of an AlSi10Mg alloy as the response can be expressed by Equation (1):
Y = β 0 +   β i X i +   β i i X i i 2 +   β i j X i X j
where Y is the predicted response; Xi and Xj are the independent variables; and β0, βi, βii and βij are the regression coefficients for the intercept, linear and quadratic terms.
The regression model is obtained by analysis of variance (ANOVA) and test of significance. The threshold P value for statistical significance is set as 0.05. Table 8 shows the statistical significance of main effects ranking in the order of scanning speed (B), laser power (A) and beam offset (C). In addition, the interaction effects between the laser power and beam offset, scanning speed and beam offset are also significant. The p value of the A2 term is very large, while the BC term cannot be evaluated. To make the model more accurate, the insignificant terms A2 and BC were removed. Therefore, the resultant ANOVA table for response surface model is achieved after adjustment, as shown in Table 9. The statistics R2, adj R2 and pred R2 are also calculated to confirm the mathematical models.
Both an F-value of 72.61 and a p-value of <0.0001 imply that the model is highly significant in the range of experimentation. The high values of R2 (96.76%) and Adj. R2 (95.43%) indicate good agreement between the experimental data and the model. The high value of pred R2 (92.46%), which is close to R2 and Adj. R2, indicates a good prediction power of the model for new observations. Based on the ANOVA for response surface model, a new linear regression equation is obtained as shown in Equation (2):
Y = 2.98 + 0.1947A − 0.00317B − 236C + 0.000005A2 + 2364C2 − 0.000047AB − 1.
Figure 6a shows the distribution of residuals (difference between experimental value and prediction) with normal distribution superimposed. The 3D response surface plots of the surface roughness with respect to interaction factors such as laser power, scanning speed and beam offset are shown in Figure 6b–d. When the response surface of two factors is shown, the other two variables are held at their respective central level of testing ranges.
It is shown in Figure 6b that an individual increase in laser power or beam offset leads to an increase in surface roughness. However, surface roughness always decreases regardless of the change in these two factors, indicating a strong interaction between these laser power and beam offset. Figure 6c shows that low surface roughness is only obtained when lower laser power and lower scanning speed are used. Figure 6d demonstrates that there is no interaction between scanning speed and beam offset. A higher scanning speed leads to higher surface roughness regardless of the changes in beam offsets.
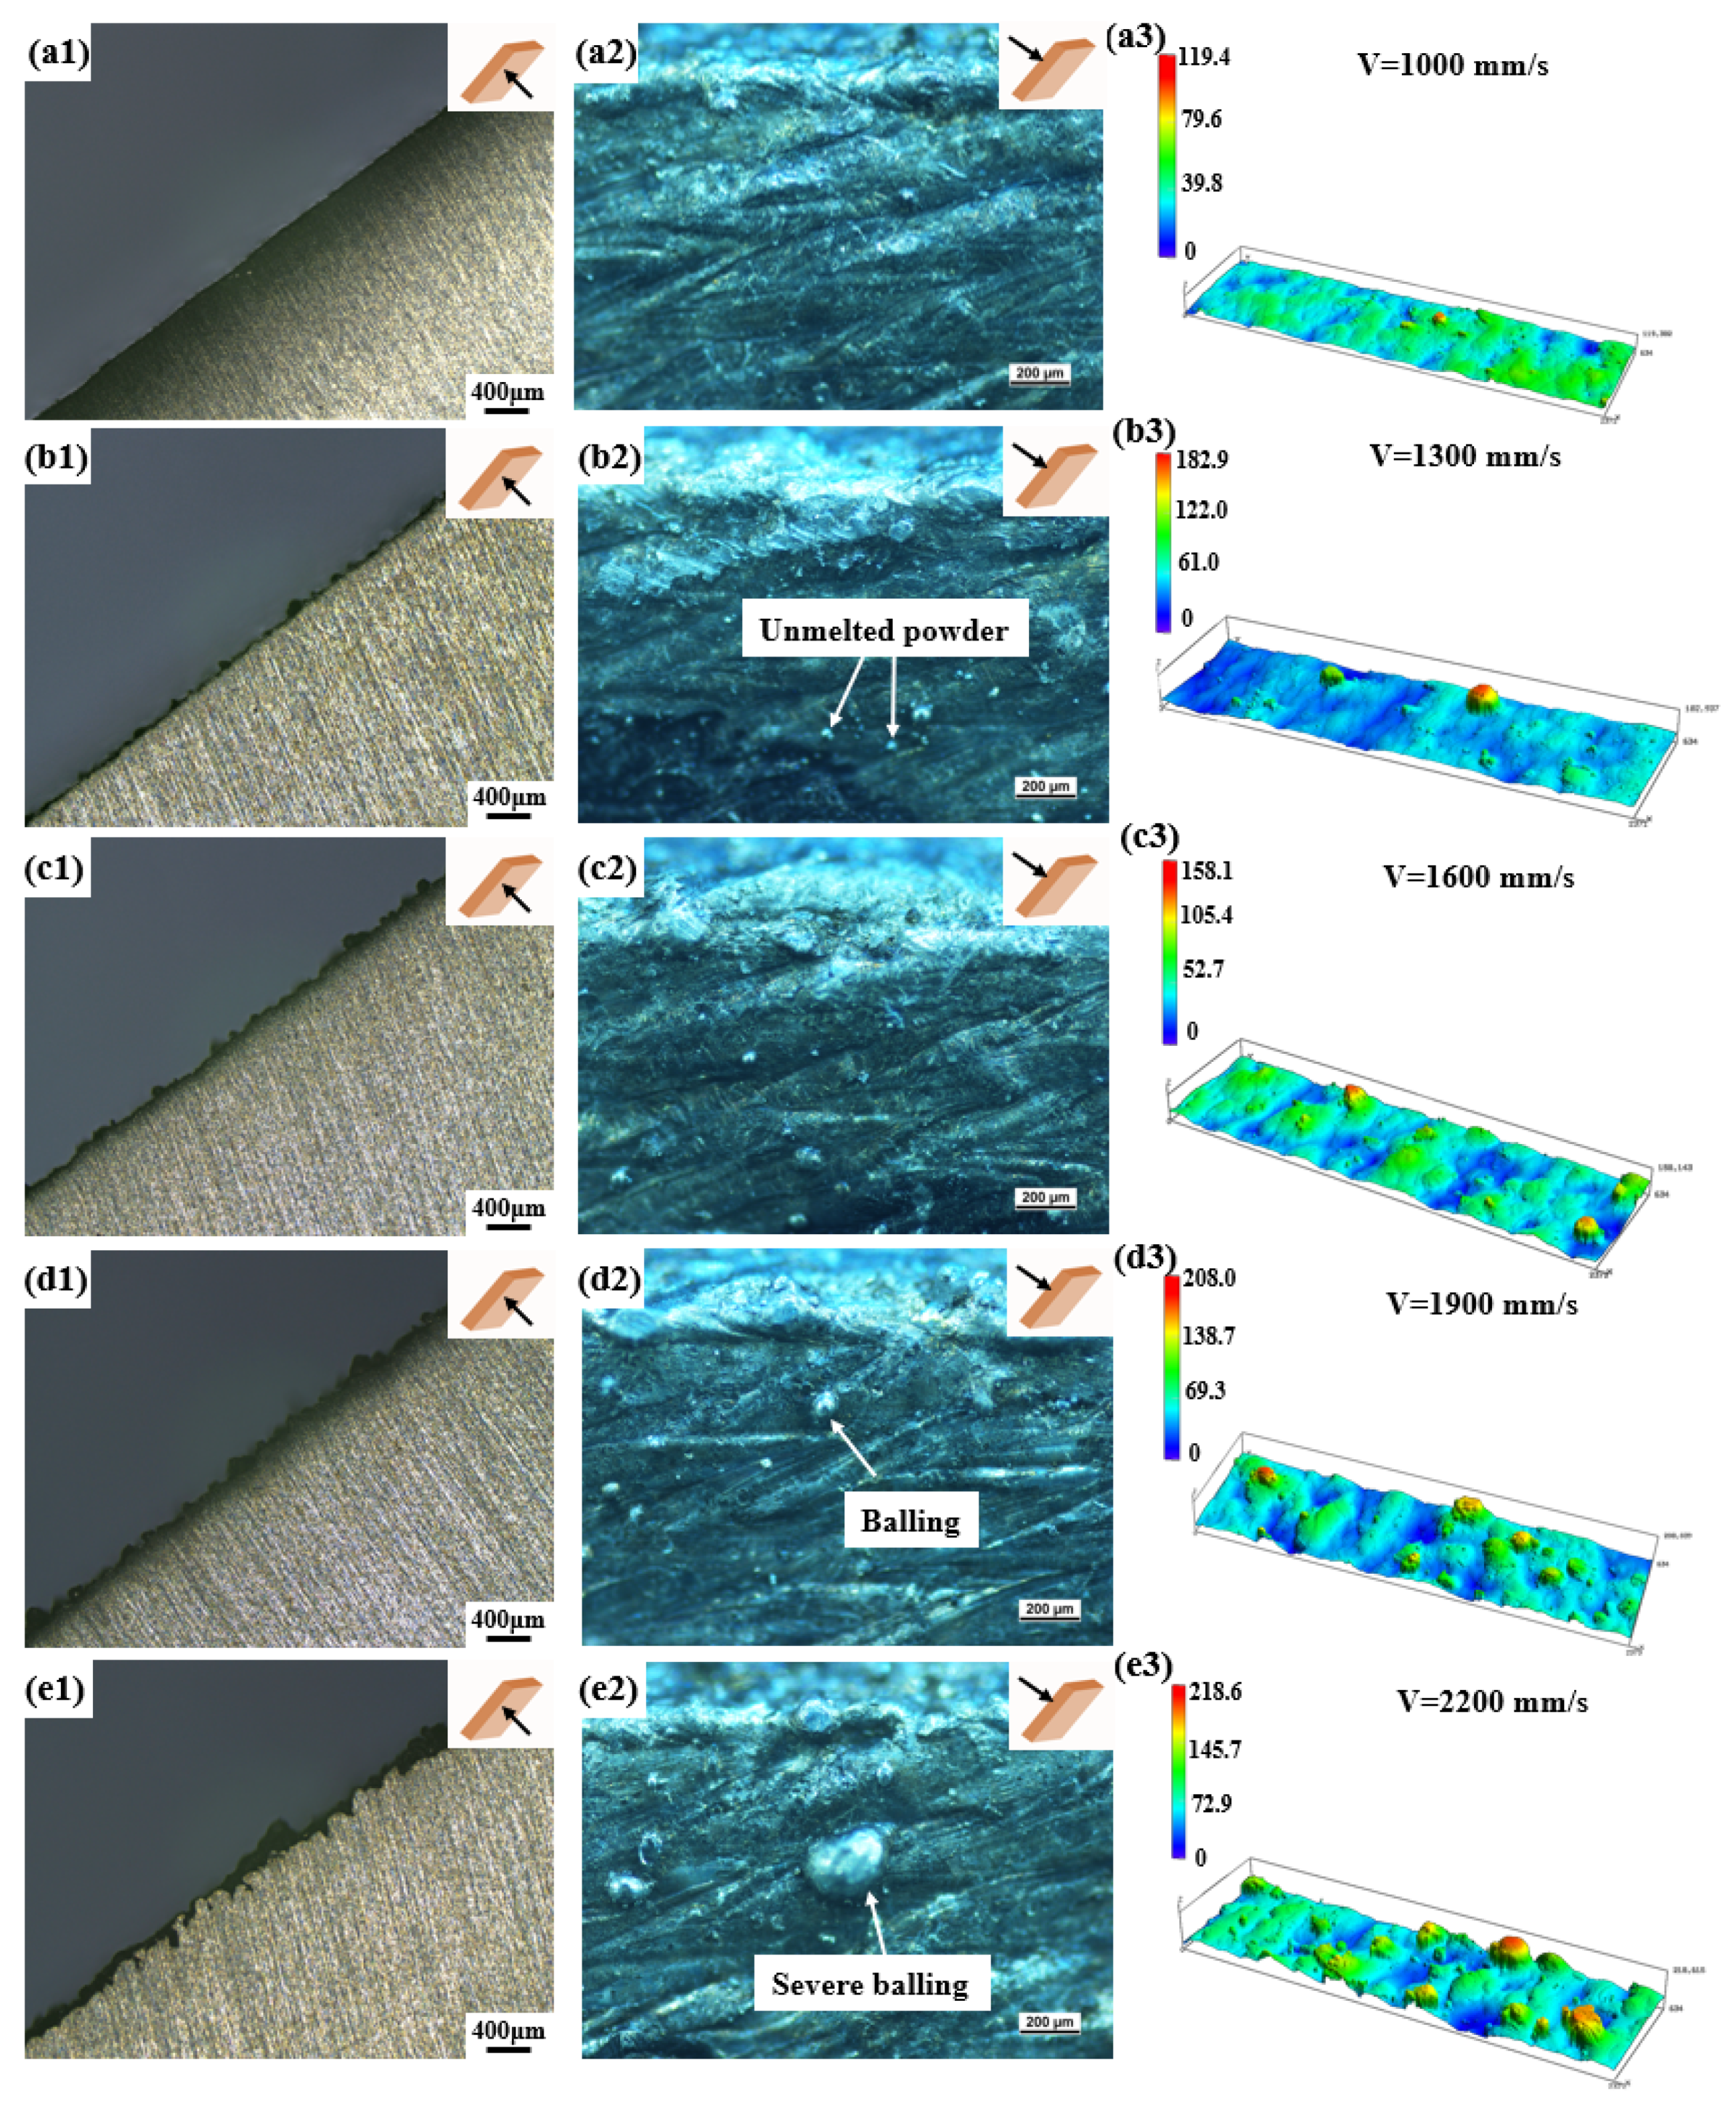
As shown in Figure 7, images from the side view of the up-facing surface indicate the fluctuation trend at the edge of each sample when keeping contour laser power constant (Figure 7a1–e1). A high contour scanning speed results in worse fluctuation, indicating a higher surface roughness. OM images from the front view of the up-facing surface (Figure 7a2–e2) and 3D surface morphologies (Figure 7a3–e3) confirm this conjecture. The higher the scanning speed, the worse the surface quality. Unmelted/semi-melted powder and balling can be observed with an increasing scanning speed. The decrease in energy density is a good explanation for this phenomenon, as lower laser energy density input results in insufficient melting at the edge of the part which is then incapable of eliminating the effect on edge irregularities and the staircase effect [31]. When the optimized contour parameters are used, the surface roughness Ra is significantly decreased to 5.49 μm, a 21% improvement compared to the 6.92 μm obtained when using up-facing skin parameters only.

4. Conclusions

This study investigates the effects of varying processing parameters, including up-facing parameters (laser power, scanning speed, hatch distance) and contour parameters (laser power, scanning speed, beam offset), on the resultant roughness of the inclined up-facing surfaces of an AlSi10Mg alloy. The combination of the orthogonal test and Doehlert matrix design test is used. The following conclusions can be drawn:
(1) The ranking order of the inclined up-facing skin parameters affecting the surface roughness is scanning speed > laser power > hatch distance > beam offset;
(2) By considering the ranking order of statistical significance obtained by the orthogonal test, the Doehlert matrix design test can efficiently optimize the parameters, achieving a lower Ra of 6.92 μm, and witnessing a further 39.4% decrease compared to the optimized result in the orthogonal test (11.42 μm);
(3) After applying the contour parameters and optimized up-facing parameters, the surface roughness is significantly reduced to Ra of 5.4 μm, which represents a 22% decrease compared to the optimized result without contour scan;
(4) The up-facing surface finish is improved by optimizing the parameters that mitigate the staircase effect and remove the laser partition tracks, and can be further improved by optimizing the contour parameters that reduce irregularities at the edges of the parts.

Author Contributions

Conceptualization, C.G. and H.T.; Methodology, C.G.; Investigation, C.G. and S.Z.; Resources, J.-H.R.; Data curation, Z.M.; Writing—original draft, C.G.; Writing—review & editing, J.-H.R.; Project administration, Y.B.; Funding acquisition, J.-H.R. All authors have read and agreed to the published version of the manuscript.

Funding

This work was supported by Jihua Laboratory “Development of additive manufactured core process and special equipment for key parts of aero-engines” under Grant (X190351TM190). The authors acknowledge the facilities, scientific and technical assistance of the Institute of Advanced Additive Manufacturing of Jihua Laboratory, Foshan Municipal Government and Guangdong Provincial Government. Chaofeng Gao acknowledges the Guangdong Basic and Applied Basic Research Foundation, China (No. 2022A1515011597).

Data Availability Statement

Not applicable.

Conflicts of Interest

The authors declare no conflict of interest.

References

  1. DebRoy, T.; Wei, H.L.; Zuback, J.S.; Mukherjee, T.; Elmer, J.W.; Milewski, J.O.; Beese, A.M.; Wilson-Heid, A.; De, A.; Zhang, W. Additive manufacturing of metallic components—Process, structure and properties. Prog. Mater Sci. 2018, 92, 112–224. [Google Scholar] [CrossRef]
  2. Gao, C.; Wu, W.; Shi, J.; Xiao, Z.; Akbarzadeh, A.H. Simultaneous Enhancement of Strength, Ductility, and Hardness of TiN/AlSi10Mg Nanocomposites via Selective Laser Melting. Addit. Manuf. 2020, 34, 101378. [Google Scholar] [CrossRef]
  3. Charles, A.; Elkaseer, A.; Thijs, L.; Hagenmeyer, V.; Scholz, S. Effect of Process Parameters on the Generated Surface Roughness of Down-Facing Surfaces in Selective Laser Melting. Appl. Sci. 2019, 9, 1256. [Google Scholar] [CrossRef] [Green Version]
  4. Wang, W.; Garmestani, H.; Liang, S.Y. Prediction of Upper Surface Roughness in Laser Powder Bed Fusion. Metals 2021, 12, 11. [Google Scholar] [CrossRef]
  5. Metelkova, J.; Vanmunster, L.; Haitjema, H.; Van Hooreweder, B. Texture of inclined up-facing surfaces in laser powder bed fusion of metals. Addit. Manuf. 2021, 42, 101970. [Google Scholar] [CrossRef]
  6. Cabanettes, F.; Joubert, A.; Chardon, G.; Dumas, V.; Rech, J.; Grosjean, C.; Dimkovski, Z. Topography of as built surfaces generated in metal additive manufacturing: A multi scale analysis from form to roughness. Precis. Eng. 2018, 52, 249–265. [Google Scholar] [CrossRef]
  7. Wang, D.; Liu, Y.; Yang, Y.; Xiao, D. Theoretical and experimental study on surface roughness of 316L stainless steel metal parts obtained through selective laser melting. Rapid. Prototyp. J. 2016, 22, 706–716. [Google Scholar] [CrossRef]
  8. Strano, G.; Hao, L.; Everson, R.M.; Evans, K.E. Surface roughness analysis, modelling and prediction in selective laser melting. J. Mater. Process. Technol. 2013, 213, 589–597. [Google Scholar] [CrossRef]
  9. Mumtaz, K.; Hopkinson, N. Top surface and side roughness of Inconel 625 parts processed using selective laser melting. Rapid. Prototyp. J. 2009, 15, 96–103. [Google Scholar] [CrossRef]
  10. Yan, X.; Gao, S.; Chang, C.; Huang, J.; Khanlari, K.; Dong, D.; Ma, W.; Fenineche, N.; Liao, H.; Liu, M. Effect of building directions on the surface roughness, microstructure, and tribological properties of selective laser melted Inconel 625. J. Mater. Process. Technol. 2021, 288, 116878. [Google Scholar] [CrossRef]
  11. Alghamdi, A.; Downing, D.; McMillan, M.; Brandt, M.; Qian, M.; Leary, M. Experimental and numerical assessment of surface roughness for Ti6Al4V lattice elements in selective laser melting. Int. J. Adv. Manuf. Technol. 2019, 105, 1275–1293. [Google Scholar] [CrossRef]
  12. Sadali, M.F.; Hassan, M.Z.; Ahmad, F.; Yahaya, H.; Rasid, Z.A. Influence of selective laser melting scanning speed parameter on the surface morphology, surface roughness, and micropores for manufactured Ti6Al4V parts. J. Mater. Res. 2020, 35, 2025–2035. [Google Scholar] [CrossRef]
  13. Vayssette, B.; Saintier, N.; Brugger, C.; Elmay, M.; Pessard, E. Surface roughness of Ti-6Al-4V parts obtained by SLM and EBM: Effect on the High Cycle Fatigue life. Procedia Eng. 2018, 213, 89–97. [Google Scholar] [CrossRef]
  14. Vayssette, B.; Saintier, N.; Brugger, C.; El May, M. Surface roughness effect of SLM and EBM Ti-6Al-4V on multiaxial high cycle fatigue. Theor. Appl. Fract. Mech. 2020, 108, 102581. [Google Scholar] [CrossRef]
  15. Yang, X.; Wang, F.H.; Wang, W.L.; Liu, S.F.; Chen, Y.Q.; Tang, H.P. Comparison of two-step surface treatment on surface roughness and corrosion resistance of TC4 alloy parts prepared by SLM and SEBM. J. Alloys Compd. 2022, 921, 165929. [Google Scholar] [CrossRef]
  16. Tian, Y.; Tomus, D.; Rometsch, P.; Wu, X. Influences of processing parameters on surface roughness of Hastelloy X produced by selective laser melting. Addit. Manuf. 2017, 13, 103–112. [Google Scholar] [CrossRef]
  17. Koutiri, I.; Pessard, E.; Peyre, P.; Amlou, O.; De Terris, T. Influence of SLM process parameters on the surface finish, porosity rate and fatigue behavior of as-built Inconel 625 parts. J. Mater. Process. Technol. 2018, 255, 536–546. [Google Scholar] [CrossRef]
  18. Boschetto, A.; Bottini, L.; Veniali, F. Roughness modeling of AlSi10Mg parts fabricated by selective laser melting. J. Mater. Process. Technol. 2017, 241, 154–163. [Google Scholar] [CrossRef]
  19. Hu, Z.; Qi, Y.; Nagarajan, B.; Nie, X.; Zhang, H.; Zhu, H.; Zeng, X. Top surface roughness evolution during selective laser melting of AlCu5MnCdVA aluminum alloy. J. Manuf. Process. 2021, 64, 1180–1195. [Google Scholar] [CrossRef]
  20. Masiagutova, E.; Cabanettes, F.; Sova, A.; Cici, M.; Bidron, G.; Bertrand, P. Side surface topography generation during laser powder bed fusion of AlSi10Mg. Addit. Manuf. 2021, 47, 102230. [Google Scholar] [CrossRef]
  21. Leon, A.; Aghion, E. Effect of surface roughness on corrosion fatigue performance of AlSi10Mg alloy produced by Selective Laser Melting (SLM). Mater. Charact. 2017, 131, 188–194. [Google Scholar] [CrossRef]
  22. Dai, D.; Gu, D. Tailoring surface quality through mass and momentum transfer modeling using a volume of fluid method in selective laser melting of TiC/AlSi10Mg powder. Int. J. Mach. Tools Manuf. 2015, 88, 95–107. [Google Scholar] [CrossRef]
  23. Yadroitsev, I.; Krakhmalev, P.; Yadroitsava, I. Hierarchical design principles of selective laser melting for high quality metallic objects. Addit. Manuf. 2015, 7, 45–56. [Google Scholar] [CrossRef]
  24. Jamshidinia, M.; Kovacevic, R. The influence of heat accumulation on the surface roughness in powder-bed additive manufacturing. Surf. Topogr. Metrol. Prop. 2015, 3, 14003. [Google Scholar] [CrossRef]
  25. Newton, L.; Senin, N.; Chatzivagiannis, E.; Smith, B.; Leach, R. Feature-based characterisation of Ti6Al4V electron beam powder bed fusion surfaces fabricated at different surface orientations. Addit. Manuf. 2020, 35, 101273. [Google Scholar] [CrossRef]
  26. Chen, Z.; Wu, X.; Tomus, D.; Davies, C.H.J. Surface roughness of Selective Laser Melted Ti-6Al-4V alloy components. Addit. Manuf. 2018, 21, 91–103. [Google Scholar] [CrossRef]
  27. Ferreira, S.L.; Dos Santos, W.N.; Quintella, C.M.; Neto, B.B.; Bosque-Sendra, J.M. Doehlert matrix: A chemometric tool for analytical chemistry-review. Talanta 2004, 63, 1061–1067. [Google Scholar] [CrossRef]
  28. Balaji, U.; Pradhan, S.K. Titanium anodisation designed for surface colouration—Systemisation of parametric interaction using response surface methodology. Mater. Des. 2018, 139, 409–418. [Google Scholar] [CrossRef]
  29. Doehlert, D.H. Uniform Shell Designs. Appl. Stat. 1970, 19, 231–239. [Google Scholar] [CrossRef]
  30. Calignano, F.; Manfredi, D.; Ambrosio, E.P.; Iuliano, L.; Fino, P. Influence of process parameters on surface roughness of aluminum parts produced by DMLS. Int. J. Adv. Manuf. Technol. 2012, 67, 2743–2751. [Google Scholar] [CrossRef]
  31. Li, J.; Hu, J.; Zhu, Y.; Yu, X.; Yu, M.; Yang, H. Surface roughness control of root analogue dental implants fabricated using selective laser melting. Addit. Manuf. 2020, 34, 101283. [Google Scholar] [CrossRef]
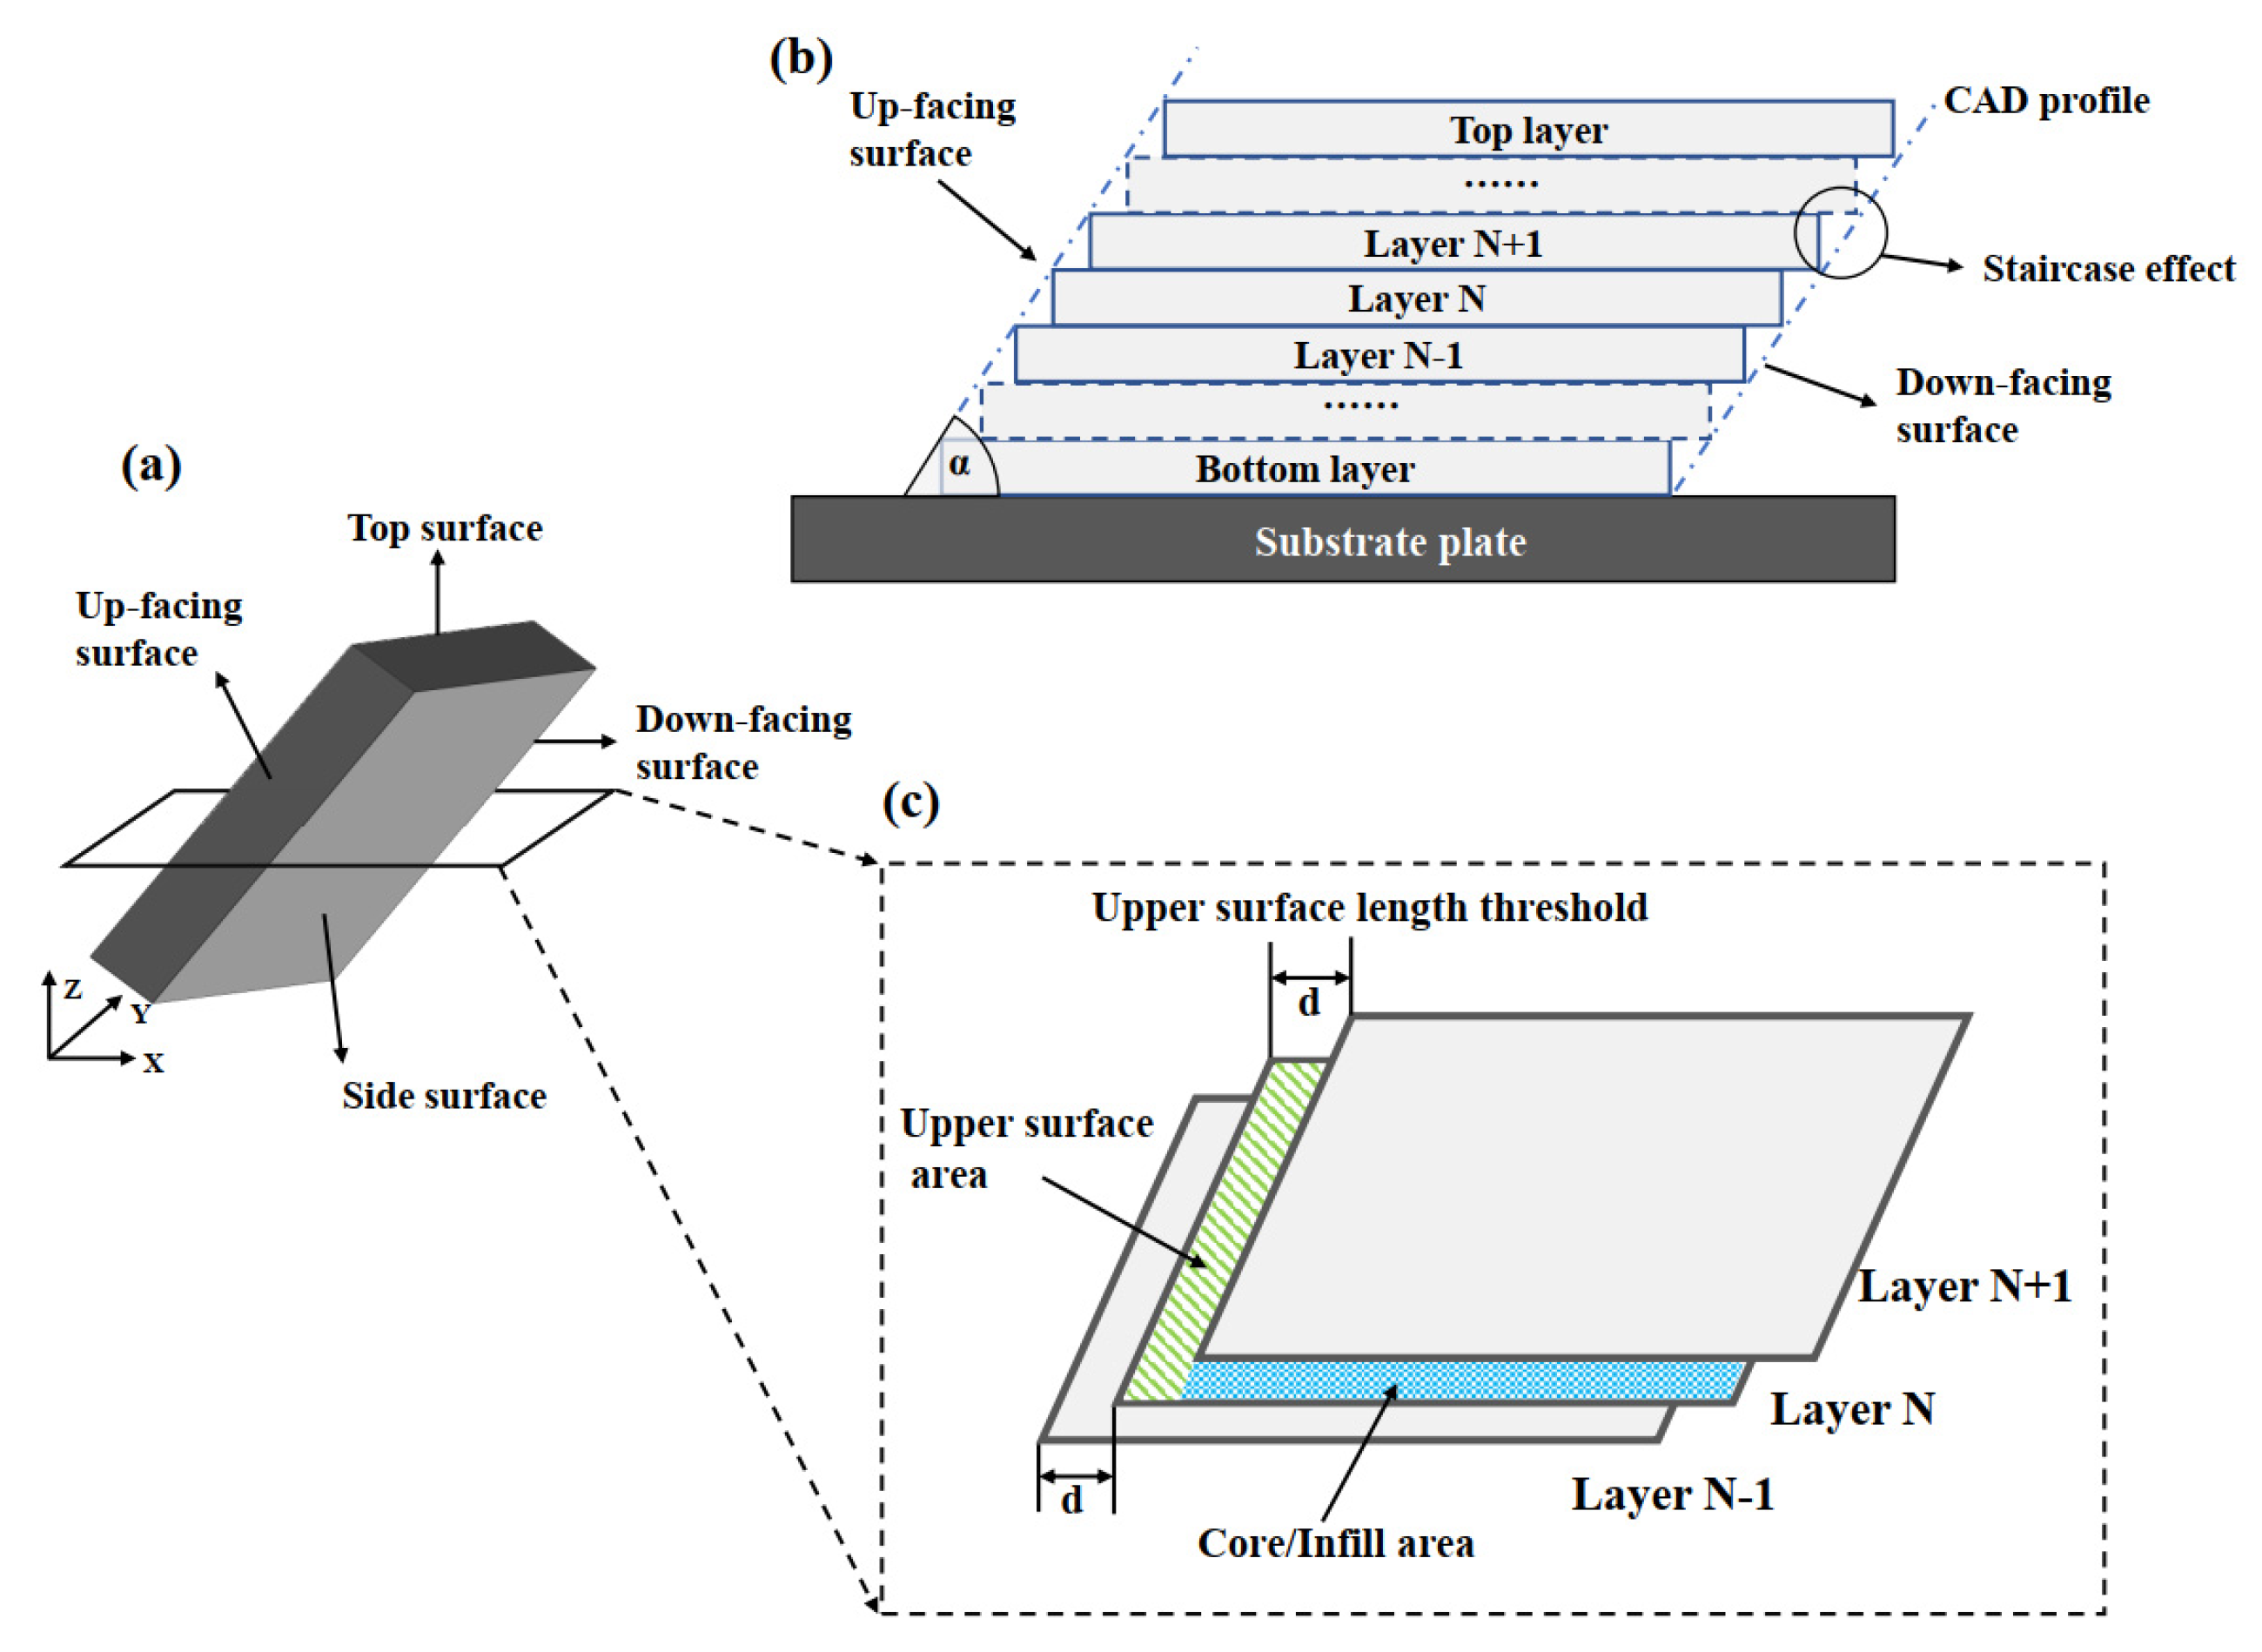
Figure 1. Schematic figure of (a) typical faces of LPBF sample, (b) staircase effect in LPBF process, and (c) the definition of up-facing skin as indicated by green line infill, for layer N.
Metals 12 02053 g001
Figure 2. (a)The as-designed LPBF–AlSi10Mg samples and (b) the as-built AlSi10Mg samples.
Metals 12 02053 g002
Figure 3. Schematic diagram of the contour scan strategy: (a,c) without contour, (b,d) with contour.
Metals 12 02053 g003
Figure 4. (a)The factor-level trend curve of the up-facing surface roughness by range analysis. SEM images of inclined up-facing surface of LPBF parts using Doehlert design (Table 6): (b) No.3 (Ra = 6.92 μm), (c) No.14 (Ra = 9.15 μm), (d) No.20 (Ra = 12.78 μm).
Metals 12 02053 g004
Figure 5. Schematic figure of stripe scanning strategy.
Metals 12 02053 g005
Figure 6. (a) Probability distribution of residuals. Response surface showing the effect of the variables on surface roughness: (b) Laser power and beam offset, (c) Laser power and scanning speed, (d) Scanning speed and beam offset.
Metals 12 02053 g006
Figure 7. Optical microscopies and 3D surface morphologies with different contour scanning speeds (laser power ~100 W, beam offset ~0.07 mm): (a1a3) V = 1000 mm/s, (b1b3) V = 1300 mm/s, (c1c3) V = 1600 mm/s, (d1d3) V = 1900 mm/s, (e1e3) V = 2200 mm/s (inset pictures show the observation orientation).
Metals 12 02053 g007
Table 1. Factor levels of L25(54) orthogonal test.
FactorsLevels
(Up-facing) laser power (W)406080100120
(Up-facing) scanning speed (mm/s)40060080010001200
(Up-facing) hatch distance (mm)0.050.060.070.080.09
(Up-facing) beam offset (mm)0.040.060.080.10.12
Table 2. Independent factors and their coded levels in the Doehlert matrix design.
Independent FactorsCoded levels
Factor A coded−1−0.500.51--
Factor B coded−0.866−0.577−0.28900.2890.5770.866
Factor C coded−0.817−0.613−0.20400.2040.6130.817
Factor D coded−0.79100.791----
Table 3. Factor levels of L25(53) orthogonal test.
Factors ContourLevels
(Contour) laser power (W)100120140160180
(Contour) scanning speed (mm/s)10001300160019002200
(Contour) beam offset (mm)0.070.080.090.10.11
Table 4. L25(54) orthogonal test and experimental results of up-facing skin roughness.
RunFactors: Up-Facing Skin ParametersResults
Power
(W)
Scanning Speed (mm/s)Hatch Distance (mm)Beam Offset
(mm)
Surface Roughness (Ra, μm)
1404000.050.0413.25
2406000.060.0613.60
3408000.070.0814.73
44010000.080.1013.86
54012000.090.1215.34
6604000.060.0813.82
7606000.070.1014.26
8608000.080.1216.26
96010000.090.0415.71
106012000.050.0616.57
11804000.070.1213.86
12806000.080.0415.92
13808000.090.0615.69
148010000.050.0814.16
158012000.060.1015.63
161004000.080.0611.75
171006000.090.0812.65
181008000.050.1011.42
1910010000.060.1213.80
2010012000.070.0415.65
211204000.090.1012.51
221206000.050.1214.45
231208000.060.0414.14
2412010000.070.0611.82
2512012000.080.0814.49
Table 5. Range analysis results of orthogonal test for up-facing skin roughness.
KFactor: Up-Facing Skin Parameters
Power
(W)
Scanning Speed (mm/s)Hatch Distance (mm)Beam Offset
(mm)
k114.1513.0413.9714.93
k215.3314.5214.5514.23
k315.0514.2213.8413.74
k413.0513.8714.4613.53
k513.4815.4114.2614.62
R = max(ki) − min(ki)2.272.380.711.40
Order of factors2143
Table 6. The Doehlert matrix and experimental results of up-facing surface roughness.
RunCoded LevelsUncoded Level: Up-Facing ParametersResults
ABCDHatch
Distance
(mm)
Laser
Power
(W)
Scanning
Speed
(mm/s)
Beam
Offset
(mm)
Surface
Roughness
(Ra, μm)
100000.071507000.089.41
210000.091507000.089.09
30.50.866000.081937000.086.92
40.50.2890.81700.081649450.089.33
50.50.2890.2040.7910.081647610.119.51
6−10000.051507000.0810.85
7−0.5−0.866000.061077000.0812.70
8−0.5−0.289−0.81700.061364550.0810.48
9−0.5−0.289−0.204−0.7910.061366390.0511.28
100.5−0.866000.081077000.0812.69
110.5−0.289−0.81700.081364550.0811.02
120.5−0.289−0.204−0.7910.081366390.0512.28
13−0.50.866000.061937000.087.84
1400.577−0.81700.071794550.089.15
1500.577−0.204−0.7910.071796390.059.46
16−0.50.2890.81700.061649450.0810.02
170−0.5770.81700.071219450.0812.03
18000.613−0.7910.071508840.0511.13
19−0.50.2890.2040.7910.061647610.1110.13
200−0.5770.2040.7910.071217610.1112.78
2100−0.6130.7910.071505160.1110.46
2200000.071507000.0810.71
2300000.071507000.0810.31
2400000.071507000.0810.17
2500000.071507000.0810.75
Table 7. L25(53) orthogonal test and experimental results of surface roughness with contour scans applied.
HeadingsFactors: Contour ParametersResults
Power
(W)
Scanning Speed (mm/s)Beam Offset
(mm)
Surface Roughness (Ra, μm)
110010000.075.49
210013000.085.82
310016000.098.18
410019000.112.20
510022000.1116.77
612010000.086.22
712013000.096.48
812016000.17.10
912019000.1117.52
1012022000.0714.55
1114010000.097.51
1214013000.17.92
1314016000.119.80
1414019000.0711.26
1514022000.0812.98
1616010000.16.91
1716013000.119.03
1816016000.079.25
1916019000.0810.43
2016022000.0912.92
2118010000.117.53
2218013000.079.47
2318016000.089.91
2418019000.0910.53
2518022000.111.78
Table 8. The p-value of each coefficient in regression model for contour parameters.
SourceABCABACBCA2B2C2
p-value0.4530.0000.4620.0050.008/0.8180.0000.015
Table 9. Analysis of variance for response surface model.
SourceDegrees of
Freedom
Sum of
Squares
Mean
Square
F Valuep ValueHeading
Model7188.6526.9572.610.000Significant
A-Laser power10.2330.2330.630.440
B-Scanning speed1107.32107.32289.120.000
C-Beam offset10.2230.2230.600.449
B219.4889.48825.560.000
C212.9332.9337.900.012
AB14.0924.09211.020.004
AC13.5423.5429.540.007
Error176.3100.371
Total24194.96
R2 = 96.76%, Adj. R2 = 95.43%, Pred R2 = 92.46%.
Publisher’s Note: MDPI stays neutral with regard to jurisdictional claims in published maps and institutional affiliations.