Article

Mechanical Wave Propagation in Solidifying Al-Cu-Mn-Ti Alloy and Its Effect on Solidification Feeding

School of Materials Science and Engineering, Harbin Institute of Technology, Harbin 150001, China
*
Author to whom correspondence should be addressed.
Metals 2022, 12(12), 2001; https://doi.org/10.3390/met12122001
Submission received: 20 October 2022 / Revised: 16 November 2022 / Accepted: 19 November 2022 / Published: 22 November 2022

Abstract

:
The wave field in solidifying metals is the theoretical basis for analyzing the effects of mechanical vibration on solidification, but there is little research on this topic. This study investigated the wave field and its effect on the solidification feeding in the low-pressure sand casting (LPSC) of Al-Cu-Mn-Ti alloy through experimental and numerical investigation. The solidification temperature field was simulated by AnycastingTM, and the wave field was simulated by the self-developed wave propagation software. The shrinkage defect detection showed that applying vibration had a greater promotional effect on feeding than increasing the holding pressure. The predicted defects under vibration coincided with the detections. The displacement field showed that the casting vibrated harmonically with an inhomogeneous amplitude distribution under the continuous harmonic vibration excitation, and the vibration energy was mainly concentrated in the feeding channel. With solidification, the u x amplitude reduced rapidly after the overlapping of dendrites, finally reducing slowly to a certain level; the u y amplitude reduced dramatically after the occurrence of a quasi-solid phase, finally reducing slowly to near zero. Mechanical vibration produced a severe shear deformation in the quasi-liquid phase—especially in the lower feeding channel—reducing the grain size to promote mass feeding. The feeding pressure and feeding gap were changed periodically under vibration, causing the vibration-promoting interdendritic feeding rate to fluctuate and eventually stabilize at about 13.4%. The mechanical vibration can increase the feeding pressure difference and change the blockage structure simultaneously, increasing the formation probability of burst feeding.

1. Introduction

Al-Cu-Mn-Ti alloy is widely used in industry due to its excellent mechanical properties [1]. However, the typical paste solidification characteristics of the alloy lead to shrinkage defects in castings [2], limiting its application. To reduce the shrinkage defects in the alloy, low-pressure casting is the most common method of casting, but the defects are not eliminated [3,4]. Therefore, we introduced mechanical vibration in low-pressure sand casting (LPSC) to improve the solidification feeding.
Scholars ascribe the change in feeding caused by vibration to a variety of factors. Some researchers consider that mechanical vibrations can promote the crystal nuclei that are generated on the mold wall and upper surface after casting [5,6], reduce the growth rate of dendrites [7], increase the cooling rate [8], and promote forced convection to melt the dendrites [9,10], eventually leading to grain refinement. The refined grains are more easily fed into the casting [11], thereby reducing shrinkage defects. Some researchers have concluded that mechanical vibrations can discharge the gas in the molten metal to reduce the resistance of feeding. Pîrvulescu et al. [12] found that mechanical vibration promotes the discharge of gas in molten aluminum, transforming micropores into a concentrated shrinkage cavity. Zhao et al. [13] also posited that vibration applied in the lost-foam casting of A356 alloy is conducive to the diffusion of hydrogen, reducing the shrinkage holes and the pinhole ratio in the section. Some researchers explain the mechanism of action of vibration on feeding from a microscopic perspective. Through a hydraulic simulation of seepage with vibration, Chen et al. [14] found that vibrations changed the blockage structure in the throat of the feeding channel to influence interdendritic feeding. Tian et al. [15] considered that in the lost-foam casting of magnesium alloy, if the excitation force is too large, the strong relative motion between the liquid and dendrites has an effect on feeding.
The above explanations of feeding by vibration are mainly concluded from the gravity casting with mold oscillation. They are mainly conclusions based on the results of casting rather than quantitative analyses of the feeding process, because these studies do not take into account the distribution of stress and displacement in the casting with vibration, which is the fundamental reason for solidification feeding.
Mechanical vibrations, exerting time-varying forces on the surface of molten metal, transmit mechanical power to the internal melt in the form of waves that refract and reflect ceaselessly to form a complex wave field in the casting, thereby affecting the solidification feeding [16,17]. To date, most studies have concentrated on the relationships between vibration parameters and solidification microstructures and defects [18], but comparatively few have focused on the propagation laws of mechanical waves and the interactions between waves and melts, which are the theoretical bases of the effect mechanism of vibrations on solidification feeding. Due to intrinsic properties such as the high temperature and opaque state of molten metal, it is impossible to observe the wave field in the casting, so numerical simulation is the main means to analyze the propagation of the wave [19].
During solidification, the molten metal generally quickly changes from the liquid phase to the solid phase, resulting in an uneven solidification temperature field. Therefore, the melt is a complex, non-uniform, viscoelastic medium with variable temperature and structure [16]. It is very difficult to calculate the wave propagation in this complex medium. Hence, most researchers simplify this medium to a Newtonian fluid, which is suitable for the high-temperature liquid or quasi-liquid metal by reducing the accuracy requirements. With this simplification, Kong et al. [20] simulated the acoustic streaming generated by ultrasonic power in liquid steel with ANSYS FLUENT. Feng et al. [21] calculated the sound field and the acoustic streaming in molten magnesium alloy using the finite element method. Chen et al. [22] explored the acoustic streaming induced by ultrasonic noise during direct chill casting of AZ80 magnesium alloy using COMSOL Multiphysics. However, the simplified model is not suitable for the calculation in the solid–liquid melt, where the strength varies greatly with temperature. Therefore, in our previous work, we developed wave equations by coupling the unsteady temperature field and the integral Hooke–Kelvin (H–K) model during solidification, and we solved them via a staggered-grid high-order difference method, which could simulate the wave propagation throughout the whole solidification process [23].
Therefore, based on the self-developed wave propagation simulation software, we calculated the wave field formed by mechanical vibration in the low-pressure sand casting (LPSC) of Al-Cu-Mn-Ti alloy, studied its propagation and evolution laws, and analyzed the mechanism of action of mechanical vibrations on the solidification feeding.

2. Experimental Process

2.1. Chemical Analysis of the Alloy

The chemical composition of the Al-Cu-Mn-Ti alloy was analyzed using an optical emission spectrometer and is presented in Table 1. Moreover, the liquidus and solidus temperatures were determined to be 658 °C and 542 °C by differential scanning calorimetry, respectively.

2.2. Casting Setup

The casting process followed the standard low-pressure casting procedure [24], but with different control parameters. To compare the effects of the holding pressure and vibration on the solidification feeding, the holding pressure of samples 2 and 3 was 40 kPa, which was twice that of sample 1, but only sample 3 was subjected to a 24 Hz sinusoidal vibration. The vibration was introduced by a 10 mm diameter 45# steel rod, whose surface was coated with a graphite paint, at the feeding channel after 40 s of filling, as shown in Figure 1. The temperature at the center of the casting and the feeding channel was monitored by two sheathed K-type thermocouples of 2 mm diameter. The acceleration and displacement amplitude on the facial mold opposite the vibration source before pressure relief were 11.5 m/s2 and 0.427 mm, respectively, as measured by a high-precision vibrometer.

2.3. Characterizations of Castings

After casting, the samples were first divided into two halves—named A and B—along the plane determined by the central axis and the vibration source. Then, the defects of both halves were detected using an XYD-160/3 non-destructive X-ray detection machine, and the X-ray diagrams were used to analyze the distribution and size of the shrinkage defects. Finally, the metallographic samples cut out from the center of the feeding channel—after polishing, etching, cleaning, and drying—were observed using an Olympus-GX71 optical microscope.

3. Numerical Model and Process

3.1. Wave Equations

Coupling the unsteady solidification temperature field and a unified integral rheological model, which unifies the rheological models in different temperature ranges by modifying the parameters of the viscoelastic H–K model, considering the thermomechanical coupling effects and simplifying them by introducing memory factors, the wave equations for metal solidification were established [23]:
ρ v ˙ i ( t ) = σ i j , j ( t ) + f i ( t )
σ ˙ i j ( t ) = δ i j [ K ( 0 ) 2 3 μ ( 0 ) ] v k , k ( t ) + μ ( 0 ) [ v i , j ( t ) + v j , i ( t ) ] δ i j γ K ( 0 ) θ ˙ ( t ) + δ i j [ r K ( t ) γ r θ ( t ) ] + r μ i j ( t )
θ ˙ ( t ) = k ρ C e θ , k k ( t ) γ T 0 ρ C e [ K ( 0 ) v k , k ( t ) + r K ( t ) ]
where the Latin subscripts i ,   j ,   k = { x ,   y ,   z } denote the vector components; v i and σ i j are the velocity tensor and the stress tensor, respectively; θ is the temperature difference caused by deformation; r θ , r K and r μ i j are the memory factors introduced by thermomechanical coupling and by viscoelasticity, respectively; f i denotes the volume force per unit mass; δ i j = 1 if i = j and zero otherwise, denoting the Kronecker delta; and ⸱ denotes the time derivative operator.
The memory factors satisfy the following differential equations:
r ˙ K ( t ) = K ˙ ( 0 ) v k , k ( t ) 1 τ K r K ( t )
r ˙ θ ( t ) = K ˙ ( 0 ) θ ˙ ( t ) 1 τ K r θ ( t )
r ˙ μ i j ( t ) = μ ˙ ( 0 ) [ 2 3 δ i j v k , k ( t ) + v i , j ( t ) + v j , i ( t ) ] 1 τ μ r μ i j ( t )
where m ( 0 ) , K ( 0 ) , τ K , and τ μ are the mechanical parameters, while r , k , g , C e , and T 0 are the thermal parameters. These parameters are determined experimentally.

3.2. Boundary Conditions

The interfacial heat transfer coefficient, as one of the boundary conditions of temperature simulation, plays an important role in affecting the simulation results. A dynamic interfacial heat transfer coefficient varying with pressure was considered in the LPSC process, of which the initial peak values under holding pressures of 20 kPa and 40 kPa were 1052 and 2902 W∙m−2∙K−1, respectively, and the stable value was 500 W∙m−2∙K−1 [25].
Since the sand mold was compressed on the cumbersome LPSC platform by a press plate on the upper surface during the casting process, the upper and lower surface were fixed boundaries, as shown in Figure 2. The other four faces were free boundaries, as they were exposed to the air. The bottom of the feeding channel was connected with a high-temperature riser, which was also treated as a free boundary. Because the 45# steel waveguide rod had a weak attenuation on the mechanical wave, and the rod surface was coated with graphite paint—which reduced the friction between the rod and the mold to insignificance—the vibration source could be set on the surface of the feeding channel in the simulation. Meanwhile, a solidified shell was formed and the waveguide rod was welded to the surface of the feeding channel before starting the vibration, so the rod could generate both compressive and tensile stress.
As shown by the typical temperature field at the 30% solid fraction of the feeding channel in Figure 2, the solidification time of the channel was shorter than that of the casting. Between the two 642 °C isotherms—the dendritic coherency temperature—the pasty quasi-solid region seriously hindered the feeding in the LPSC. To represent the evolution of the wave field over time, the representative points 1–5 at 10 mm intervals in the feeding channel are shown in Figure 2. The accuracy of the simulation was verified by comparing the numerical displacement amplitude to the measurement of point 6 on the facial mold opposite the vibration source.

3.3. Numerical Process

The wave equations were calculated with a temporal second-order and spatial fourth-order staggered-grid finite difference method. The solidification temperature field was simulated using AnycastingTM software. As the time step for the wave field was much smaller than that for the temperature field, the wave propagation during solidification was calculated by combining the piecewise solution of the wave field and the continuous solution of the temperature field. As shown in Figure 3, first, the temperature fields of the casting and mold calculated using AnycastingTM were exported at the time required. Second, a self-developed wave propagation program using the Fortran language was utilized to preprocess the following: reading the material database, inputting the initial and boundary conditions, and importing the temperature field. Third, the mechanical and thermal parameters were interpolated according to the temperature field and the material database, and the time step Δtw for the wave field was calculated, conforming to the stability condition. Fourth, the wave equations (Equations (1)–(6)) were calculated, and the vibration source f i and boundary conditions—including free boundaries, fixed boundaries, and interfaces—at the corresponding nodes at each time step were added. The program judged whether the wave field was stable at the end of each time step. If not, the fourth step was repeated until the wave field stabilized. Finally, the wave field of displacement and stress was outputted.

4. Results and Discussion

4.1. Shrinkage Defects

The shrinkage defects of each part of the three samples are shown in Figure 4. Shrinkage defects in the casting parts of samples 1 and 2 were similar in size and location, indicating that only increasing the holding pressure had a limited contribution to feeding. The shrinkage defects in the casting of sample 3 were eliminated, indicating that vibration has a great promoting effect on feeding. Meanwhile, vibration changed the distribution of shrinkage defects in the feeding channel. The locations of the shrinkage defects in the feeding channels of samples 1 and 2 were roughly the same, and the defects extended from the surface center to the channel center. The shrinkage defects in the feeding channel of sample 3 went down lower and extended from the surface connecting to the riser and opposite the vibration source to the channel center.

4.2. Temperature Field

As shown in Figure 5, the numerical temperature was close to the experimental temperature at the center of the casting, and the feeding channel solidified under the stationary condition—especially in the solid–liquid interval. The large difference in temperature occurred before solidification because of the delay error in the measurement of the thermocouple.
Applying the solid fraction curvature to estimate the shrinkage defect probability of static low-pressure casting in AnycastingTM, the results for sample 1 are shown in Figure 6. The positions marked with A were the thermocouple holes. The top center of the casting, denoted by B in Figure 6a, was a typical shrinkage cavity coinciding with the simulated defects in Figure 6b. The porosities marked with C at the top of the casting were mixed holes composed of pores and shrinkage porosities, which may have been caused by the fact that the exhaust gas produced by resin ablation cannot be quickly discharged from the sand mold enclosed by the sand box. The generation of gas and backpressure was not considered; therefore, there were no predicted shrinkage defects in the location corresponding to C. In the feeding channel, the predicted shrinkage defects coincided with the observations except for the position marked with D, which was higher than predicted. This may have been caused by mass feeding in the upper feeding channel. As the melt temperature near the center of the channel was higher, the viscosity was lower, the mass feeding speed was faster, and the shear stress was increased, forming shrinkage defects with flow patterns pointing to the center. The numerical defect prediction was only from the temperature field, making it unsuitable for the paste solidification alloys with mass feeding and interdendritic feeding—especially in the castings under vibration. Therefore, it was necessary to simulate the wave field during solidification.

4.3. Wave Field

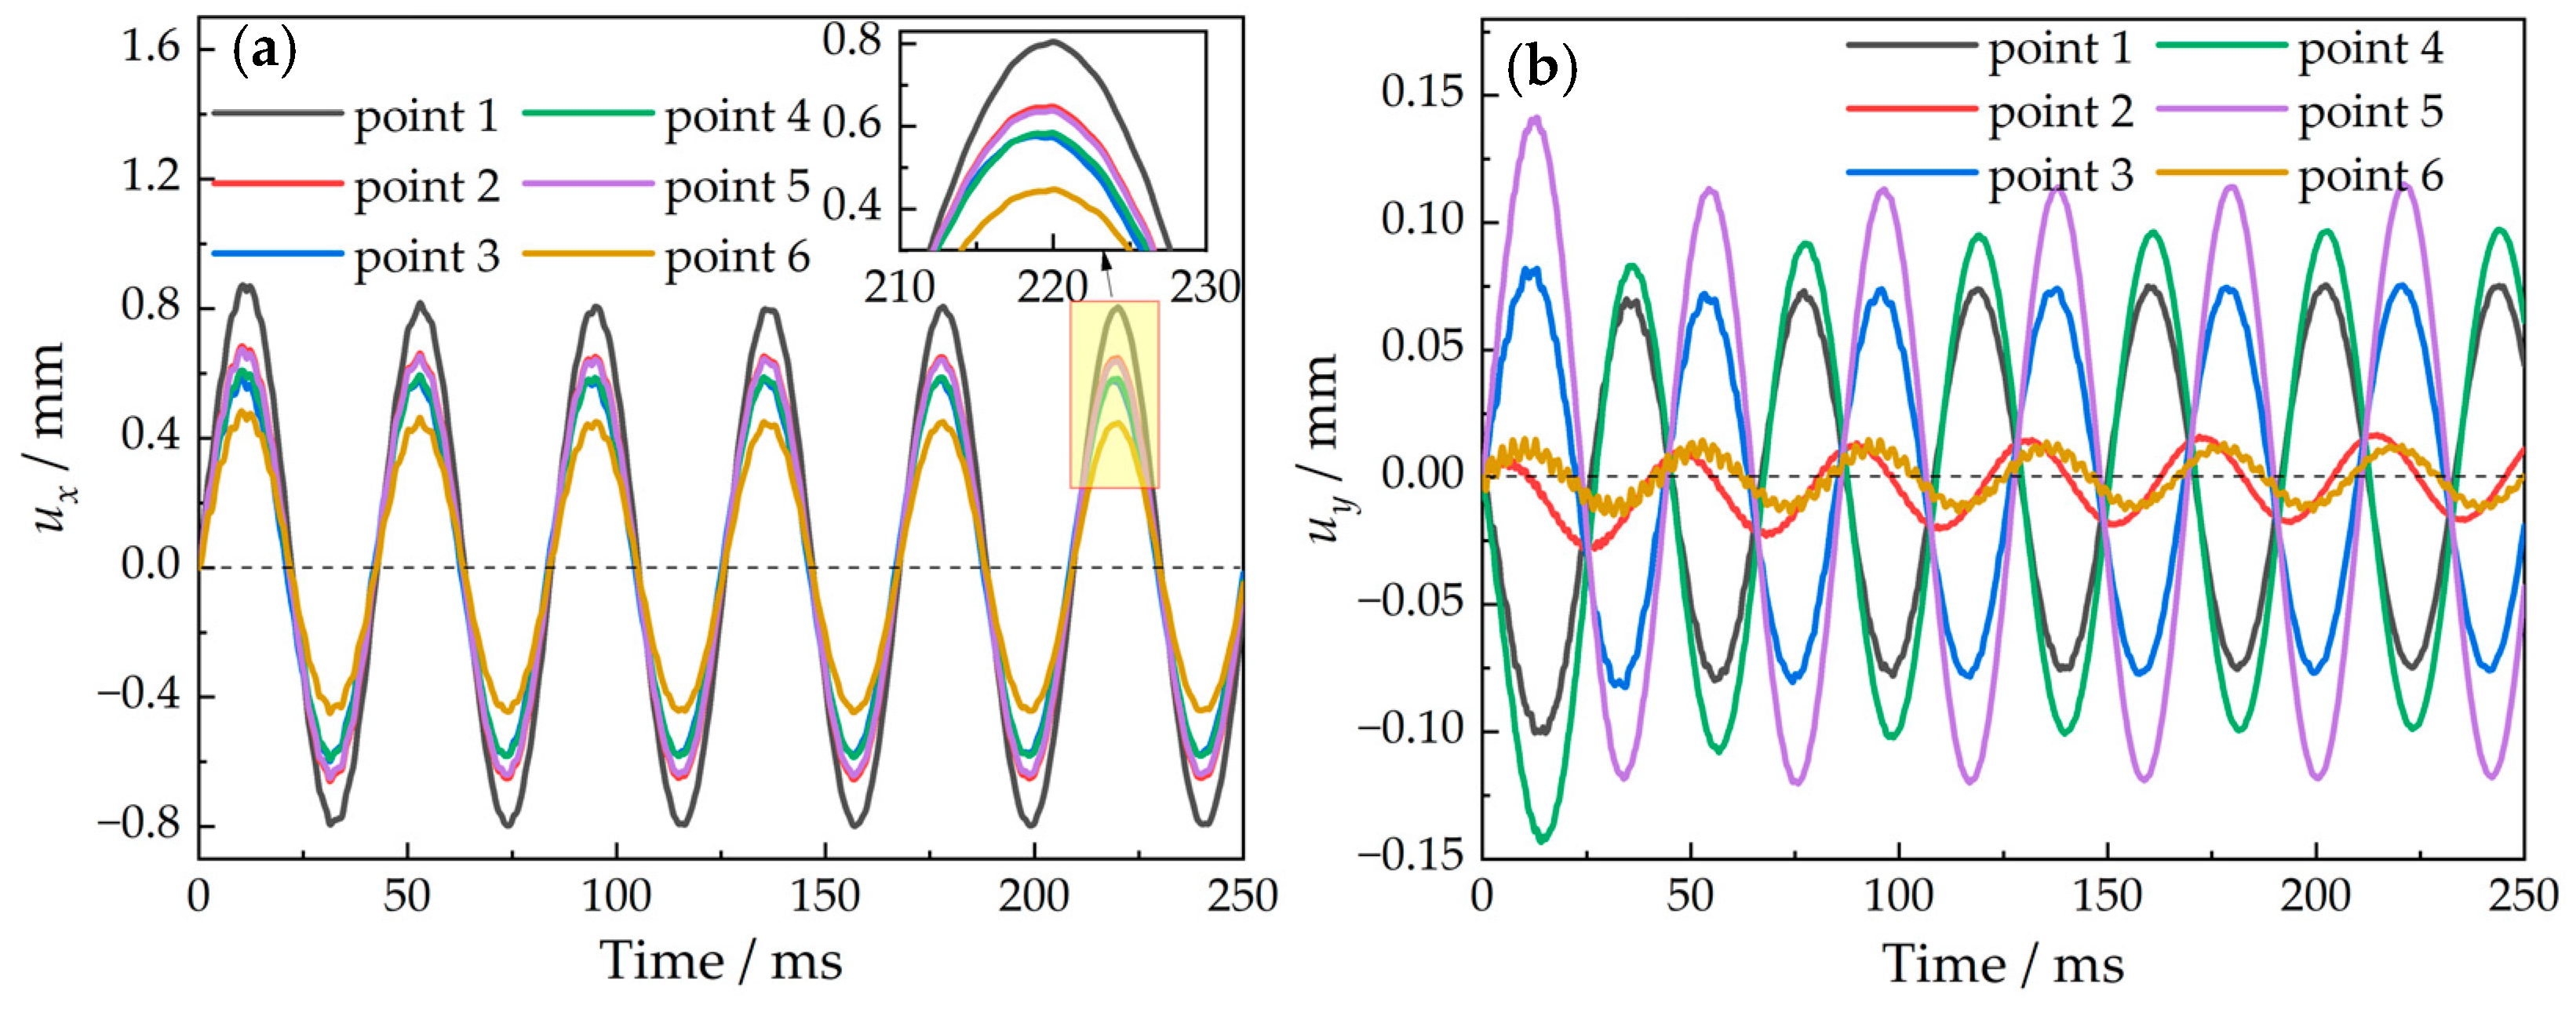
4.3.1. Evolution of the Wave Field with Time

The displacement in the x-direction ( u x ) and y-direction ( u y ) in the computational domain (i.e., the casting and the mold) at the time to the peak (220 ms) and the trough (240 ms) of the vibration source is shown in Figure 7. The calculations were under the temperature field at the 30% solid fraction of the feeding channel, indicating that the feeding channel had been blocked. u x radiated outward from the vibration source damply, with the largest value and gradient at the source and the uniform distribution away from the source, as shown in Figure 7a,b. Although the source vibrated only in the x-direction, the vibration was also non-negligible in the y-direction because of the constraint and the Poisson effect, as shown in Figure 7c,d. The maximum value of u y was not at the source, but at both sides along the vibration direction near the 642 °C isotherm with the opposite sign, as indicated by marker A in the quasi-solid region and marker B in the quasi-liquid region in Figure 7c. The distribution of u x and u y indicated that the vibration energy was mainly concentrated in the feeding channel, constituting the expected result of applying a waveguide rod.
As shown in Figure 8, the wave field was unstable in the first two cycles, especially with a slight jagged fluctuation at the peak. Hereafter, the vibration of each molten particle stabilized to simple harmonic movement with the same frequency as the source. Since the casting size was much smaller than the wavelength, u x did not have a phase difference between any two points, as shown in Figure 8a. However, due to the constraints of the boundaries and non-uniformity of the melt, u y was asynchronous, as shown in Figure 8b. The phase difference increased with the u y  isodisplacement between the extreme points marked by A and B in Figure 7c, such as 90° between points A and 1 and 180° between points A and B, and was equal on the isodisplacement, such as 0° between points 1 and 4. u y of point 6 was almost zero, and u x was 0.442 mm—close to the measured value of 0.427 mm, verifying the accuracy of the simulation.
The feeding channel deformed periodically under vibration, and its deformation amplified 100-fold at 220 ms and 240 ms is shown in Figure 9. The distortion of the mesh reflected the deformation of the melt micro-units. The displacement was large in the upper feeding channel, but the deformation was small. Conversely, the displacement was small in the lower region, but the deformation was large. The maximal deformation region near the 642 °C isotherm is marked by a red line and named region A in Figure 9a,b. In the positive half-period of the source, the feeding channel was pushed, forming tensile stress in region A, where the dendrites overlapped slightly with weak strength [26]. When the tensile stress reached its maximum, such as at 220 ms, region A developed cracks easily, as shown in Figure 9a. In the negative half-period, the feeding channel was pulled, forming compressive stress in region A to press the cracks, as shown in Figure 9b. However, the strength increased with solidification, and the cracks were in a vacuum, promoting the discharge of the gas dissolved in the melt, increasing the resistance to being pressed. If the cracks were not pressed and the melt was not supplemented in time, hot cracks accompanied by shrinkage porosities would form here. As denoted by the red dashed ellipse in Figure 9c, the position and direction of cracks and shrinkage defects coincided with those predicted. The comparison verified the accuracy of the numerical simulation and explained the change in the distribution of shrinkage defects with vibration.

4.3.2. Evolution of the Wave Field with Solidification

As the vibration stabilized to simple harmonic movement after the first two cycles, the displacement amplitude was an index measuring the steady wave field. Variations in the displacement amplitude of the representative points 1–5 with the solid fraction of feeding channel f s c and the displacement wave field in the feeding channel at the specified f s c = 19.1%, 25.8%, 28.1%, and 40% are shown in Figure 10 and Figure 11.
The u x radiated outward from the vibration source damply and became more uniform in the feeding channel with the increase in f s c , as shown in Figure 10. The distribution of the wave field depends on the uniformity of wave impedance, which increases with solidification. The extreme u y denoted by markers A and B in Figure 11 moved from the ends of the feeding channel to the vibration source.
As shown in Figure 10, for points 1, 2, 4, and 5, with the increase in the solid fraction of the feeding channel, the u x amplitude first reduced slightly when f s c < 19.1%, then reduced slowly when 19.1% < f s c < 27%, reduced rapidly when 27% < f s c < 40% and, finally, reduced slowly to a certain level when f s c > 40%. For point 3, variation in the u x amplitude with f s c was the same as for the other representative points, except for the dramatic increase when 27% < f s c < 29.1%.
The u x amplitude is mainly determined by the strength of the feeding channel, and the higher the strength, the smaller the amplitude. When f s c is below 19.1%, the feeding channel is full of quasi-liquid and liquid phases, the changes in the strength of which with f s c are small, producing a large amplitude and little variation. Conversely, when f s c is above 40%, the feeding channel is quasi-solid and solid, with a small amplitude, under the same excitation force. As a continuous quasi-liquid and separate quasi-solid coexist when 19.1% < f s c < 27%, and the resistance of the quasi-liquid to the movement is insignificant, the u x amplitude reduces slowly. When the dendrites overlap at f s c = 27%, the strength of the feeding channel increases sharply due to the continuous quasi-solid and separate quasi-liquid, so the u x amplitude of points 1, 2, 4, and 5 reduces rapidly when 27% < f s c < 40%. The u x amplitude of point 3 depends on both the strength of the channel and the force transmitted from the vibration source. Since the force increases rapidly when 27% < f s c < 29.1% because of the coherency of the dendrites, the u x amplitude increases dramatically. However, the effect of strength is greater than that of force when f s c > 29.1%, when all of the representative points are in quasi-solid, so the u x amplitude reduces again.
As shown in Figure 11, for points 1, 2, and 4, with the increase in f s c , the u y amplitude initially remained almost unchanged when f s c < 19.1%, and then it reduced rapidly when 19.1% < f s c < 30%, reduced slowly when 30% < f s c < 45% and, finally, reduced slowly to near zero when f s c > 45%. For points 3 and 5, variation in the u y amplitude with f s c was the same as for the other representative points, except for the dramatic increase when 25.8% < f s c < 28.1%.
As analyzed in the u x amplitude, the u y amplitude reduced with the increase in the strength of the feeding channel with solidification. Meanwhile, due to the force transmitted from the vibration source, the u y amplitude of point 3 increased when 25.8% < f s c < 28.1%. The structure of the lower-strength trumpet-shaped quasi-liquid and higher-strength quasi-solid wall may concentrate the y-movement at the narrow site, leading to the abnormal increase in point 5.

4.4. Effects of Mechanical Vibration on Solidification Feeding

Campbell [27] summarized five feeding mechanisms for solidification as follows: liquid feeding, mass feeding, interdendritic feeding, burst feeding, and solid feeding. Liquid feeding and solid feeding occur before and after solidification, respectively, when mechanical vibration is not applied. Therefore, the effects of mechanical vibration on the other three feeding mechanisms were analyzed.

4.4.1. Effect of Mechanical Vibration on Mass Feeding

Mass feeding denotes the movement of a slurry of solidified metal and residual liquid, occurring before the feeding channel is blocked, i.e., f s c < 27%. As shown in Figure 12, the quasi-liquid moved in a channel surrounded by the 642 °C isothermal surface at 24% f s c . A severe shear deformation was produced in the quasi-liquid, especially in the lower feeding channel, as denoted by markers A and B in Figure 12, causing the dendrites to be broken and remelted. According to the comparison of optical micrographs of the feeding channel’s center, the fragmenting and fragmented dendrites coexisted in the channel, as shown in Figure 13, indicating that mechanical vibration does cause strong destruction of the grains in the channel. Therefore, the grain size was reduced after vibration treatment. Mass feeding is sensitive to grain size—the finer the grain, the easier the mass feeding.
Moreover, the increase in the shear strain rate caused by vibration decreases the apparent viscosity of the melt [28]. Meanwhile, the fast relative motion between melt particles also promotes internal friction, consuming the wave energy and causing the local temperature to rise. The increase in temperature also decreases the apparent viscosity of the melt [29]. The decrease in apparent viscosity is beneficial to mass feeding. The greater the amplitude, the higher the frequency, the more obvious the weakening effect of vibration on viscosity, and the more conducive it is to mass feeding.

4.4.2. Effect of Mechanical Vibration on Interdendritic Feeding

Interdendritic feeding—a simplified seepage—is used to describe the flow of residual liquid through the pasty zone. The capillary diameter in the casting changes periodically under vibration. Seepage is sensitive to the capillary diameter; therefore, changing the diameter can easily affect the seepage velocity. In order to quantify the effect of vibration on interdendritic feeding, we simplified the calculation of the vibration-promoting interdendritic feeding rate (VPIFR). As shown in Figure 14, because u x radiates outward from the vibration source, the capillary diameter changes in the radiation direction. Hence, the seepage channels can be simplified to gaps (length l , width b , and thickness h ) between parallel plates.
The thickness of gaps changed periodically during the tensile and compressive deformation under vibration. According to the Hagen–Poiseuille law for low-Reynolds-number pressure-driven flow in a parallel gap [30], the VPIFR can be expressed as follows:
V P I F R = 0 t n ( b h 3 / 12 η l ) Δ P d t n ( b h 0 3 / 12 η l ) Δ P 0 t n ( b h 0 3 / 12 η l ) Δ P 0 t = 0 t Δ P h 3 d t Δ P 0 h 0 3 t Δ P 0 h 0 3 t
where Δ P and Δ P 0 are the feeding pressure difference between the two ends of the pasty zone with and without vibration, respectively, and n is the gap number.
As the maximum u x amplitude in the feeding channel was about 1 mm, the change in porosity was negligible. Hence, we obtained the following relationship:
f l = n h 0 H 0 = n h H
where f l is the porosity of the pasty zone; h and h 0 are the thicknesses with and without vibration, respectively; and H and H 0 are the aggregate thicknesses with and without vibration, respectively.
Substituting Equation (8) into Equation (7), we can obtain the following:
V P I F R = 0 t Δ P H 3 d t Δ P 0 H 0 3 t Δ P 0 H 0 3 t
As shown in Figure 15, the feeding pressure difference ( σ y y 4     σ y y 5 ), the aggregate thicknesses of the feeding gap ( u x 3     u x 1 ), and the VPIFR changed periodically. In three-fifths of the period at the beginning of vibration, the VPIFR value was negative—that is, the vibration hindered the interdendritic feeding. However, the promoting effect of vibration on interdendritic feeding reached the maximum at 38 s. In the subsequent vibration, the VPIFR fluctuated and eventually stabilized at about 13.4%.

4.4.3. Effect of Mechanical Vibration on Burst Feeding

Burst feeding is proposed as a logical possibility but has never been unambiguously demonstrated. It happens accidentally, attributed to the failure [26] or structural change [31] in the blockage. As solidification proceeds, both the stress and strength of the blockage increase together, but at different rates. Failure is expected if the stress grows to exceed the strength of the blockage. Therefore, increasing the solidification pressure can promote the formation of burst feeding. The feeding pressure difference produced by vibration changes periodically, as shown in Figure 15. In the positive half-period, the maximal additional pressure caused by vibration is 3.5 times as large as the holding pressure of the LPSC. Hence, vibration is conducive to generating burst feeding.
To analyze the structural changes in the blockage under vibration, we took out the trajectories (denoted by red curves with an arrow in Figure 16) of nine nodes (denoted by black dots in Figure 16) with a 2 mm interval in the center of the feeding channel. As shown in Figure 16a, the melt particles periodically moved clockwise in ellipses, and the motion ranges in the x-direction were much larger than those in the y-direction. At the relative trajectories to the center P shown in Figure 16b, the minor axes of elliptic trajectories were almost zero. Hence, the other melt particles caused steady linear vibrations relative to the center. The grains of the Al-Cu-Mn-Ti alloy are equiaxial crystals, as shown in Figure 13. Representing the melt particles as spherical grains, the evolution of the packing structure is shown in Figure 17, where the gray dashed lines denote the equilibrium positions and the yellow balls denote the grains. In one period of vibration, the grains first moved from the dashed lines to the positions of yellow balls in Figure 17a, and then to the dashed lines in Figure 17b, to the positions of yellow balls in Figure 17b and, finally, to the dashed lines in Figure 17a. The packing structure of the grains changed periodically. When the packing structure was the state denoted by the yellow balls in Figure 17b, the packing in the x-direction was not compact, making it easier to destroy under the action of solidification pressure and additional pressure caused by vibration, promoting the formation of burst feeding.

5. Conclusions

This study investigated the effects of mechanical vibration on the solidification feeding during the LPSC process of Al-Cu-Mn-Ti alloy through experimental and numerical investigation. The following conclusions were drawn:
(1)
Applying vibration had a greater promotional effect on feeding than increasing the holding pressure.
(2)
The casting in solidification produced a stable harmonic vibration under the excitation of the continuous harmonic vibration source, and the vibration energy was mainly concentrated in the channel, causing cracks and shrinkage defects in the lower channel opposite the source, coinciding with the detections.
(3)
With solidification, the u x amplitude reduced rapidly after the dendrites overlapped when 27% < f s c < 40%, and then it reduced slowly to a certain value; the u y amplitude reduced rapidly after the occurrence of a quasi-solid phase when 19.1% < f s c < 30%, and it then reduced slowly to near zero.
(4)
The mechanical vibration produced a severe shear deformation in the quasi-liquid region—especially in the lower feeding channel—causing dendrites to be broken and remelted, reducing the grain size to promote the mass feeding.
(5)
The feeding pressure and gaps changed periodically under vibration, and the vibration-promoting interdendritic feeding rate fluctuated and eventually stabilized at about 13.4%.
(6)
The mechanical vibration can increase the feeding pressure difference and change the blockage structure simultaneously, increasing the formation probability of burst feeding.

Author Contributions

Conceptualization, W.C.; methodology, W.C.; software, W.C.; validation, W.C., S.W. and R.W.; formal analysis, W.C. and R.W.; investigation, W.C., S.W. and R.W.; resources, S.W.; data curation, W.C.; writing—original draft preparation, W.C. and S.W.; writing—review and editing, W.C., S.W. and R.W.; visualization, W.C.; supervision, S.W. and R.W.; project administration, W.C., S.W. and R.W.; funding acquisition, S.W. All authors have read and agreed to the published version of the manuscript.

Funding

This research was funded by the National Natural Science Foundation of China, grant number 52075123.

Institutional Review Board Statement

Not applicable.

Informed Consent Statement

Not applicable.

Data Availability Statement

The data presented in this study are available upon request from the corresponding author.

Conflicts of Interest

The authors declare no conflict of interest.

References

  1. Mi, G.; Wang, K.; Gong, H.; Wang, H.; Zeng, S. Microstructure and Properties of ZL205 Alloy. China Foundry 2008, 5, 24–27. [Google Scholar]
  2. Luo, L.; Xia, H.Y.; Luo, L.S.; Su, Y.Q.; Cai, C.J.; Wang, L.; Guo, J.J.; Fu, H.Z. Eliminating Shrinkage Defects and Improving Mechanical Performance of Large Thin-Walled ZL205A Alloy Castings by Coupling Travelling Magnetic Fields with Sequential Solidification. Trans. Nonferrous Met. Soc. China 2021, 31, 865–877. [Google Scholar] [CrossRef]
  3. Wu, S.P.; Wang, R.J.; Wang, Y.; Chen, W.; Ji, Z.S. Reduction of Shrinkage Porosities in Aluminum Alloy Castings by External Pressure Fluctuation Under Gravity Field. China Foundry 2018, 15, 372–377. [Google Scholar] [CrossRef] [Green Version]
  4. Wang, Y.; Wu, S.P.; Niu, L.J.; Xue, X.; Zhang, J.B.; Xiao, W.F. Optimization of Low-Pressure Die Casting Process Parameters for Reduction of Shrinkage Porosity in ZL205A Alloy Casting Using Taguchi Method. Proc. Inst. Mech. Eng. Part B 2014, 228, 1508–1514. [Google Scholar]
  5. Yoshitake, Y.; Yamamoto, K.; Sasaguri, N.; Era, H. Refinement of Primary Si Grains of Al-21%Si Alloy Using Vibration Mold. Mater. Trans. 2020, 61, 355–360. [Google Scholar] [CrossRef]
  6. Promakhov, V.V.; Khmeleva, M.G.; Zhukov, I.A.; Platov, V.V.; Khrustalyov, A.P.; Vorozhtsov, A.B. Influence of Vibration Treatment and Modification of A356 Aluminum Alloy on Its Structure and Mechanical Properties. Metals 2019, 9, 87. [Google Scholar] [CrossRef] [Green Version]
  7. Wang, H.; Qu, C.; Zheng, Y.; Du, F. Study on the Effect of Vibration on Solidification Structures in the Vibration Cast-Rolling Process. Mater. Und Werkst. 2021, 52, 452–459. [Google Scholar] [CrossRef]
  8. Xiao, B.; Fan, Z.; Jiang, W.; Xiang, J.; Yan, X. Effect of Vibration Frequency on Primary Phase and Properties of Grey Cast Iron Fabricated by Lost Foam Casting. China Foundry 2020, 17, 1–7. [Google Scholar] [CrossRef] [Green Version]
  9. Wang, W.L.; Chen, J.; Li, M.M.; Wang, A.L.; Su, M.Y. Numerical Simulation of Temperature and Fluid Fields in Solidification Process of Ferritic Stainless Steel Under Vibration Conditions. Crystals 2019, 9, 174. [Google Scholar] [CrossRef] [Green Version]
  10. Wang, W.L.; Liu, Y.H.; Guo, L.T.; Wang, Y.L. Cellular Automaton Simulation of Dendrite Growth in Solidification Process of Cr17 Stainless Steel under Mechanical Vibration. Phys. Status Solidi A 2022, 219, 2100620. [Google Scholar] [CrossRef]
  11. Chai, G.C.; BÄckerud, L.; RØlland, T.; Arnberg, L. Dendrite Coherency During Equiaxed Solidification in Binary Aluminum Alloys. Metall. Mater. Trans. A 1995, 26, 965–970. [Google Scholar] [CrossRef]
  12. Pîrvulescu, C.M.; Bratu, C. Mechanic Vibrations Generation System and Effect on the Casting Alloys Solidification Process. UPB Sci. Bull. Ser. B 2010, 72, 219–232. [Google Scholar]
  13. Zhao, Z.; Fan, Z.T. Influence on the Microstructures and Properties of A356 with Vibration Pressure in Lost Form Casting. Appl. Mech. Mater. 2014, 685, 7–10. [Google Scholar] [CrossRef]
  14. Chen, W.; Wu, S.P.; Wang, R.J. Effect of Vibration on Interdendritic Feeding of Al–5%Cu–0.4%Mn Alloy. Int. J. Metalcast. 2019, 13, 969–978. [Google Scholar] [CrossRef]
  15. Tian, X.F.; Fan, Z.T.; Huang, N.Y. Effect of Mechanical Vibration on Microstructure and Mechanical Properties of Lost Foam Casting Magnesium Alloy. Chin. J. Nonferrous Met. 2006, 16, 1838–1844. [Google Scholar]
  16. Wang, R.J.; Wu, S.P.; Chen, W. Propagation of Thermoviscoelastic Wave in Inhomogeneous Alloy Melt with Varying Temperature. Acta Phys. Sin. 2019, 68, 048101. [Google Scholar] [CrossRef]
  17. Wu, S.P.; Wang, R.J.; Chen, W.; Dai, G.X. Progress on Numerical Simulation of Vibration in the Metal Solidification. Acta Metall. Sin. 2017, 54, 247–264. [Google Scholar]
  18. Patel, V.P.; Patel, J.V.; Patel, A.V.; Bhuva, B.V. A Review on Microstructure and Mechanical Properties of Aluminium Alloy Using Mold Vibration. Int. Res. J. Eng. Technol. 2019, 6, 1047–1051. [Google Scholar]
  19. Wang, R.J.; Wu, S.P.; Chen, W. Unified Wave Equation and Numerical Simulation of Mechanical Wave Propagation in Alloy Solidification. Simulation 2019, 95, 3–10. [Google Scholar] [CrossRef]
  20. Kong, W.; Cang, D.Q. Effects of Ultrasound on the Flow Field in Molten Steel and Solidification Structure. Simulation 2012, 88, 694–706. [Google Scholar] [CrossRef]
  21. Feng, X.H.; Zhao, F.Z.; Jia, H.M.; Li, Y.J.; Yang, Y.S. Numerical Simulation of Non-Dendritic Structure Formation in Mg-Al Alloy Solidified with Ultrasonic Field. Ultrason. Sonochem. 2018, 40, 113–119. [Google Scholar] [CrossRef] [PubMed]
  22. Chen, X.; Jia, Y.; Le, Q.; Yu, F. Understanding the Influence of Ultrasonic Streaming on Solidification of AZ80 Magnesium Alloy During Direct-Chill Casting Using a Transient Coupling Modeling. J. Mater. Res. Technol. 2021, 14, 1154–1166. [Google Scholar] [CrossRef]
  23. Wang, R.J. Propagation of Mechanical Wave During Solidification of ZL205A Alloy and its Promoting Behavior on Feeding. Ph.D. Thesis, Harbin Institute of Technology, Harbin, China, 2021. [Google Scholar]
  24. Wang, R.J.; Wu, S.P.; Chen, W. Effect of Vibration on Seepage Feeding During Low-Pressure Casting of ZL205A Alloy. China Foundry 2019, 16, 40–45. [Google Scholar] [CrossRef] [Green Version]
  25. Chang, T.; Zou, C.M.; Wang, H.W.; Wei, Z.J.; Zhang, X.J. Optimization of the Interface Heat Transfer Coefficient Model Based on the Dynamic Thermo-Physical Parameters in the Pressure-Temperature Coupled Field. Int. Commun. Heat Mass 2020, 110, 104435. [Google Scholar] [CrossRef]
  26. Dahle, A.K.; StJohn, D.H. Rheological Behaviour of the Mushy Zone and its Effect on the Formation of Casting Defects During Solidification. Acta Mater. 1998, 47, 31–41. [Google Scholar] [CrossRef]
  27. Campbell, J. Castings, 2nd ed.; Butterworth-Heinemann: Oxford, UK, 1991; pp. 205–231. [Google Scholar]
  28. Ma, Z.; Zhang, H.; Zhang, X.; Wu, X.; Fu, H.; Jia, L.; Zhang, H. Rheological Behaviour of Partially Solidified A356 Alloy: Experimental Study and Constitutive Modelling. J. Alloy. Compd. 2019, 803, 1141–1154. [Google Scholar] [CrossRef]
  29. Ravi Narayan, L.; Hebert, R.J. Rheology of Partially Solidified Hypoeutectic Aluminum Copper Alloys. SN Appl. Sci. 2022, 4, 186. [Google Scholar] [CrossRef]
  30. Cornish, R.J. Flow in a Pipe of Rectangular Cross-Section. Proc. Roy. Soc. Lond. A 1928, 120, 691–700. [Google Scholar]
  31. Wang, R.J.; Wu, S.P.; Chen, W. Mechanism of Burst Feeding in ZL205A Casting Under Mechanical Vibration and Low Pressure. Trans. Nonferrous Met. Soc. China 2018, 28, 1514–1520. [Google Scholar] [CrossRef]
Figure 1. The LPSC setup with vibration.
Metals 12 02001 g001
Figure 2. The boundary conditions for simulating the wave field, the locations of the representative points 1–6, and the temperature field at the 30% solid fraction of the feeding channel.
Metals 12 02001 g002
Figure 3. Procedures of coupling calculation of the temperature field and wave field.
Metals 12 02001 g003
Figure 4. X-ray detection results of samples. Note: The red dashed ellipses indicate the shrinkage defects.
Metals 12 02001 g004
Figure 5. Comparison of experimental and numerical temperatures at the center of the casting and the feeding channel.
Metals 12 02001 g005
Figure 6. Comparison of (a) experimental and (b) numerical shrinkage defects of stationary casting. Note: The red dashed ellipses and letters B–D indicate the shrinkage defects, and letter A denotes the thermocouple holes.
Metals 12 02001 g006
Figure 7. The displacement at the time to peak in the 30% solid fraction of the feeding channel: (a) u x at 220 ms; (b) u x at 240 ms; (c) u y at 220 ms; (d) u y at 240 ms.
Metals 12 02001 g007
Figure 8. The time history of (a) u x and (b) u y of the representative points.
Metals 12 02001 g008
Figure 9. The deformation of the feeding channel magnified 100-fold at (a) 220 ms and (b) 240 ms, compared to (c) the morphology of the shrinkage defects of the casting with 24 Hz vibration. Note: Red arrows indicate the force directions, and the red dashed ellipses denote the position and direction of shrinkage defects.
Metals 12 02001 g009
Figure 10. Variation in the displacement amplitude of u x with the solid fraction of the feeding channel f s c .
Metals 12 02001 g010
Figure 11. Variation in the displacement amplitude of u y with the solid fraction of the feeding channel f s c . Note: Letters A, B and red arrows indicate the extreme u y .
Metals 12 02001 g011
Figure 12. The shear strain of the feeding channel at 24% f s c at 220 ms.
Metals 12 02001 g012
Figure 13. Optical micrographs of the center of the feeding channels: (a) sample 1; (b) sample 2; (c) sample 3; (d) partial enlargement of sample 3.
Metals 12 02001 g013
Figure 14. Simplification of transforming the complicated interdendritic feeding under vibration into a simple gap flow of parallel plates.
Metals 12 02001 g014
Figure 15. Variation in the interdendritic feeding gap size ( u x 3 u x 1 ), the interdendritic feeding pressure ( σ y y 4 σ y y 5 ), and the VPIFR value under vibration with time.
Metals 12 02001 g015
Figure 16. (a) The absolute trajectories of molten particles with u y magnified 10 times, and (b) the relative trajectories to the center magnified 40 times in the steady wave field.
Metals 12 02001 g016
Figure 17. The packing structure of grains at the time to (a) peak and (b) trough displacement in the steady wave field.
Metals 12 02001 g017
Table 1. Chemical composition of the Al-Cu-Mn-Ti alloy (wt.%).
CuMnTiZrBCrVAl
5.00.40.20.150.030.150.08Bal.
Publisher’s Note: MDPI stays neutral with regard to jurisdictional claims in published maps and institutional affiliations.

