Article

The Growth of Intermetallic Compounds and Its Effect on Bonding Properties of Cu/Al Clad Plates by CFR

1
Luoyang Ship Material Research Institute, Luoyang 471023, China
2
College of Mechanical and Vehicle Engineering, Taiyuan University of Technology, Taiyuan 030024, China
3
Engineering Research Center of Advanced Metal Composites Forming Technology and Equipment, Ministry of Education, Taiyuan 030024, China
4
College of Mechanical Engineering, Taiyuan University of Science and Technology, Taiyuan 030024, China
*
Author to whom correspondence should be addressed.
Metals 2022, 12(11), 1995; https://doi.org/10.3390/met12111995
Submission received: 24 October 2022 / Revised: 9 November 2022 / Accepted: 15 November 2022 / Published: 21 November 2022
(This article belongs to the Special Issue Process and Numerical Simulation of Oxygen Steelmaking)

Abstract

:
Cu/Al clad plates prepared using a corrugated + flat rolling (CFR) technique were annealed at 300–450 °C for 10–240 min. Furthermore, the interfacial diffusion behavior and the bonding properties of the Cu/Al clad plates were studied in detail. The results demonstrated that, at the initial stage of the annealing process, the development of the first IMCs layer was restrained by the high atomic concentration gradient in the new bonding interface zone, and the second intermetallic compounds (IMCs) layer preferentially formed in the new bonding interface zone, leading to a slight increase in the growth activation energy of the clad plates. In addition, the atoms’ diffusion behavior at the peak and trough interfaces was not significantly affected by the matrix microstructure, and there was no discernible difference in the growth activation energy at these two positions. Ultimately, it was shown that the maximum average peel strength at the peak and trough interfaces reached 53.07 N/mm and 41.23 N/mm, respectively, when annealing at 350 °C for 10 min.

1. Introduction

Bimetallic clad plates have the characteristics of both of their base metals, so they have been widely concerned by many scholars [1,2,3]. In the past few decades, a variety of clad plates preparation technologies have been developed, such as explosion welding [4], extrusion welding [5], diffusion bonding [6], rolling bonding [7,8], etc. Among them, rolling bonding technology has been used to prepare the Cu/Al clad plates because of its advantages of having a high production efficiency, simple operation, and low cost [9]. However, the Cu/Al clad plates prepared by the traditional flat rolling method have some problems, i.e., a low interface bonding strength and poor flatness [10].
As is known, strong interface bonding and a good plate flatness play an important role in the secondary forming and industrial application of clad plates [11]. Hence, Wang et al. [12] proposed the corrugated + flat rolling (CFR) technique, which consists of two stages: (1) a corrugated rolling stage, in which the slab to be compounded is rolled on a two-high rolling mill with the upper corrugated roll and the lower traditional flat roll at room temperature. This process can form local strong normal stress and strong frictional shear stress at the interface of the plate, which causes the hard brittle layer and oxide layer to break seriously, and makes the local interface area form high-strength bonding; (2) a flat rolling stage, where the corrugated clad plate prepared in the previous stage is further rolled and combined on the traditional flat roll mill after reasonable annealing treatment. This can make the original weak bonding area form strong stress again, thus achieving overall high-strength bonding across the entire interface of the clad plate and significantly optimizing the flatness of the clad plate.
The Cu/Al clad plates after CFR underwent work hardening, and their plastic deformation ability decreased significantly. The annealing process is one of the most common methods used to eliminate the hardening of metal materials during processing [13]. Luo et al. [14] found that the annealing treatment of the clad plate could not only improve the microstructure of the metal matrix but also promote the mutual diffusion between atoms on both sides of the interface so that the interface formed metallurgical bonding, thus improving the interface bonding strength. Chen et al. [15] studied the influence of interfacial phase development on the fracture mechanism and the bonding strength of the annealed Cu/Al clad plates. The results showed that annealing treatment can eliminate interface defects, improve the interface structure, and enhance the properties. However, an unreasonable annealing process also leads to the formation of a variety of brittle intermetallic compounds (IMCs) at the interface, which deteriorates the interfacial bonding performance. Heness et al. [16] pointed out that the phases development in the interface of roll-bonded Cu/Al clad plates controls the strength. In addition, the phase development of the Cu/Al clad plate was monitored as a function of the annealing time. It was found that the initial rolling pressure had no effect on the phase development, but affected the interfacial thickness. According to the previous research, the deformation rate and matrix microstructure in different positions of the Cu/Al clad plate after CFR were varied [17]. Additionally, an intermittent compound layer structure was formed at the interface, which complicated the interface phase development of the CFR Cu/Al clad plate during the annealing process.
In conclusion, in order to explore the effect of the interfacial atoms diffusion behavior and annealing process parameters on interfacial bonding properties of CFR Cu/Al clad plates during annealing, the development process of interfacial IMCs was observed under different annealing temperatures and annealing times. Furthermore, the relationship between the interfacial phase development and shear fracture mechanism was studied in detail. It provided valuable information for the annealing control process of the CFR Cu/Al clad plate.

2. Experimental Materials and Methods

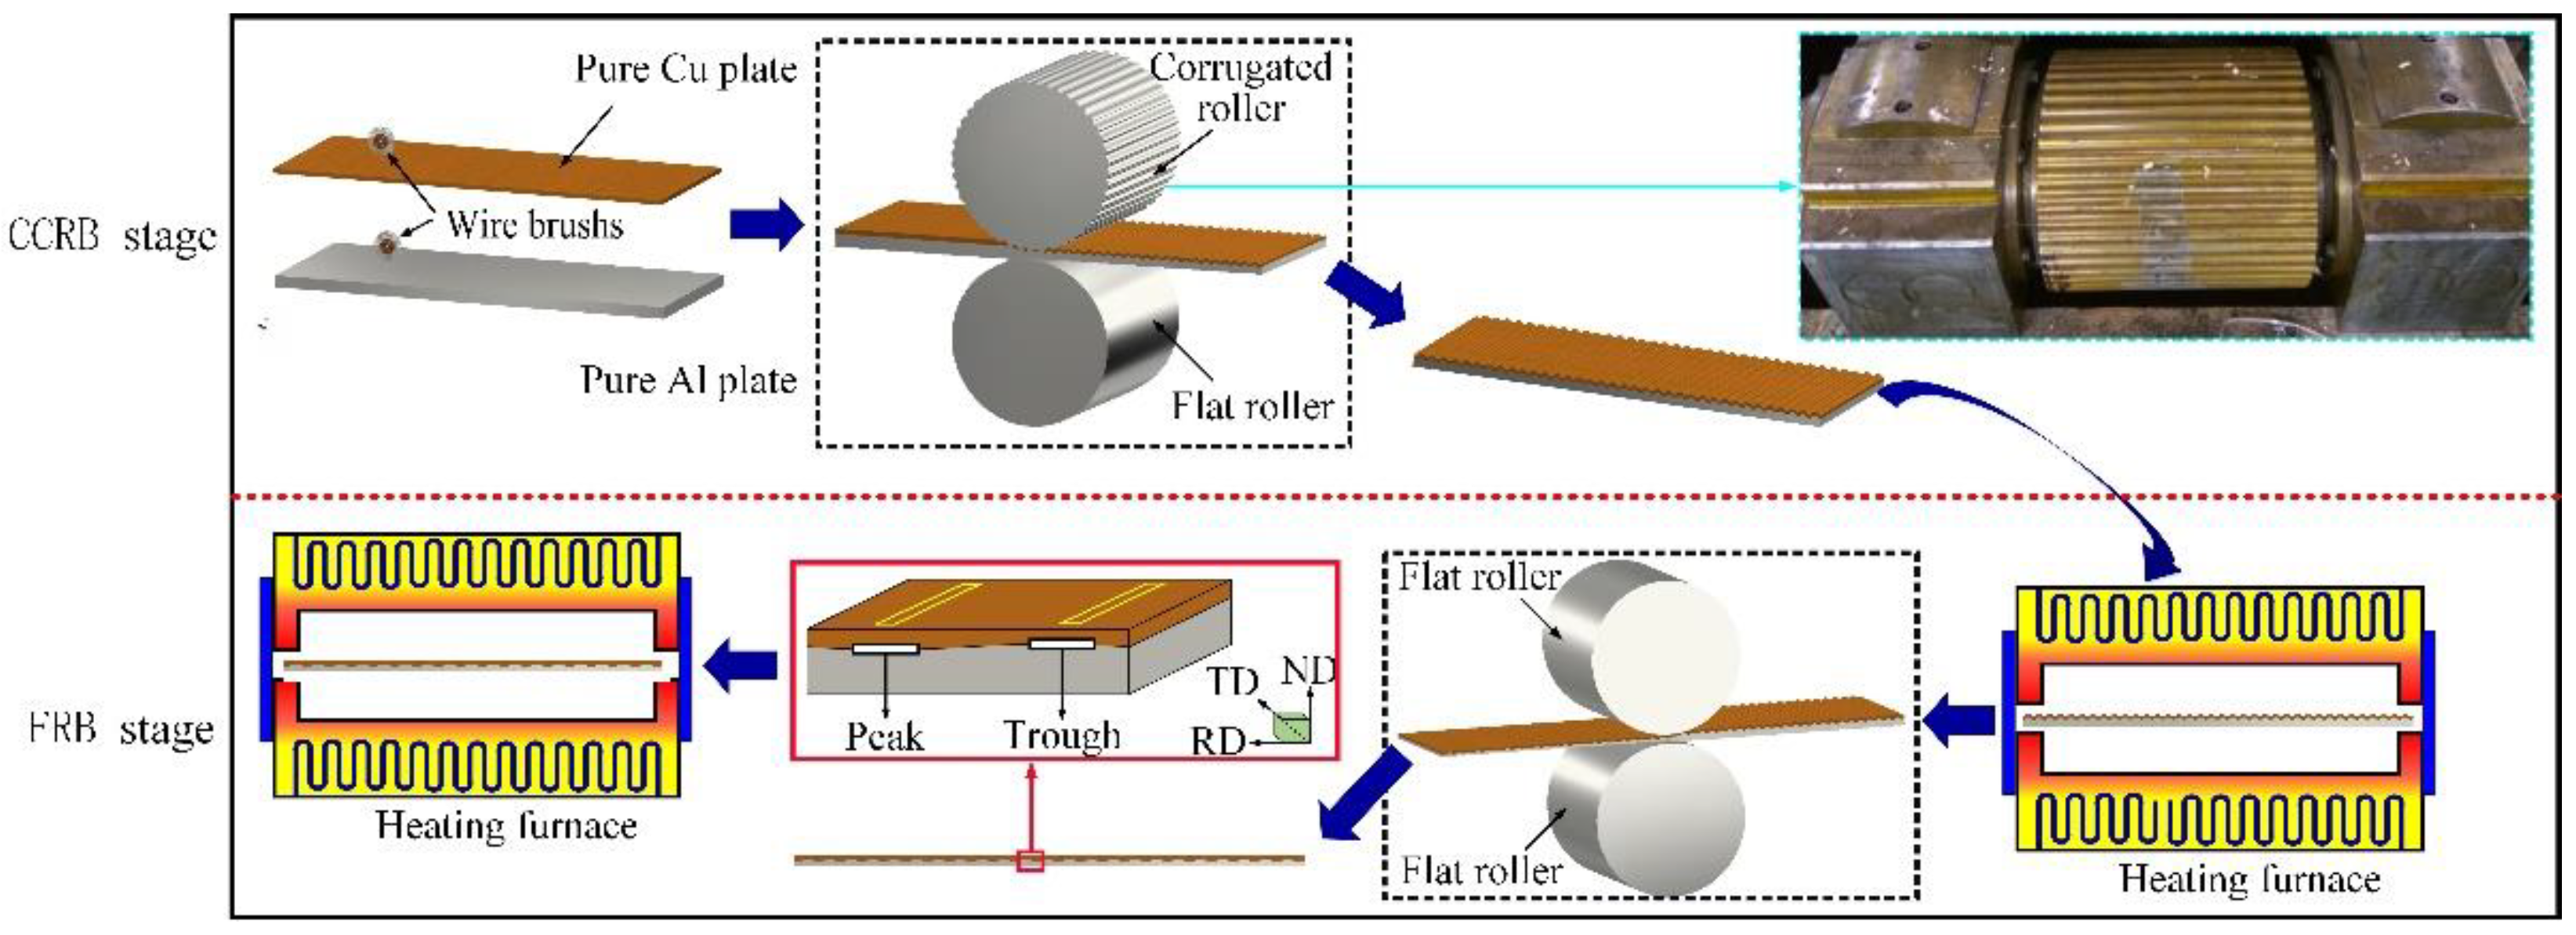
2.1. Materials Preparation

T2 copper plate with an initial thickness of 2 mm and 1060 aluminum plate with an initial thickness of 8 mm were employed as the raw materials in this experiment. The material composition and mechanical properties are shown in Table 1 and Table 2, respectively. The preparation process of Cu/Al clad plate was as follows: (i) blank preparation, where the surfaces of the raw plates were polished until “frosted” effect by the steel wire brush with 0.3 mm diameter. Then, the polished surfaces were cleaned with alcohol, the treated plate was stacked, and holes were punched in the four corners of the combined plates. The clad plates were riveted with 1060 pure aluminum. (ii) Corrugated cold roll bonding (CCRB), where the two-high rolling mill with the upper corrugated roll and the lower traditional flat roll with 320 mm diameter were used to prepare the rolling experiments at room temperature. The first roll reduction rate was 40% and the rolling speed was 0.1 m/s. (iii) Intermediate annealing treatment, where the CCRB clad plate was annealed for 60 min at 350 °C. (iv) Flat roll bonding (FRB), where the annealed Cu/Al corrugated clad plates were flattened to 2.4 mm (reduction was 60% by one pass) thickness by two-high rolling mill with 320 mm diameter. (v) Final annealing treatment, where Cu/Al clad plates after FRB were subjected to annealing treatment at 300–450 °C for 10–60 min. The complete process diagram is shown in Figure 1.

2.2. Mechanical Properties

Several methods can be used to test the bonding strength of Cu/Al clad plate, such as bending test, shear test, and peel test [18,19]. Due to the thickness of Cu layer after CFR being too thin, peel test was conducted to check the bonding quality. The peel samples were cut along the transverse direction (TD) of the annealed Cu/Al clad plate at peak and trough positions. The special positions and specifications of the sample are shown in Figure 2. The bonding properties of the specimens were determined by peeling tests on the Instron 5969 universal material testing machine with a tensile rate of 0.5 mm/min. The peel strength was calculated by the following equation: σ = F/L, where F is the peel force (N) and L is the width of the peel sample (mm).

2.3. Microstructural Characterization

The samples to be microscopic observation were polished to smooth surface [20,21]. The scanning electron microscope (SEM, JSM-IT500, JEOL Ltd., Tokyo, Japan) equipment was used to research the interface microstructure of the cross-section (RD-ND) plane of the sample at the typical position (peak and trough) of the annealed clad plate. The micromorphology of the peeling fracture sections was also characterized by SEM to clarify the influence of interface phase development on interface bonding properties after annealing.

3. Results and Discussion

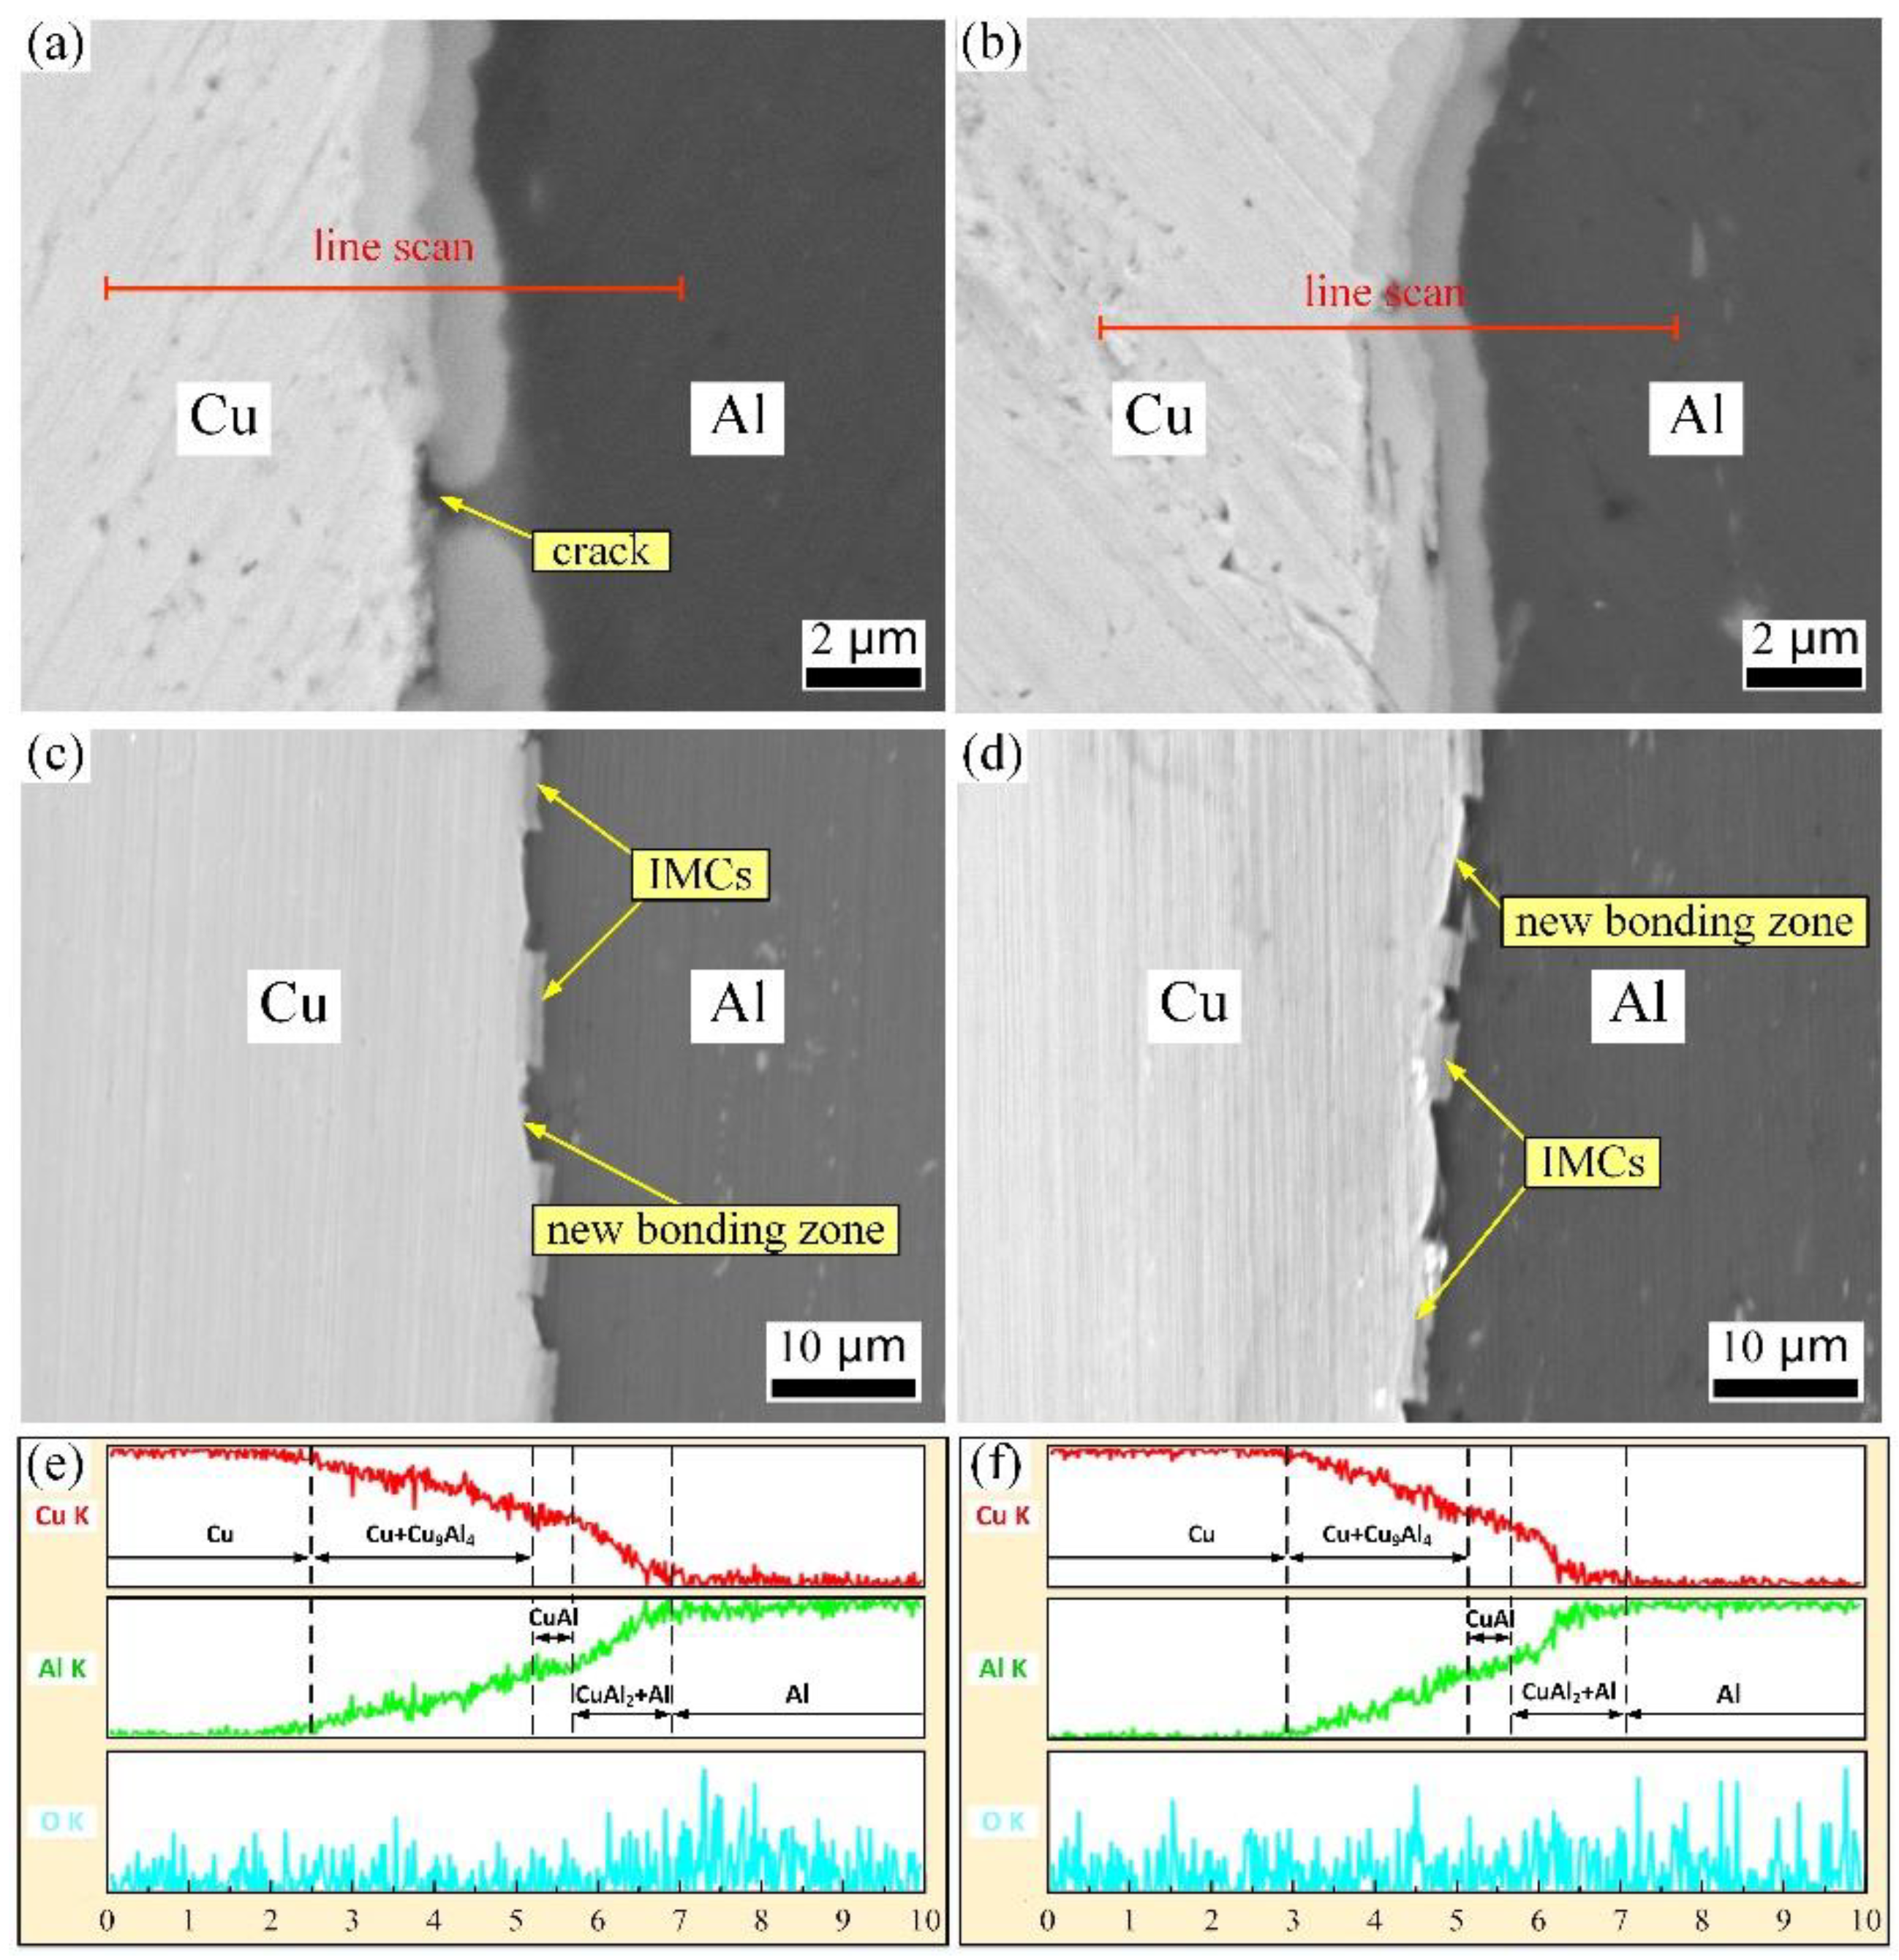
3.1. Interface Microstructure of Cu/Al Clad Plate after CCRB and FRB

The SEM micrographs at peak and trough interfaces of the CCRB Cu/Al clad plates annealed at 350 °C for 60 min are shown in Figure 3a,b. The IMCs layer with an approximately 2.5 μm thickness was formed at the interface, there were cracks at the peak interface, and the thickness of the IMCs layer was not uniform, which was caused by the low interface-bonding rate at the peak position and the obstruction of atomic diffusion in the unbonded zone during the annealing process. The line scan results in Figure 3e,f displayed that three IMCs sub-layers, Cu9Al4, CuAl, and CuAl2, were formed at the interface.
The SEM images at the peak and trough interfaces of the FRB Cu/Al clad plates are shown in Figure 3c,d. It can be seen that the interface IMCs of Cu/Al clad plates were torn after the FRB process, forming the interface morphology of intermittent IMCs and the new bonding zone.

3.2. Interface Structure Evolution after Annealing

According to the Cu-Al binary alloy phase diagram [22], the Cu/Al clad plates were annealed at a temperature of 300–450 °C for 60 min. The SEM images of the annealed interface are exhibited in Figure 4. After annealing at 300 °C for 60 min, the new IMCs (second IMCs layer) with a thickness of approximately 0.68 μm can be observed in the new bonding zone. The thickness of the original IMCs (first IMCs layer) only increased by approximately 0.27 μm, as shown in Figure 4a,e. When the annealing temperature was 350 °C, the thickness of the second IMCs layer obviously expanded to 1.56 μm (Figure 4b,f), whereas the first IMCs layer did not change significantly. This is due to the significant difference in atom concentration on both sides of the new bonding interface zone. Atoms in both sides of the interface preferentially and quickly diffused under the thermal diffusion influence, and the second IMCs layer expanded quickly. The initial annealing treatment had an impact on the first IMCs layer, and the atomic concentration in both sides of the interface had a seamless transition. Therefore, under the “containment effect” of the second IMCs layer, the thickness of the first IMCs layer changed little. The interface IMCs thickness grew significantly and tended to be uniform throughout when the annealing temperature reached 400 °C and 450 °C. The reason for this was that the atoms’ diffusion velocity increased significantly when the temperature increased, the atoms’ concentration gradient at the interface dropped rapidly, and the diffusion behavior at each position gradually tended to be balanced.
In order to clarify the type of the second IMCs layer, a point scan analysis of different IMCs sub-layers at the interface was carried out, as shown in Table 3. When the annealing temperature was 300 °C, the thickness of the second IMCs layer was thin, making it challenging to identify the type of interface IMCs by energy dispersive spectroscopy (EDS) analysis. According to the research of Yuan et al. [23], Cu9Al4 and CuAl2 IMCs sub-layers can most easily be formed at the Cu/Al interface during the annealing process. In particular, Mao et al. [24] observed that the IMCs of the as-cast Cu/Al clad plate interface after annealing at 300 °C for 1 h were Cu9Al4 and CuAl2 phases through the TEM. Therefore, it can be preliminarily judged that the phases of the second IMCs layer in Figure 4a,e were Cu9Al4 and CuAl2. When the temperature exceeded 350 °C, three sub-layers were formed at the interface, which were found to be Cu9Al4, CuAl2, and CuAl by point scan analysis.

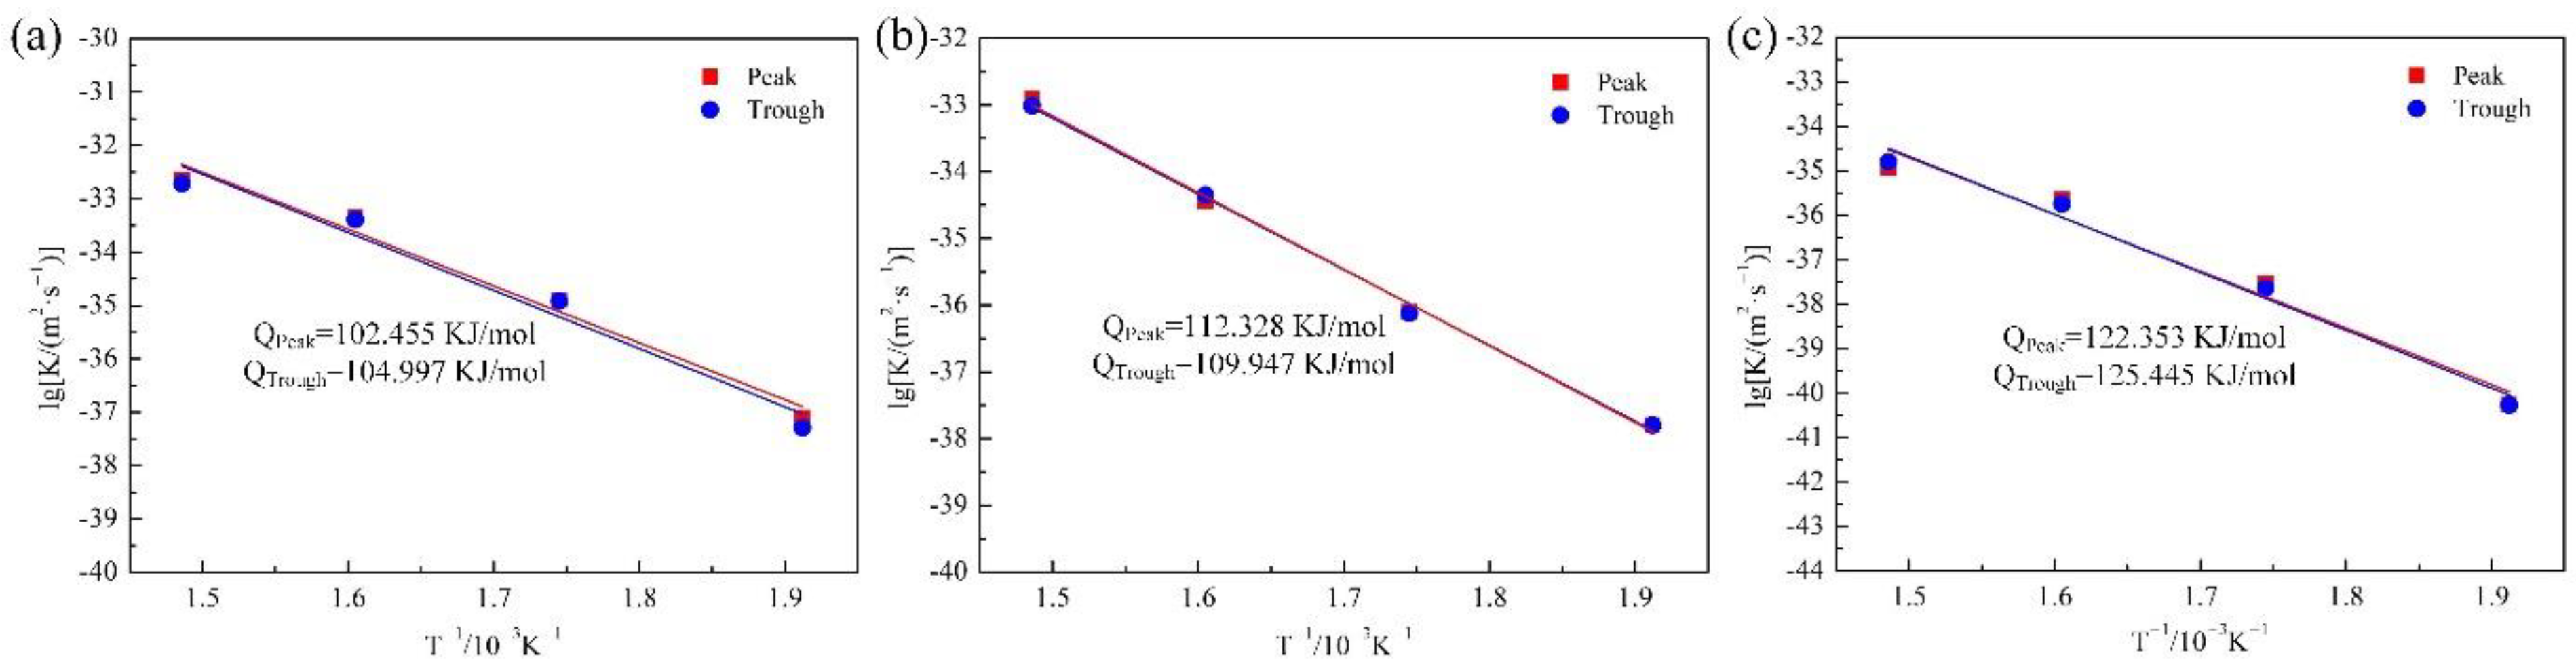
3.3. Growth of Interface IMCs Layer during Annealing

Previous research [6] had shown that the annealing temperature and annealing time were important influencing factors on the interface IMCs growth. Therefore, in this paper, the IMCs layer growth of the Cu/Al clad plate after FRB was systematically studied. The annealing process parameters were as follows: the annealing temperature was 300–450 °C and the annealing time was 30–240 min.
The solid phase transition under the annealing condition of the Cu/Al interface was the result of the mutual diffusion reaction of Cu and Al atoms under thermal action. The relationship between the thickness of each IMCs layer and the annealing time can be expressed by the empirical equation [25]:
d = K t n
where d is the thickness of the intermetallic layer, K is the growth rate constant, n is the time exponent, and t is the annealing time.
Considering that there was an intermittent IMCs layer at the interface before annealing treatment (Figure 3c,d), Equation (1) can be changed to Equation (2).
The thickness of each IMCs layer as a function of the square root of the annealing time (30–240 min) for different temperatures is shown in Figure 5. In general, the solid-state growth of the IMCs layer was either linear or parabolic growth kinetics. According to the previous research [26], the IMCs layer growth law of Cu/Al clad plates annealed at 300–500 °C followed a parabolic growth kinetics. Linear growth meant that the IMCs growth was controlled by the reaction rate. Thus, the value of n can be taken as 1 in Equation (2). Parabolic growth implies that the IMCs growth is controlled by volume diffusion, so n was 0.5 in Equation (2), whereas it can be seen from Figure 5 that the IMCs thickness was a linear function of the square root of the annealing time, implying that the growth of the IMCs layers in this study was controlled by diffusion; thus, the value of n was 0.5 in Equation (2). The calculated value of K through linear regression and the growth rate constants of all IMCs layers are listed in Table 4.
d = K t n + d 0
where d0 is a constant.
According to classical kinetic theory, the activation energies for IMCs growth can be determined by the Arrhenius equation [25]:
K = K 0 exp ( Q R T )
where K is the growth rate constant, K0 is a pre-exponential factor, Q is the reaction activation energy, R is the molar gas constant (8.314 J/(K mol)), and T is the annealing temperature.
According to the information in Table 3, an Arrhenius plot (Figure 6) is created to determine the values of K0 and Q (Table 4). The activation energies calculated for the growth of the Cu9Al4, CuAl2, and CuAl were 112.328 KJ/mol, 102.455 KJ/mol, and 122.353 KJ/mol at the peak position, respectively, and those at the trough position were 109.947 KJ/mol, 104.997 KJ/mol, and 125.445 KJ/mol, respectively. It can be seen that the atoms’ diffusion behavior at the interface between the peak and the trough was less affected by the matrix microstructure. The activation energy at the peak position was only slightly higher than that at the trough. The activation energy sequence of the three IMCs can be expressed by CuAlC > Cu9Al4 > CuAl2. Furthermore, in the previous study of Chen et al. [27], the growth activation energies of CuAl2 and CuAl were 97.5 KJ/mol and 107.85 KJ/mol, respectively, which are slightly lower than the results in this study. This was due to the fact that, at the beginning of the annealing process, the first IMCs layer (Figure 4a,e) had a clear restraint effect on the development of the second IMCs layer (Figure 4b,f)) in the research, causing the growth activation energy of each IMCs layer to be slightly higher than the conventional value.
It is worth noting that, although the data in Figure 6 basically followed the Arrhenius equation, there were certain deviations from the scatter. This is because, when the annealing treatment was below 350 °C, the atoms’ diffusion in the second IMCs layer was greatly affected by the atomic concentration gradient, which limited the diffusion behavior, and the activation energy was improved. In addition, Braunovic et al. [28] found that a single activation energy cannot be used to describe the formation rate of intermetallic phases over the entire temperature range. Evidently, the activation energy was smaller at temperatures below 350 °C than those above 350 °C. The lower activation energy was generally considered to be the result of the short circuits atoms’ diffusion via structural defects such as grain boundaries and dislocations at the interface forming IMCs. The activation energy of the atoms at the interface above 350 °C was usually related to the volume diffusion, which also confirmed the rationality of the existence of scatter points in Figure 5.

3.4. Effect of Annealing Time on Interface Structure and Bonding Properties

Hug et al. [29] displayed that the total thickness of interface IMCs was less than 2 μm, which was beneficial for improving the interface bonding strength. Considering the efficiency of the annealing treatment and the interface bonding performance, the Cu/Al clad plates after FRB were annealed at 350 °C for 10 min, 20 min, 40 min, and 60 min, respectively. Then, the interface structure and bonding property were analyzed.

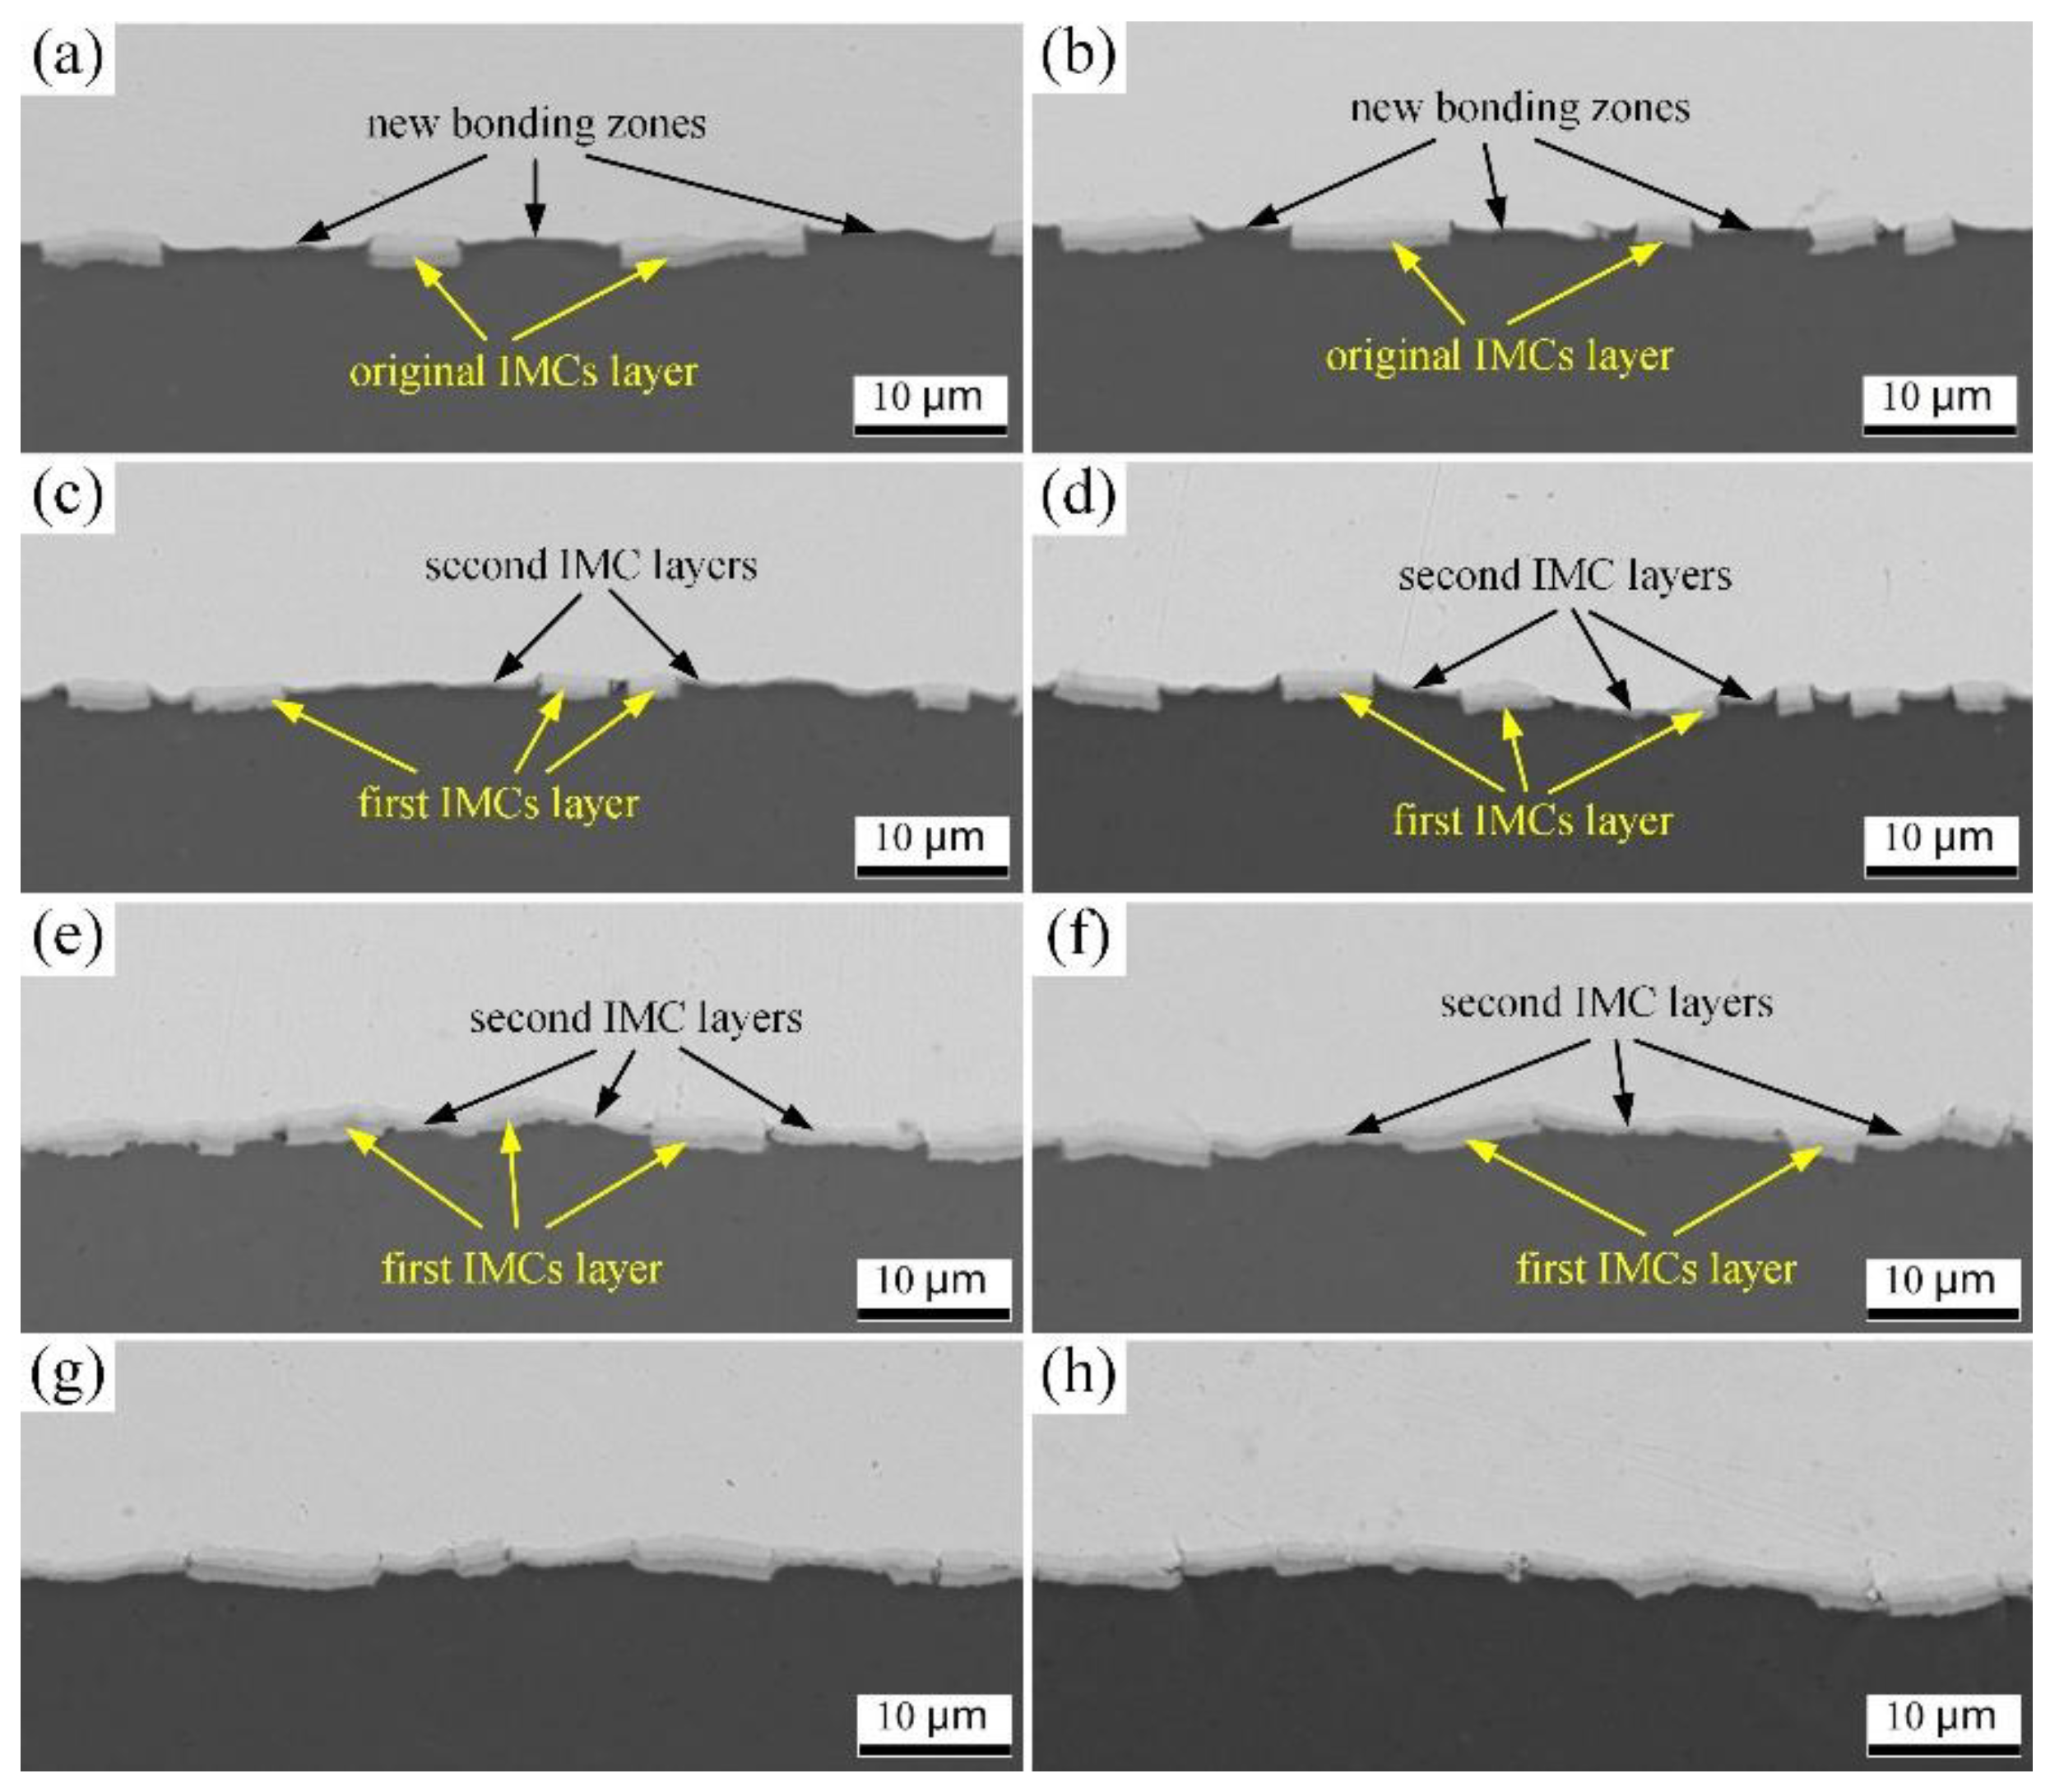
3.4.1. Interface Microstructure Evolution

Figure 7 is the interface SEM images at the peak and trough positions after annealing at 350 °C. It can be seen that, after 10 min annealing, there was no obvious IMCs layer in the new bonding interface zone at the peak and trough, and the thickness of the second IMCs layer did not change significantly. This is because the metal matrix experienced the process of a temperature rise in the early stage of annealing, and the IMCs formation required a certain amount of incubation time, so the mutual diffusion between atoms on both sides of the interface was slow. The diffusion interface was dominated by the formation of solid solutions α-Cu and α-Al, which were conducive to improving the interface bonding strength.
As shown in Figure 7c,d, when the annealing time was 20 min, a small amount of IMCs gradually began to form in the new bonding interface zone, and its thickness was approximately 0.5 μm, whereas the thickness of the first IMCs layer still did not change significantly. With the increase in annealing time, the thickness of the IMCs layer at the whole interface gradually increased. When the annealing time reached 60 min, the interface structure with wide and narrow IMCs layer intervals was formed. Among them, the thickness of the second IMCs layer increased significantly more quickly than that of the first IMCs layer. After 60 min annealing, the thickness of the second IMCs layer increased by approximately 1.6 μm, whereas the thickness of the first IMCs layer only increased by approximately 0.5 μm.

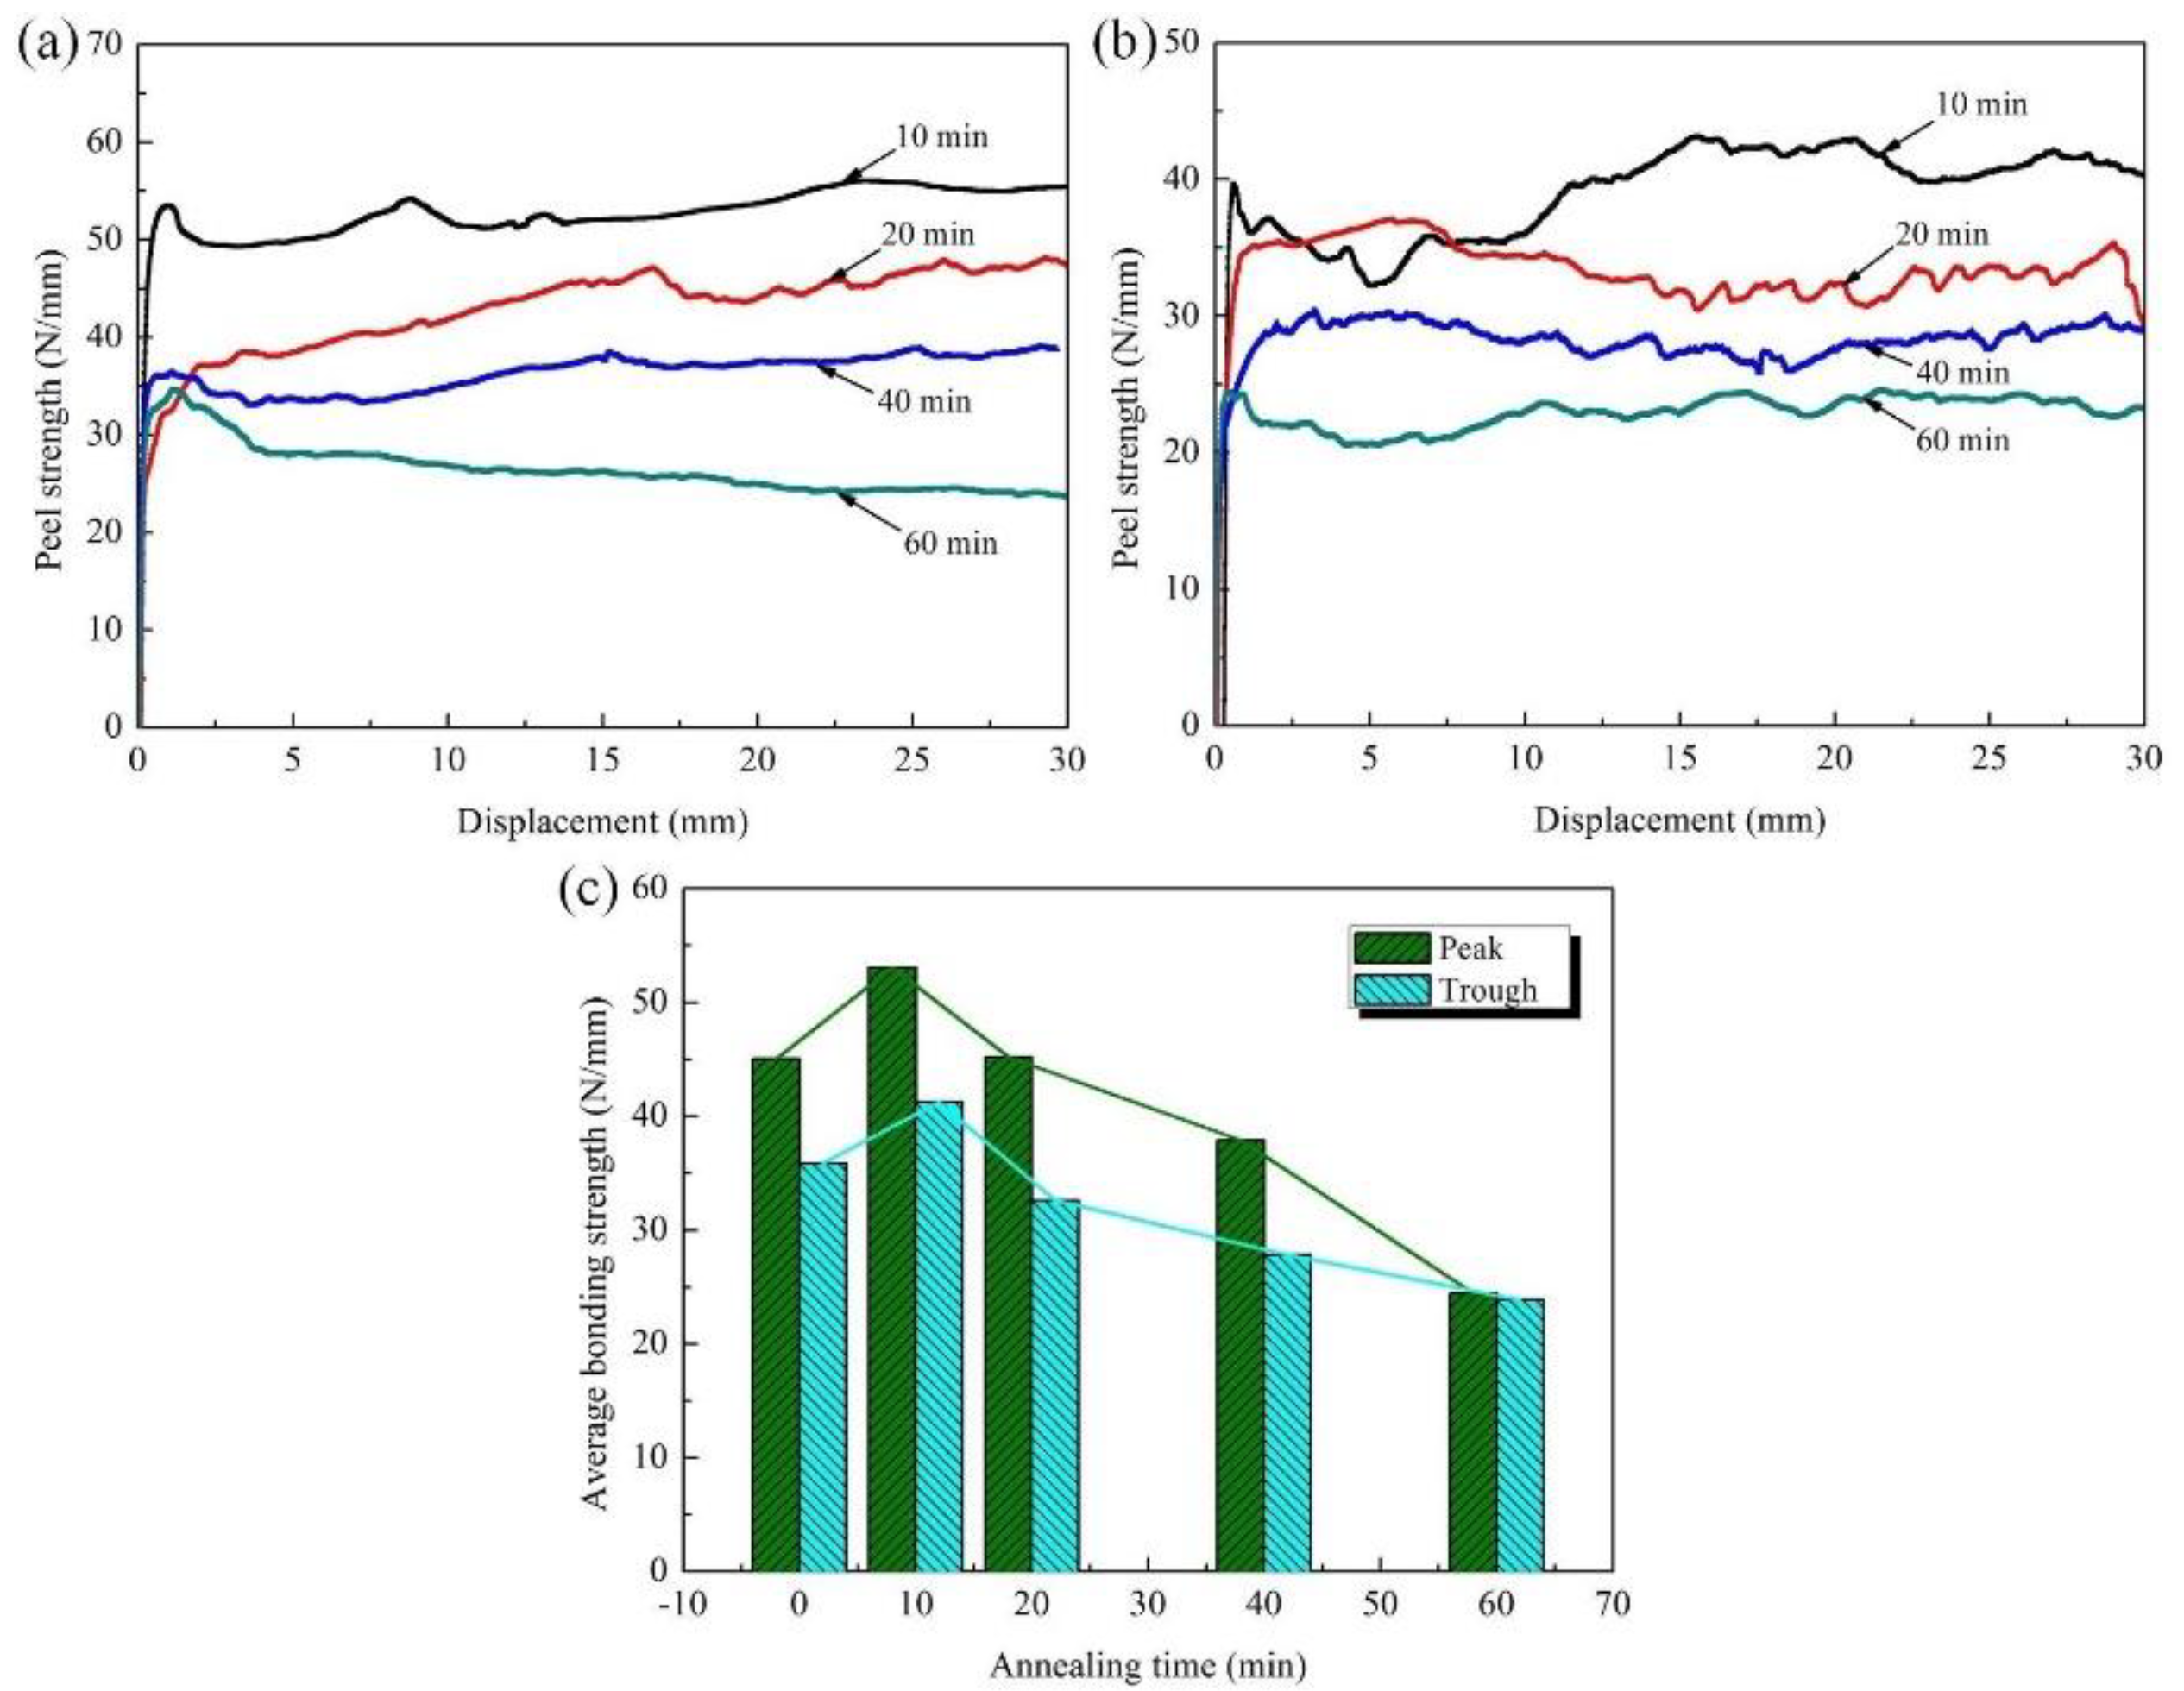
3.4.2. Bonding Performance

The peel samples were cut at the peak and the trough positions of the above annealed Cu/Al clad plates. Figure 8 shows the results of the peel strength test. It can be seen that, when the annealing time was 10 min, the average peel strength of the interface at the peak and wave reached a maximum of 53.07 N/mm and 41.23 N/mm, respectively. It is worth noting that the peel strength at the peak is higher than that at the trough. This is due to the following two reasons: (1) in the FRB stage, the local reduction at the peak is greater than that at the trough, and the bonding properties of the new bonding zones are higher; (2) the new bonding zones has a higher proportion in the whole interface zone at the peak, and contributes more to the bonding strength of the interface. Then, with the increase in annealing time, the average peel strength of the interface gradually decreased.

3.4.3. Microstructure of Peel Surface

Figure 9 and Figure 10 display the micromorphology of the peel sections on both the Cu side and Al side at peak and trough positions after the peel experiment, respectively. The components of each feature position were determined by EDS point scan, and the detection results are shown in Table 5 and Table 6. It can be seen that the morphology of the peek section of the Cu/Al clad plate after various time annealing treatments exhibited significant changes.
When the annealing time was 10 min, the peel sections of the Cu side and Al side showed the coexistence of a ductile Al ridge fracture and brittle IMCs layer fracture, as shown in Figure 9a,b and Figure 10a,b. The ductile Al ridge fracture occurred in the second IMCs layer zones, whereas the brittle fracture occurred in the first IMCs layer zones. At this time, the atoms on both sides of the interface at the second IMCs layer diffused with each other and underwent a solid solution reaction to form a metallurgical bond layer, which can improve the bond strength of this region. However, there was almost no change at the first IMCs layer, which had little impact on the interface combination. Therefore, the interface peel strength was improved.
When the annealing time was 20 min, the peel sections on both Cu and Al sides at the peak and trough position still showed the coexistence of a ductile fracture and brittle fracture, as shown in Figure 9c,d and Figure 10c,d. However, a local brittle fracture appeared at the Al ridge adhered to the Cu side. This is because the diffusion rate of Cu atoms in the Al matrix was higher than that of Al atoms in the Cu matrix, which can lead to the formation of brittle IMCs in the Al matrix. In addition, the fracture occurred near the Al matrix during the peeling process. As a result, the interface peel strength began to decrease.
The brittle fracture region of the Al ridge on the Cu side peel section was further expanded when the annealing time increased to 40 min and 60 min, as shown in Figure 9e,f and Figure 9g,h. In particular, when the annealing time was 60 min, a large number of brittle fracture zones appeared even at the Al ridge on the Al side peel section. This is due to the fact that, as the annealing time increased, the brittle compound layer developed at the interface gradually spreaded to the Al side, causing the fracture toughness of the new interface to significantly decrease. Therefore, the peel strength at the peak and trough of the clad plate was further reduced to 24.45 N/mm and 23.78 N/mm.
Based on the above analysis, it was found that the average peeling strength at the interface appeared to strengthen when the clad plate was annealed at 350 °C for 10 min. However, with the increase in annealing time, the thickness of the IMCs layer generated at the interface gradually increased. The brittle fracture area gradually expanded during the peeling process, and the average peeling strength began to decrease. Therefore, a reasonable annealing treatment of the Cu/Al clad plate can further improve the interface-bonding strength. Additionally, the annealing treatment can reduce the stress and homogenize the microstructure of Cu and Al substrates, which was beneficial to the subsequent processing of the Cu/Al clad plates.

4. Conclusions

(1)
The growth activation energies calculated for the Cu9Al4, CuAl2, and CuAl phases were 112.328 KJ/mol, 102.455 KJ/mol, and 122.353 KJ/mol and 109.947 KJ/mol, 104.997 KJ/mol, and 125.445 KJ/mol at the peak and trough, respectively. Among them, the growth activation energy at the peak position was slightly higher than that at the trough position. The activation energy sequence of the three IMCs was CuAl > Cu9Al4 > CuAl2.
(2)
The formation of the first IMCs layer was significantly restrained at the early stages of annealing by a greater atomic concentration gradient in the new bonding interface area, which caused a slight rise in the IMCs layer’s growth activation energy.
(3)
The maximum average peel strength at the peak and trough interfaces annealing at 350 °C for 10 min reached 53.07 N/mm and 41.23 N/mm, respectively. Furthermore, the average peel strength of the interface gradually decreased as the annealing period was extended, and numerous brittle IMCs layers formed at the interface.

Author Contributions

writing—original draft, L.L.; investigation, G.D.; formal analysis, W.Z.; writing—review and editing, S.L.; writing—review and editing, X.G.; conceptualization, T.W. All authors have read and agreed to the published version of the manuscript.

Funding

This study is financially supported by National Key R&D Program of China (2018YFA0707300); National Natural Science Foundation of China (52075357, 51904205, 52204396); Central Government Guides the Special Fund Projects of Local Scientific and Technological Development (YDZJSX2021A020, YDZX20191400002149); Fundamental Research Program of Shanxi Province (202103021224107).

Data Availability Statement

Not applicable.

Conflicts of Interest

The authors declare no conflict of interest.

References

  1. Mroz, S.; Wierzba, A.; Stefanik, A.; Szota, P. Effect of asymmetric accumulative roll-bonding process on the microstructure and strength evolution of the AA1050/AZ31/AA1050 multilayered composite materials. Materials 2020, 13, 5401. [Google Scholar] [CrossRef] [PubMed]
  2. Kim, I.K.; Hong, S.I. Effect of heat treatment on the bending behavior of tri-layered Cu/Al/Cu composite plates. Mater. Des. 2013, 47, 590–598. [Google Scholar] [CrossRef]
  3. Mo, T.; Chen, Z.; Zhou, Z.; Liu, J.; He, W.; Liu, Q. Enhancing of mechanical properties of rolled 1100/7075 Al alloys laminated metal composite by thermomechanical treatments. Mater. Sci. Eng. A 2021, 800, 140313. [Google Scholar] [CrossRef]
  4. Chen, Z.; Wang, D.; Cao, X.; Yang, W.; Wang, W. Influence of multi-pass rolling and subsequent annealing on the interface microstructure and mechanical properties of the explosive welding Mg/Al composite plates. Mater. Sci. Eng. A 2018, 723, 97–108. [Google Scholar] [CrossRef]
  5. Wu, Y.; Feng, B.; Xin, Y.; Hong, R.; Yu, H.; Liu, Q. Microstructure and mechanical behavior of a Mg AZ31/Al 7050 laminate composite fabricated by extrusion. Mater. Sci. Eng. A 2015, 640, 454–459. [Google Scholar] [CrossRef]
  6. Xu, H.; Liu, C.; Silberschmidt, V.V.; Pramana, S.S.; White, T.J.; Chen, Z.; Acoff, V.L. Behavior of aluminum oxide, intermetallics and voids in Cu–Al wire bonds. Acta Mater. 2011, 59, 5661–5673. [Google Scholar] [CrossRef]
  7. Ghalandari, L.; Mahdavian, M.M.; Reihanian, M. Microstructure evolution and mechanical properties of Cu/Zn multilayer processed by accumulative roll bonding (ARB). Mater. Sci. Eng. A 2014, 593, 145–152. [Google Scholar] [CrossRef]
  8. Abedi, R.; Akbarzadeh, A. Bond strength and mechanical properties of three-layered St/AZ31/St composite fabricated by roll bonding. Mater. Des. 2015, 88, 880–888. [Google Scholar] [CrossRef]
  9. Gao, X.; Bian, L.; Zhao, J.; Han, J.; Wang, T.; Huang, Q. Interface-position-dependent structure evolution and mechanical behavior of corrugated cold rolled Cu/Al clad plate: Experiment and simulation. J. Mater. Res. Technol. 2021, 13, 216–227. [Google Scholar] [CrossRef]
  10. Wang, T.; Wang, Y.; Bian, L.; Huang, Q. Microstructural evolution and mechanical behavior of Mg/Al laminated composite sheet by novel corrugated rolling and flat rolling. Mater. Sci. Eng. A 2019, 765, 138318. [Google Scholar] [CrossRef]
  11. Sheng, L.Y.; Yang, F.; Xi, T.F.; Lai, C.; Ye, H.Q. Influence of heat treatment on interface of Cu/Al bimetal composite fabricated by cold rolling. Compos. Part B-Eng. 2011, 42, 1468–1473. [Google Scholar] [CrossRef]
  12. Wang, T.; Li, S.; Ren, Z.; Han, J.; Huang, Q. A novel approach for preparing Cu/Al laminated composite based on corrugated roll. Mater. Lett. 2019, 234, 79–82. [Google Scholar] [CrossRef]
  13. Chang, D.; Wang, P.; Zhao, Y. Effects of asymmetry and annealing on interfacial microstructure and mechanical properties of Cu/Al laminated composite fabricated by asymmetrical roll bonding. J. Alloys Compd. 2020, 815, 152453. [Google Scholar] [CrossRef]
  14. Luo, C.; Liang, W.; Chen, Z.; Zhang, J.; Chi, C.; Yang, F. Effect of high temperature annealing and subsequent hot rolling on microstructural evolution at the bond-interface of Al/Mg/Al alloy laminated composites. Mater. Charact. 2013, 84, 34–40. [Google Scholar] [CrossRef]
  15. Chen, C.Y.; Chen, H.L.; Hwang, W.S. Influence of interfacial structure development on the fracture mechanism and bond strength of aluminum/copper bimetal plate. Mater. Trans. 2006, 47, 1232–1239. [Google Scholar] [CrossRef] [Green Version]
  16. Heness, G.; Wuhrer, R.; Yeung, W.Y. Interfacial strength development of roll-bonded aluminium/copper metal laminates. Mater. Sci. Eng. A 2008, 483–484, 740–742. [Google Scholar] [CrossRef]
  17. Wang, T.; Gao, X.Y.; Zhang, Z.X.; Ren, Z.K.; Qi, Y.Y.; Zhao, J.W. Interfacial bonding mechanism of Cu/Al composite plate produced by corrugated cold roll bonding. Rare Metals 2021, 40, 1284–1293. [Google Scholar] [CrossRef]
  18. Topolski, K.; Szulc, Z.; Garbacz, H. Microstructure and properties of the Ti6Al4V/Inconel 625 bimetal obtained by explosive joining. J. Mater. Eng. Perform. 2016, 25, 3231–3237. [Google Scholar] [CrossRef] [Green Version]
  19. Srinivasan, R.; Karthik Raja, G. Experimental study on bending behaviour of aluminium-copper clad sheets in V-bending process. Mech. Ind. 2019, 20, 618. [Google Scholar] [CrossRef] [Green Version]
  20. Chen, C.; Ni, P.Y.; Jonsson, L.T.I.; Tilliander, A.; Cheng, G.G.; Jönsson, P.G. A Model Study of Inclusions Deposition, Macroscopic Transport, and Dynamic Removal at Steel–Slag Interface for Different Tundish Designs. Metall. Mater. Trans. B 2016, 47, 1916–1932. [Google Scholar] [CrossRef]
  21. Chen, C.; Cheng, G.G. Delta-ferrite distribution in a continuous casting slab of Fe-Cr-Mn austenitic stainless steel. Metall. Mater. Trans. B 2017, 48, 2324–2333. [Google Scholar] [CrossRef]
  22. Han, Y.Q.; Ben, L.H.; Yao, J.J.; Wu, C.J. Microstructural characterization of Cu/Al composites and effect of cooling rate at the Cu/Al interfacial region. Int. J. Miner. Metall. Mater. 2015, 22, 94–101. [Google Scholar] [CrossRef]
  23. Yuan, X.G.; Lv, L.; Huang, H.J.; Zuo, X.J.; Liu, H. Effect of diffusion heat treatment on thickness of cold-rolled Cu/Al composite laminate interface. Appl. Mech. Mater. 2013, 310, 112–116. [Google Scholar] [CrossRef]
  24. Mao, Z.; Xie, J.; Wang, A.; Wang, W.; Li, Y.; Ma, D. Interfacial microstructure and bonding strength of copper/aluminum clad sheets produced by horizontal twin-roll casting and annealing. Mater. Res. Express. 2018, 6, 016505. [Google Scholar] [CrossRef]
  25. Zhang, J.; Wang, B.H.; Chen, G.H.; Wang, R.M.; Miao, C.H.; Zheng, Z.X.; Tang, W.M. Formation and growth of Cu–Al IMCs and their effect on electrical property of electroplated Cu/Al laminar composites. Trans. Nonferr. Metal. Soc. 2016, 26, 3283–3291. [Google Scholar] [CrossRef]
  26. Lee, W.B.; Bang, K.S.; Jung, S.B. Effects of intermetallic compound on the electrical and mechanical properties of friction welded Cu/Al bimetallic joints during annealing. J. Alloys Compd. 2005, 390, 212–219. [Google Scholar] [CrossRef]
  27. Chen, C.Y.; Hwang, W.S. Effect of annealing on the interfacial structure of aluminum-copper joints. Mater. Trans. 2007, 48, 1938–1947. [Google Scholar] [CrossRef] [Green Version]
  28. Braunovic, M.; Alexandrov, N. Intermetallic compounds at aluminum-to-copper electrical interfaces: Effect of temperature and electric current. IEEE. Trans. Compon. Packag. Manuf. Technol. Part A 1994, 17, 78–85. [Google Scholar] [CrossRef]
  29. Hug, E.; Bellido, N. Brittleness study of intermetallic (Cu, Al) layers in copper-clad aluminium thin wires. Mater. Sci. Eng. A 2011, 528, 7103–7106. [Google Scholar] [CrossRef]
Figure 1. The schematic diagram of CFR technique.
Metals 12 01995 g001
Figure 2. The positions and specifications of the peel test samples.
Metals 12 01995 g002
Figure 3. SEM images of the Cu/Al clad plates: (a,c) at peak, (b,d) at trough, (a,b) by CCRB, (c,d) by FRB; (e) and (f) are the EDX line scanning results along the line in (a) and (b), respectively.
Metals 12 01995 g003
Figure 4. Interface SEM images with different annealing temperature: (a,e) 300 °C, (b,f) 350 °C, (c,g) 400 °C, (d,h) 450 °C; (ad) peak, (eh) trough, annealing time: 60 min.
Metals 12 01995 g004
Figure 5. Function of intermetallic sub-layer thickness and annealing time.
Metals 12 01995 g005
Figure 6. Arrhenius plot for the growth rate of the intermetallic layer: (a) CuAl2, (b) Cu9Al4, (c) CuAl.
Metals 12 01995 g006
Figure 7. Interface SEM images with different annealing times: (a,b) 10 min, (c,d) 20 min, (e,f) 40 min, (g,h) 60 min; (a,c,e,g) peak, (b,d,f,h) trough.
Metals 12 01995 g007
Figure 8. Plots of peel strength versus the displacement at (a) peak and (b) trough; (c) statistical diagram of average peel strength.
Metals 12 01995 g008
Figure 9. SEM images of peeling section at peak: (a,b) 10 min, (c,d) 20 min, (e,f) 40 min, (g,h) 60 min; (a,c,e,g) Cu side, (b,d,f,h) Al side.
Metals 12 01995 g009
Figure 10. SEM images of peeling section at trough: (a,b) 10 min, (c,d) 20 min, (e,f) 40 min, (g,h) 60 min; (a,c,e,g) Cu side, (b,d,f,h) Al side.
Metals 12 01995 g010
Table 1. Chemical composition of T2 Cu and 1060 Al (wt.%).
Component PlateCuAlTiBiSbAsFeSnSSi
T2Cu>99--0.0010.0020.0020.0080.0080.005-
1060Al->99.610.013---0.26--0.08
Table 2. The mechanical properties of raw T2 Cu and 1060 Al.
Component PlateHardness (VHN)Yield Strength (MPa)Elongation (%)
T2Cu869030.93%
1060Al417925.29%
Table 3. The element contents of Cu and Al by element point scanning at point 1–20 (wt%).
ElementPoint 1Point 2Point 3Point 4Point 5Point 6Point 7Point 8Point 9Point 10
Cu39.4562.5648.5934.8467.3751.9437.8268.3547.9238.67
Al60.5537.4451.4165.1632.6348.0662.1831.6552.0861.33
ElementPoint 11Point 12Point 13Point 14Point 15Point 16Point 17Point 18Point 19Point 20
Cu42.8464.3450.1632.5764.9153.5831.4966.8251.9534.55
Al57.1635.6649.8467.4335.0946.4268.5133.1848.0565.45
Table 4. Calculated growth rate constants.
PositionTemperature (°C)IMCK (m2/s)PositionTemperature (°C)IMCK (m2/s)
Peak300CuAl27.68 × 10−17Trough300CuAl26.39 × 10−17
Cu9Al43.83 × 10−17Cu9Al43.83 × 10−17
CuAl3.26 × 10−18CuAl3.26 × 10−18
350CuAl26.98 × 10−16350CuAl26.85 × 10−16
Cu9Al42.08 × 10−16Cu9Al42.05 × 10−16
CuAl5.03 × 10−17CuAl4.48 × 10−17
400CuAl23.29 × 10−15400CuAl23.16 × 10−15
Cu9Al41.11 × 10−15Cu9Al41.21 × 10−15
CuAl3.30 × 10−16CuAl2.98 × 10−16
450CuAl26.66 × 10−15450CuAl26.18 × 10−15
Cu9Al45.09 × 10−15Cu9Al44.59 × 10−15
CuAl6.71 × 10−16CuAl7.68 × 10−16
Table 5. The element contents of Cu and Al by point scanning of peeled section at peak (wt%).
ElementPoint aPoint bPoint cPoint dPoint ePoint fPoint gPoint h
Cu sideCu3.4866.3625.3365.3117.6764.5878.3659.32
Al96.5233.6474.6734.6982.3335.4221.6440.68
ElementPoint iPoint jPoint kPoint lPoint mPoint nPoint oPoint p
Al sideCu2.6443.617.6448.4123.4548.678.4735.78
Al97.3656.3992.3651.5976.5541.3391.5364.22
Table 6. The element contents of Cu and Al by point scanning of peeled section at trough (wt%).
ElementPoint APoint BPoint CPoint DPoint EPoint FPoint GPoint H
Cu sideCu5.6261.8825.4141.8630.2952.6122.3748.62
Al94.3838.1274.5958.1469.7147.3977.6351.38
ElementPoint IPoint JPoint KPoint LPoint MPoint NPoint OPoint P
Al sideCu5.3736.7616.3442.1822.3142.8520.3854.86
Al94.6363.2483.6657.8277.6957.1579.6245.14
Publisher’s Note: MDPI stays neutral with regard to jurisdictional claims in published maps and institutional affiliations.

