Article

Influence of Hot Top Height on Macrosegregation and Material Yield in a Large-Size Cast Steel Ingot Using Modeling and Experimental Validation

1
Department of Mechanical Engineering, École de Technologie Supérieure, 1100 Notre-Dame St W, Montreal, QC H3C 1K3, Canada
2
Finkl Steel—Sorel, 100 McCarthy, Saint-Joseph-de-Sorel, QC J3R 3M8, Canada
*
Author to whom correspondence should be addressed.
Metals 2022, 12(11), 1906; https://doi.org/10.3390/met12111906
Submission received: 15 October 2022 / Revised: 3 November 2022 / Accepted: 4 November 2022 / Published: 7 November 2022

Abstract

:
The effect of the hot top height on the formation of positive and negative macrosegregation patterns, the ingot quality, and the material yield during solidification of a 12 MT cast ingot made of a Cr-Mo-low alloy steel was investigated. A 3D numerical simulation of the process was conducted using finite element modeling. A full-size 12 MT ingot was cut off from its center in the longitudinal direction, and a large cross-section was sliced into small samples. The chemical mapping of all the elements in the steel composition was obtained for all samples and compared with the model predictions for validation purposes. The influence of the increase in hot top height on the liquid metal velocity field, size and shape of vortexes, cooling rate of the liquid, and liquidus temperature was determined. Results revealed that increasing the hot top height by 165 mm increased the solidification time, fluid velocity in regions including the hot top and ingot bottom, and decreased the local liquidus temperature. The combination of all the above resulted in an overall decrease in positive and negative macrosegregation of more than 6% and an increase in ingot quality. The results are interpreted based on the interactions between the transport of solute and heat coupled with the flow driven by thermo-solutal convection and shrinkage-induced flow.

1. Introduction

Ingot casting is the primary process used to produce heavy mono-block forging high-strength steels. The energy, transport, and machinery industries are the main users of such heavy blocks, which are ultimately machined into power transmission shafts or dies for forming processes [1,2]. Typically, ingot-cast products suffer from various defects occurring during the casting and solidification processes [3,4,5]. Macrosegregation, defined as the non-uniform distribution of alloying elements over several centimeters, is one of the major defects that can occur during solidification. Microstructural heterogeneities that arise from macrosegregation can be so severe that eliminating them becomes impossible, even after long homogenization heat treatments and they deteriorate the mechanical properties of the final product [6,7,8]. Identifying the possible sources of macrosegregation, such as alloy composition, ingot mold geometry, casting parameters, and their optimization can help minimize its severity. This, in turn, allows the production of large-size ingots with minimum macrosegregated zones, which can be eliminated using appropriate heat treatment operations.
Because of the significant costs and complications associated with experimental trials in heavy ingots, most of the efforts when investigating macrosegregation in large-size ingots have thus far been devoted to developing numerical models [6,9,10]. Moreover, because of the multiphase formation process and complicated interactions within the different phases, the formation mechanism employed when casting defects is extremely complex. Modeling research and large ingot casting numerical simulations are recognized as the most economical method in this regard [11]. Furthermore, most of the available data in the field pertains to the influence of casting parameters on macrosegregation severity. This influence further breaks down into how the filling rate affects positive macrosegregation [12], the influence of melt initial superheat on the macrosegregation pattern [13], and the influence of alloy composition, including Mn, on the macrosegregation of carbon [14]. However, in the publications referenced above, the influence of ingot mold characteristics on macrosegregation severity, ingot quality, and material yield is not jointly addressed.
Cast ingot setups generally consist of different distinct parts, namely the mold, the hot top, the sideboard, the riser, the runner, and the trumpet. Among these, the hot top plays the most important role. It is located on the upper part of the mold and includes sideboards on the sidewalls and a topping compound or board at the very top of the ingot. The hot top serves mainly to provide continuous feeding during casting, control the heat flow at the top of the ingot during solidification, and provide a region where segregates and non-metallic inclusions can gather [15]. Thus, any changes in the characteristics of the hot top will significantly affect the feeding of the ingot body [16], the redistribution of solute-enriched interdendritic liquid [17], and, therefore, the macrosegregation severity during solidification.
Because of its importance, extensive research has been conducted on how the hot top’s characteristics impact the ingot quality. Specifically, Kumar et al. [18] studied the influence of insulating refractory material present in the hot top of a 6.2 MT ingot on the heat transfer, macrostructure, and macrosegregation of a steel grade with a nominal carbon composition of 1.01 (wt.%). They found that using an exothermic refractory material increased the number of nuclei and affected the heat transfer in the mold, in the ingot adjacent to the refractory material, and below the hot top zone. These led to finer axial grain structure with more globular grain morphology and more axial macrosegregation. Furthermore, Tashiro et al. [17] studied the influence of mold and hot top design on the solidification rate and the central porosity formation in large steel ingots using finite element modeling. They reported that insulation or the hot top heat capacity reduction itself do not lead to an improvement of the solidification characteristics, and that the ingot body shape has a more significant effect. Kermanpur et al. [19] studied the influence of the shape and height of the insulation material in the hot top on the solidification behavior of a 6 MT ingot made of a Cr-Mo low carbon steel. They proposed a circular hot top shape. They further suggested that a lower slenderness ratio (the ratio of the height of the ingot body relative to the average diameter of the ingot body) increases vertical solidification and reduces transverse solidification in the hot top region, resulting in a higher riser efficiency. Wang et al. [16] reported that shrinkage porosity elimination in 100 MT 30Cr2Ni4MoV steel ingot was influenced by an increase in the hot top mass ratio, a reduction of the hot top taper, a better thermal insulation material in the hot top, preheating of the hot top, and the addition of insulation bricks in the hot top. Scepi [20] reported that the hot top mass ratio of the ingot should be no less than 23% and that the slenderness ratio H/D should be less than 1.3 to improve the quality of heavy forging ingots. In contrast, Zhao [21] reported an increase in the centerline macroporosity, a reduction in A-segregation, and a move up in the position of the shrinkage porosity by increasing the slenderness ratio H/D. The author proposed a slenderness ratio H/D of 1.4 for an ingot of 96 MT and reported that the relationship between the slenderness ratio H/D and ingot quality is not linear.
As mentioned above, most research has focused on the influence of hot top characteristics, on the degree of porosity and solidification shrinkage defects. A far smaller body of work has been dedicated to examining the effects of the hot top on macrosegregation. Even fewer studies have analyzed the influence of hot top characteristics on material yield, focusing on macrosegregation, porosity, and shrinkage cavity.
In the present work, the influence of the hot top height and mass ratio (ratio of the weight of the hot top melt to the total weight of the melt) on the quality and material yield of a 12 MT ingot made of high-strength steel used in the energy and transportation industries was investigated. 3D Finite Element Modeling (FEM) simulation was used to predict the influence of changes in hot top height on cooling rate, solidification time, and macrosegregation. Experimental work that examined the chemical composition and the evolution of the micro and macrostructure of both the hot top and the ingot body was conducted to validate the simulation model. Additionally, industrial casting results, such as those for the solidification time and depth of the shrinkage cavity, were compared with the predicted ones to further verify the validity of the model.

2. Experimental Procedure

A 12 MT polygonal shape steel ingot was produced using a bottom pouring system in a cast iron mold. The ingot was about 2000 mm in height and had a 1266 mm top diameter and a 1000 mm bottom diameter. The hot top was 381 mm high and was lined with 177 mm high insulating tiles (Figure 1). In the manufacturing process, molten steel of the selected alloy (modified AISI 4130), with the initial chemical composition reported in Table 1, was supplied by melting a charge of a scrap of solid steel material in an electric arc furnace and refined using a ladle metallurgy furnace and the vacuum degassing technique. Afterward, the prepared molten metal was bottom-teemed for 26 min in the mold at 1580 °C through trumpet and runner until complete filling of the mold up to the top of the insulating tiles. The materials software JMatPro® version 11.0 [22,23] was used to obtain the liquidus temperature (1502 °C) of the investigated material. Superheat, the extra temperature upper the melting point, was 78 °C. Two exothermic caps were used as the source of heat generation.
When solidification was complete, a longitudinal section of the whole ingot (including both the body and hot top) was cut off from the center (Figure 2a), and two slices were sawed off from each facing side (Figure 2b). One of the plates was sliced into 10 smaller blocks, and their axial face was etched in a 50% HCl-50% H2O solution at 50 °C to disclose patterns of macrosegregation (Figure 2c). Another plate was divided in ordered spaced distances into 370 samples (Figure 2d), and all the samples were then sanded. Thermo Scientific the ARLTM 4460 Optical Emission Spectrometer (Thermo Fisher Scientific Inc., Waltham, MA, USA) was used to determine the chemical composition of all samples. Each specimen was chemically measured in 3 randomly selected locations, and the average value was used to calculate segregation ratios using the following formula [12,24]:
Ri = (wiw0i)/w0i
where Ri represents the segregation ratio of solute element i, wi is the local concentration of solute, and w0i is its initial concentration. A positive Ri value indicates a positive segregation, and inversely, a negative Ri value is a negative segregation. It was difficult to conduct exact chemical analyses in regions close to the edge of the ingot wall due to sample cutting and the edge effect in the spectrometer. Therefore, the chemical composition measured at the edge of the samples may not be as accurate as in other points. MATLAB® (The MathWorks Inc., Natick, MA, USA) [25] was used to reconstruct the patterns of the segregation ratio of variant elements on the entire surface of the longitudinal section. This was done by applying fixed colors in the zones between the isolines, according to the intensities of local segregation.

3. Model Establishment

In this study, the mold filling and solidification processes of the 12 MT were simulated using the commercial FEM casting simulation software THERCAST® in three dimensions, based on the volume-averaged two-phase solidification model [23]. The solidification model is based on a multidomain decomposition of the solidification system. Each subdomain (mold, hot top, ingot, etc.) is described by an independent finite element mesh [26]. For solidification modeling, thermal and thermal-mechanical models are used in the FEM code.
During solidification, the metal transits through three distinct states, namely, the liquid state, the mushy state, and the solid-state [23,26,27]. Therefore, a hybrid constitutive model comprised of thermo-Newtonian behavior (Navier–Stokes equation with temperature-dependent terms) for the liquid phase, non-Newtonian fluid obeying a thermo viscoplastic behavior for the mushy zone, and a thermo elasto-viscoplastic behavior for the solid phase must be considered for FEM simulation purposes [26,27]. Specifically, the Navier–Stokes equation and continuity equations with heat transfer associated with all three modes of heat transfer are solved for assessing the fluid flow behavior, the rate of temperature drops, and the solid fraction growth. In the mushy zone, approximated as a single continuum, a coherency temperature at which the solid formation support stresses is used as a distinct boundary between liquid and solid behaviors. Thermodynamic equilibrium is assumed at the solid-liquid interface, and a Norton-Hoff type thermo-viscoplastic behavior [23] was considered for the temperature ranges above the coherency temperature. Below the coherency temperature, a thermos-elasto-viscoplastic constitutive behavior based on the Perzyna law [23] was considered. At the interfaces of various subdomains, a Fourier-type equation was used with an appropriate evaluation of contact resistance.
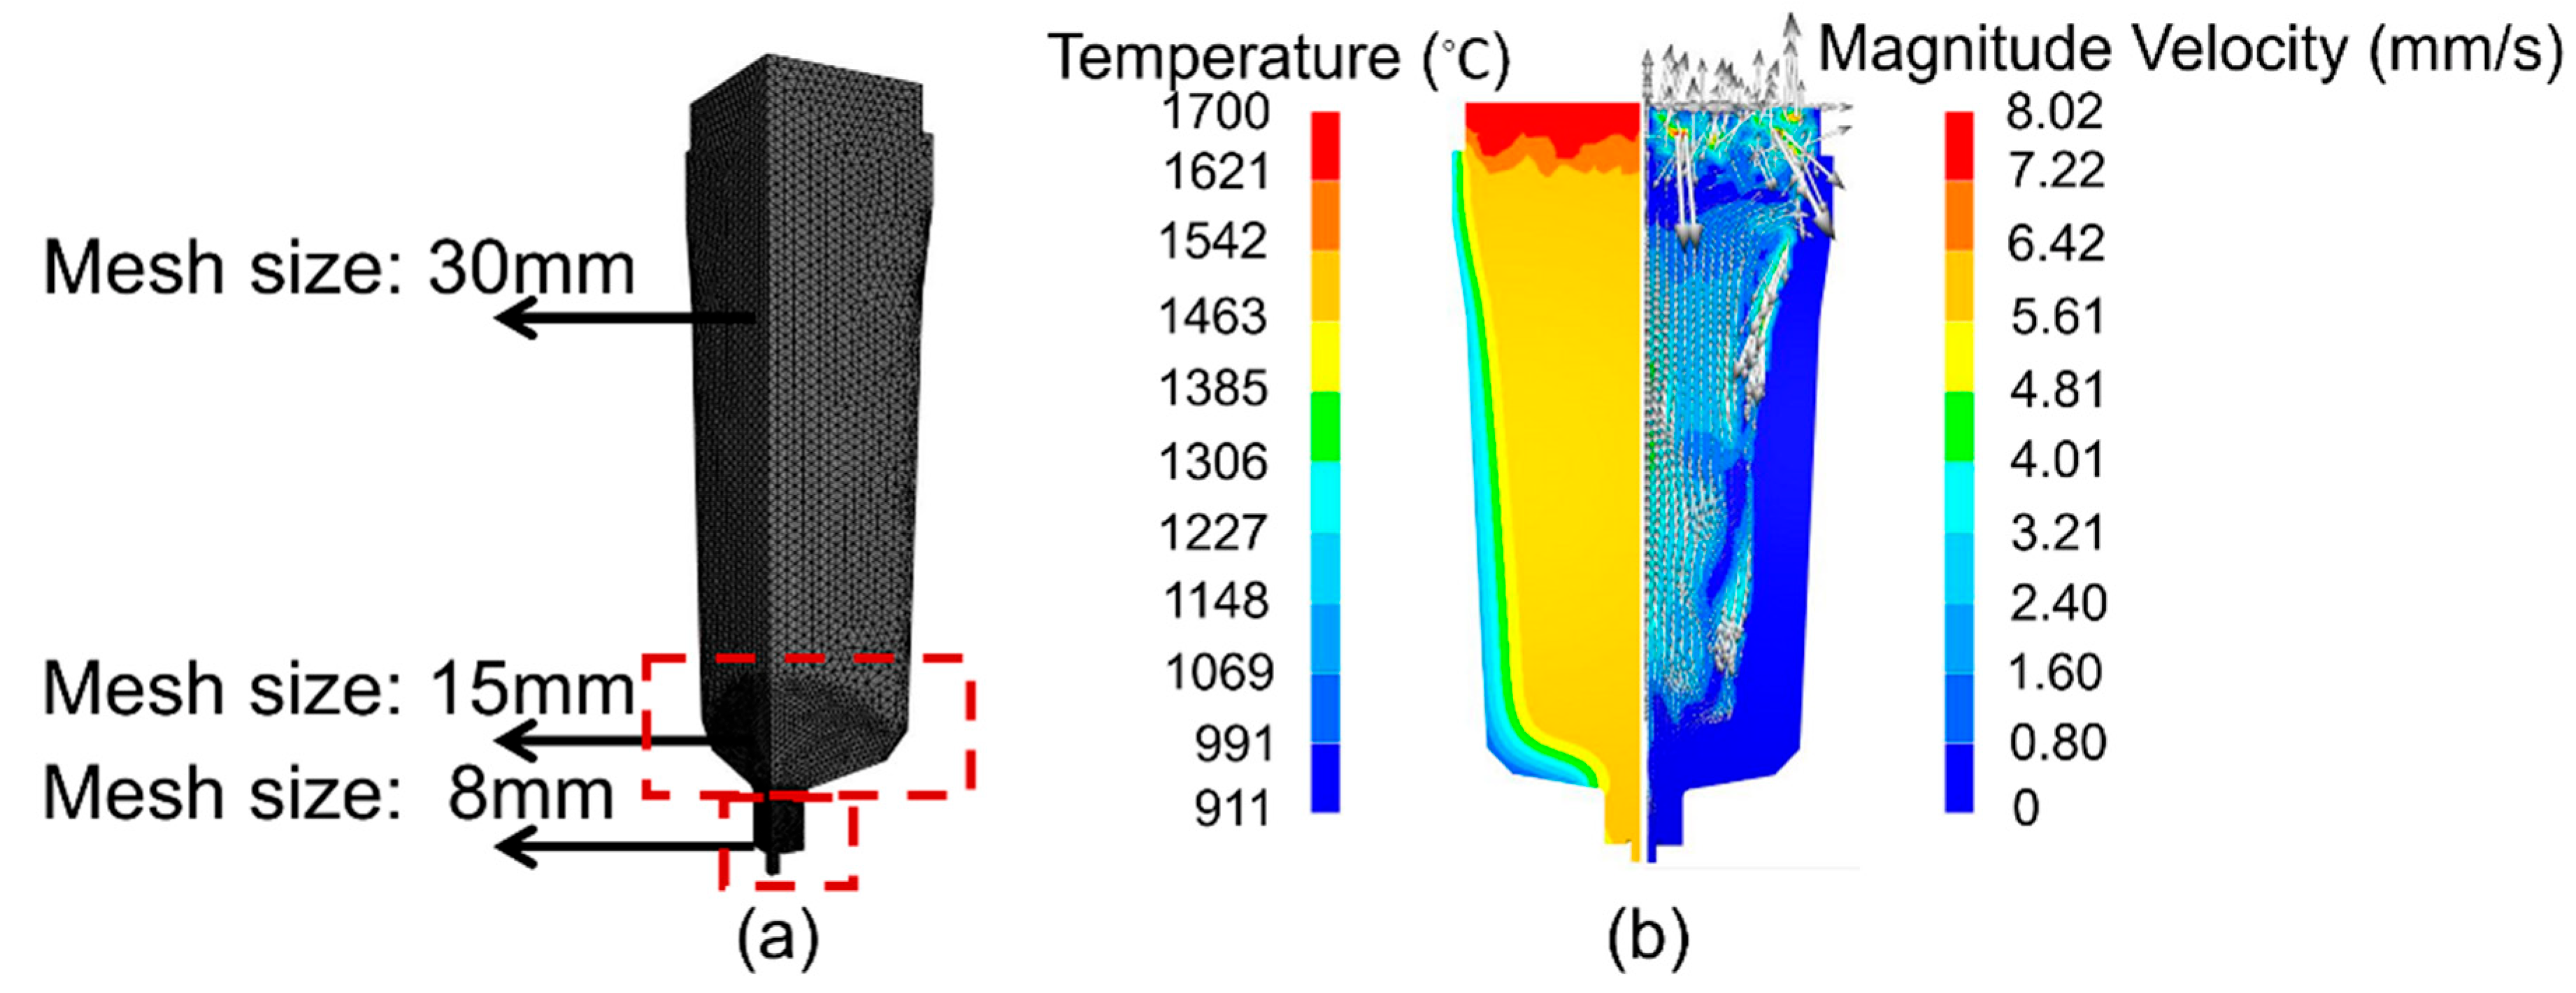
Thermal resolution consists in resolving the heat equation for each of the sub-domains with boundary conditions such as convection, radiation, imposed temperature, interface exchanges, and imposed flux. Primary or secondary shrinkage is estimated based on a loss of volume in the metal during an increment in thermal computation. Thermomechanical computation is carried out in the solidifying metal following thermal computation [26]. An Arbitrary Lagrangian-Eulerian (ALE) formulation is used for the 3D finite element thermal-mechanical solver [27,28]. The thermal convection in the molten metal pool and the mushy state, the metal volume, and the mass change in the mold during the filling phase are computed by an Arbitrary Lagrangian-Eulerian (ALE) formulation. Finally, a pure Lagrangian approach is employed for calculating the deformation in the solidified regions [23,29]. To reduce the computational cost, sedimentation and the deformation of the mold were not considered in the modeling. However, as reported in [1,23,30], these simplifying assumptions did not affect the accuracy of the model in predicting the macrosegregation intensity. The geometrical model of the mold and the hot top was built using ANSYS WORKBENCH®. Due to symmetry, a 90° geometry of the model was used for the FEM simulations to decrease the simulation time. For the spatial discretization of the ingot and the components of the mold, 746,196 three-dimensional linear tetrahedral elements were used. An average mesh size of 30 mm with a 15 mm and 8 mm mesh refinement was chosen based on preliminary prior mesh size optimization analysis (Figure 3a). The flow rate of the molten was constant from the beginning to the end of filling and was calculated to be 265,385 mm3/s for the 90° symmetry. The total energy released after igniting the two exothermic caps before the end of filling was 72 MJ. The initial input data, such as pouring time and the volume of the ingot for calculating the flow rate, and the chemical composition of the cap for calculating the ignition energy were obtained from the industrial partner [31]. Figure 3b illustrates the evolution of the temperature (left side) and liquid metal velocity (right side) at the end of the filling process. The results show that once the mold filling is complete, the exothermic cap comes into contact with the molten metal. This results in the ignition of the cap and induces a temperature increase. Specifically, the temperature of the molten metal 53 mm below the hot top surface raised to 1696 °C.
Finally, it must be noted that to increase the accuracy of the obtained results, all the thermomechanical, thermodynamic, and thermodiffusion characteristics used as input parameters in the macrosegregation model were temperature-dependent. The thermophysical properties and initial conditions of all other materials are presented in Table 2. They were obtained from the JMatPro® version 11.0 software [22], the THERCAST® material database [32], the literature [29], or the industry [31]. Thermomechanical properties and thermodiffusion calculations were obtained from the THERCAST® material database [32].

4. Results and Discussions

4.1. Validation of the Model

The solidification of steel alloys is a complex phenomenon, and many parameters influence the solidification process and macrosegregation behaviors during ingot casting. Therefore, it is critically important to validate the numerical macrosegregation model before analyzing the influence of different process variables. In this study, the following approach was used to validate the 12 MT ingot model: (i) Process information data such as pouring temperature, mold temperature, filling time, and geometrical dimensions of the ingot mold components were measured on the site during the casting operation; (ii) As mentioned above, precise initial calculation parameters were obtained from JMatPro® version 11.0 calculations, the THERCAST® material database, the literature, or industry; (iii) The total solidification time and the depth of the shrinkage cavity at the hot top were experimentally measured and compared with the simulation results; (v) The simulated macrosegregation pattern was compared to the experimental ones obtained for the sliced 12 MT ingot in industry.
The predicted solidification time was 5 h and 11 min after the simulation of the 12 MT ingot, while the actual solidification time in the industry was reported to be less than 6 h. Thus, there was an acceptable agreement between the predicted and real results.
During the solidification, there is a decrease in temperature, an increase in density, and a decrease in the volume of the metal. The most important volume decrease occurs on the top of the ingot as a shrinkage cavity [33]. The depth of the shrinkage cavity relative to the highest edge of the ingot wall was measured experimentally and numerically. As shown in Figure 4a, the simulation result gave a value of 80 mm, while measurements on an actual ingot in the industry gave 76.4 mm (Figure 4b). The error percentage between the simulation and the experimental results for the depth of the shrinkage cavity was less than 5%, demonstrating a close agreement between the model prediction and the industrial result.
Furthermore, the volume-averaged two-phase solidification model was verified by comparing the simulation and experimental results of carbon macrosegregation patterns of the investigated 12 MT steel ingot. As shown in Figure 5a, the predicted typical macrosegregation pattern, including the conic negative macrosegregation in the bottom area, the positive macrosegregation in the top area, and the solute-enriched area between the center and ingot wall, correspond well to the experimental results (Figure 5b).
The carbon macrosegregation ratio was measured in the radial direction at the top of the ingot (Figure 6a), at the bottom of the ingot (Figure 6b), along the central axis of the ingot 300 mm below the hot top, and at 600 mm above the ingot bottom (Figure 6c,d), and compared with the simulation results (Figure 6). The results show that the macrosegregation ratio variation range at the top, bottom, and center (locations are specified in Figure 6a–d) were predicted between (−0.12 to 0.41), (−0.12 to 0.04), (0.17 to 0.56), and (−0.12 to −0.03), respectively. This range was experimentally measured to be between (−0.094 to 0.5), (−0.12 to 0.03), (0.17 to 0.57), and (−0.09 to −0.04) at the top, bottom, center (top zone), and center (bottom zone), respectively. Again, a good agreement can be observed between the experimental and numerical macrosegregation distributions. Some minor differences between the simulation and experimental results were observed in some locations near the ingot wall, central axis, and the zone located at the central tip of the hot top (Figure 5 and Figure 6). These differences are due to difficulties in measuring the chemical composition of the edges of the sample or the assumption of the current solidification model (neglecting the sedimentation of equiaxed grains). It must be noted that during the actual solidification process of the ingot in industry, the cap on the top of the hot top ignites when it comes into contact with the molten metal. Moreover, powder and dust always accumulate on the hot top surface of the hot top, which certainly affects the cooling rate; however, its quantification is quite difficult and, therefore, could not be considered in the model. These ‘perturbations’ are, therefore, probably at the origin of the difference between the simulation and experimental results in the top central region at the tip of the hot top (the small red color region, 100 mm in the radial direction and 50 mm in depth, in Figure 5b).
Based on the above comparisons, it could be said that the numerical model reliably predicts the experimental findings and could be used to analyze the effect of hot top characteristics on solidification process parameters and macrosegregation, as discussed next.

4.2. Hot Top Characteristics and Macrosegregation

In the new design, the hot top height was increased from 381 mm to 546 mm at the interface between the ingot body and the hot top below. As a result, the mass and the slenderness ratio H/D were modified in accordance with other data reported in the literature [19,20]. Table 3 shows the parameters of the existing design, hereafter called original design (OD), and the new design (ND) proposed in the present work. A simulation was conducted by considering the same casting parameters with the validated model, OD, with the only difference being the flow rate. The total volumetric capacity of the entire mold was slightly changed from 1.66 × 109 mm3 to 1.68 × 109 mm3 by increasing the hot top height. The flow rate of OD was 265,385 mm3/s, while that of ND was 267,949 mm3/s (for 90° symmetry).
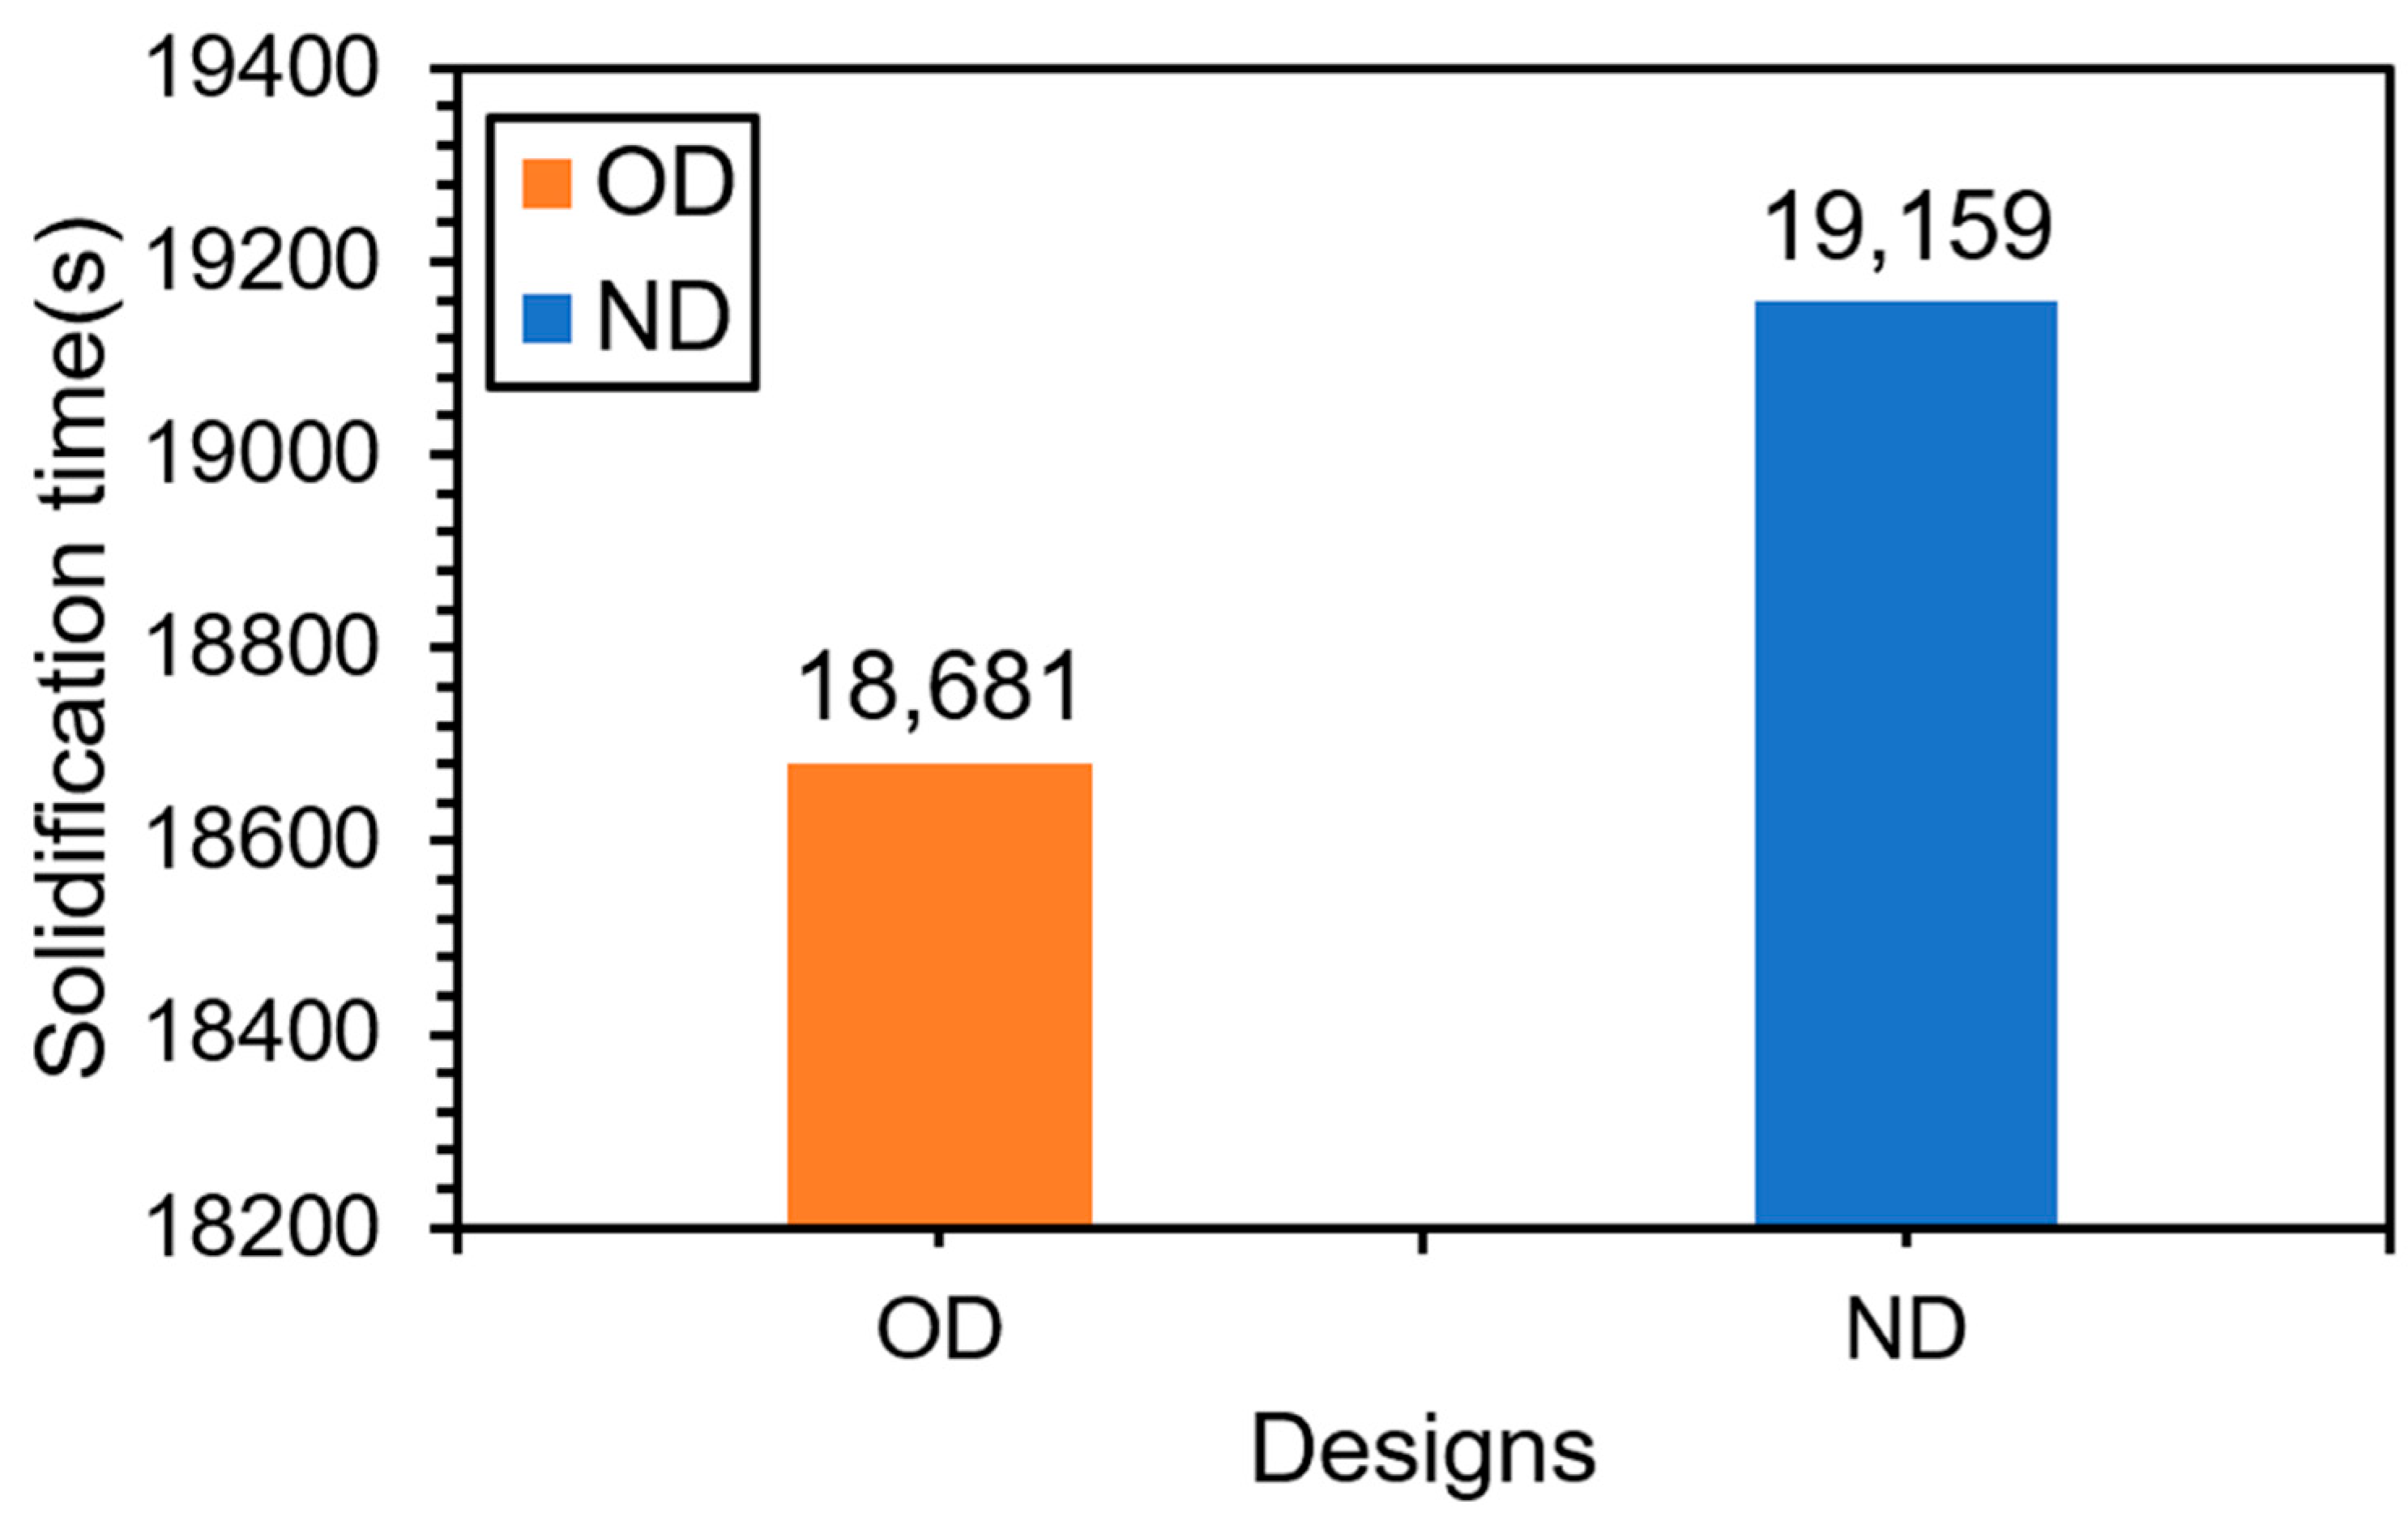
Because only a very small change was brought to the total volume of the ingot with the new design, it was expected that the solidification time would not change much. This was confirmed by the obtained results, as the solidification time was 5 h and 11 min for the OD and 5 h and 19 min for the ND (Figure 7).
Further, a comparison between the contraction on the top surface of the hot top in OD and ND showed an 80 mm and 63 mm shrinkage depth, respectively, relative to the highest edge of the ingot wall, a minor difference that confirms the above solidification time. However, the analysis of the top discard due to shrinkage cavity showed that ND had a higher yield in terms of top cropping than OD. The discard of the ingot top was about 5.4% and 4.9% in OD and ND, respectively.
After the thermo-mechanic simulation, the new macrosegregation results (ND) were compared with the previous results of the original design (OD). Figure 8 shows the obtained carbon macrosegregation distribution results in ND and OD. Specifically, it can be seen that at 1691 mm from the ingot bottom (position indicated in Figure 8a), the macrosegregation ratio of carbon was reduced by about 6.5%, clearly indicating the impact of the new design. A similar behavior was observed on the negative macrosegregation pattern, where, as shown in Figure 8b, at the height of 170 mm from the bottom of the ingot, the negative macrosegregation was decreased by 6.25%. Thus, the ingot quality was improved in terms of macrosegregation intensity. The variation in macrosegregation ratios could originate from different sources, as will be discussed in the next sections.

4.3. Liquid Pressure and Fluid Flow

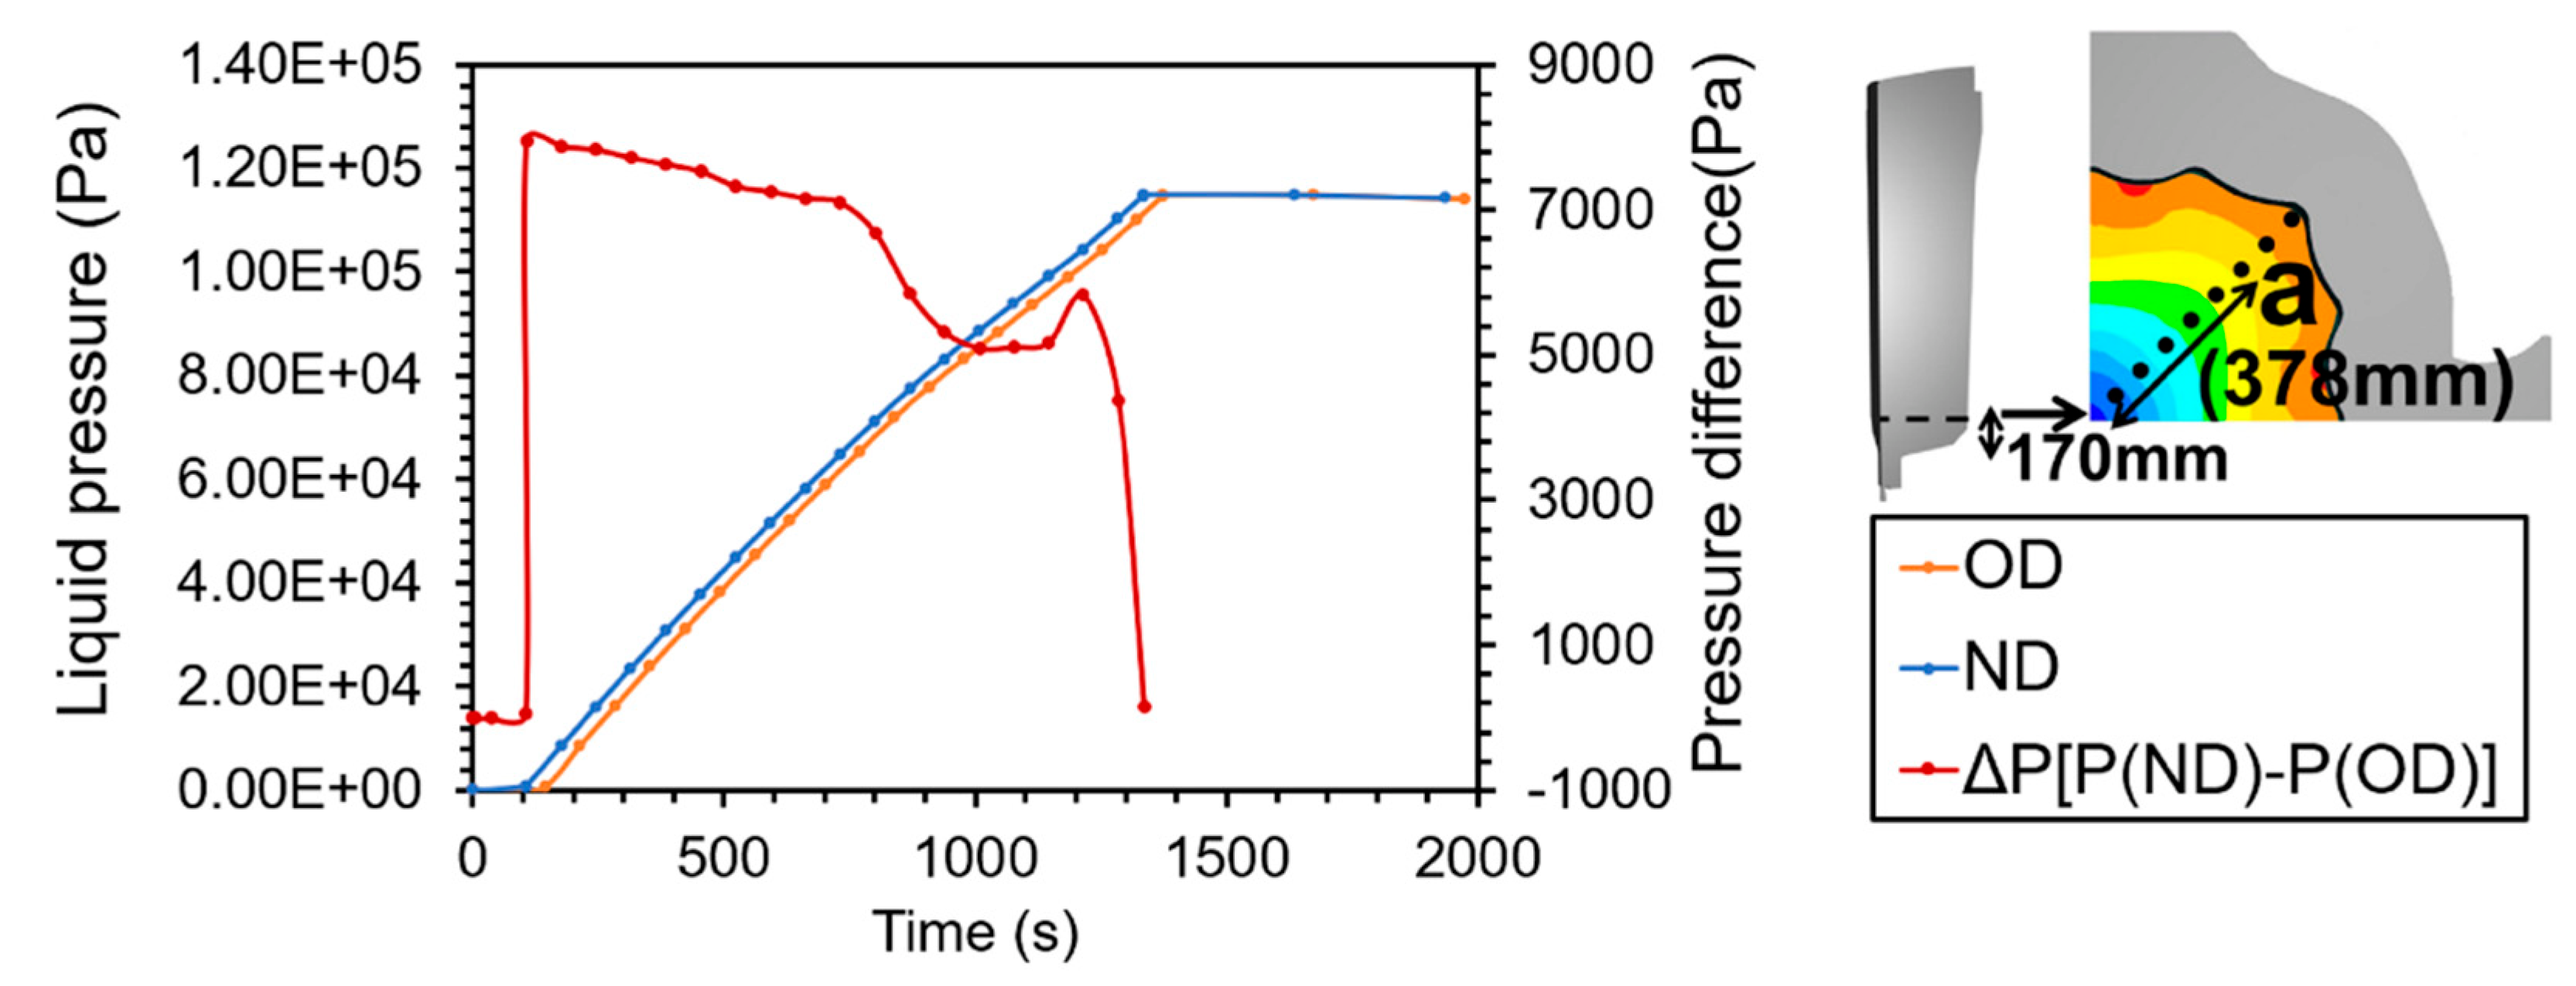
A change in the hot top height and the mass ratio also influence the liquid pressure, the fluid velocity, and the redistribution of solute atoms in the molten metal pool during solidification. The results reported in Figure 9 show that the static relative liquid pressure at the bottom part of the ingot increased from 5800 Pa to 8000 Pa in ND as compared to OD. As reported by Wang et al. [16], increased liquid pressure influences the liquid feeding to the central and the bottom parts of the ingot body, makes the feeding channel smoother, and benefits the ingot’s continued solidification.
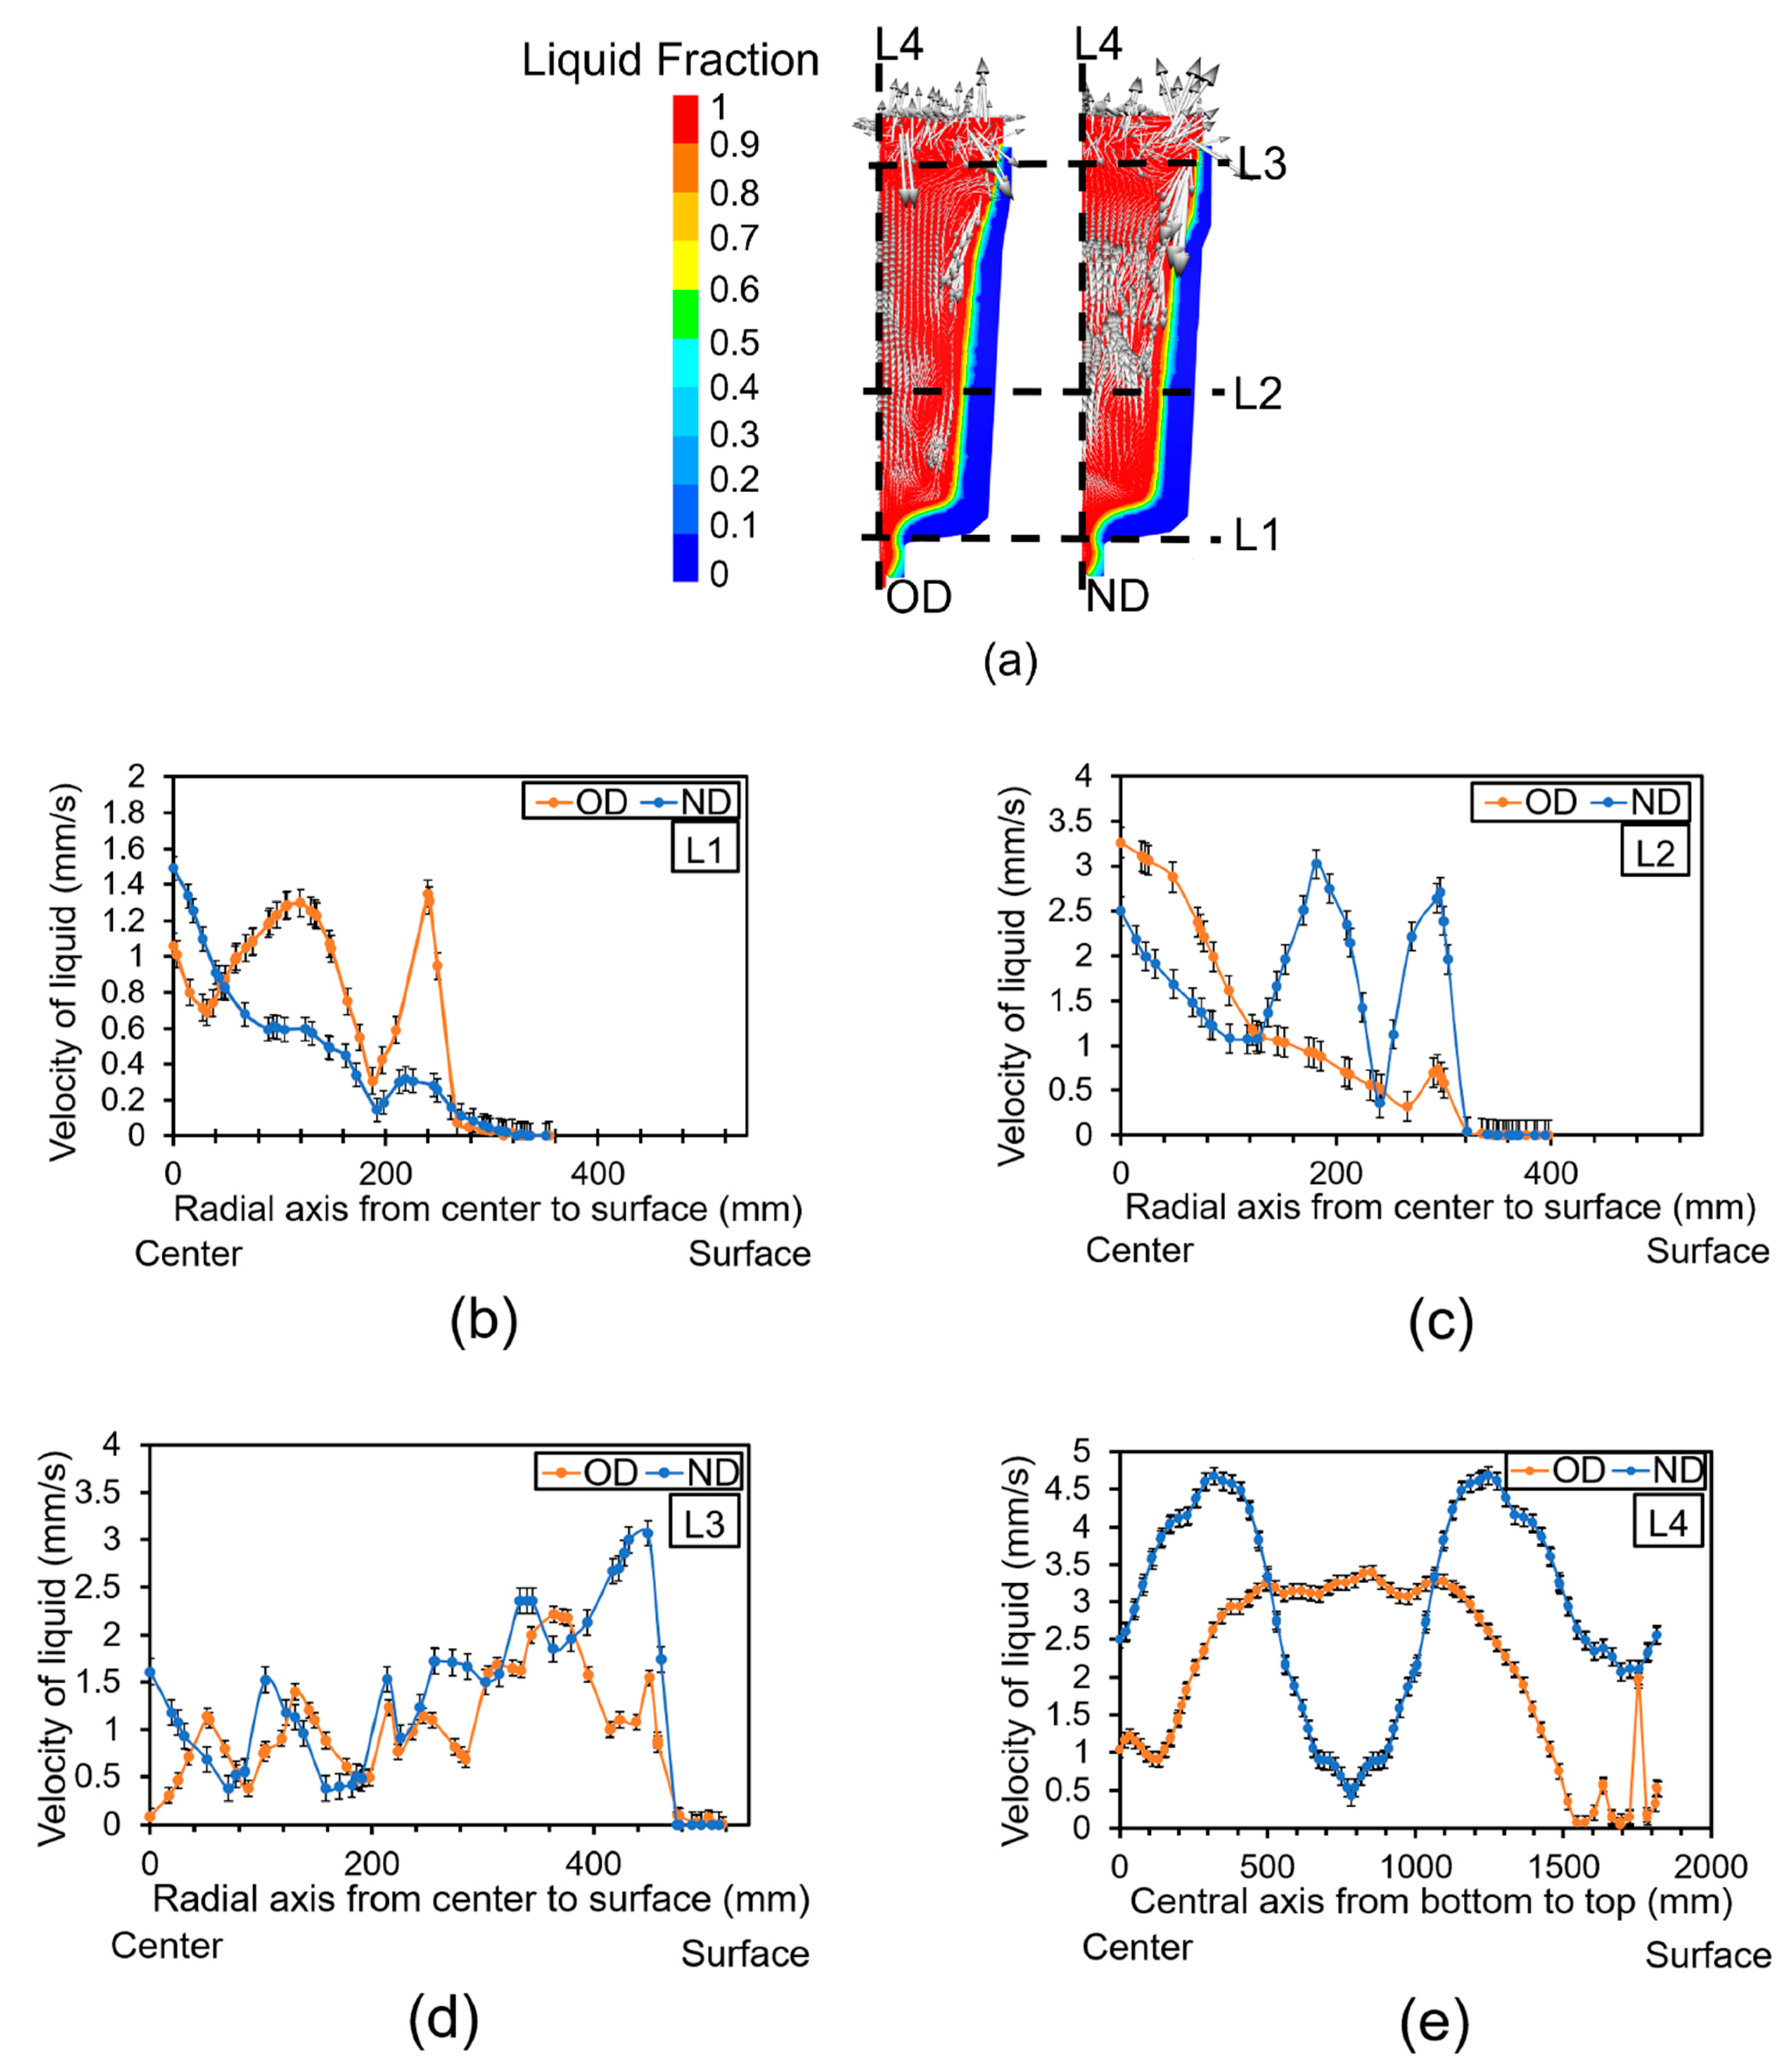
There was thus more feeding in the lower regions of the ingot body to compensate for the contraction, and therefore, there was more fluid flow towards the ingot bottom. The formation of a columnar structure from the wall surface to the center during ingot solidification results in the rejection of solute elements from dendrite arms [6]. Therefore, increased fluid flow ahead of the solid front, resulting from a higher liquid pressure, sweeps up the rejected solute elements from the growing dendrites and transfers them to other locations in the molten metal pool. The results reported in Figure 10 show that the fluid velocity in ND was generally higher than in OD. The liquid fraction and liquid velocity vectors at 33% solid formation are illustrated in Figure 10a. The magnitude of the fluid velocity was plotted in different locations and is indicated as line1 (L1), line2 (L2), line3 (L3), and line4 (L4) at the bottom, middle, top, and center of the ingot, respectively (Figure 10b–e, respectively). For example, an increase in fluid velocity in ND versus OD was observed up to 3.39 mm/s and 3.54 mm/s in the central axis of the ingot (L4) at the height of 500 mm and 1800 mm (Figure 10e). Moreover, high liquid feeding from the top toward the ingot body bottom at L4 in ND (Figure 10e) could reduce the risk of micro-porosity formation, as also reported in the literature [16]. According to the results, fluid with more velocity was observed in ND ahead of the solid front and the central axis of the ingot in L2, L3, and L1, respectively. This process ultimately results in a more homogeneous distribution of solute elements in the bulk liquid in the ingot body.
Furthermore, as reported by Darning et al. [34], when the liquid pressure increases, the number of produced vortexes in the liquid is also reduced. Therefore, fewer solute elements are entrapped in the vortexes, and better liquid homogeneity is expected. The results reported in Figure 11 show that, for the ND, when the solid fraction is 45%, instabilities and more intense fluid currents are produced ahead of the solid front in the hot top region. In contrast, for OD, when the solid fraction is 45%, two large vortexes are produced in the hot top region. As reported by Campbell et al. [35], a higher fluid instability is not appropriate for the formation of first particles. Zhang et al. [12] reported that the increased fluid flow instability in the filling delays the development of thermosolutal convection and reduces solute segregation in the casting body. The presence of a whirlpool in liquid bulk accumulates solute elements in their circle. Sometimes, there is a lack of liquid-soluble elements inside the vortexes in front of the solid front. The result of the above is severe segregation by developing the solid front. Finally, as reported by Patil et al. [27], a higher liquid velocity results in increased floating of inclusion in the slag and, therefore, a reduction of their presence in the solidified ingot. Based on the above analysis, it could be said that by increasing the liquid velocity in the ND condition, several mechanisms become operational, each contributing to a better chemical homogeneity of the liquid metal.

4.4. Cooling Rate

As reported in Figure 7, the solidification time was increased by 8 min when the hot top height and the mass volume were increased. Moreover, as reported in Figure 8 and discussed above, a reduction in positive and negative macrosegregation ratios of up to 6.5% and 6.25%, respectively, were obtained in specified locations. The increase in solidification time influences the cooling rate of the liquid in the mushy zone to some extent. Figure 12 shows the cooling rate of the liquid in the mushy zone at selected points: 61 mm (Figure 12a) and 123 mm (Figure 12b) in the radial axis from the center in the hot top and 378 mm (Figure 12c) and 441 mm (Figure 12d) in the radial axis from the center in the bottom of the ingot. According to the results, a reduction in cooling rate in ND was observed compared to OD. A difference between the cooling rate of OD and ND was reached up to 0.008 °C/s (Figure 12a, point a) and 0.003 °C/s (Figure 12b, point b) in the hot top. In contrast, these values were 0.03 °C/s (Figure 12c, point c) and 0.028 °C/s (Figure 12d, point d) in the ingot body bottom. The slight reduction in the cooling rate of the liquid in the mushy zone for the ND case creates more favorable conditions for the solute elements to diffuse more in the solid portion of the mushy state. The increased diffusion of solute elements in the solid-state results in fewer rejected solute elements from the solid part to the liquid state and a smaller solute gradient. Hultgren [10,36] proposed that macrosegregation may form when a relative motion, such as a solutal buoyancy, appears between a solid and the surrounding liquid. The solute gradient is reduced as the diffusion time of the solute element increases. It appears that the diffusion times in points with less macrosegregation observed in ND were sufficient. As reported by Duan et al. [24], a decrease in the cooling rate due to refractory lining reduces the macrosegregation in these regions. Honghao et al. [10] proposed a gradual cooling solidification that alleviates macrosegregation. Thus, the positive and negative macrosegregation reduction observed at specified locations could be related to a slower cooling rate of liquid in the mushy state and the fact that there is enough time for the diffusion of solute elements. It should also be noted that a decrease in the liquid cooling rate also has an increasing effect on the solidification time of the ingot, even though this impact may only be minor.

4.5. Liquidus Temperature

The local liquidus temperature is another factor that is changed by variations in the hot top height. The local liquidus temperature was determined by investigating the temperature and the liquid fraction in the macrosegregation model. The local liquidus temperature was defined at each location as the lowest temperature at which the molten metal was entirely liquid. The results reported in Figure 13 show a difference between the local liquidus temperature and the nominal liquidus temperature at the half-radial distance from the ingot wall (especially near the surface due to the higher heat exchange with the mold wall). Specifically, these results show that in the ND case, approximately in the radial direction at a half distance from the ingot wall, the local liquidus temperature decreased by about 14.5 °C in the hot top zone (Figure 13a) and by 7.5 °C in the ingot bottom area (Figure 13b). The carbon segregation ratio was between (−0.07, 0.25) and (−0.04, 0.185) in OD and ND, respectively, in the above-mentioned areas of the hot top. In contrast, in the ingot bottom zones, these values were in the (−0.06, 0.12) and (−0.06, 0.08) ranges in OD and ND, respectively.
The impact of the above results on the final macrosegregation intensity could be interpreted in terms of the influence of local carbon concentrations: by increasing the hot top height (ND case), the liquid metal cooled more slowly from the local temperature to the local liquidus temperature than did the one in OD. This resulted in a smaller difference between the local liquidus temperature and the nominal liquidus temperature because the local concentration of carbon atoms is closer to the nominal concentration. In addition to the above effects, as reported by Loucif et al. [37], the concentration of carbon atoms also affects the amount and type of the first-formed solid phase (i.e., delta-ferrite or austenite), and therefore influences the macrosegregation level as the solubility of carbon is different in each of these solid phases. According to Figure 14, the solidification interval decreased in ND at the half-radial distance from the ingot wall in the hot top zone (Figure 14a) and in the ingot bottom area (Figure 14b). The combination of a reduction of the interval of solidification and enough diffusion of carbon atoms in the solid state in the mushy zone (as mentioned above) in the delta-ferrite phase keeps the concentration of carbon atoms near the nominal one. Consequently, there is less severe carbon macrosegregation.

5. Conclusions

The effect of an increase in the hot top height on the positive and negative macrosegregation ratio, ingot quality, and material yield was investigated in a 12 MT cast ingot of high-strength steel. A 3D FE model was developed and initially validated with experimental results obtained from the entire surface of a longitudinal section of the as-cast ingot. The following main conclusions can be drawn from these investigations:
  • Increasing the hot top height reduced the negative and positive macrosegregation at heights of 170 mm and 1691 mm from the bottom of the ingot by up to 6.25% and 6.5%, respectively;
  • Increasing the hot top height increased the solidification time by up to 8 min compared to the original design and slightly decreased the cooling rate in the mushy state;
  • More liquid feeding from the hot top towards the ingot bottom and a more homogeneous distribution of solute elements in the bulk liquid were identified as the main sources of observed lower macrosegregation intensity at specified locations.
These results can contribute to the design of new hot top geometries of larger size ingots (100 tons or more) where the risk of macrosegregation is even higher.

Author Contributions

Conceptualization, N.G. and M.J.; Data curation, N.G.; Formal analysis, N.G.; Funding acquisition, M.J.; Investigation, N.G.; Methodology, N.G., A.L. and P.I.G.; Project administration, M.J.; Resources, M.J.-B. and M.J.; Software, N.G. and M.B.; Supervision, M.J.; Validation, M.J.; Visualization, N.G.; Writing—original draft, N.G.; Writing—review & editing, M.B., A.L. and M.J. All authors have read and agreed to the published version of the manuscript.

Funding

This research was funded in the framework of NSERC Grant # CRDDPJ 536444-18.

Institutional Review Board Statement

Not applicable.

Informed Consent Statement

Not applicable.

Data Availability Statement

Not applicable.

Acknowledgments

The authors acknowledge Finkl Steel-Sorel Co., Natural Sciences and Engineering Research Council of Canada (NSERC), and École de Technologie Supérieure, for providing technical data, casting facilities and materials, as well as financial support.

Conflicts of Interest

The authors declare that they have no known competing financial interests or personal relationships that influenced the work reported in this paper.

References

  1. Zhang, C.P.; Shahriari, D.; Loucif, A.; Jahazi, M.; Lapierre-Boire, L.P.; Tremblay, R. Effect of Segregated Alloying Elements on the High Strength Steel Properties: Application to the Large Size Ingot Casting Simulation. In TMS 2017 146th Annual Meeting & Exhibition Supplemental Proceedings; Springer: Cham, Switzerland, 2017; pp. 491–500. [Google Scholar]
  2. ElBealy, M.; Fredriksson, H. Modeling of the peritectic reaction and macro-segregation in casting of low carbon steel. Metall. Mater. Trans. B 1996, 27, 999–1014. [Google Scholar] [CrossRef]
  3. Samanta, D.; Zabaras, N. Control of macrosegregation during the solidification of alloys using magnetic fields. Int. J. Heat Mass Transf. 2006, 49, 4850–4866. [Google Scholar] [CrossRef]
  4. Yu, K.O. Modeling for Casting and Solidification Processing; CRC Press: Boca Raton, FL, USA, 2002; pp. 95–122. [Google Scholar]
  5. Ge, H.; Li, J.; Han, X.; Xia, M.; Li, J. Dendritic model for macrosegregation prediction of large scale castings. J. Mater. Process. Technol. 2016, 227, 308–317. [Google Scholar] [CrossRef]
  6. Pickering, E.J. Macrosegregation in Steel Ingots: The Applicability of Modelling and Characterisation Techniques. ISIJ Int. 2013, 53, 935–949. [Google Scholar] [CrossRef] [Green Version]
  7. Pickering, E.J.; Chesman, C.; Al-Bermani, S.; Holland, M.; Davies, P.; Talamantes-Silva, J. A Comprehensive Case Study of Macrosegregation in a Steel Ingot. Metall. Mater. Trans. B 2015, 46, 1860–1874. [Google Scholar] [CrossRef] [Green Version]
  8. Ge, H.; Ren, F.; Li, J.; Hu, Q.; Xia, M.; Li, J. Modelling of ingot size effects on macrosegregation in steel castings. J. Mater. Process. Technol. 2018, 252, 362–369. [Google Scholar] [CrossRef]
  9. Flemings, M.C. Solidification processing. Metall. Mater. Trans. B 1974, 5, 2121–2134. [Google Scholar] [CrossRef]
  10. Ge, H.; Ren, F.; Cai, D.; Hao, J.; Li, J.; Li, J. Gradual-cooling solidification approach to alleviate macrosegregation in large steel ingots. J. Mater. Process. Technol. 2018, 262, 232–238. [Google Scholar] [CrossRef]
  11. Ge, H.; Ren, F.; Li, J.; Han, X.; Xia, M.; Li, J. Four-phase dendritic model for the prediction of macrosegregation, shrinkage cavity, and porosity in a 55-ton ingot. Metall. Mater. Trans. A 2017, 48, 1139–1150. [Google Scholar] [CrossRef]
  12. Zhang, C.; Loucif, A.; Jahazi, M.; Tremblay, R.; Lapierre, L.P. On the effect of filling rate on positive macrosegregation patterns in large size cast steel ingots. Appl. Sci. 2018, 8, 1878. [Google Scholar] [CrossRef]
  13. Zhang, C.; Jahazi, M.; Tremblay, R. Simulation and experimental validation of the effect of superheat on macrosegregation in large-size steel ingots. Int. J. Adv. Manuf. Technol. 2020, 107, 167–175. [Google Scholar] [CrossRef]
  14. Loucif, A.; Zhang, C.; Morin, J.B.; Jahazi, M. A FEM Analysis on the Influence of Manganese on Carbon and Chromium Macrosegregation in Large Size Steel Ingot. In Materials Science Forum; Trans Tech Publ.: Zurich, Switzerland, 2022. [Google Scholar]
  15. Hurtuk, D.J. Steel ingot casting. In Casting; ASM Handbook; ASM International: Materials Park, OH, USA, 2008; Volume 15, p. 911. [Google Scholar]
  16. Wang, J.; Fu, P.; Liu, H.; Li, D.; Li, Y. Shrinkage porosity criteria and optimized design of a 100-ton 30Cr2Ni4MoV forging ingot. Mater. Des. 2012, 35, 446–456. [Google Scholar] [CrossRef]
  17. Tashiro, K.; Watanabe, S.; Kitagawa, I.; Tamura, I. Influence of mould design on the solidification and soundness of heavy forging ingots. Trans. Iron Steel Inst. Jpn. 1983, 23, 312–321. [Google Scholar] [CrossRef] [Green Version]
  18. Kumar, A.; Založnik, M.; Combeau, H.C. Experimental and Numerical Studies on the Influence of Hot Top Conditions on Macrosegregation in an Industrial Steel Ingot. In Proceedings of the First International Conference on Ingot Casting, Rolling and Forging (IRCF), Aachen, Germany, 3–7 June 2012. [Google Scholar]
  19. Kermanpur, A.; Eskandari, M.; Purmohamad, H.; Soltani, M.A.; Shateri, R. Influence of mould design on the solidification of heavy forging ingots of low alloy steels by numerical simulation. Mater. Des. 2010, 31, 1096–1104. [Google Scholar] [CrossRef]
  20. Scepi, M.; Andreoli, B.; Basevi, S.; Giorgetti, A.L. Thermal and metallurgical control of the efficiency of ingot moulds for forging ingots. Boll. Technol. 1981, 391, 77–82. [Google Scholar]
  21. Zhao, Y.N. Influence of Mould Slenderness Ratio on the Solidification of Heavy Ingots by Numerical Simulation. In Key Engineering Materials; Trans Tech Publ.: Zurich, Switzerland, 2021. [Google Scholar]
  22. Guide, J.U.S.; Sente Software Ltd.: Guildford, UK, 2005.
  23. THERCAST® NxT 2.1 USER MANUAL Ingot Casting; Transvalor, S.A.: Biot, France, 2017.
  24. Duan, Z.; Tu, W.; Shen, B.; Shen, H.; Liu, B. Experimental Measurements for Numerical Simulation of Macrosegregation in a 36-Ton Steel Ingot. Metall. Mater. Trans. A 2016, 47, 3597–3606. [Google Scholar] [CrossRef]
  25. MATLAB and Statistics Toolbox Release 2012b; The MathWorks, Inc.: Natick, MA, USA, 2012.
  26. Patil, P.; Marje, V.; Balachandran, G.; Balasubramanian, V. Theoretical study on influence of steel composition on solidification behaviour in ingot casting of low alloy steels at similar casting conditions. Int. J. Cast Met. Res. 2015, 28, 117–128. [Google Scholar] [CrossRef]
  27. Patil, P.; Puranik, A.; Balachandran, G.; Balasubramanian, V. Improvement in Quality and Yield of the Low Alloy Steel Ingot Casting Through Modified Mould Design. Trans. Indian Inst. Met. 2016, 70, 2001–2015. [Google Scholar] [CrossRef]
  28. Bellet, M.; Fachinotti, V.D. ALE Method for Solidification Modelling. Comput. Methods Appl. Mech. Eng. 2004, 193, 4355–4381. [Google Scholar] [CrossRef] [Green Version]
  29. Zhang, C.; Shahriari, D.; Loucif, A.; Melkonyan, H.; Jahazi, M. Influence of thermomechanical shrinkage on macrosegregation during solidification of a large-sized high-strength steel ingot. Int. J. Adv. Manuf. Technol. 2018, 99, 3035–3048. [Google Scholar] [CrossRef]
  30. Wu, M.; Ludwig, A.; Kharicha, A. Simulation of As-Cast Steel Ingots. Steel Res. Int. 2018, 89, 1700037. [Google Scholar] [CrossRef]
  31. Available online: http://www.sorelforge.com/ (accessed on 3 November 2022).
  32. TherCast 2.1®; Transvalor, S.A.: Biot, France, 2017.
  33. Baghani, A. Modeling of Macrosegregation and Shrinkage Cavity during Solidification of a Multi-Components Steel Ingot. Ph.D. Thesis, The University of Iowa, Iowa City, IA, USA, 2019. [Google Scholar]
  34. Xu, D.; Li, Q. Gravity- and Solidification-Shrinkage-Induced Liquid Flow in a Horizontally Solidified Alloy Ingot. Numer. Heat Transf. Part A Appl. 1991, 20, 203–221. [Google Scholar] [CrossRef]
  35. Campbell, J. Complete Casting Handbook—Metal Casting Processes, Metallurgy, Techniques and Design; Butterworth-Heinemann: Oxford, UK, 2015. [Google Scholar]
  36. Hultgren, A. A and V segregation in killed steel ingots. Scand. J. Metall. 1973, 2, 217–227. [Google Scholar]
  37. Loucif, A.; Ben Fredj, E.; Harris, N.; Shahriari, D.; Jahazi, M.; Lapierre-Boire, L.P. Evolution of A-Type Macrosegregation in Large Size Steel Ingot After Multistep Forging and Heat Treatment. Metall. Mater. Trans. B 2018, 49, 1046–1055. [Google Scholar] [CrossRef]
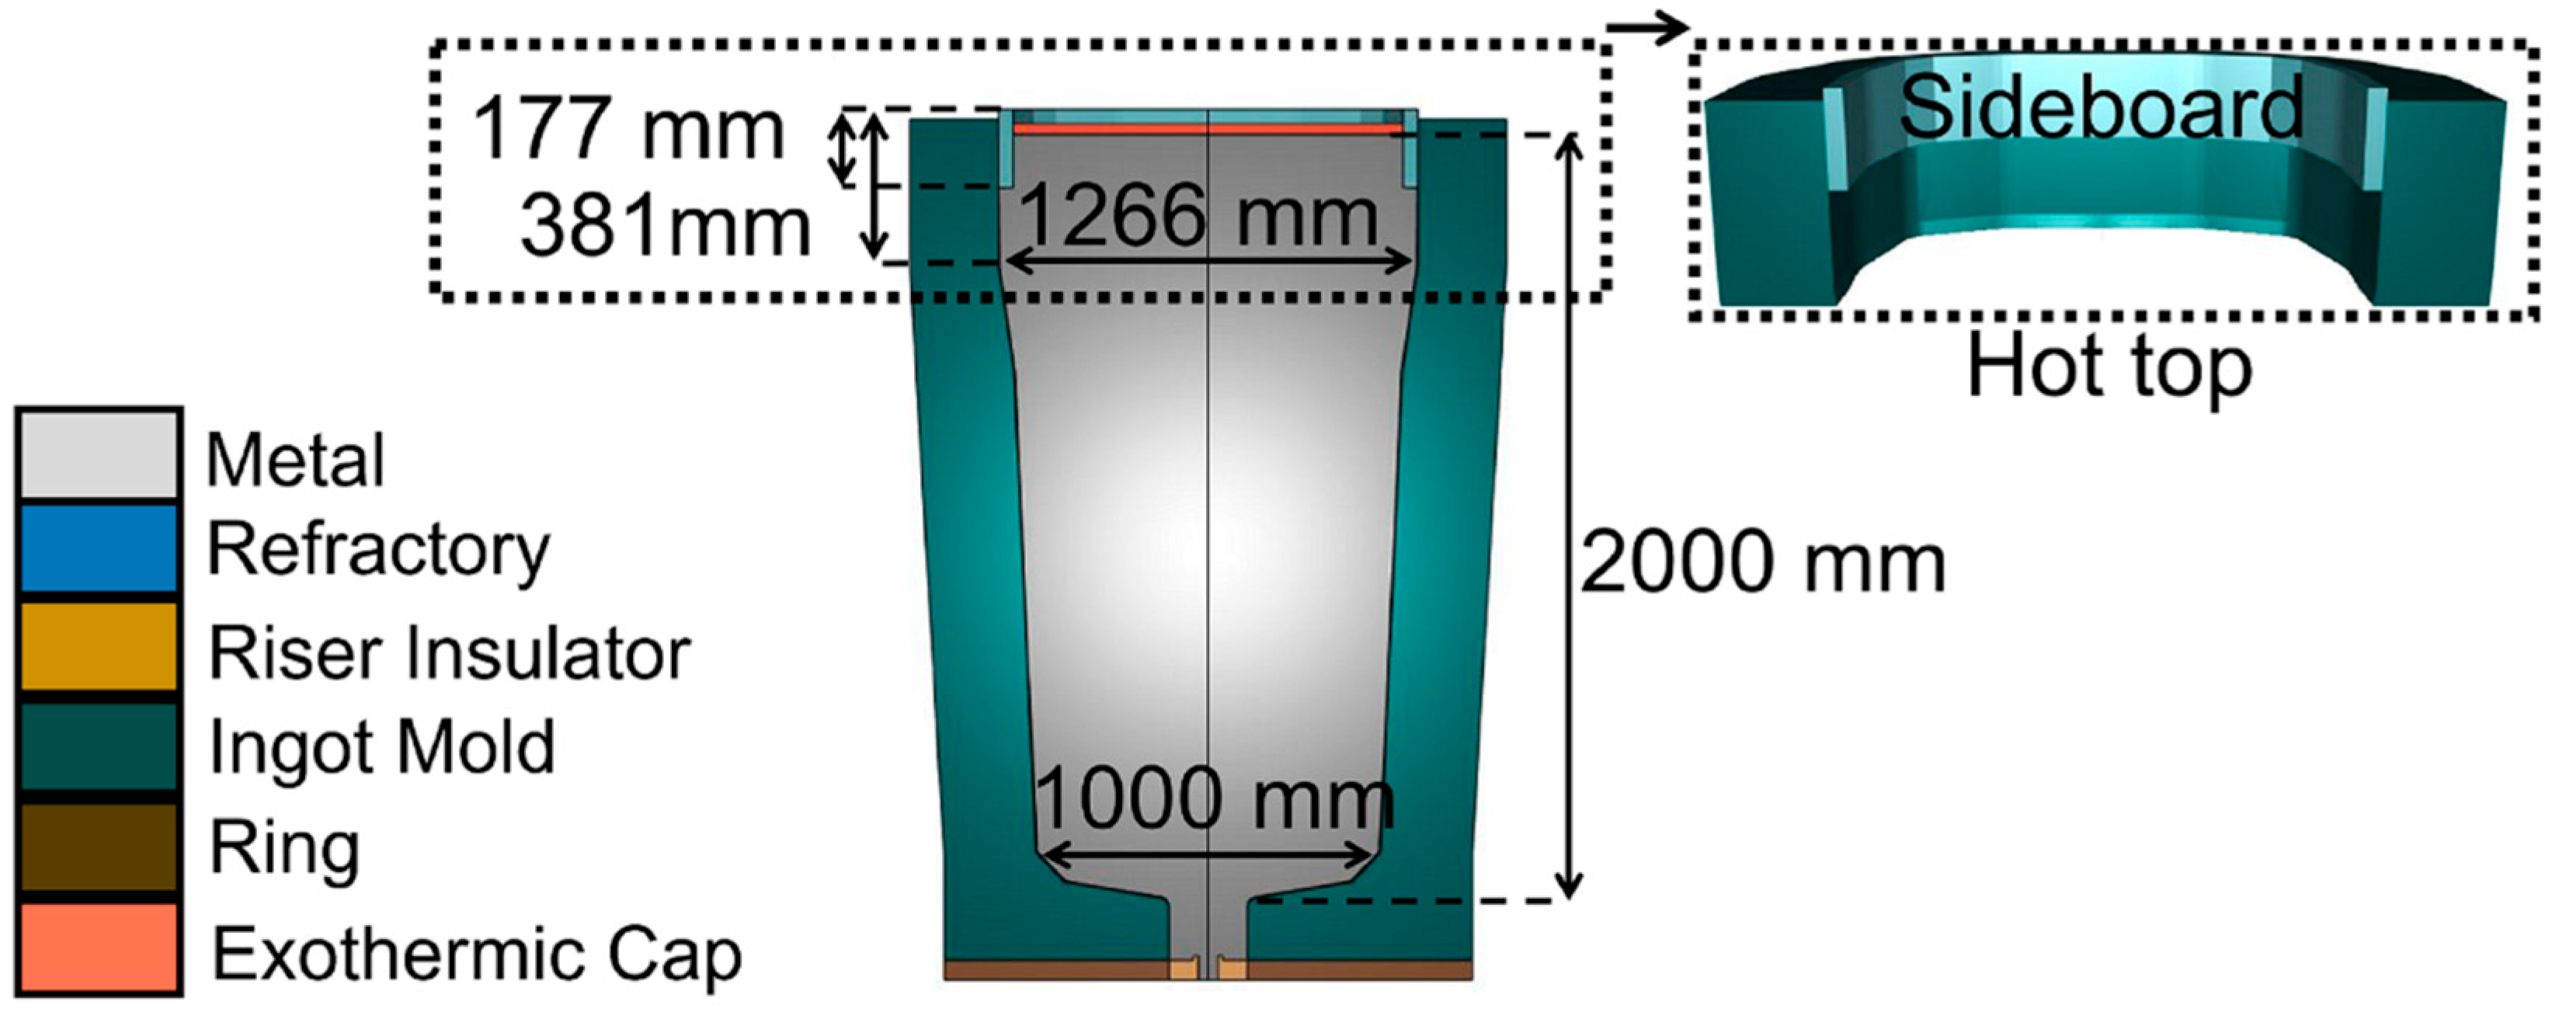
Figure 1. Assembly image of the ingot 12 MT, mold, and hot top (180model).
Metals 12 01906 g001
Figure 2. (a) 12 MT ingot after casting, red dash line presents the position of the cutting section, (b) Central longitudinal section, the right side was used for the macrosegregation map and the left side was used for macro-etch, (c) Cutting blocks of the ingot for macro etching, (d) Cutting samples of the ingot for chemical mapping and (e) Enlarge image showing the hot top cut into smaller samples for analysis.
Metals 12 01906 g002
Figure 3. (a) Mesh distribution of the 90° model, (b) The temperature pattern on the left side and the velocity pattern on the right side after ignition of exothermic caps at the end of filling.
Metals 12 01906 g003
Figure 4. Shrinkage cavity of ingot 12 MT at the end of solidification: (a) Predicted result, (b) Result from a real ingot.
Metals 12 01906 g004
Figure 5. Carbon macrosegregation map: (a) Predicted result (90° model), (b) Experimental result.
Metals 12 01906 g005
Figure 6. Carbon macrosegregation ratio when solidification is complete: (a) Along the radial axis at the hot top (height of 1659 mm from the bottom), (b) Along the radial axis at the bottom (height of 90 mm from the bottom), (c) Along the central axis, from the bottom toward the top at 300 mm distance below the hot top, and (d) Along the central axis from the bottom toward the top at a 600 mm distance above the ingot bottom.
Metals 12 01906 g006
Figure 7. Solidification time at the end of solidification in OD and ND.
Metals 12 01906 g007
Figure 8. Carbon macrosegregation ratio when solidification is complete in OD and ND: (a) Along the radial axis at the hot top (height of 1691 mm from the bottom), and (b) Along the radial axis at the bottom (height of 170 mm from the bottom).
Metals 12 01906 g008
Figure 9. Static liquid pressure in OD and ND at point a, a height of 170 mm from the bottom and 378 mm in a radial direction from the center.
Metals 12 01906 g009
Figure 10. (a) Liquid fraction and fluid velocity vectors of OD and ND at a 33% solid fraction, (b) Evolution of velocity magnitude of liquid in OD and ND in L1, (c) L2 (d) L3, (e) L4.
Metals 12 01906 g010
Figure 11. Liquid fractions and fluid velocity vectors of OD and ND at 45% solid fractions.
Metals 12 01906 g011
Figure 12. Cooling rate of the liquid at a mushy state in OD and ND: (a) 61 mm in a radial direction from the center at the hot top area (height of 1691 mm from the bottom), (b) 123 mm in a radial direction from the center at the hot top area (height of 1691 mm from the bottom), (c) 378 mm in a radial direction from the center of the ingot at the ingot body bottom part (height of 170 mm from the bottom), and (d) 441 mm in a radial direction from the center of the ingot at the ingot body bottom part (height of 170 mm from the bottom).
Metals 12 01906 g012
Figure 13. Liquidus temperature °C in OD and ND at (a) In the radial direction, a height of 1691 mm from the bottom at the hot top area, (b) In the radial direction, a height of 170 mm from the bottom at the ingot body area.
Metals 12 01906 g013
Figure 14. Solidification interval °C in OD and ND at (a) A half radial distance from the ingot wall at the hot top area (a height of 1691 mm from the bottom), (b) A half radial distance from the ingot wall at the ingot body area (a height of 170 mm from the bottom).
Metals 12 01906 g014
Table 1. Initial chemical composition of the Cr-Mo steel ingot, all in wt.%.
CMnPSSiNiCrMoCuFe
0.320.570.0150.0010.270.231.080.340.16Balance
Table 2. Input parameters for the simulation.
PropertyUnitValueReference
SteelReference densityKg/m36.93 × 10–6[22,32]
Melting temperature of pure iron°C1540[32]
Reference temperature (liquidus)°C1502[22]
Thermal expansion coefficient 1/K8.853 × 10–5[32]
Latent heat of fusion kJ/kg265[32]
Emissivity-0.8[29,32]
Cast ironDensitykg/m37000[32]
Thermal conductivityW/m/K30[32]
RefractoryDensitykg/m32353[29,32]
Thermal conductivityW/m/K1.2[29,32]
Riser insulatorDensitykg/m3868[32]
Thermal conductivityW/m/K0.45[32]
Exothermic capDensitykg/m3500[31]
Thermal conductivityW/m/K0.2[32]
Initial conditionFilling timemin26[31]
Initial temperature of mold and mold components°C60[31]
Exterior environmental temperature°C20[31]
Pouring temperature°C1580[31]
Superheat temperature°C78[22,31]
Liquidus temperature°C1502[22]
Flow rate for 90° symmetry modelmm3/s265,385[31]
Energy of ignition of two exothermic capsMJ72[31]
Number of the mesh of the ingot and the components of the mold-746,196-
Mesh sizemm30-
Mesh refinementmm15 and 8-
Table 3. Characteristics of the hot top in the original and in the new design.
TypeSymbolHot Top HeightMass RatioSlenderness Ratio (H/D)Sideboard Height
Original DesignOD381 mm21.35%1.3203 mm
New DesignND546 mm31.25%1.16203 mm
Publisher’s Note: MDPI stays neutral with regard to jurisdictional claims in published maps and institutional affiliations.