Abstract
This research work aims to fabricate the Al-4 wt.% SiC nanocomposite using the accumulative roll bonding (ARB) technique. Moreover, a finite element model based on real microstructure representative volume element representation and cohesive zone modeling was developed to predict the mechanical response of the produced composites. The results demonstrated that SiC particles were homogenously distributed inside the Al matrix after five passes. The tensile strength and hardness were improved by increasing the number of ARB passes. The microhardness of an Al-4%SiC composite subjected to five ARB passes was increased to 67 HV compared to 53 HV for Al sheets subjected to the same rolling process. Moreover, owing to greater bonding and grain refinement, tensile strength was increased by a factor of three compared to pure Al. The result of the proposed micro-model successfully predicts the experimentally obtained results of the Al–SiC macro composite. The numerically obtained stress–strain curve was comparable with the experimental one. The results also showed that the size of the used RVE was significantly influential in the prediction of the stress–strain behavior.
1. Introduction
Due to their superior mechanical and thermal properties, metal matrix nanocomposites have attracted great attention during the last two decades [1,2,3,4,5]. The papers published reported the modification of the reinforcement particulates’ size and shape of MMCs fabricated by liquid-based methods by applying secondary processes such as rolling, extrusion, and forging. However, no effort, including increasing the number of rolling cycles or applying high extrusion ratios, led to the complete removal of the agglomerates of particles. It is important to have a consistent distribution of reinforcement particles in the matrix. This is still a challenge that has not been overcome, although MMCs have been fabricated through many cost-effective methods [6,7].
Severe plastic deformation (SPD), which includes several approaches, has emerged as a promising method to produce ultrafine-grained (UFG) materials [8]. Accumulative roll bonding (ARB) is one of the SPD techniques that has been widely used to produce layer metal matrices with fine structures [9,10]. However, there are some restrictions with regard to this process, for example, a lack of enough adhesion between the dissimilar metals and the cracking of the edges of sheets [11,12]. Applying ARB to sheet metals and reinforcing them using nanoparticles produces multilayered composites with enhanced mechanical and microstructure properties [13,14,15,16,17]. The ARB process has been deployed to produce different Al-based composites including Al/SiC [18,19,20,21,22], Al/Al2O3 [23,24], Al/TiO2 [25], Al/SiO2 [26], Al/W [27], and Al/WC [28]. A shared characteristic of all the produced composites is that the matrix grains are refined due to severe plastic deformation, which enhances the mechanical response according to the Hall–Petch relation [16].
The inspection of material microstructures is an important step that might give an indication of the mechanical and electric behavior of the produced composites [29]. Among the techniques used to characterize the microstructure of the composites, scanning electron microscopy (SEM) and X-ray diffraction (XRD) are the most favorable techniques in the literature [30,31]. For instance, Alizadeh et al. [32] deployed XRD to characterize the crystallite size changes during the ARB process of the Al-based composites. They compared the crystallite size measured using the Williamson–Hall and Rietveld referent methods and they found that both methods are comparable. Yaghtin et al. [33] validated the crystallite size measured using the Rietveld referent method with transmission electron measurements. Farajzadeh et al. [34] fabricated Al matrix composites reinforced with Al2O3/TiC hybrid reinforcement by the ARB process using anodized Al strips and TiC particles. They found that at initial ARB cycles, the ductility of the composite was degraded while it was enhanced as the number of ARB cycles was increased. Rezayaet et al. [35] used micron-sized SiC particles to fabricate Al matrix composites by the ARB process. They stated that, owing to SiC particles in a matrix with uniform dispersion and the formation of a strong particle/matrix interface, the manufactured composites’ mechanical properties have improved.
Finite element (FE) modeling is a powerful tool that enables the prediction of mechanical and coupling effects on composite materials [36,37,38,39,40,41]. Recently, microstructure-based FE models were developed to simulate the mechanical response of MMCs considering the mass fraction and size of the reinforcement phase. The effect of thermal residual stresses and fiber coating on the mechanical response of Al metal matrix composites was investigated numerically using a 3D FE micromechanical model [42]. The developed model was able to predict the mechanical response accurately. A single-unit representative volume element model associated with cohesive zone models was developed to predict the mechanical response of Al-Al2O3 nanocomposites [43]. These findings demonstrate the efficiency of FE modeling in predicting the mechanical response of MMCS.
Considering the above-mentioned studies and the current study, the goal of this project is to use the ARB approach to produce an Al–SiC nanocomposite at various passes. We investigate the microstructural and mechanical characteristics of the nanostructured Al–SiC nanocomposite, which is produced by the ARB process. Moreover, we developed an FE model that takes into account the separation between the matrix and the reinforcement particles. The developed model was implemented based on real microstructure evolution, which enhances the predictability of the mechanical properties.
2. Materials and Methods
The material used in this study was commercial pure aluminum 1050 as a matrix supplied by the National Aluminum Company (Bhubaneswar, India). The matrix of the produced composites was Al-1050 alloy with the chemical composition as provided in Table 1 in sheet form of 200 × 100 × 1 mm size. Prior to the ARB process, the sheets were placed inside a furnace at 365 °C for an hour and then cooled down at room temperature to remove thermal stresses and anneal the sheets to avoid cracking. SiC powders with an average size of 5 µm were used as reinforcement and were supplied by the Nuclear Materials Authority.

Table 1.
Chemical composition and hardness of the Al-1050 sheet.
In the manufacturing process, to remove surface impurities, acetone was used to degrease the aluminum sheets, and then both sides were wire brushed to enhance the surface characteristics of the sheets. SiC particles were dispersed in acetone for 90 s using a sonicator. Then, SiC was sprayed onto the Al sheets using an atomizer. The sheets were first stacked and heated for 10 min at 473 °C, after which, they were rolled with to a 50% reduction in thickness. The rolled sheets were then separated and stacked, with the process repeated up to five passes. A schematic drawing that explains the process was shown in Figure 1.
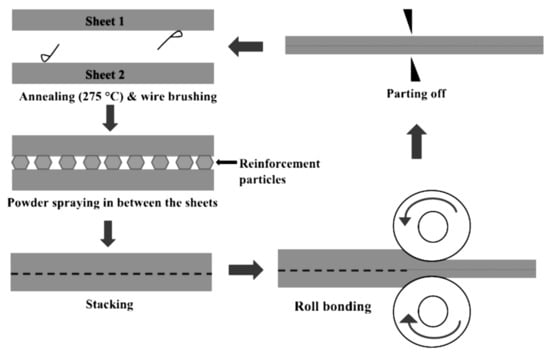
Figure 1.
Schematic representation of nanocomposite sheets manufacturing through the ARB process.
The specimens were machined out of the central part in the rolling–normal direction (RD-ND planes) and then polished and etched with different grits of SiC emery sheets and Keller’s reagent. The microstructure was observed by a scanning electron micro-105 scope (Zeiss GeminiSEM500, Jena, Germany, accelerating voltage 15 kV). The device is 106 equipped with EDS (Ultim Max 170, Oxford Instruments, Abingdon, UK) to detect elemental composition.
Microhardness values were calculated based on the average values obtained from six iterative measurements under a load of 100 gf with a Wellmess WM-MCV-1A device. For the tensile response, a universal testing machine (UTM) was used to investigate the tensile behaviors of the developed composite. The tensile test was performed under an ambient temperature at a load of (100 kN). The specimens of the tensile test were machined by a wire cut machine from the rolled sheets according to the one-fifth scale of the JIS-No. 5 specimen, oriented along the rolling direction as shown in Figure 2. The gauge length and width of the tensile test specimens were 10 and 5 mm, respectively. The tension of the specimens was tested in another test at a uniform strain rate of 0.25 mm/s.
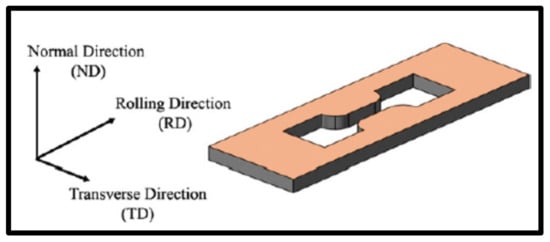
Figure 2.
Orientation of the tension specimens prepared after each ARB cycle.
3. Microstructural Modeling
A two-dimensional microstructural image of the synthetized Al–SiC composite is obtained using SEM. The obtained microstructure is composed of a matrix region and reinforcement particle regions. ImageJ® is used to produce a segmented microstructure image as shown in Figure 3 and print all vertices’ X–Y coordinates. In order to convert the segmented image into a computational finite element domain, a MATLAB [44] code is developed to read the vertices coordinates of the matrix and the reinforcement particles and generate the computational model for ANSYS [45]. Figure 3 shows a computational domain of the segmented image that was generated using the developed code.
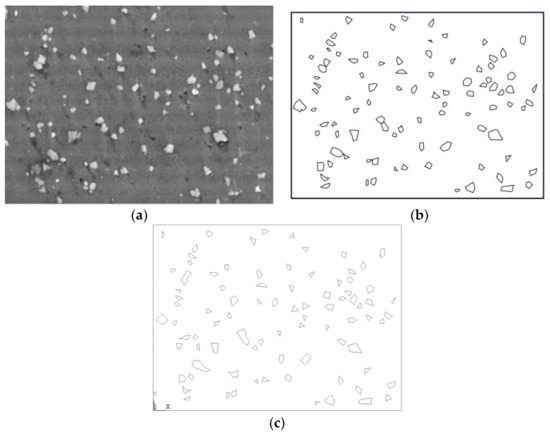
Figure 3.
Microstructural modeling. (a) Real composite microstructure; (b) Segmented microstructure; (c) Computational domain of the composite matrix.
3.1. Representative Volume Element (RVE)
Since the model is at a microscale, a reasonable RVE size should be selected for the FE analysis. Computationally, RVE should be as small as possible, but it should be informative to predict the global performance of the composite. The choice of adequate RVE size is investigated in this work, so four different assumed RVE sizes (50 × 50 μm, 100 × 100 μm, 150 × 150 μm, and 200 × 150 μm) are selected and analyzed using finite element analysis. Figure 4 shows the microscopic image and the selected RVE sizes. The stress–strain curve is numerically obtained for each RVE size and compared with the experimentally obtained curve to determine the smallest adequate representative size.
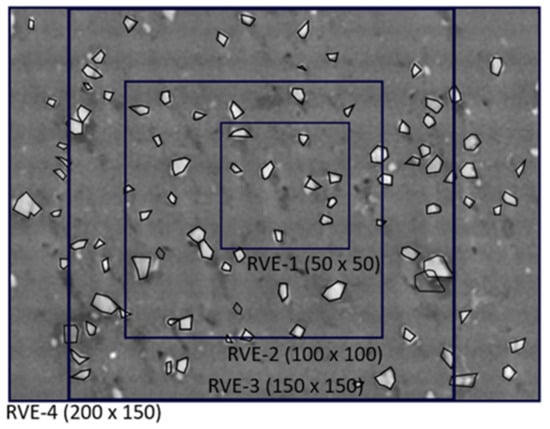
Figure 4.
Representation of the RVEs used in the study.
3.2. The Finite Elements Model
The FE model is developed using ANSYS/APDL. Since the FE model is two-dimensional, a quadratic four-node plane strain element, PLANE182, is used for both reinforcement and matrix elements. The reinforcement’s material is considered to have elastic behavior with Young’s modulus equal to 400 MPa and Poisson’s ratio equal to 0.3. In addition, the matrix material is modeled as an elastic–plastic material with isotropic power law hardening with Young’s modulus, Poisson’s ratio, and a hardening coefficient equal to 58.7 Mpa, 0.33, and 0.2, respectively. The bottom boundary of the composite matrix was fixed in all directions, and a vertical displacement with a value equal to 1% of the matrix height was applied at the top of the matrix. The adequate mesh size was obtained by checking several mesh refinements until the change in the results was neglected. The obtained global mesh size was equal to 1 × 10⁻³ mm and the refined mesh size at the interfaces was equal to 0.5× 10⁻³ mm, resulting in 8508 elements connected by 8912 nodes. The complete finite element model is shown in Figure 5.
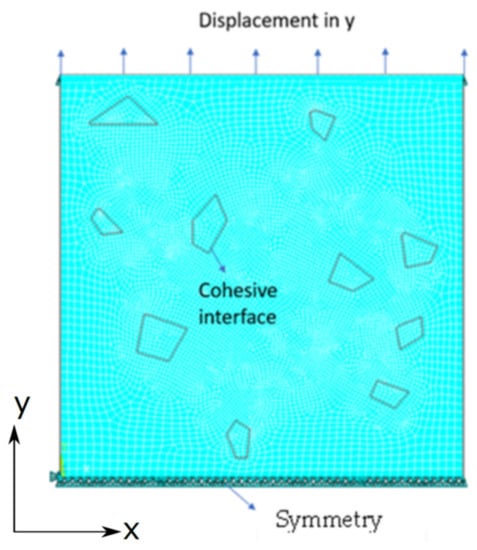
Figure 5.
The finite element model showing the boundary conditions and the cohesive interfaces.
3.3. The Interface Model
A cohesive zone model (CZM) is used to define the interfaces between the matrix and the reinforcements. In the finite element formulation, cohesive elements are zero-thickness surface elements located between two sets of elements. Each cohesive element is governed by a traction separation law that can describe the onset of the separation, the softening of the element, and the delamination. Many cohesive models are introduced such as bi-linear, multilinear, and exponential. This work uses the exponential cohesive law suggested by Needleman [43], as described by Equation (1).
where is the surface potential, e is the Euler number, is the cohesive strength, and , and are the normal and the tangential separation, is the normal separation across the interface where the maximum normal traction is attained at , and is the shear separation when the maximum shear traction is reached at . The normal and tangential separation are assumed to be equal with a value equal to 40 × 10−3 mm and tensile strength equal to 245 Mpa.
3.4. Prediction of the Stress–Strain Curve of the Composite
The FE model is used to evaluate the performance of the composite by predicting a stress–strain curve and comparing it with the experimental result. The numerical curve is calculated using the average stress and strain in the RVE using the following equations:
where and are the average stress and strain of the composite, V is the total volume of the composite, is the element number, is the volume of the element , is the stress of the element , and is the strain of element .
4. Results and Discussion
Figure 6 shows SEM pictures of Al-4% SiC nanocomposite rolled at different numbers of ARB cycles. The aluminum matrix may initially contain clusters of ceramic nanoparticles. This tendency intensifies when reinforcement is added. After the initial pass, the matrix-reinforcement relationship would be weak, leading to uneven reinforcement scattering between the matrices. To avoid clustering, increase the number of passes. The crushing and spreading of the SiC particles happened in the first to third cycles, and only these fragmented phases were transmitted in the last cycle. The micropores in the nanocomposite have also shrunk dramatically as the number of ARB cycles has increased. Before the ARB process, the nanocomposite shows nanoparticle-agglomerated regions, zones without nanoparticles, and holes. It is important to highlight that some of the SEM images (Figure 6a,d) were previously reported in an earlier study that dealt with a detailed microstructural study of this composite [18]. As illustrated in Figure 6f, SiC nanoparticles in an appropriate dispersion are established after the fifth ARB cycle, and the pores are eliminated. The zones without nanoparticles, agglomerations, and porosities are quickly reduced and vanish into the fifth cycle when the ARB procedure is used and the number of cycles is increased. The aluminum matrix is extruded and flows across clusters of nanoparticles at normal rolling pressure, enhancing their distribution [46,47]. This phenomenon is attributed to the high deformability of the aluminum matrix during the rolling process. The plastic flow of the aluminum matrix causes the SiC particle clusters to be broken and the SiC particles to be separated from each other, and as a result, to be more uniformly distributed in the aluminum matrix. When the sheets pass through the roll gap during each pass of the ARB process, the aluminum deforms plastically and extends, whereas the SiC layer is brittle and is broken up from the surface into fragments parallel to the rolling direction. Then, the virgin aluminum metal can flow through the fragments of the SiC layer and the powder layer. As a result, the metal–metal contact and finally the bonding between the aluminum sheets could be created. Improvements in the mechanical properties of the composite materials depend on the uniform distributions of the reinforcing particles in the matrix.
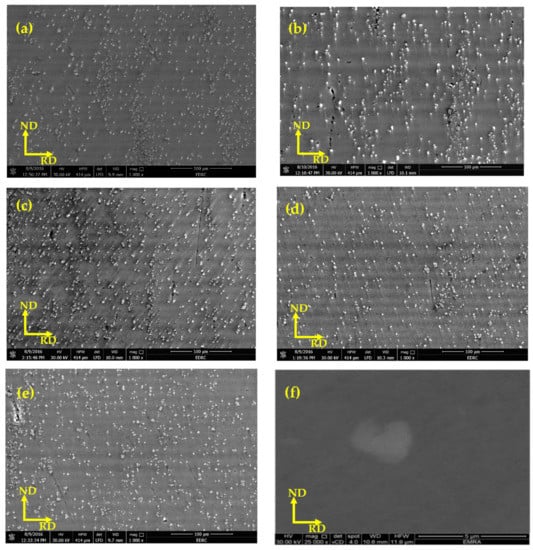
Figure 6.
SEM micrographs of Al-4%SiC: (a) after one ARB cycle, (b) after two ARB cycles, (c) after three ARB cycles, (d) after four ARB cycles, and (e,f) after five ARB cycles.
In the manufacture of an Al-4% SiC nanocomposite, Figure 7 shows the SEM micrograph and EDS analysis mapping pictures of the surface after five passes. The Al, Si, and C concentrations on the surfaces are shown, respectively, by green, blue, and red patches. Although the EDS analysis mapping image should typically only be covered in green spots, certain dark and black areas have been seen, and some parts of the surface have also been covered in dense, highly illuminated blue spots. As shown in Figure 7, blue and red specks in the EDS mapping image analysis have filled the entire screen, demonstrating that SiC nanoparticles are evenly distributed across the surface in up to five passes of the ARB process.
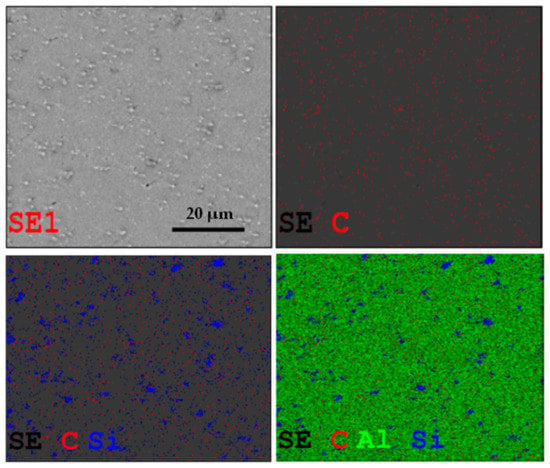
Figure 7.
SEM and EDS mapping analysis of Al-4%SiC nanocomposite sheets after five ARB passes.
Figure 8 shows the variation in the microhardness of the Al–SiC nanocomposites after five passes. The ARB procedure was used in this case, and the microhardness was increased. The first pass of the ARB resulted in the largest microhardness increase. In fact, the majority of work hardening occurs during the initial pass [48,49,50]. The slope of increasing microhardness decreases as the number of passes increases. Therefore, there is no discernible difference between the fourth and fifth passes in terms of microhardness changes. The sudden increase in microhardness in the fifth ARB cycle was due to the rise in tensile strength. The microhardness of the aluminum has grown in general as a result of accumulative rolling bonding, and the findings of this experiment are satisfactory [51,52]. The unreinforced ARBed sheet has a microhardness value of 53 HV, while the 4 wt.% SiC reinforced ARBed sheet has a microhardness value of 67 HV. The microhardness of the ARBed sheets rapidly rises in proportion to the addition of reinforcements as a result of the following processes: scratch brushing, cold working, grain refining, and SiC nanoparticle insertion. In our instance, the nanoparticles were dispersed evenly across the sheets, reducing the likelihood of agglomeration through up to five cycles of rolling. On the other hand, strain hardening and dislocation effects were produced due to the dislocation density and locked to stop dislocations [53,54].
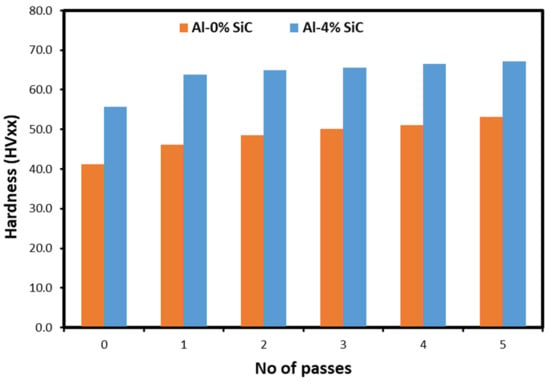
Figure 8.
Microhardness of Al–SiC nanocomposite sheets after five ARB passes. In the figure, xx is the load in kgf.
The tensile stress–strain behavior of the Al–SiC composite is shown in Figure 9. The improvement rates of the tensile strength were summarized in Figure 10. The improved tensile strength is attributed to the strengthening effect of the SiC nanoparticles, the strain hardening effect, and the dislocation movement impedance due to roll bonding [55,56,57,58,59]. It was reported previously that two main strengthening mechanisms occur during the ARB process: strain hardening by dislocations and grain refinement and misorientation [39,40]. In the early stages of the ARB process, strain hardening or dislocation strengthening play the main role in enhancing the strength, while the formation of submicron sub-grains or dislocation cells also contributes to the strength. However, at larger passes, higher strength is achieved by grain refinement as the ARB cycles increase. As the effect of work hardening diminishes, the gradual evolution of ultra-fine grains will play the main role in improving strength. This effect is related to the increasing number of ultra-fine grains and to the largely misoriented grain boundaries. An important point to note is that the strengthening of composites not only resulted from the mechanisms mentioned above, but also from the reinforcing role of the SiC particles in the aluminum matrix. Furthermore, it can be seen that by adding SiC particles to the matrix, tensile strength was improved which is consistent with all the research about the composite [38,39]. These are related to three main effects of SiC particles. First, during the tensile test, the SiC particles act as a barrier to dislocation movement, causing the enhancement of strength. The second is that the presence of SiC particles in the soft aluminum matrix generates dislocation to pile up in their neighborhood. The third is that the tensile strength of SiC is around 27 times larger than Al. Therefore, the dislocation density in the matrix near the aluminum–SiC interfaces increases to enhance strength. In other words, pinning the dislocations and impeding their motion by SiC particles results in enhanced dislocation density, dislocation–dislocation interactions, and, thereby, improved strength.
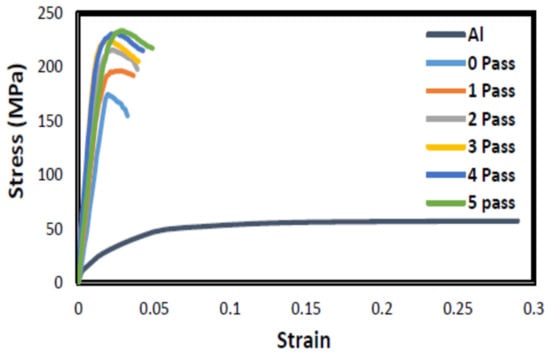
Figure 9.
Stress–strain curves of Al and Al/4%SiC composite produced by the ARB process at various passes.
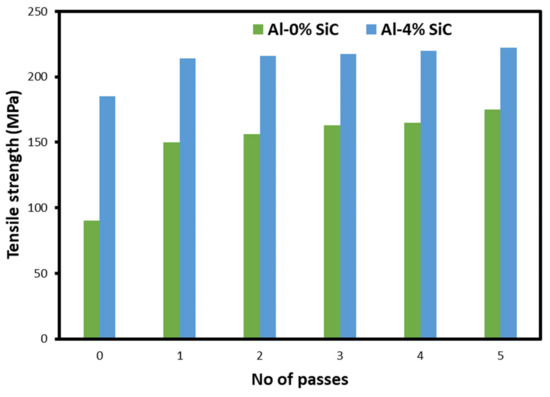
Figure 10.
Tensile strength of Al–SiC nanocomposite sheets after five ARB passes.
Figure 11 shows the experimentation tensile stress–strain curves of pure Al and an Al–SiC composite as well as the numerical tensile stress–strain curves for the four RVE models. The RVE models include the cohesive interface model that is detrimental to the overall composite strength. Many results can be inferred from the figure as follows. The experimental stress–strain curve of the pure aluminum has the lowest Young’s modulus and yielding point (E = 54 GPa Sy = 190 MPa). This is because pure aluminum is more ductile and less stiff than the Al–SiC composite. Meanwhile, the Al–SiC composite possesses a higher elastic modulus and yielding point (E = 63.13 GPa Sy = 243 MPa) because of the reinforcement particles that share the applied load with the matrix and resist the plastic flow of grains. In addition, Figure 11 shows that the numerical stress–strain curve of the smallest RVE 50 × 50 μm has the highest elastic modulus and yielding point (E = 72.4 GPa, Sy = 289.4 MPa). This is reasonable since this volume has a higher ratio of reinforcement to matrix area which overestimates the strength. Moreover, the stress–strain curves of the RV models two, three, and four show good agreements with the experimental Al–SiC composite stress–strain curve in the elastic and plastic zones. The next table shows the values of the elastic modulus, yielding point, and tangent modulus of the RVE models.
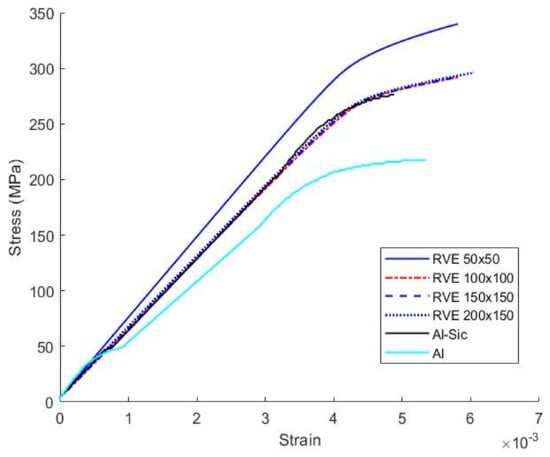
Figure 11.
The experimentally obtained stress–strain curve vs. the numerically obtained curves for all RVE sizes. In the legend Al, & Al-Sic. Refer to experimental results.
The results in Table 2 show that a small RVE is not representative of the composite strength, and it can overestimate the strength behavior. In addition, as the RVE size increases, the computational results approach the experimental results. However, a non-square RVE size such as RVE-4 shows less accurate results than smaller RVE sizes, i.e., RVE-2 and RVE-3. From the table, both RVE-2 and RVE-3 models can be considered as representative sizes for the composite, and the RVE-2 model is selected for further investigations since it is computationally cheaper.

Table 2.
The experimentation results and computational results of the RVE models.
Figure 12 presents the plastic strain maps in the Al–SiC nanocomposite considering the cohesive zone interface between the matrix and the reinforcement particles. As shown in the figure, the plastic strains are localized at sharp corners of the particles which act as stress risers. Therefore, these locations indicate the initiation of matrix–particle decohesion zones at which the initiations of cracks occur.
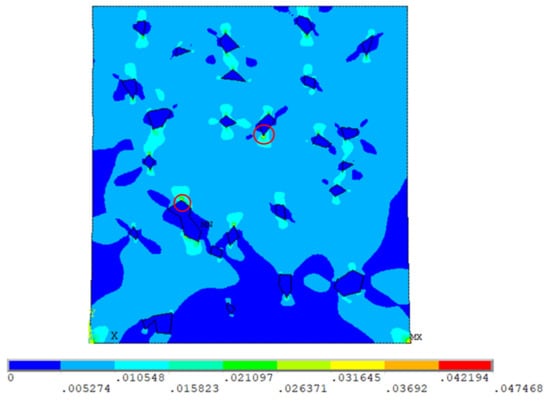
Figure 12.
The equivalent plastic strain (%) of RVE 2. The red circles represent strain localization.
Figure 13 shows the shear plastic strain distribution concentrations in the Al–SiC nanocomposite. Higher values of shear strain are observed at the sharp corners of the enforcement particles, which indicates the same interpretation of the damage initiation at the particle’s sharp corners. Additionally, Figure 14 shows that high hydrostatic pressure values occur at the enforcement particle edges, which indicates the separation forces at those locations and supports the obtained results.
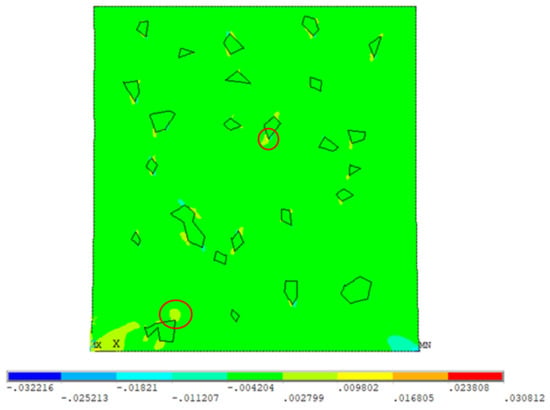
Figure 13.
The shear plastic strain (%) of RVE 2. The red circles represent strain localization.
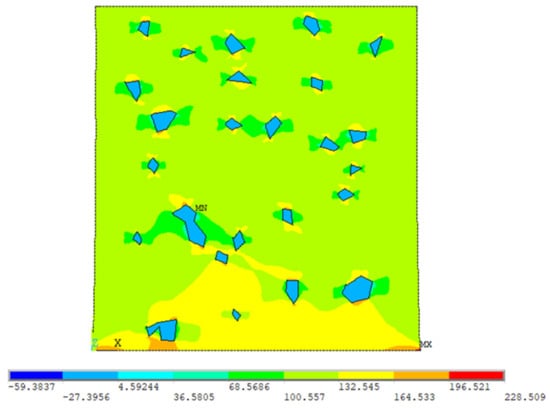
Figure 14.
The hydrostatic pressure (MPa) of RVE 2.
5. Conclusions
In this study, an experimental and numerical investigation of the mechanical response of an Al–SiC nanocomposite produced by the accumulative roll bonding technique was presented. The effect of the number of ARB cycles on the microstructural and mechanical responses was studied experimentally until a homogenous microstructure was achieved. Then, an elastoplastic cohesive zone model was deployed to predict the damage in the Al–SiC nanocomposites using representative volume finite element modeling. The following points are concluded based on the study:
- The result of the proposed micro-model successfully predicts the experimentally obtained results of the Al–SiC macrocomposite. The numerically obtained stress–strain curve was comparable with the experimental one.
- The size of the used RVE was significantly influential on the model’s adequacy. A small RVE overestimated the stress–strain curve, and larger sizes were more accurate. This leads to the conclusion that an investigation should be conducted to choose the correct RVE size before further study. This investigation can be performed by studying different RVE sizes and identifying the sizes at which the differences in the results are small.
- Plastic strain, shear strain, and hydrostatic pressure results show that the sharp corners of the enforcement particles act as stress risers which produce higher stress values. The higher stress may cause the failure of the cohesive interfaces and eventually particle separation.
Author Contributions
G.S.A., project administration, funding acquisition, and data curation; A.M.S., software, validation, formal analysis, and investigation; M.E., Conceptualization, methodology, review, and editing. All authors have read and agreed to the published version of the manuscript.
Funding
This project was funded by the Deanship of Scientific Research (DSR) at King Abdulaziz University, Jeddah, under grant no. G: 67-135-1442. The authors, therefore, acknowledge with thanks the DSR for technical and financial support.
Institutional Review Board Statement
Not applicable.
Informed Consent Statement
Not applicable.
Data Availability Statement
Not applicable.
Conflicts of Interest
The authors declare no conflict of interest.
Nomenclature
| MMNCs | Metal matrix nanocomposites |
| MMCs | Metal matrix composites |
| SEM | Scanning electron microscope |
| EDS | Spectrometer of energy dispersive |
| RVE | Representative Volume Element |
| CZM | Cohesive zone model |
| ARB | Accumulative roll bonding |
| FE | Finite Elements |
References
- Salimi, A.; Borhani, E.; Emadoddin, E. Evaluation of Mechanical Properties and Structure of 1100-Al Reinforced with ZrO2 Nano-particles via Accumulatively Roll bonded. Procedia Mater. Sci. 2015, 11, 67–73. [Google Scholar] [CrossRef]
- Elwan, M.; Fathy, A.; Wagih, A.; Essa, A.R.S.; Abu-Oqail, A.; EL-Nikhaily, A.E. Fabrication and investigation on the properties of ilmenite (FeTiO3)-based Al composite by accumulative roll bonding. J. Compos. Mater. 2020, 54, 1259–1271. [Google Scholar] [CrossRef]
- Taherzadeh Mousavian, R.; Behnamfard, S.; Heidarzadeh, A.; Taherkhani, K.; Azari Khosroshahi, R.; Brabazon, D. Incorporation of SiC Ceramic Nanoparticles into the Aluminum Matrix by a Novel Method: Production of a Metal Matrix Composite. Met. Mater. Int. 2021, 27, 2968–2976. [Google Scholar] [CrossRef]
- Sadoun, A.M.; Abd El-Wadoud, F.; Fathy, A.; Kabeel, A.M.; Megahed, A.A. Effect of through-the-thickness position of aluminum wire mesh on the mechanical properties of GFRP/Al hybrid composites. J. Mater. Res. Technol. 2021, 15, 500–510. [Google Scholar] [CrossRef]
- Sadoun, A.M.; Meselhy, A.F.; Deabs, A.W. Improved strength and ductility of friction stir tailor-welded blanks of base metal AA2024 reinforced with interlayer strip of AA7075. Results Phys. 2020, 16, 102911. [Google Scholar] [CrossRef]
- Najjar, I.R.; Sadoun, A.M.; Fathy, A.; Abdallah, A.W.; Elaziz, M.A.; Elmahdy, M. Prediction of Tribological Properties of Alumina-Coated, Silver-Reinforced Copper Nanocomposites Using Long Short-Term Model Combined with Golden Jackal Optimization. Lubricants 2022, 10, 277. [Google Scholar] [CrossRef]
- Sadoun, A.M.; Najjar, I.M.R.; Abd-Elwahed, M.S.; Meselhy, A. Experimental study on properties of Al–Al2O3 nanocomposite hybridized by graphene nanosheets. J. Mater. Res. Technol. 2020, 9, 14708–14717. [Google Scholar] [CrossRef]
- Rahmatabadi, D.; Hashemi, R.; Mohammadi, B.; Shojaee, T. Experimental evaluation of the plane stress fracture toughness for ultra-fine grained aluminum specimens prepared by accumulative roll bonding process. Mater. Sci. Eng. A 2017, 708, 301–310. [Google Scholar] [CrossRef]
- Sadoun, A.M.; Wagih, A.; Fathy, A.; Essa, A.R.S. Effect of tool pin side area ratio on temperature distribution in friction stir welding. Results Phys. 2019, 15, 102814. [Google Scholar] [CrossRef]
- Mahallawy, N.E.; Fathy, A.; Hassan, M.; Abdelaziem, W. Evaluation of mechanical properties and microstructure of Al/Al–12% Si multilayer via warm accumulative roll bonding process. J. Compos. Mater. 2017. [Google Scholar] [CrossRef]
- Hassan, A.; El-Hamid, A.; Wagih, A.; Fathy, A. Effect of mechanical milling on the morphologyand structural evaluation of Al-Al2O3 nanocomposite powders. Int. J. Eng. 2014, 27, 625–632. [Google Scholar]
- Ma, Y.-L.; Li, J.-F.; Sang, F.-J.; Li, H.-J.; Zheng, Z.-Q.; Huang, C. Grain structure and tensile property of Al-Li alloy sheet caused by different cold rolling reduction. Trans. Nonferrous Met. Soc. China Engl. Ed. 2019, 29, 1569–1582. [Google Scholar] [CrossRef]
- Ghalehbandi, S.M.; Malaki, M.; Gupta, M. Accumulative Roll Bonding—A Review. Appl. Sci. 2019, 9, 3627. [Google Scholar] [CrossRef]
- Rahmatabadi, D.; Pahlavani, M.; Gholami, M.D.; Marzbanrad, J.; Hashemi, R. Production of Al/Mg-Li composite by the accumulative roll bonding process. J. Mater. Res. Technol. 2020, 9, 7880–7886. [Google Scholar] [CrossRef]
- Rao, X.; Wu, Y.; Pei, X.; Jing, Y.; Luo, L.; Liu, Y.; Lu, J. Influence of rolling temperature on microstructural evolution and mechanical behavior of AZ31 alloy with accumulative roll bonding. Mater. Sci. Eng. A 2019, 754, 112–120. [Google Scholar] [CrossRef]
- Fathy, A.; Shaker, A.; Hamid, M.A.; Megahed, A.A. The effects of nano-silica/nano-alumina on fatigue behavior of glass fiber-reinforced epoxy composites. J. Compos. Mater. 2017, 51, 1667–1679. [Google Scholar] [CrossRef]
- Ivanov, K.V.; Ovcharenko, V.E. Structural features of ultrafine-grained aluminum processed through accumulative roll bonding providing improved mechanical properties and thermal stability. Mater. Sci. Eng. A 2020, 775, 138988. [Google Scholar] [CrossRef]
- Meselhy, A.F.; Reda, M.M. Investigation of mechanical properties of nanostructured Al-SiC composite manufactured by accumulative roll bonding. J. Compos. Mater. 2019, 53, 3951–3961. [Google Scholar] [CrossRef]
- Fathy, A.; Ibrahim, D.; Elkady, O.; Hassan, M. Evaluation of mechanical properties of 1050-Al reinforced with SiC particles via accumulative roll bonding process. J. Compos. Mater. 2019, 53, 209–218. [Google Scholar] [CrossRef]
- Abu-Oqail, A.; Wagih, A.; Fathy, A.; Elkady, O.; Kabeel, A.M. Effect of high energy ball milling on strengthening of Cu-ZrO2 nanocomposites. Ceram. Int. 2019, 45, 5866–5875. [Google Scholar] [CrossRef]
- Fathy, A.; Sadoun, A.; Abdelhameed, M. Effect of matrix/reinforcement particle size ratio (PSR) on the mechanical properties of extruded Al–SiC composites. Int. J. Adv. Manuf. Technol. 2014, 73, 1049–1056. [Google Scholar] [CrossRef]
- Fathy, A.; Wagih, A.; Abu-Oqail, A. Effect of ZrO2 content on properties of Cu-ZrO2 nanocomposites synthesized by optimized high energy ball milling. Ceram. Int. 2019, 45, 2319–2329. [Google Scholar] [CrossRef]
- Abu-Oqail, A.; Samir, A.; Essa, A.R.S.; Wagih, A.; Fathy, A. Effect of GNPs coated Ag on microstructure and mechanical properties of Cu-Fe dual-matrix nanocomposite. J. Alloys Compd. 2019, 781, 64–74. [Google Scholar] [CrossRef]
- Mohamed, A.; Mohammed, M.M.; Ibrahim, A.F.; El-Kady, O.A. Effect of nano Al2O3 coated Ag reinforced Cu matrix nanocomposites on mechanical and tribological behavior synthesis by P/M technique. J. Compos. Mater. 2020, 54, 4921–4928. [Google Scholar] [CrossRef]
- Wagih, A.; Fathy, A.; Kabeel, A.M. Optimum milling parameters for production of highly uniform metal-matrix nanocomposites with improved mechanical properties. Adv. Powder Technol. 2018, 29, 2527–2537. [Google Scholar] [CrossRef]
- Sadoun, A.M.; Fathy, A. Experimental study on tribological properties of Cu–Al2O3 nanocomposite hybridized by graphene nanoplatelets. Ceram. Int. 2019, 45, 24784–24792. [Google Scholar] [CrossRef]
- Amirkhanlou, S.; Ketabchia, M.; Parvin, N.; Khorsand, S.; Bahrami, R. Accumulative Press Bonding; a Novel Manufacturing Process of Nanostructured Metal Matrix Composites. Mater. Des. 2013, 51, 367–374. [Google Scholar] [CrossRef]
- Liu, C.Y.; Wang, Q.; Jia, Y.Z.; Zhang, B.; Jing, R.; Ma, M.Z.; Jing, Q.; Liu, R.P. Effect of W Particles on the Properties of Accumulatively Roll Bonded Al/W Composites. Mater. Sci. Eng. A 2012, 547, 120–124. [Google Scholar] [CrossRef]
- Wagih, A.; Fathy, A.; Sebaey, T.A. Experimental investigation on the compressibility of Al/Al2O3 nanocomposites. Int. J. Mater. Prod. Technol. 2016, 52, 312–332. [Google Scholar] [CrossRef]
- Azad, B.; Borhani, E.; Semnani, H.M. Fracture behavior of Al-0.2wt%Zr alloy processed by accumulative roll-bonding (ARB) process. Kov. Mater. 2016, 54, 9–15. [Google Scholar] [CrossRef]
- Azad, B.; Semnani, H.M.; Borhani, E. Microstructure Evolution and Mechanical Properties of Nano-structured Al–0.2 wt%Zr Alloy Fabricated by Accumulative Roll Bonding (ARB) Process. Trans. Indian Inst. Met. 2017, 70, 2725–2732. [Google Scholar] [CrossRef]
- Alizadeh, M.; Samiei, M. Fabrication of nanostructured Al/Cu/Mn metallic multilayer composites by accumulative roll bonding process and investigation of their mechanical properties. Mater. Des. 2014, 56, 680–684. [Google Scholar] [CrossRef]
- Yaghtin, A.H.; Salahinejad, E.; Khosravifard, A. Processing of nanostructuredmetallic matrix composites by a modified accumulative roll bonding method with structural and mechanical considerations. Int. J. Miner. Metall. Mater. 2012, 19, 951–956. [Google Scholar] [CrossRef]
- Farajzadeh, H.; Toroghinejad, M.R.; Raeissi, K. Fabrication of Al/Al2O3/TiC hybrid composite by anodizing and accumulative roll bonding processes and investigation of its microstructure and mechanical properties. J. Mater. Sci. Eng. A 2013, 585, 460–467. [Google Scholar] [CrossRef]
- Rezayat, M.; Akbarzadeh, A.; Owhadi, A. Production of high strength Al–Al2O3 composite by accumulative roll bonding. Compos. Part A 2012, 43, 261–267. [Google Scholar] [CrossRef]
- Wagih, A.; Fathy, A. Experimental investigation and FE simulation of nano-indentation on Al–Al2O3 nanocomposites. Adv. Powder Technol. 2016, 27, 403–410. [Google Scholar] [CrossRef]
- Wagih, A.; Maimí, P.; Blanco, N.; Trias, D. Predictive model for the spherical indentation of composite laminates with finite thickness. Compos. Struct. 2016, 153, 468–477. [Google Scholar] [CrossRef]
- Wagih, A.; Fathy, A. Experimental investigation and FE simulation of spherical indentation on nano-alumina reinforced copper-matrix composite produced by three different techniques. Adv. Powder Technol. 2017, 28, 1954–1965. [Google Scholar] [CrossRef]
- Wagih, A.; Fathy, A.; Ibrahim, D.; Elkady, O.; Hassan, M. Experimental investigation on strengthening mechanisms in Al-SiC nanocomposites and 3D FE simulation of Vickers indentation. J. Alloys Compd. 2018, 752, 137–147. [Google Scholar] [CrossRef]
- Wagih, A.; Attia, M.A.; AbdelRahman, A.A.; Bendine, K.; Sebaey, T.A. On the indentation of elastoplastic functionally graded materials. Mech. Mater. 2019, 129, 169–188. [Google Scholar] [CrossRef]
- Eltaher, M.A.; Attia, M.A.; Wagih, A. Predictive model for indentation of elasto-plastic functionally graded composites. Compos. Part B Eng. 2020, 197, 108129. [Google Scholar] [CrossRef]
- Mahmoodi, M.J.; Aghdam, M.M.; Shakeri, M. Micromechanical modeling of interface damage of metal matrix composites subjected to off-axis loading. Mater. Des. 2010, 31, 829–836. [Google Scholar] [CrossRef]
- Eltaher, M.A.; Wagih, A. Micromechanical modeling of damage in elasto-plastic nanocomposites using unit cell representative volume element and cohesive zone model. Ceram. Int. 2020, 46, 10469–10480. [Google Scholar] [CrossRef]
- MATLAB and Statistics Toolbox; Version 2019b; The MathWorks, Inc.: Natick, MA, USA, 2019.
- Swanson Analysis Systems. ANSYS Engineering Analysis System User’s Manual; Swanson Analysis Systems: Houston, PA, USA, 1985. [Google Scholar]
- Khdair, A.I.; Fathy, A. Enhanced strength and ductility of Al-SiC nanocomposites synthesized by accumulative roll bonding. J. Mater. Res. Technol. 2020, 9, 478–489. [Google Scholar] [CrossRef]
- Najjar, I.M.R.; Sadoun, A.M.; Abd Elaziz, M.; Abdallah, A.W.; Fathy, A.; Elsheikh, A.H. Predicting kerf quality characteristics in laser cutting of basalt fibers reinforced polymer composites using neural network and chimp optimization. Alex. Eng. J. 2022, 61, 11005–11018. [Google Scholar] [CrossRef]
- Amirkhanlou, S.; Rezaei, M.R.; Niroumand, B.; Toroghinejad, M.R. Refinement of microstructure and improvement of mechanical properties of Al/Al2O3 cast composite by accumulative roll bonding process. Mater. Sci. Eng. A 2011, 528, 2548–2553. [Google Scholar] [CrossRef]
- Ardakani, M.R.K.; Khorsand, S.; Amirkhanlou, S.; Nayyeri, M.J. Application of compocasting and cross accumulative roll bonding processes for manufacturing high-strength, highly uniform and ultra-fine structured Al/SiCp nanocomposite. Mater. Sci. Eng. A 2014, 592, 121–127. [Google Scholar] [CrossRef]
- Jamaati, R.; Toroghinejad, M.R.; Amirkhanlou, S.; Edris, H. Strengthening mechanisms in nanostructured interstitial free steel deformed to high strain. Mater. Sci. Eng. A 2015, 639, 656–662. [Google Scholar] [CrossRef]
- Sadoun, A.M.; Najjar, I.R.; Alsoruji, G.S.; Abd-Elwahed, M.S.; Elaziz, M.A.; Fathy, A. Utilization of improved machine learning method based on artificial hummingbird algorithm to predict the tribological behavior of Cu-Al2O3 nanocomposites synthesized by in situ method. Mathematics 2022, 10, 1266. [Google Scholar] [CrossRef]
- Rahmatabadi, D.; Shahmirzaloo, A.; Farahani, M.; Tayyebi, M.; Hashemi, R. Characterizing the elastic and plastic properties of the multilayered Al/Brass composite produced by ARB using DIC. Mater. Sci. Eng. A 2019, 753, 70–78. [Google Scholar] [CrossRef]
- Tayyebi, M.; Eghbali, B. Microstructure and mechanical properties of SiC particle- strengthening tri-metal Al/Cu/Ni composite produced by accumulative roll bonding process. Int. J. Miner. Metall. Mater. 2018, 25, 357–364. [Google Scholar] [CrossRef]
- Sadoun, A.M.; Fathy, A.; Abu-Oqail, A.; Elmetwaly, H.T.; Wagih, A. Structural, mechanical and tribological properties of Cu–ZrO2/GNPs hybrid nanocomposites. Ceram. Int. 2020, 46, 7586–7594. [Google Scholar] [CrossRef]
- Khamaj, A.; Farouk, W.M.; Shewakh, W.M.; Abu-Oqail, A.M.I.; Wagih, A.; Abu-Okail, M. Effect of lattice structure evolution on the thermal and mechanical properties of Cu–Al2O3/GNPs nanocomposites. Ceram. Int. 2021, 47, 16511–16520. [Google Scholar] [CrossRef]
- Najjar, I.M.R.; Sadoun, A.M.; Alsoruji, G.S.; Abd Elaziz, M.; Wagih, A. Predicting the mechanical properties of Cu–Al2O3 nanocomposites using machine learning and finite element simulation of indentation experiments. Ceram. Int. 2022, 48, 7748–7758. [Google Scholar] [CrossRef]
- Wagih, A.; Shaat, M. The dependence of accumulative roll bonded copper mechanical properties on grain sub-division, stacking faults, and lattice strains. Mater. Sci. Eng. A 2019, 756, 190–197. [Google Scholar] [CrossRef]
- Eltaher, M.A.; Wagih, A.; Melaibari, A.; Fathy, A.; Lubineau, G. Effect of Al2O3 particles on mechanical and tribological properties of Al–Mg dual-matrix nanocomposites. Ceram. Int. 2020, 46, 5779–5787. [Google Scholar] [CrossRef]
- Barakat, W.S.; Wagih, A.; Elkady, O.A.; Abu-Oqail, A.; Fathy, A.; El-Nikhaily, A. Effect of Al2O3 nanoparticles content and compaction temperature on properties of Al–Al2O3 coated Cu nanocomposites. Compos. Part B Eng. 2019, 175, 107140. [Google Scholar] [CrossRef]
Publisher’s Note: MDPI stays neutral with regard to jurisdictional claims in published maps and institutional affiliations. |
© 2022 by the authors. Licensee MDPI, Basel, Switzerland. This article is an open access article distributed under the terms and conditions of the Creative Commons Attribution (CC BY) license (https://creativecommons.org/licenses/by/4.0/).