Abstract
The tensile, creep, fatigue and creep-fatigue tests of the nickel-based superalloy GH4169 were carried out. According to the deformation characteristics of GH4169 alloy, the Ohno-Karim kinematic model (O-K model) can be used to describe the tensile behavior. The creep constitutive model presented in this paper can be used to predict the three-stage creep characteristics of the GH4169 alloy. The modified Ohno-Karim kinematic hardening model, combined with an isotropic hardening model, can well predict the cyclic softening behavior of the material under symmetric loads and the mean stress relaxation behavior under asymmetric loads. Based on the modified Ohno-Karim kinematic hardening model, isotropic hardening model and creep constitutive model, a non-unified constitutive model was established. The creep-fatigue behavior of the GH4169 alloy under symmetric and asymmetric loads is simulated by using the non-unified constitutive model. The simulation results are very close to the experimental results; however, the prediction results of the time-dependent relaxation load are relatively small.
1. Introduction
The turbine disk is an important part of the aero engine. The grooves of the turbine disk are subjected to asymmetric creep-fatigue loads. Accurate description of the deformation response of materials under asymmetric load is the basis for scientifically predicting the creep-fatigue life of the groove. The deformation responses of the material are more complex under asymmetric loading. It will show not only cyclic softening or cyclic hardening behavior, but also ratcheting and mean stress relaxation behavior. The material will also be subjected to creep loads at high temperatures. The grooves of the turbine disc may contain all of the above deformation behaviors.
Chaboche [1] employed two internal variable equations of the Armstrong-Frederick nonlinear kinematic hardening model (A-F model) [2] and isotropic hardening model to describe the deformation behavior of materials well under symmetric loads. However, this method would lead to excessive ratchet strain under asymmetric loads [3]. Subsequently, Chaboche and Nouailhas [4,5,6,7] analyzed several possible forms of the constitutive equation to reduce the predicted ratcheting without disturbing the tensile plastic flow. It was of great significance that they proposed a kinematic hardening model with thresholds in the dynamic recovery term. Ohno and Wang [8,9] proposed a kinematic hardening model in terms of nonintersecting multisurfaces, called the O-W I model. Ohno and Abdel-Karim [10,11] proposed a new kinematic hardening model called the O-K model, which was developed by furnishing the A-F model with the O-W I model. The O-K model was successful in simulating multiaxial ratcheting and multiaxial cyclic stress relaxation responses.
The creep deformation behavior can be described by the kinematic hardening model with the steady-state recovery term; however, this method can only describe the second stage of creep. With the development of the creep constitutive model, many constitutive models describing the characteristics of three stages of creep have been proposed, such as the θ projection method [12,13,14], Kachanov-Rabotnov model [15,16,17,18,19,20], Wilshire model [21,22,23,24], etc. The description of creep-fatigue behavior can also be realized by the non-unified models, which considered that the inelastic strain can be decomposed into the time-independent plastic strain and creep strain [25,26,27,28]. The parameters of the creep constitutive model can be obtained from the creep tests so that the creep deformation behavior can be better described.
The purpose of this paper is to systematically establish the cyclic constitutive model of nickel-base superalloys GH4169 for turbine discs. The mechanical properties tests of GH4169 were carried out systematically, including the tensile test, creep test, fatigue and creep-fatigue test. The constitutive model established can describe the tensile, creep, fatigue and creep-fatigue behavior of the material and lay a foundation for predicting the life of the turbine disc in the future.
2. Experimental Procedures
2.1. Materials
The nickel-based superalloy GH4169 is commonly used in aero-engine turbine disks. This material has good comprehensive properties at high temperatures. The heat treatment process of this material is as follows: first heated to 720 °C and held for 8 h; subsequently, furnace-cooled at a rate of 50 °C/h to 620 °C and then, held for 8 h; and finally, air-cooled to a room temperature condition. The main chemical components of the GH4169 alloy provided by the manufacturer are shown in Table 1. The metallographic structure of the sample is observed under an optical microscope, as shown in Figure 1. It can be seen from the metallograph that the structure of the GH4169 alloy is uniform and the grain size is about 100 μm, with some twin structures and a small amount of inclusions.

Table 1.
Chemical components of GH4169 alloy.
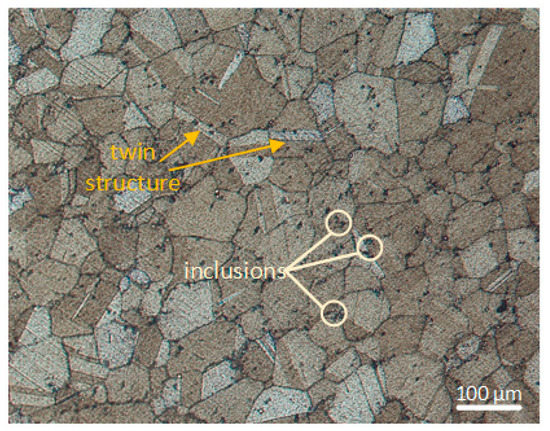
Figure 1.
Metallographic structure of GH4169.
2.2. Tensile Tests and Results
The tensile tests were performed on a Zwick/Roell machine (ZwickRoell Testing Technology Co., Ltd., Shanghai, China). Prior to the test, the samples were heated to the test temperature of 600 °C with an environmental box and held for half an hour to ensure the uniform temperature inside the samples. The gauge length of the sample is set to 25 mm according to the extensometer and the deformation of the sample is monitored throughout the tensile process.
The tensile test results are an important reference for the formulation of the creep, fatigue and creep-fatigue tests. The description of tensile behavior is the basis of other tests. Three strain rates of 5 × 10⁻⁴/s, 2 × 10⁻³/s and 1 × 10⁻²/s were used for the tensile tests. The engineering stress-engineering strain curves obtained from quasi-static tensile tests at different strain rates are shown in Figure 2. The curves of the same strain rate almost coincide. The curves of all the strain rates show unstable plastic flow as serrations in varying degrees. It is the typical Portevin Le Chatelier (PLC) effect. The most commonly accepted explanation for the phenomenon of the PLC effect is based on a model called dynamic strain ageing (DSA), which is defined as the interaction between the moving dislocations and diffusing solute atoms [29,30]. It also leads to the phenomenon that the tensile curve with the smallest strain rate (5 × 10⁻⁴/s) will have the greatest stress under the same strain. The stress–strain curve exhibits a negative strain rate sensitivity. The behavior of the negative strain rate sensitivity cannot be described by the viscoplastic model. The curves of the strain rate 1 × 10⁻²/s and 2 × 10⁻³/s are very close, as shown in Figure 2d. The tensile strain rates of the fatigue and creep-fatigue tests are between 2 × 10⁻³/s and 1 × 10⁻²/s in this paper. Therefore, the total strain rate can be divided into three parts without considering the effect of viscoplasticity:
where is the elastic strain rate, is the plastic strain rate and is the creep strain rate.
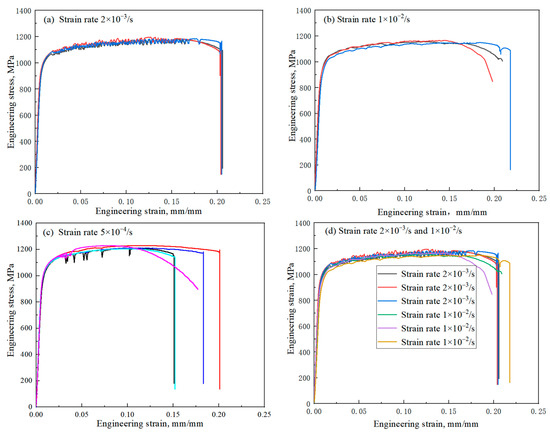
Figure 2.
Tensile test results at different strain rates: (a) 2 × 10³/s; (b) 1 × 10⁻²/s; (c) 5 × 10⁻⁴/s; (d) 2 × 10⁻³/s and 1 × 10⁻²/s.
2.3. Creep Tests and Results
The creep tests were performed on the creep testing machine Qianbang QBR-100 (Changchun Qianbang Test Equipment Co., Ltd., Changchun, China). The samples were heated to the test temperature and held for 1 h to ensure the uniform temperature inside the samples prior to the test. The temperature control system of the testing machine guarantees temperature fluctuation less than 2 °C and the load control system enables the applied load error not to exceed 0.5%.
The creep testing loads can be roughly determined according to the tensile strength of the material. The test time of creep test is generally long and the ultimate tensile strength is the maximum value that the creep test load can achieve. In this paper, 80% of the ultimate tensile strength is selected as the maximum load of the creep test at 600 °C and then, the load is gradually reduced. At the same time, to verify the generality of the creep constitutive model proposed later, this paper also supplemented the creep tests at 650 °C. Considering that the tests at 650 °C are only confirmatory, the maximum life is controlled within 350 h.
The creep curve generally shows the characteristics of three stages of creep. The primary stage is characterized by the gradual decline of the creep strain rate, with the increase in creep time at a short time. When the creep strain rate decreases to the minimum value, it indicates the beginning of the second stage of creep. The creep strain rate is nearly constant at the second stage. When the creep strain rate reaches 2 times of the minimum strain rate, it indicates the beginning of the accelerated creep stage [31]. It can be seen from Figure 3 that the creep curve of the GH4169 alloy is mainly composed of the second and accelerated creep stage. The primary stage of creep is relatively insignificant and the creep time of the first stage accounts for less than 10% of the total life. The second stage of creep occupies the main time of creep, accounting for more than 60%. The deformation of the accelerated creep stage is the largest, accounting for more than 60% of the total creep deformation. The creep fracture strain is also called creep ductility. The creep ductility of 865 MPa and 825 MPa are obviously greater than that of other loads. Perhaps due to the small number of tests, there is no obvious law for the change of the ductility with stress in this paper.
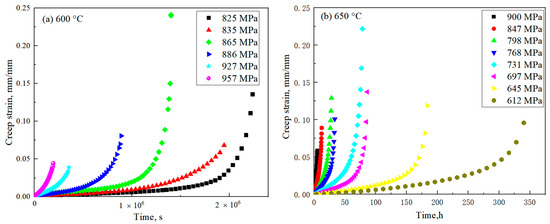
Figure 3.
Creep strain–time curves of the GH4169 alloy at different temperatures: (a) 600 °C; (b) 650 °C.
2.4. Fatigue and Creep-Fatigue Tests and Results
The fatigue and creep-fatigue tests were carried out on an Instron fatigue testing machine (Instron Corp., Norwood, MA, USA). The samples were held for over half an hour at the test temperature and the temperature-controlling errors of the test section are less than 2 °C.
Materials will exhibit cyclic softening or hardening under symmetric cyclic loading. The GH4169 alloy is a kind of cyclic softening material. The hysteresis loops of the first 10 cycles under uniaxial strain-controlled cyclic with a constant strain amplitude are shown in Figure 4. The peak stress decreases with the number of cycles. The yield point, which is defined as the boundary point between elasticity and plasticity, decreases with the increasing number of cycles. The yield radius decreases with the increasing number of cycles in essence. This phenomenon of the softening or hardening of materials can be described by an isotropic hardening model.
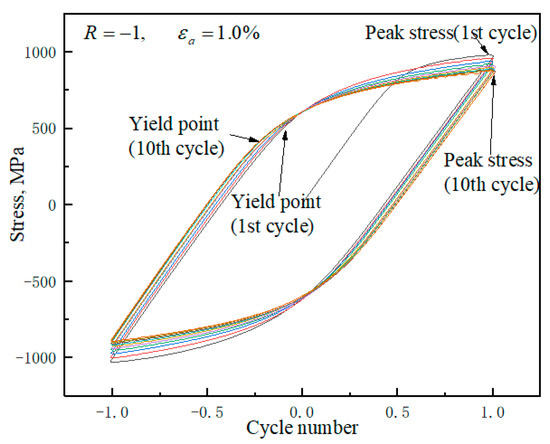
Figure 4.
The hysteresis loops of the first 10 cycles.
Due to the cyclic softening effect of materials, the stress amplitude decreases with the number of cycles, as shown in Figure 5. The stress amplitude can be divided into three stages: the amplitude in the first stage decreases rapidly; the amplitude in the second stage decreases steadily; and the material in the third stage tends to show severe softening effects, and the stress amplitude drops sharply until fracture. This is caused by the crack on the sample surface and the reduction of the net-bearing area.
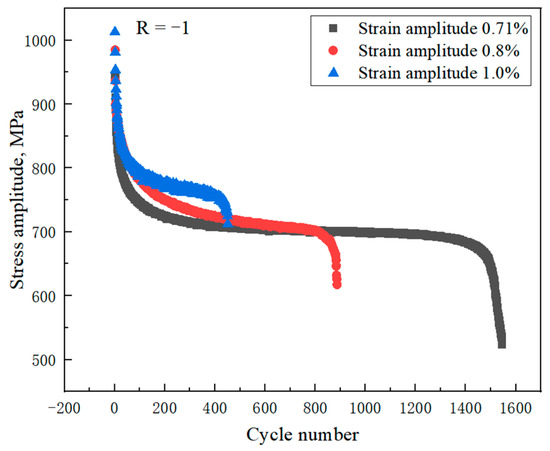
Figure 5.
Results of cyclic softening characteristic test of GH4169 alloy.
The material shows a mean stress relaxation under the strain-controlled asymmetric load. The average stress relaxation curve is similar to the cyclic softening curve, which also has three stages, as shown in Figure 6.
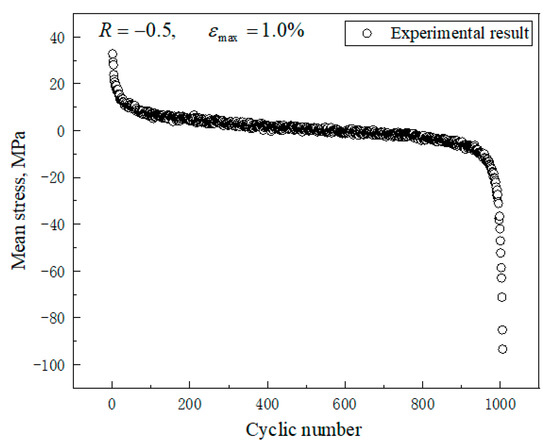
Figure 6.
Results of mean stress relaxation characteristic test of GH4169 alloy.
The material exhibits not only cyclic softening and mean stress relaxation, but also time-dependent stress relaxation behavior under the strain-controlled creep-fatigue load, as shown in Figure 7a. The stress relaxation behavior has little influence on the cyclic softening behavior, as shown in Figure 7b.
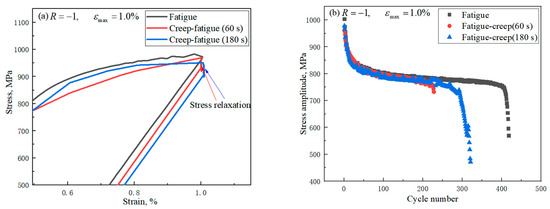
Figure 7.
Stress relaxation behavior: (a) cyclic curve of stress relaxation at different holding times; (b) stress amplitude at different holding times.
3. Constitutive Model and Simulation Results of Experiments
3.1. Simulation Results of Tensile Experiments
The tensile behavior can be described by a nonlinear kinematic hardening model. The O-K model is employed to describe the mean stress relaxation behavior. In order to better describe the movement of the yield surface, Chaboche decomposed the back stress into several terms and made each term follow the O-K model:
The O-K model can be expressed as:
where H denotes the Heaviside step function; is the Macauley bracket; ζi, ri and μi (0 ≤ μi ≤ 1) are material parameters. The parameter μi can control ratcheting strain and mean stress with the increasing number of cycles. In this paper, it is assumed that each component of μi is equal to a fixed value μ. The O-K model is reduced to the O-W Ⅰ and A-F models when μ = 0 and μ = 1, respectively. The fitting methods of different models are different.
When μ = 0, under the one-dimensional stress state, stress can be written as
When 0 < μ < 1, under the one-dimensional stress state, stress can be written as
When μ = 1, under one-dimensional stress state, stress can be written as
where p is equivalent plastic strain.
Formulas (5) and (6) are piecewise expressions. M is the number of segments. Theoretically, the more segments there are, the more accurate the simulation result will be. In a comprehensive consideration, M = 20 is selected in this paper. The selected 20 data points are shown in Figure 8.
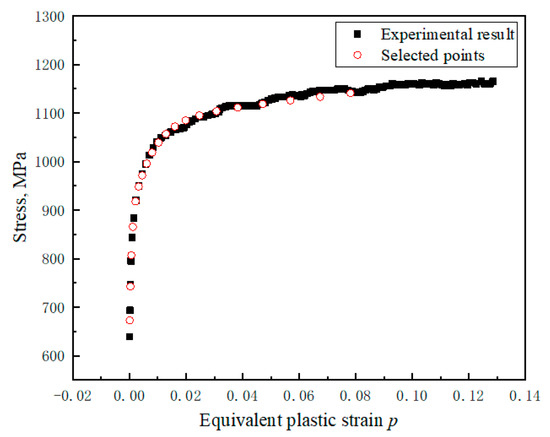
Figure 8.
Selected points for parameter fitting.
Parameter fitting of the A-F model is relatively simple. Formula (7) can be directly fitted according to the data. The A-F kinematic equations are generally given by the superposition of three rules; that is, M = 3. The first rule describes the nonlinear behavior for the moderate plastic strains. The second one gives the nonlinearity for the very small strains, in the transition regime between elasticity and plasticity. The third kinematic rule is used to describe the approximately constant tangent stiffness for large strains. The fitting results of the A-F model are shown in Figure 9.
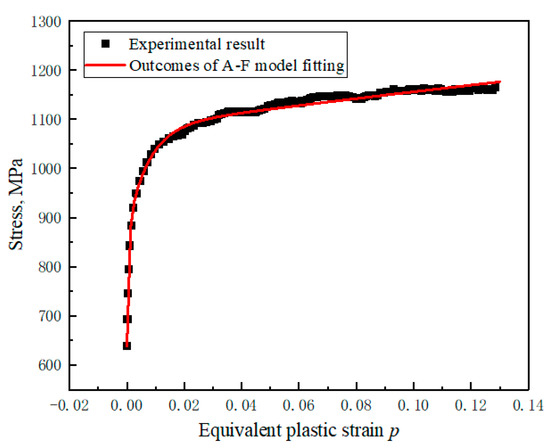
Figure 9.
Outcomes of A-F model fitting.
Simulation results of tensile tests with different μ values are shown in Figure 10. The value of μ has little effect on the tensile simulation results. When the values are within a small range (0 ≤ μi ≤ 0.1), the values of ζi, and ri do not change much.
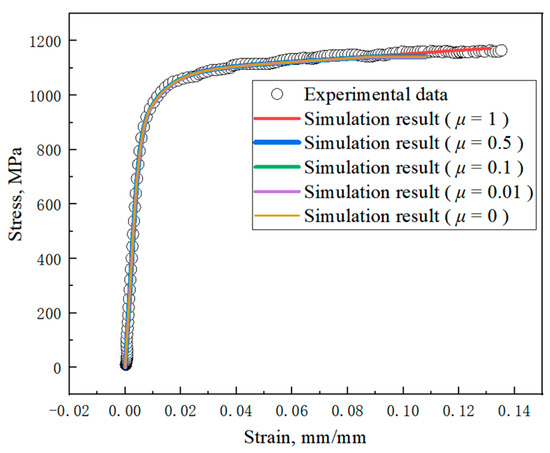
Figure 10.
Simulation results of different μ values.
3.2. Simulation Results of Creep Tests
The relationship between creep strain and creep time is shown in Figure 11a. The creep strain rate remains constant during the second stage. The creep strain rate of the second stage is the minimum creep strain rate. The relationship between the creep strain rate and normalized creep time is shown in Figure 11b. The creep strain rate first decreases rapidly to the minimum value with time, indicating the beginning of the second stage of creep. When the creep strain rate reaches twice of the minimum creep strain rate, it indicates the beginning of the third stage of creep. The minimum creep strain rate plays an important role in the creep curve. The creep constitutive model is written in the form of minimum creep strain rate:
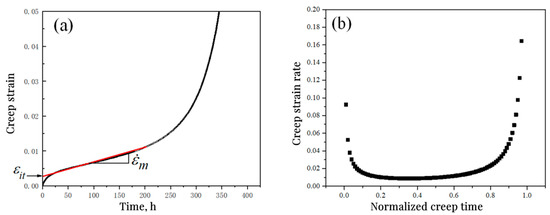
Figure 11.
Typical creep curves: (a) creep strain–time curve; (b) creep strain rate–normalized creep time curve.
The first term represents the primary stage of creep, reflecting that creep strain increases to the critical value c1’ with time. The second term represents the second stage of creep and reflects the linear change of the creep strain with time. The third term represents the third stage of creep, reflecting that the creep strain increases exponentially with time.
In fact, there is a certain relationship between c1’ and creep stress; provided that the linear curve of the second stage of creep is extended to intersect with the ordinate, as shown in Figure 11a. Set the intersection as εit, which is called the intercept strain. It can be derived from Equation (8):
If intercept strains are extracted from all the creep strain curves, it can be found that the intercept strain has a linear relationship with the nominal stress in logarithmic coordinates, as shown in Figure 12. Therefore, it can be expressed as:
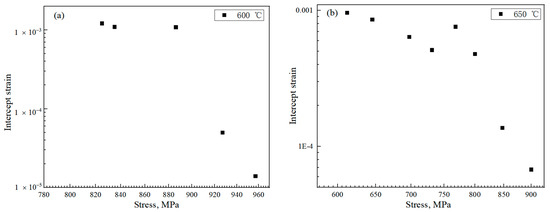
Figure 12.
Relationship between intercept strain and stress: (a) at 600 °C; (b) at 650 °C.
The constitutive model of the second stage of creep is commonly described in Norton form and the minimum creep strain rate can be expressed as:
If Equations (10) and (11) are substituted into Equation (8), the coefficients can be sorted out and combined to obtain the following expression:
where c1, c2, b1, C1, n1, C2, n2, C3 and n3 are material constants.
In the form of Equation (12), the creep test results of a typical sample are taken for fitting; for example, a typical creep curve at 600 °C and 865 MPa, of which the fitting results are shown in Figure 13. The test values coincide completely with the calculated curve and the three-stage characteristics of the fitted curve can be clearly seen.
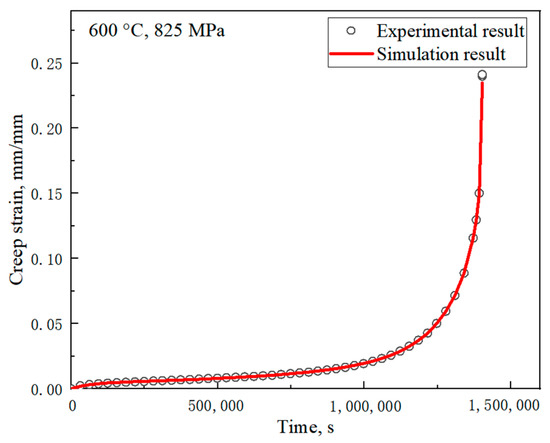
Figure 13.
Simulation result of the creep test at 600 °C and 865 MPa.
The three-stage creep constitutive model of Equation (12) was adopted to fit all the creep test results of the nickel-based superalloy GH4169 at 600 °C and 650 °C, as shown in Figure 14; and the parameters are shown in Table 2. The experimental results almost coincide with the fitting results, which shows the practicability of the method.
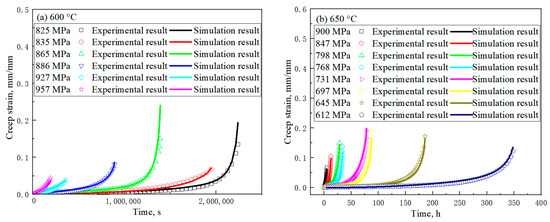
Figure 14.
Simulation results of creep tests at different temperatures: (a) at 600 °C; (b) at 650 °C.
Table 2.
The parameters of creep model at 600 °C.
3.3. Simulation of Fatigue and Creep-Fatigue Tests
Materials tend to exhibit cyclic softening or hardening behavior under symmetric loading, which can be described by an isotropic hardening model. The GH4169 material is a typical cyclic softening material. The cyclic softening process includes three parts. The third part is the rapid crack propagation leading to the rapid curve decline, which is not a characteristic of the material itself. Therefore, the nonlinear isotropic hardening model can be expressed as:
where σy0 is the initial yield stress. R0, R∞ and b are material parameters.
To identify the isotropic hardening parameters R0, R∞ and b in Equation (13), parametric sensitivity studies are carried out through uniaxial strain-controlled cyclic simulations with the combined O-K model. The results of the sensitivity studies are shown in Figure 15. The parameter R0 controls the slope of the stable stage of the curve as shown in Figure 15a. The parameter R∞ controls the softening strength at the stabilized cycles as shown in Figure 15b and the parameter b controls the softening rate at the early stage of cyclic behavior as shown in Figure 15c.
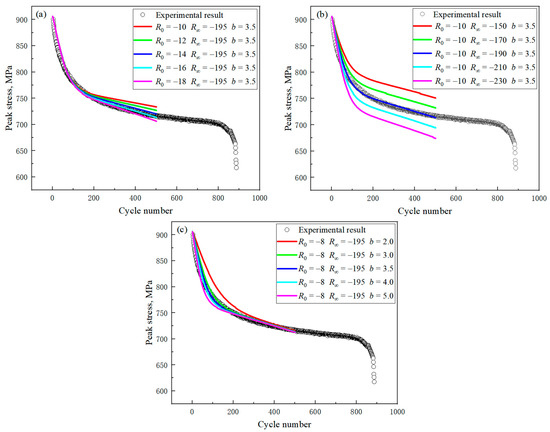
Figure 15.
Results of sensitivity analysis for isotropic softening parameters: (a) R0; (b) R∞; (c) b.
The comparison between fitting results and test data is shown in Figure 16, and the specific parameters are shown in Table 3. The predicted cyclic softening behavior of the GH4169 alloy is in very good agreement with those of the tests for each cycle.
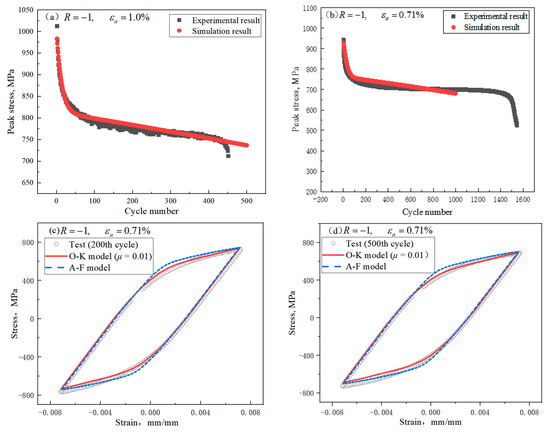
Figure 16.
Comparison of symmetric cyclic behavior between tests and simulations: (a) εa = 1.0%; (b) εa = 0.71%; (c) the 200th cycle; (d) the 500th cycle.
Table 3.
The parameters of isotropic hardening model.
In the simulation of uniaxial ratcheting, the sensitivity studies of the O-K kinematic hardening parameter μ are carried out through uniaxial strain-controlled asymmetrical cyclic simulations with the combined isotropic hardening model, as mentioned earlier as shown in Figure 17. The parameter μ controls the mean stress relaxation rate. A larger value of μ leads to a larger mean stress relaxation. No matter what the μ value is, the simulation results do not agree with the experimental results.
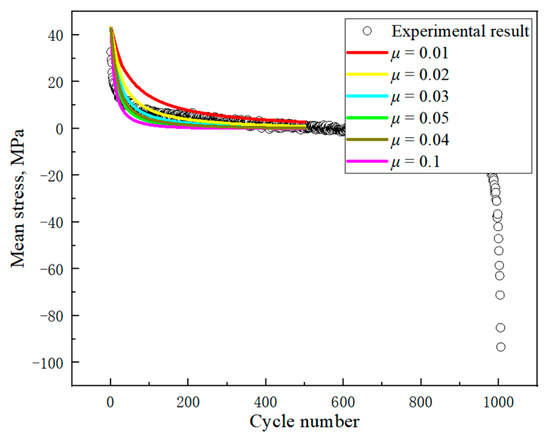
Figure 17.
Results of sensitivity analysis for parameter μ.
In view of the above problems, referring to the equation of isotropic hardening, nonlinear terms are added to meet the initial stress relaxation behavior, and the new form of parameters μ is proposed:
where μ0, C1 and C2 are material parameters. The simulation results are shown in Figure 18 and the material parameters are shown in Table 4.
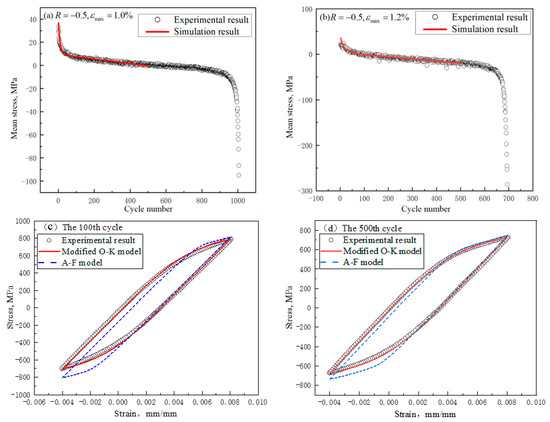
Figure 18.
Comparison of stress relaxation behavior between tests and simulations: (a) εmax = 1.0%; (b) εmax = 1.2%; (c) the 100th cycle; (d) the 500th cycle.
Table 4.
The parameters of modified O-K model.
The modified O-K model and isotropic hardening model can well describe the fatigue behavior of GH4169 under asymmetric loading, and the creep constitutive model proposed in this paper can well describe the creep behavior of GH4169. Therefore, a non-unified constitutive model can be established to describe the creep-fatigue behavior of GH4169. The simulation results are shown in Figure 19. Generally speaking, the simulation results are close to the test results; however, the amount of stress relaxation in the strain-holding phase is significantly smaller than the test results.
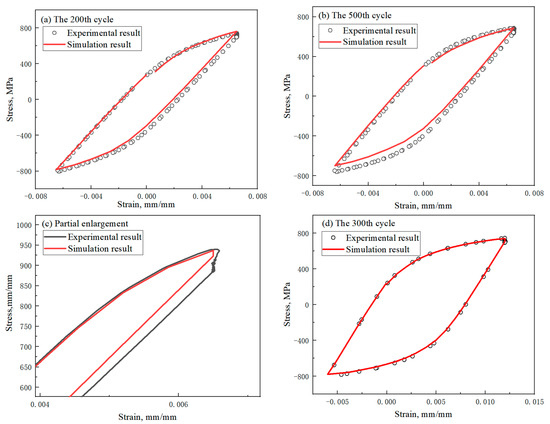
Figure 19.
Comparison of creep-fatigue behavior between tests and simulations: (a) the 100th cycle; (b) the 500th cycle; (c) partial enlargement; (d) the 300th cycle.
4. Conclusions
In this paper, the tensile, creep, fatigue and creep-fatigue tests of the GH4169 alloy were carried out. The results show that the GH4169 alloy exhibits a PLC effect under a certain tensile strain rate. The tensile strain rate has little effect on the tensile curve. The creep curve of the GH4169 material is a typical three-stage creep curve. The GH4169 alloy exhibits cyclic softening under symmetric cyclic loading and a mean stress relaxation under asymmetric cyclic loading.
According to the test results, the deformation behavior of the GH4169 material was simulated. The O-K model can well describe the tensile behavior of the GH4169 material. The creep constitutive model presented in this paper can be used to predict the three-stage creep characteristics of the material. To better describe the mean stress relaxation behavior, the parameter μ is modified with reference to the isotropic hardening expression. The modified O-K kinematic hardening model and isotropic hardening model can well predict the cyclic softening behavior of the material under symmetric loads and the mean stress relaxation behavior under asymmetric loads. Finally, the creep-fatigue behavior of the GH4169 material under symmetric and asymmetric loads is analyzed by using the non-unified constitutive model of the elastoplastic model (modified O-K model and isotropic model), coupled with the creep model. The simulation results are very close to the experimental results; however, the predicted stress relaxation in the strain-holding stage is smaller than the test results.
Author Contributions
Conceptualization, X.H. and S.Z.; methodology, X.H.; software, S.Z. and H.Z.; validation, H.Z., X.J. and Z.Z.; formal analysis, Z.Z.; investigation, X.H. and S.Z.; resources, X.H.; data curation, S.Z. and H.Z.; writing—original draft preparation, X.H.; writing—review and editing, X.H. and S.Z.; visualization, X.J.; supervision, X.H.; project administration, X.H. and Z.Z.; funding acquisition, X.H. All authors have read and agreed to the published version of the manuscript.
Funding
This research was funded by the National Science and Technology Major Project, grant number 2017-IV-0004-0041.
Data Availability Statement
The data presented in the study are available on request from the corresponding author.
Conflicts of Interest
The authors declare no conflict of interest.
References
- Chaboche:, J.L. Viscoplastic constitutive equations for the description of cyclic and anisotropic behavior of metals. Bull. Acad. Polon. Sci. 1977, 25, 33–42. [Google Scholar]
- Armstrong, P.J.; Frederick, C.O. A Mathematical Representation of the Multiaxial Bauschinger Effect; CEGB Report RD/B/N/731; Berkeley Nuclear Laboratories, R&D Department: Berkeley, CA, USA, 1966; Volume 24, pp. 1–26. [Google Scholar]
- Chaboche, J.L.; Nouailhas, D. Constitutive modeling o ratcheting effects-Part I: Experimental facts and properties of the classical models. ASME J. Eng. Mat. Technol. 1989, 111, 384–392. [Google Scholar] [CrossRef]
- Ohno, N. Recent topics in constitutive modeling of cyclic plasticity and viscoplasticity. Appl. Mech. Rev. 1990, 43, 283–295. [Google Scholar] [CrossRef]
- Chaboche, J.L. On some modification of kinematic hardening to improve the description of ratcheting effects. Int. J. Plast. 1991, 7, 661–678. [Google Scholar] [CrossRef]
- Chaboche, J.L.; Jung, O. Application of a kinematic hardening viscoplasticity model with thresholds to the residual stress relaxation. Int. J. Plast. 1998, 13, 785–807. [Google Scholar] [CrossRef]
- Chaboche, J.L. Constitutive equations for cyclic plasticity and cyclic viscoplasticity. Int. J. Plast. 1989, 5, 247–302. [Google Scholar] [CrossRef]
- Wang, J.D.; Ohno, N. Two Equivalent Forms of Nonlinear Kinematic Hardening: Application to Nonisothermal Plasticity. Int. J. Plast. 1991, 7, 637–650. [Google Scholar] [CrossRef]
- Ohno, N.; Wang, J.D. Transformation of a nonlinear kinematic hardening rule to a multisurface form under isothermal and nonisothermal conditions. Int. J. Plast. 1991, 7, 879–891. [Google Scholar] [CrossRef]
- Abdel-Karim, M.; Ohno, N. Kinematic hardening model suitable for ratcheting with steady-state. Int. J. Plast. 2000, 16, 225–240. [Google Scholar] [CrossRef]
- Ohno, N.; Abdel-Karim, M. Uniaxial ratcheting of 316FR steel at room temperature, part II: Constitutive modeling and simulation. ASME J. Eng. Mat. Tech. 2000, 122, 35–41. [Google Scholar] [CrossRef]
- Brown, S.; Evans, R.W.; Wilshire, B. Creep strain and creep life prediction for the cast nickel-based superalloy IN-100. Mater. Sci. Eng. 1986, 84, 147–156. [Google Scholar] [CrossRef]
- Evans, R.W.; Wilshire, B. Creep of Metals and Alloys; Ztschrift Fur Met; U.S. Department of Energy Office of Scientific and Technical Information: Oak Ridge, TN, USA, 1985. [Google Scholar]
- Brown, S.; Evans, R.W.; Wilshire, B. A comparison of extrapolation techniques for long term creep strain and creep life prediction based on equations designed to represent creep curve shape. Int. J. Press. Vessel. Pip. 1986, 24, 251–268. [Google Scholar] [CrossRef]
- Rabotnov, Y.N. Some Problems of the Theory of Creep; Vestnik Moskov University: Moscow, Russia, 1948; pp. 81–91. [Google Scholar]
- Othman, A.M.; Hayhurst, D.R.; Dyson, B.F. Skeletal Point Stresses in Circumferentially Notched Tension Bars Undergoing Tertiary Creep Modelled with Physically Based Constitutive Equations. Proc. R. Soc. A Math. Phys. Eng. Sci. 1993, 441, 343–358. [Google Scholar]
- Dyson, B.F.; Hayhurst, D.R.; Lin, J. The Ridged Uniaxial Testpiece: Creep and Fracture Predictions Using Large-Displacement Finite-Element Analyses. Proc. R. Soc. A Math. Phys. Eng. Sci. 1996, 452, 655–676. [Google Scholar]
- Mustata, R.; Hayhurst, D.R. Creep constitutive equations for a 0.5Cr0.5Mo0.25V ferritic steel in the temperature range 565–675 °C. Int. J. Press. Vessel. Pip. 2005, 82, 363–372. [Google Scholar] [CrossRef]
- Xu, Q. Development of constitutive equations for creep damage behavior under multi-axial states of stress. Adv. Mech. Behav. Plast. Damage 2000, 2, 1375–1382. [Google Scholar]
- Batsoulas, N.D. Mathematical description of the mechanical behavior of metallic materials under creep conditions. J. Mater. Sci. 1997, 32, 2511–2527. [Google Scholar] [CrossRef]
- Wilshire, B.; Scharning, P.J.; Hurst, R. A new approach to creep data assessment. Mater. Sci. Eng. 2009, 510, 3–6. [Google Scholar] [CrossRef]
- Whittaker, M.T.; Harrison, W.J.; Lancaster, R.J.; Williams, S. An analysis of modern creep lifing methodologies in the titanium alloy Ti6-4. Mater. Sci. Eng. A 2013, 577, 114–119. [Google Scholar] [CrossRef]
- Abdallah, Z.; Gray, V.; Whittaker, M.; Perkins, K. A Critical Analysis of the Conventionally Employed Creep Lifing Methods. Materials 2014, 7, 3371–3398. [Google Scholar] [CrossRef]
- Whittaker, M.T.; Harrison, W.J. Evolution of Wilshire equations for creep life prediction. High Temp. Technol. 2014, 31, 233–238. [Google Scholar] [CrossRef]
- Kobayashi, M.; Mukai, M.; Takahashi, H.; Ohno, N.; Kawakami, T.; Ishikawa, T. Implicit integration and consistent tangent modulus of a time-dependent non-unified constitutive model. Int. J. Numer. Methods Eng. 2003, 58, 1523–1543. [Google Scholar] [CrossRef]
- Ohguchi, K.I.; Sasaki, K.; Aso, S. Evaluation of Time-Independent and Time-Dependent Strains of Lead-Free Solder by Stepped Ramp Loading Test. ASME J. Electron. Packag. 2009, 131, 021003. [Google Scholar] [CrossRef]
- Panteghini, A.; Genna, F. Effects of the strain-hardening law in the numerical simulation of wire drawing processes. Comput. Mater. Sci. 2010, 49, 236–242. [Google Scholar] [CrossRef]
- Chen, W.; Wang, F.; Feng, M. Study of a modified non-unified model for time-dependent behavior of metal materials. Mech. Mater. 2017, 113, 69–76. [Google Scholar] [CrossRef]
- Gremaud, G. Overview on dislocation-point defect interaction: The brownian picture of dislocation motion. Mater. Sci. Eng. A 2004, 370, 191–198. [Google Scholar] [CrossRef]
- Yilmaz, A. The Portevin—Le Chatelier effect: A review of experimental findings. Sci. Technol. Adv. Mater. 2011, 12, 063001. [Google Scholar] [CrossRef]
- Cui, L.; Yu, J.; Liu, J.; Sun, X. Microstructural evolutions and fracture behaviors of a newly developed nickel-base superalloy during creep deformation. J. Alloys Compd. 2018, 746, 335–349. [Google Scholar] [CrossRef]
Publisher’s Note: MDPI stays neutral with regard to jurisdictional claims in published maps and institutional affiliations. |
© 2022 by the authors. Licensee MDPI, Basel, Switzerland. This article is an open access article distributed under the terms and conditions of the Creative Commons Attribution (CC BY) license (https://creativecommons.org/licenses/by/4.0/).