Article

Corrosion Behavior of Al10Cr30Fe25Mn30Ti5 High-Entropy Alloy: Microstructural, Electrochemical, and Surface Analysis

1
National Center for Education and Research on Corrosion and Materials Performance, NCERCAMP-UA, Department of Chemical, Biomolecular, and Corrosion Engineering, The University of Akron, 302 E Buchtel Ave, Akron, OH 44325-3906, USA
2
National Center for Metallurgical Research (CENIM, CSIC), Ave. Gregorio del Amo 8, 28040 Madrid, Spain
*
Author to whom correspondence should be addressed.
Metals 2022, 12(10), 1736; https://doi.org/10.3390/met12101736
Submission received: 15 September 2022 / Revised: 9 October 2022 / Accepted: 14 October 2022 / Published: 16 October 2022
(This article belongs to the Section Corrosion and Protection)

Abstract

:
In this work, the corrosion performance of a new developed high-entropy alloy (HEA) of the composition Al10Cr30Fe25Mn30Ti5 (at. %) was studied. The corrosion testing of the Al10Cr30Fe25Mn30Ti5 HEA was carried out in 2.5 M NaOH, 0.6 M NaCl, and in 0.5 M H2SO4. The correlation between the microstructure, elemental composition, density, hardness, and corrosion resistance of the new developed Al10Cr30Fe25Mn30Ti5 HEA was investigated. The impedance response showed protective corrosion behavior for the neutral and acidic pH, while the alkaline environment led to a passivity breakdown due to dissolution of Al forming Al(OH)3. The outcome of the presented study suggests that new developed HEA is suitable to be used in industrial environments with a neutral and acidic pH.

1. Introduction

High-entropy alloys (HEA) are new materials composed of four to five elements in similar ratios with high mixing entropy, and they generally have a stable solid solution phases such as face-centered cubic (FCC), body-centered cubic (BCC), and/or hexagonal close-packed (HCP) [1,2]. HEAs have outstanding properties, both mechanical (hardness, strength, density, or wear), and corrosion protection (high-temperature oxidation, pitting corrosion, atmospheric corrosion resistance), making the HEA really appealing for industrial applications [3]. The main factor for the outstanding properties is the design selection matrix and ratios of their elemental composition, grating them specific boost depending on the desired application [4].
In the case of HEA corrosion in harsh environments, several studies are found using HEA compositions, such as the CoCrFeNi, which promoted an enriched Cr2O3 passive oxide film in 0.6 M chloride solution, leading to a more noble corrosion potential value (Ecorr) with a low corrosion current density (icorr) [3]. Similar HEAs with Al additions lead to a formation of Al- and Ni-rich film; however, the BCC phase was Cr-depleted, becoming more susceptible to localized corrosion, thus promoting pitting corrosion [5]. Similarly, the AlxCrFe1.5MnNi0.5 HEA showed increasing corrosion resistance with decreasing Al content in both acid (H2SO4) and neutral (NaCl) solutions [6]. When the HEA has some Ti additions, FeCoCrAlNiTi was able to form a stable oxide film at a much higher rate than those without it, inducing low icorr in a neutral 3.5 wt.% NaCl solution [7]. Additions of Mn have been reported to decrease the Cr content in the passive film of the FeCrNiCoMn HEA, reducing the corrosion protection properties of the HEA [4]. Even more, for a high Mo content HEA, there was an increased σ-phase precipitation, which was rich in Cr and Mo, thus promoting a preferential site for dissolution, inducing higher current densities in the FeCrNiCoMo HEA [8]. The deleterious effect of the σ-phase precipitation was also seen by additions of V, which triggered the formation of the σ-phase in the AlFeNiCrCoTiV HEA, promoting pitting corrosion at these sites [9].
The aim of this study is to reveal the corrosion performance of the Al10Cr30Fe25Mn30Ti5 HEA. A combination of electrochemical techniques, such as cyclic potentiodynamic polarization (CPP) and electrochemical impedance spectroscopy (EIS), in three different pH electrolyte solutions—alkaline (NaOH, pH 14), neutral (NaCl, pH 7), and acidic (H2SO4, pH 0.3)—will allow setting the suitability of the HEA for industrial applications. In depth characterization of the passive film is performed by XPS, SEM, and EDX, with correlation to the environment, electrochemical response, microstructure, and elemental composition.

2. Materials and Methods

2.1. Material and Microstructure Characterization

The nominal composition of the HEA, expressed in the atomic percentage, is Al10Cr30Fe25Mn30Ti5 (see Table 1). Stoichiometric amounts of the pure elements, purity > 99.5%, were melted in an induction furnace and poured in a steel mold. As-cast ingot was homogenized at 1200 °C for 1 h in an inert Ar atmosphere and subsequently quenched in water. Finally, the ingot was heated at 1200 °C for 30 min and subsequently forged with a final reduction of 65%. The forged sheet was cooled down in air. Hardness of the new designed HEA was tested in a microhardness Tukon 1202 (Instron Co., Canton, MA, USA) with a HV/10 cone indenter applying 10 N for 15 s.
After the ingots were processed, the samples were cut and polished with SiC paper up to 1200 grid, and further finished with 1 µm diamond powder. Then, the samples were rinsed with DI water, cleaned with ethanol, and air dried. The microstructural study was performed by optical microscopy (OM) using a Nikon SMZ 745T stereomicroscope (Nikon Metrology Inc., Brighton, MI, USA), and scanning electron microscopy (SEM) using a JEOL 6500 microscope (JEOL USA Inc., Peabody, MA, USA) equipped with an energy dispersive X-ray spectrometer (EDS) microanalysis. Samples were etched with an etchant solution containing 10 mL HNO3, 30 mL HCl, 10 mL DI water, 2 mL H2O2, and 2 mL picric acid. The identification of the phases present in the alloy was done using high-energy X-ray diffraction (HEXRD) measurements in the P07 beamline of PETRA III at the Deutsches-Elektronen-Synchrotron (DESY, Hamburg, Germany). The wavelength of the X-ray source was 0.1424 Å, corresponding to an energy of 87.1 keV. The diffraction patterns were recorded using a Perkin-Elmer XRD1621 (PerkinElmer Inc., Fremont, CA, USA) flat panel detector located at 1390 mm from the sample. The flat panel was an array of 2048 × 2048 pixels with an effective pixel size of 200 × 200 μm2. LaB6 standard powder was used as reference material for calibrating the acquired diffraction spectra.

2.2. Electrochemical Techniques

The electrochemical corrosion properties of the new designed Al10Cr30Fe25Mn30Ti5 HEA were tested under three different environments: alkaline 2.5 M NaOH (pH 14), neutral with chloride influence 0.6 M NaCl (pH 7) [10], and acidic 0.5 M H2SO4 (pH 0.3). A pH probe was used to measure the pH of each electrolyte solution, and before the measurements were taken, the pH probe was calibrated with fresh standard solutions. These three electrolyte solutions represent a wide spectrum of industrial environments where the HEA could be under service, thus providing a comprehensive study to better understand the electrochemical corrosion kinetics and mechanisms. A three-electrode configuration electrochemical cell setup was used, consisting of a saturated calomel electrode (SCE) as the reference electrode (RE), a platinum mesh counter electrode (CE), and the Al10Cr30Fe25Mn30Ti5 HEA as the working electrode (WE). The samples were mounted in resin and polished with SiC paper up to 1200 grid, finishing with 1 µm diamond powder; then, the samples were rinsed with DI water, cleaned with ethanol, and air dried. The sample exposed area for all electrochemical tests was set to 1 cm2 by means of nonconductive red lacquer. For each of the electrolyte solutions at a different pH, a set of electrochemical testing was conducted. An open circuit potential (OCP) was conducted over 1 h prior to each electrochemical measurement until a steady-state OCP value was reached [11]. Then, electrochemical impedance spectroscopy (EIS) gathered information of the corrosion mechanisms of the electrolyte/passive film and the passive film/metal interface. The EIS measurements were recorded at the OCP, with a frequency range between 105 and 10−2 Hz, using an AC excitation signal of 10 mV and at a step rate of 10 points per decade, following ASTM G106-89 [12]. Finally, a cyclic potentiodynamic polarization (CPP) test was carried out to study the electrochemical reaction kinetics and activation/transport limiting processes. The CPP tests were performed from −0.6 VOCP to +0.6 VOCP at a potential scan rate of 1.667 mV s−1 in accordance with ASTM G61-86 [13]. Both EIS and CPP were accelerated electrochemical corrosion tests performed after the 1 h of exposure from the OCP in accordance with ASTM G61-86 and ASTM G106-89 [14,15]. These accelerated tests, with a short exposure time, were selected due to their validity and acceptance based on previous literature for determining the corrosion behavior of HEAs, even more in the case of HEAs containing Al [5,6,16,17,18]. All the electrochemical tests were done in triplicate to check reproducibility.

2.3. Surface Characterization Techniques

Surface analysis by X-ray photoelectron spectroscopy (XPS) was performed on the Al10Cr30Fe25Mn30Ti5 HEA samples after the CPP testing for each pH electrolyte solution. XPS spectra were recorded on a PHI 5000 VersaProbe II X-ray photoelectron spectrometer (Physical Electronics, Chanhassen, MN, USA) with an Al Kα source (hv = 1486.6 eV), a working residual pressure below 10−6 Pa, a high-voltage excitation of 30 kV, and a current of 30 mA. The high resolution XPS used a CLAM2 hemispherical electron analyzer (VG Microtech Ltd., London, UK) with a nonmonochromatic Mg Kα X-ray source operated at 300 W, with a pass energy of 23.5 eV, and at energy step size of 0.2 eV/step. The depth profile sputtering was performed using an EX05 Ar+ ion gun (ThermoFisher Scientific, Waltham, MA, USA) operating at 1 kV and 1 µA [19].
By the means of scanning electron microscopy (SEM) in a Hitachi-TM3030, the microstructure and surface morphology of the tested samples were analyzed. The SEM analysis was performed using secondary electron (SE) mode at an accelerating voltage of 15 kV and at a working distance of 8 mm. In addition, local compositional analysis was obtained by the energy dispersive X-ray spectroscopy (EDX) technique.

3. Results

3.1. Microstructure and Hardness

The choice of the Al10Cr30Fe25Mn30Ti5 HEA composition was based on three empirical approaches: the enthalpy of mixing (ΔHmix = −6.5 kJ/mol), and the atomic size mismatch parameter (δ = 5.5%) to evaluate the stability of a single-phase alloy; and the valence electron concentration (VEC = 6.4) was used to choose the crystalline structure. Therefore, with these design parameter values, a HEA with a single-phase BCC structure is predicted.
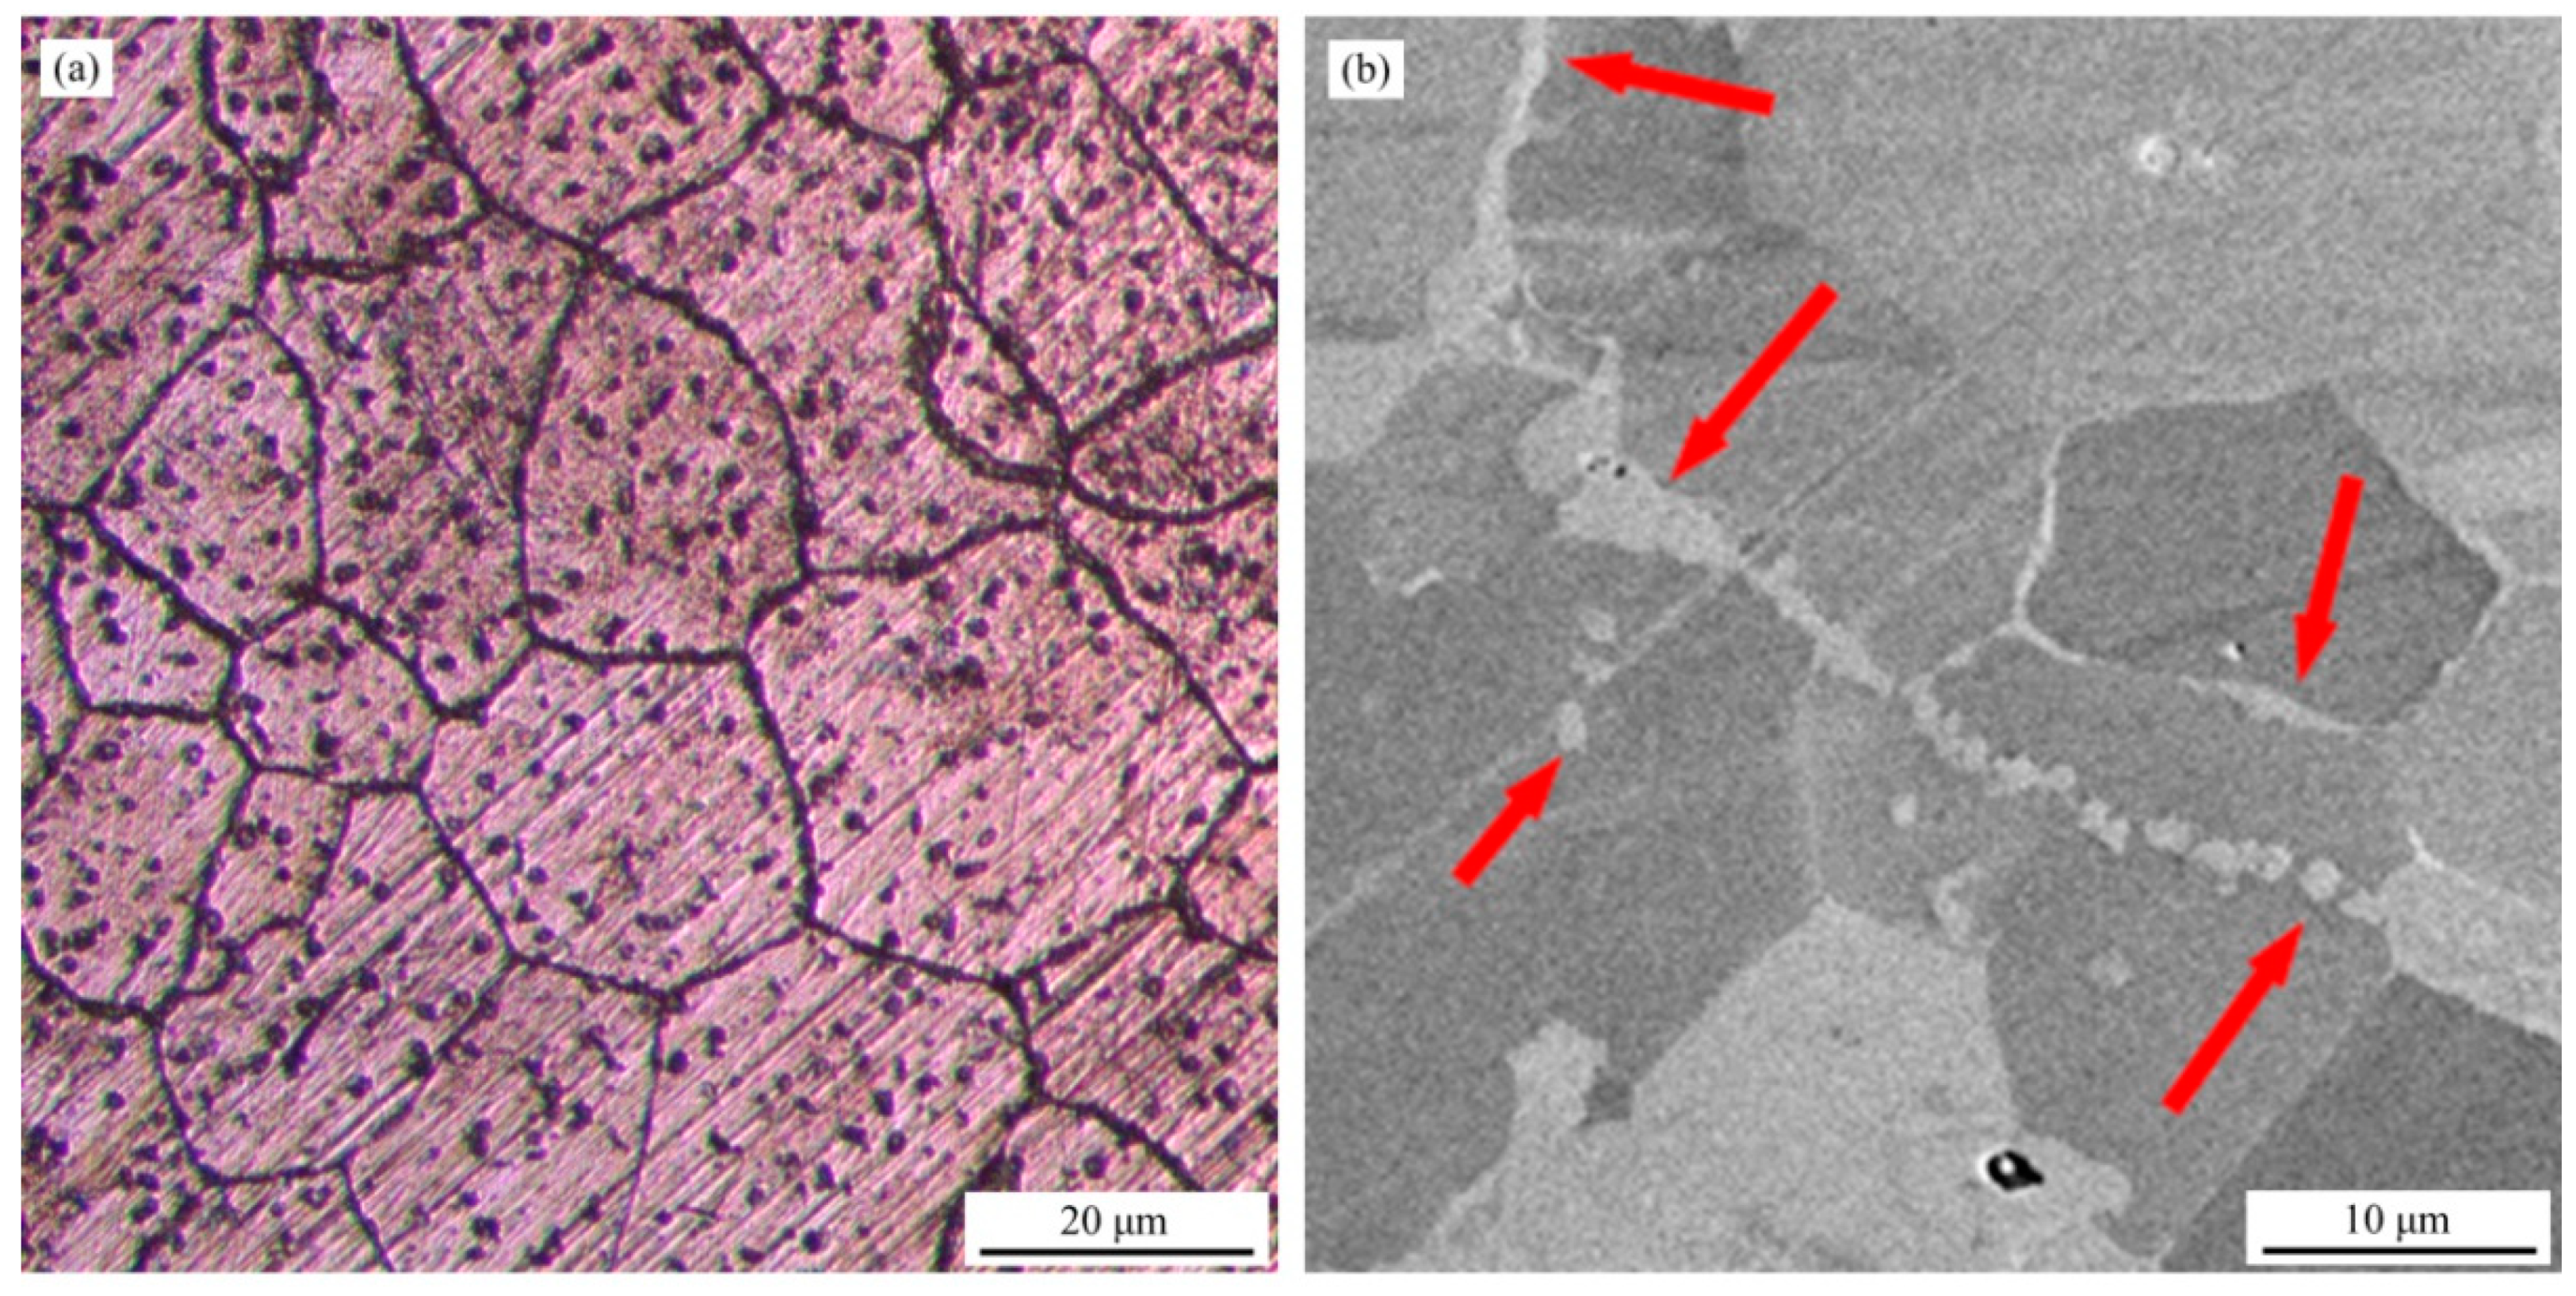
The microstructure of the as-cast ingot consists of equiaxed grains with a bright secondary phase mainly located at the grain boundaries as long laths, although it can also appear more sparsely dispersed within the grains (see Figure 1). According to semiquantitative EDX microanalysis, the composition of the alloy is slightly deviated from the nominal composition, as can be checked in Table 2, likely due to the low vapor pressure of manganese, which led to some manganese losses by volatilization. Microanalysis data also evidenced that the matrix was enriched in chromium while the secondary phases were enriched in titanium, iron, and manganese. The hot-forged alloy, however, was left to cool down in air, which explains the nucleation of the secondary phases in the alloy (see Figure 2), but in lower amounts than that found in the as-cast processing [20].
The equiaxed grain microstructure presents an average grain size of 26 µm with a standard deviation of 3 µm, as obtained by ImageJ software (NIH–LOCI, WI, USA) (see Figure 1).
The hardness and the density values were measured as part of the HEA study, obtaining 660 HV and 6.84 g/cm3, respectively [21].

3.2. High-Energy X-ray Diffraction (HEXRD)

According to the HEXRD pattern obtained for the Al10Cr30Fe25Mn30Ti5 HEA, the more intense peaks correspond to the BCC matrix while the minor peaks are due to β-Mn particles (see Figure 3). The microstructure of the as-cast ingot evolved after homogenization heat treatment at 1200 °C for 1 h and subsequent quenching in such a way that only the BCC peaks of the matrix are found on the HEXRD pattern shown in Figure 3. This means that at 1200 °C, the HEA moves in the BCC single phase region. The applied quenching permitted to stabilize this single BCC structure at room temperature, preventing the formation of secondary phases.

3.3. Cyclic Potentiodynamic Polarization (CPP)

Electrochemical analysis of the Al10Cr30Fe25Mn30Ti5 HEA samples was conducted to reveal the electrochemical corrosion reaction mechanisms at room temperature (RT, 25 °C) and under different pH aqueous electrolyte solutions: acidic 0.5 M H2SO4 (pH 0.3), neutral 0.6 M NaCl (pH 7), and alkaline 2.5 M NaOH (pH 14).
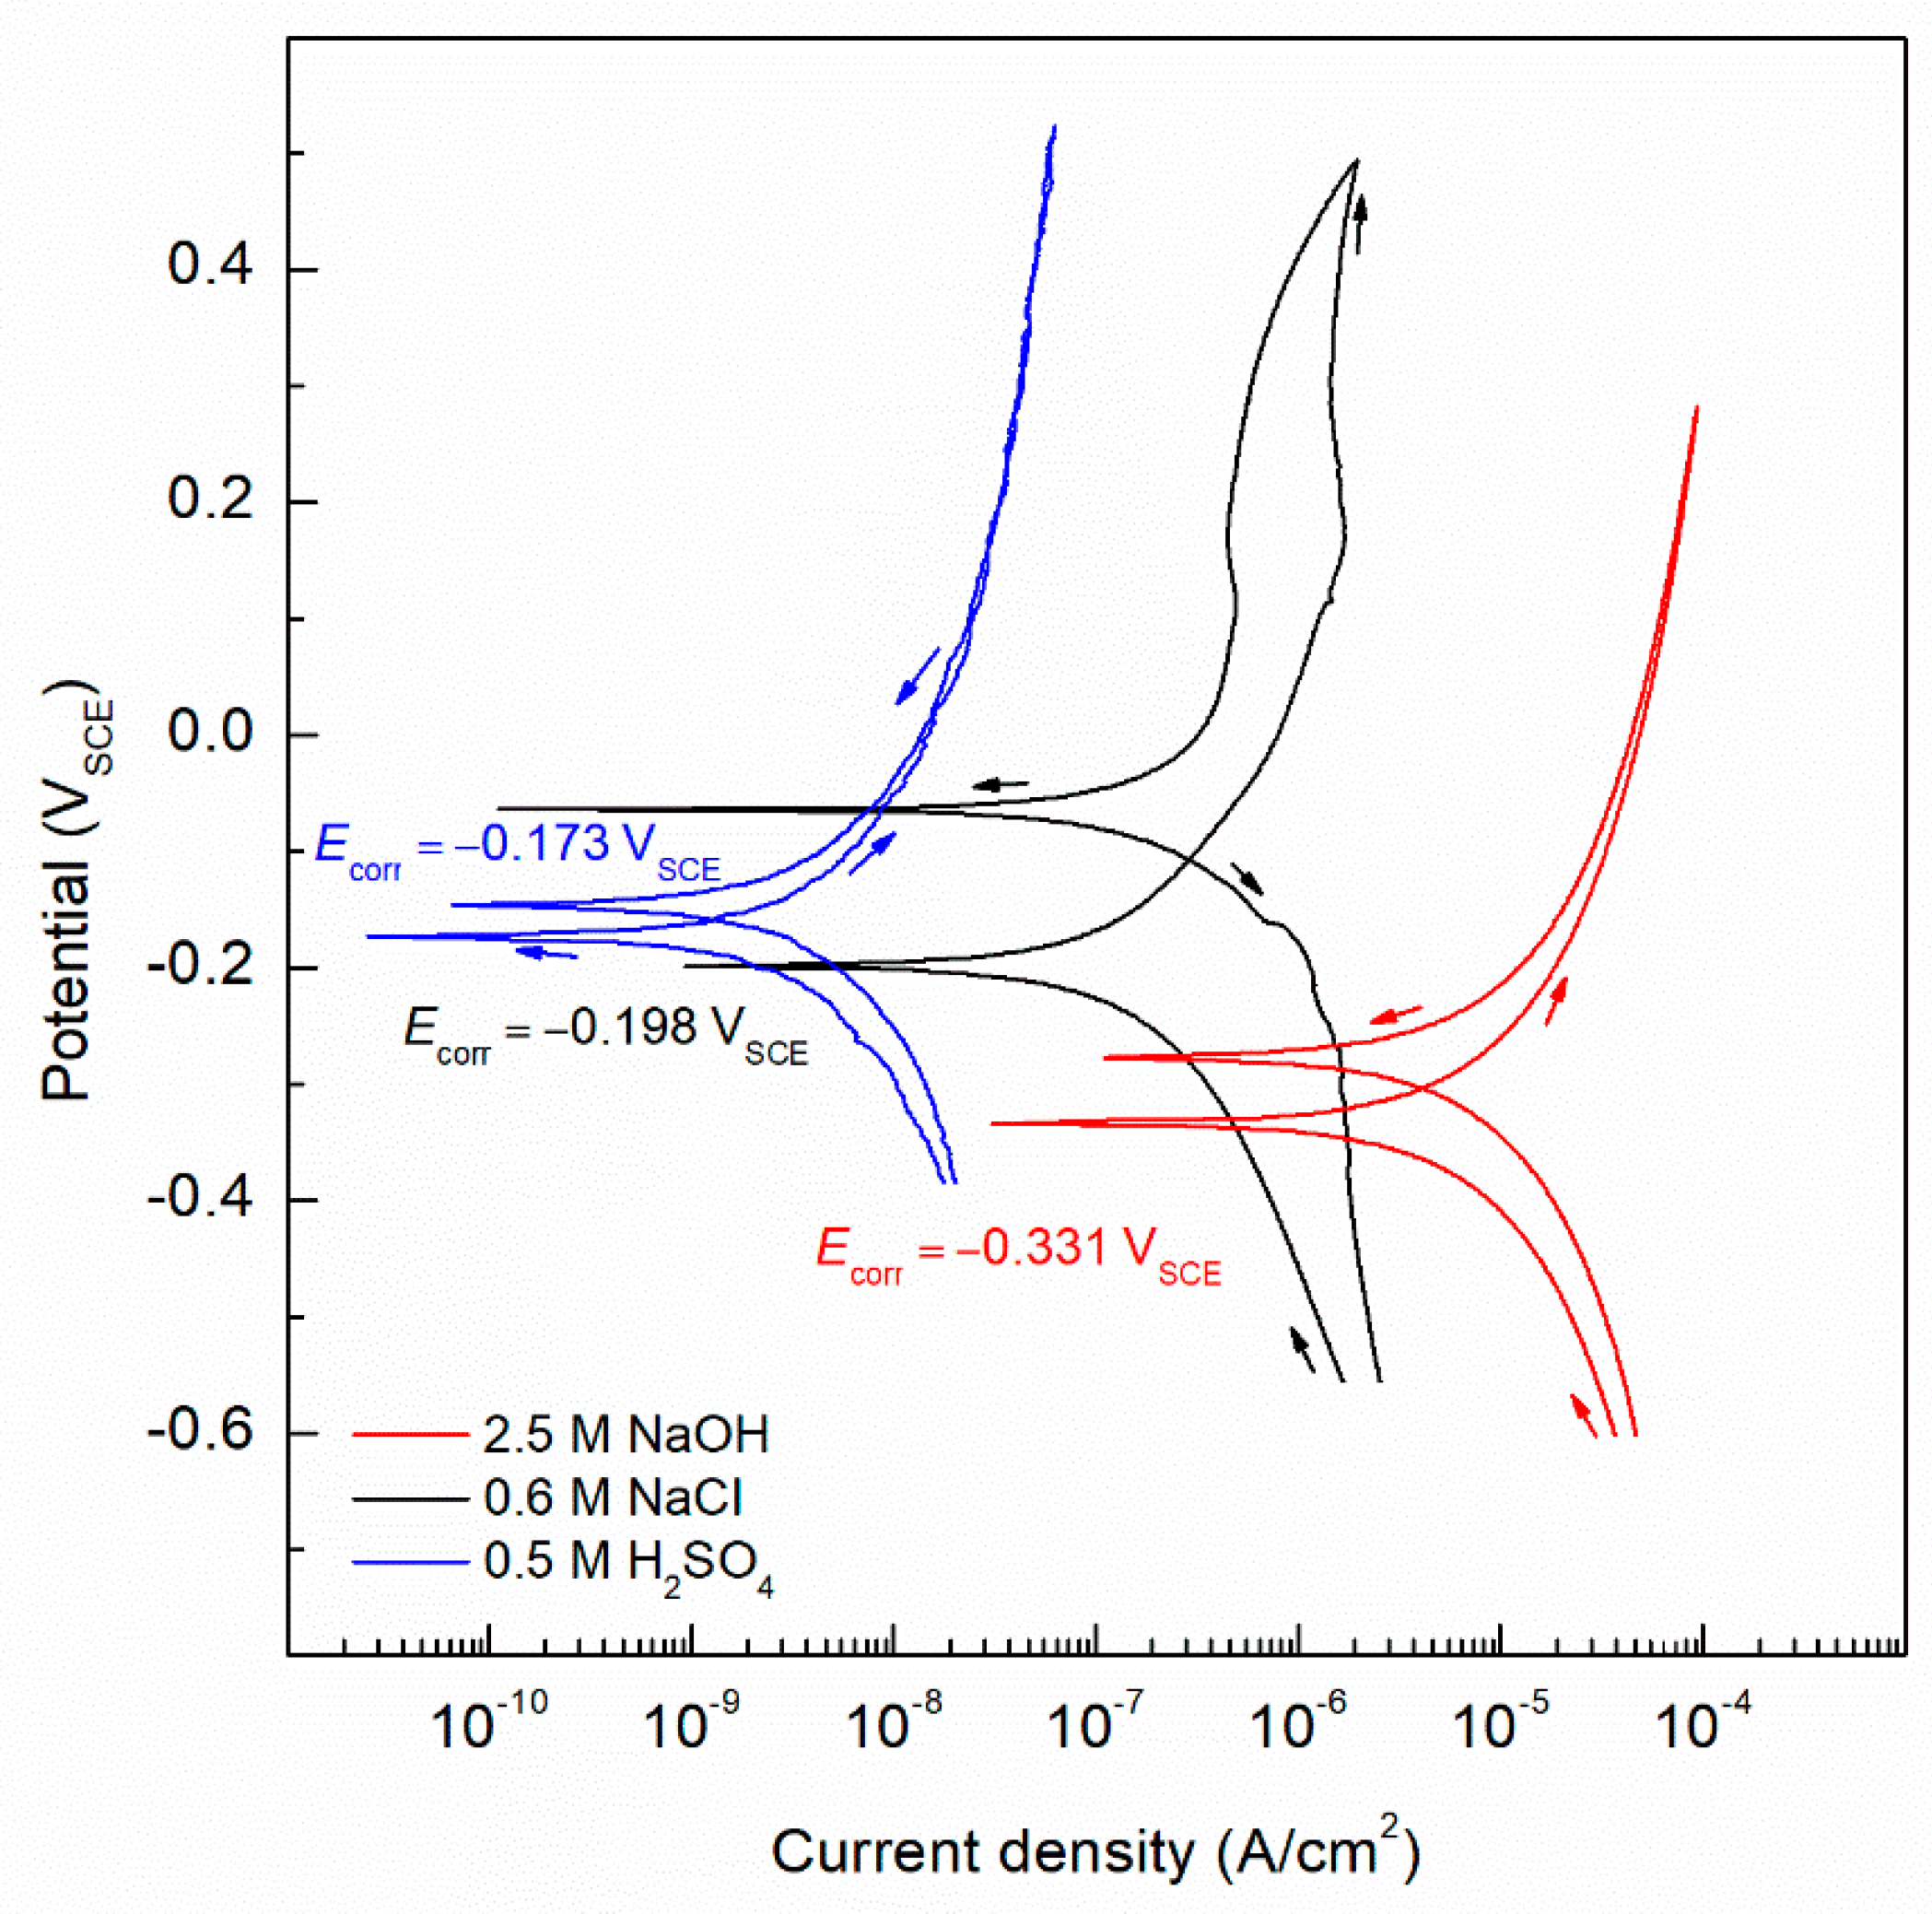
In order to study the electrochemical reaction kinetics of the Al10Cr30Fe25Mn30Ti5 HEA in each of the environments, CPP tests were performed after a steady-state OCP value was reached (see Figure 4). Tafel fitting was performed using the Gamry software, selecting ±50 mV from the Ecorr. In the alkaline environment, 2.5 M NaOH (pH 14), the recorded Ecorr was −331 mVSCE, which shows to be more active than for the other electrolyte solutions tested (see Table 3). However, an active icorr of 16.12 µA/cm2 was found, which indicates dissolution as the current density is above the 1 µA/cm2. While during the anodic polarization the current kept increasing, after reaching the upper potential limit, the HEA sample experienced a negative hysteresis and a more positive mixed potential than the Ecorr, indicating that no pit was formed. In the neutral 0.6 M NaCl (pH 7) [22], the HEA had a nobler Ecorr value of −198 mVSCE, with a lower icorr of 4.10 × 10⁻⁷ A/cm2, which is three orders of magnitude less than the icorr value registered for the high alkaline pH 14. The stable BCC phase matrix, providing a stable and protective passive film, made for the enhanced passivity compared to the alkaline environment. Similarly, to the 2.5 M NaOH, the 0.6 M NaCl did not promote any pitting to the HEA sample, developing a negative hysteresis and obtaining an even nobler mixed potential in the backward scan than the Ecorr. Finally, the sample exposed to 0.5 M H2SO4 showed the best corrosion performance of all three electrolyte solutions, presenting the lowest icorr of 1.36 × 10⁻⁸ A/cm2. The acidic environment helped the HEA to form a stable passive film, similar to the passivation treatment applied in industry for stainless steels [23,24]. The 0.5 M H2SO4 presented a negative hysteresis (same as all three solutions); however, the ennoblement was not as pronounced as the 0.6 M NaCl. From all three environments, the pH 14 was the most damaging due to the reactivity of Al forming hydroxides. Even though the elemental percentage of the aluminum was kept below 4.62 wt.%, high dissolution reaction kinetics in alkaline environment was found. That is the reason for the deterioration of the corrosion protection properties of Al10Cr30Fe25Mn30Ti5 HEA as the pH increases.

3.4. Electrochemical Impedance Spectroscopy (EIS)

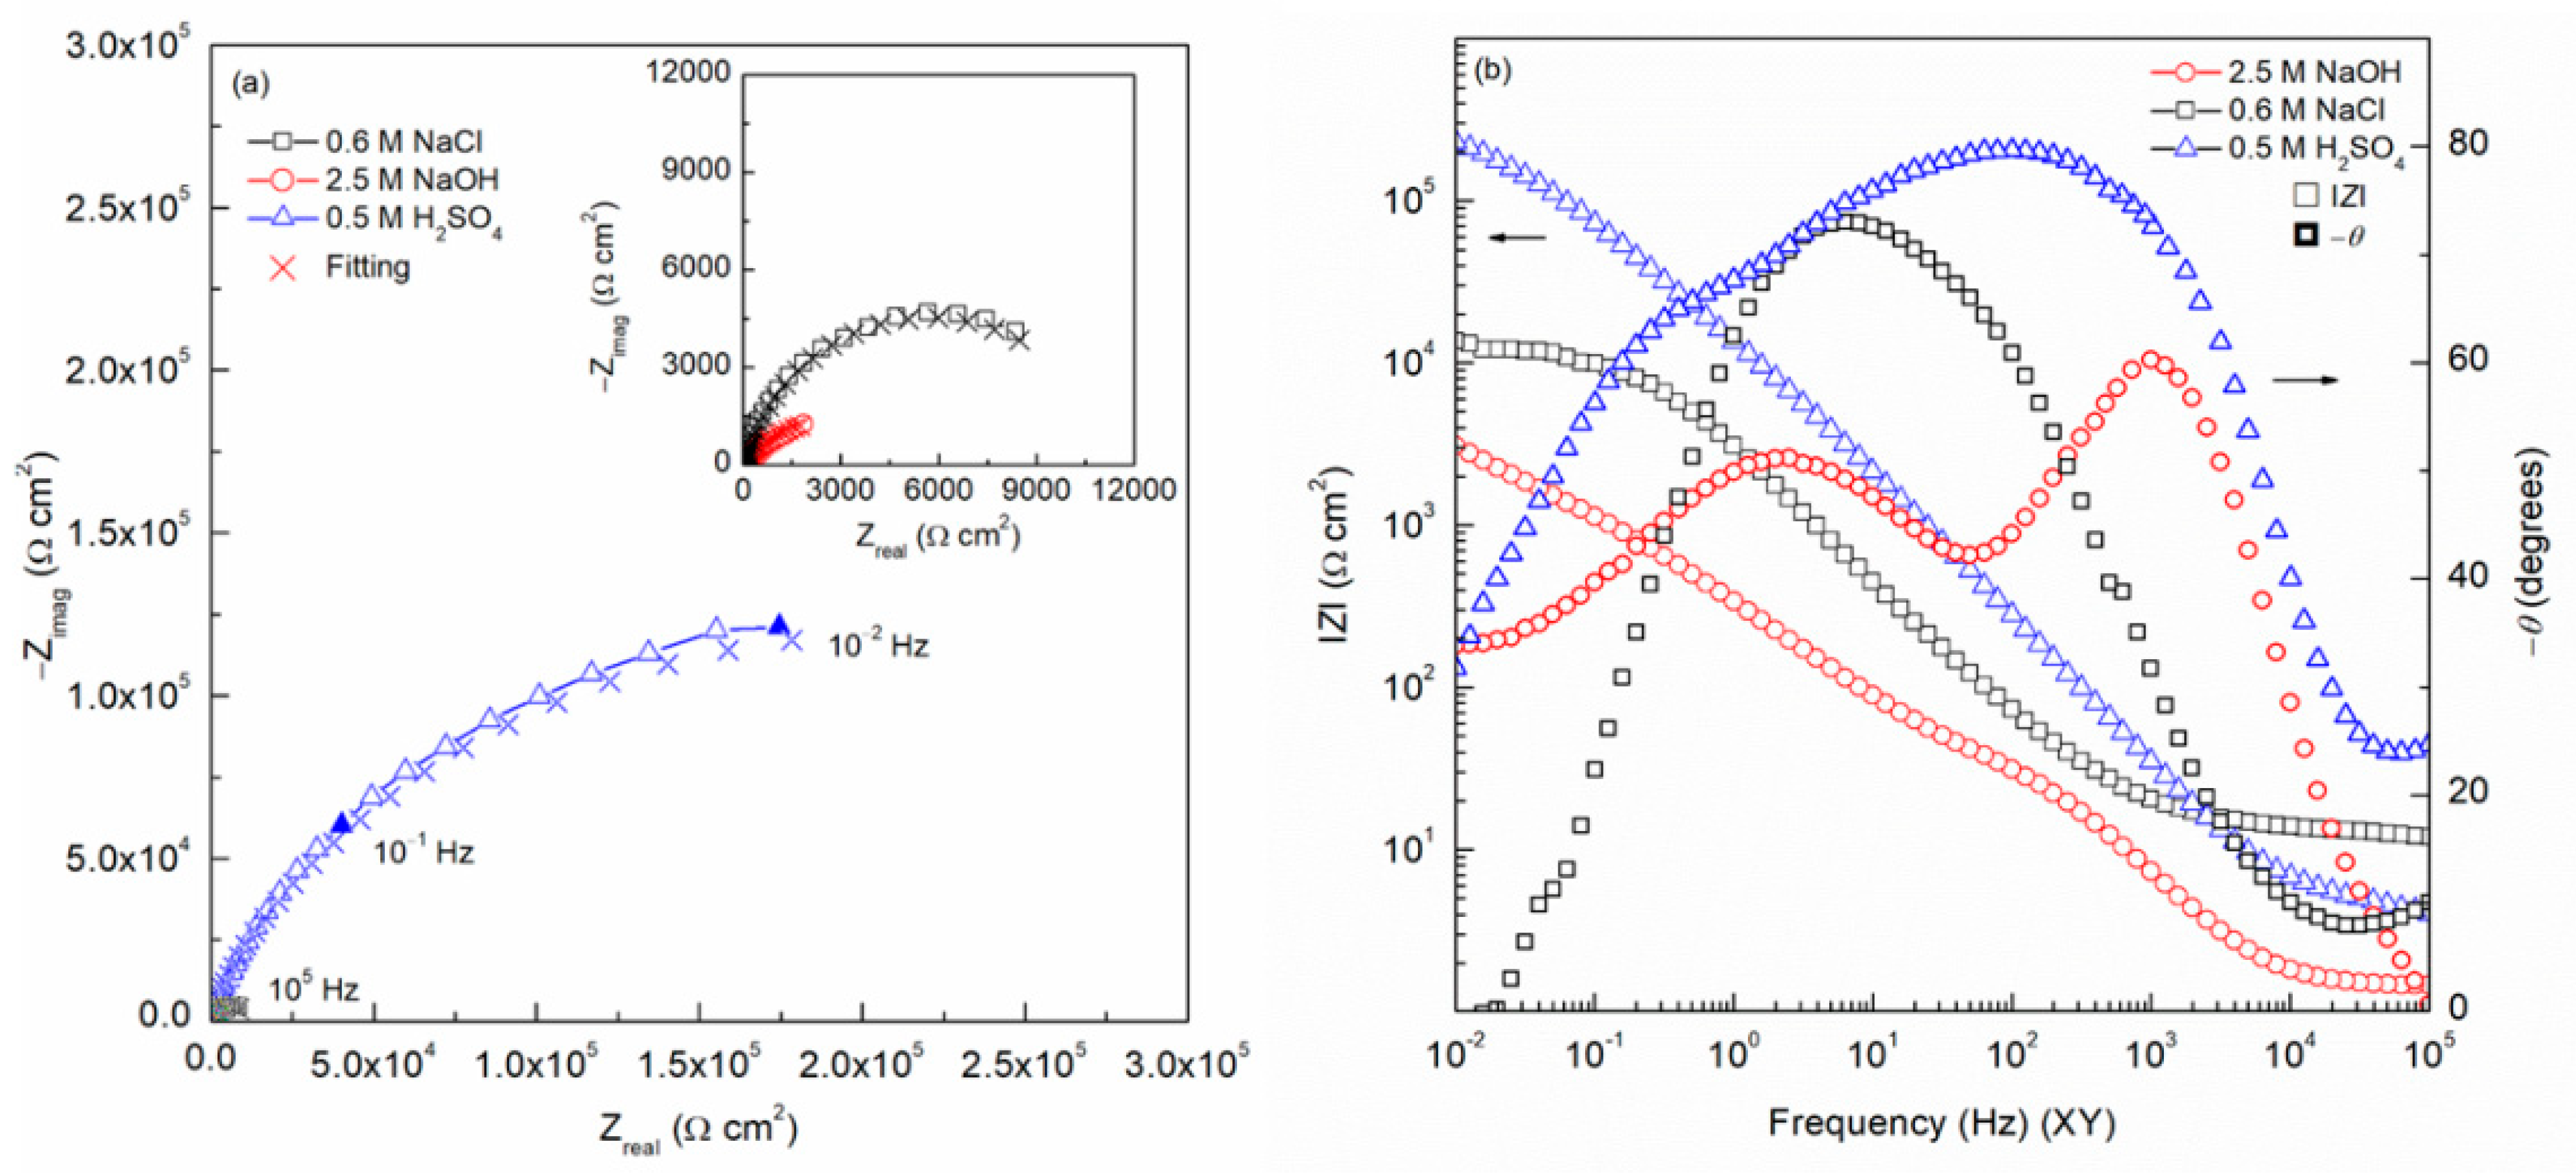
To further analyze the electrochemical corrosion mechanisms of the Al10Cr30Fe25Mn30Ti5 HEA in the different environments, an EIS study was conducted for all three different pH electrolyte solutions at RT and at the OCP (see Figure 5). The Nyquist plots present a depressed semicircle at intermediate frequencies, which can be attributed to the rough and porous passive oxide film surface, where a nonuniform distribution of the alternating current (AC) takes place on the electrode (Figure 5a). The passive film is a porous film with imperfections and inhomogeneities, thus introducing the concept of a nonideal capacitor. This can be modeled using a constant phase element (CPE), the CPE accounts for the nonideal capacitance response of an active electrode, and its impedance is described by ZCPE = (Y)−1 (jω)n, where Y is the admittance (S cm−2 sn), ω is the angular frequency (rad s−1), j is the imaginary number, and n is a dimensionless variable that represents the nonideality of the CPE. The values of n range from 1, which would make the CPE an ideal capacitor, to 0, which will represent an ideal resistor.
The shape of the Bode plots (Figure 5b) show a capacitor behavior at intermediate frequencies, indicated by the phase angle values between 60 and 80 degrees, while resistor behavior is seen at high frequencies with theta angles (θ) close to 0 degrees [18]. The plateau at high frequencies corresponds to the electrolyte resistance. The difference in the modulus of impedance (ǀZǀ), found at low frequencies values (10−2 Hz), is used to compare the overall corrosion performance between solutions. Comparing the ǀZǀ, the highest impedance value of 105 Ω cm2 was obtained for the 0.5 M H2SO4 solution, followed by the 0.6 M NaCl, and ending with the high alkaline 2.5 M NaOH (pH 14), showing a decreased impedance value of two orders of magnitude down to 103 Ω cm2. This trend clearly aligns with the CPP trend previously seen.
Table 4 presents the electrochemical results found in the literature for several HEAs to evaluate the corrosion behavior as a function of the testing electrolyte solution [16,25,26,27,28].
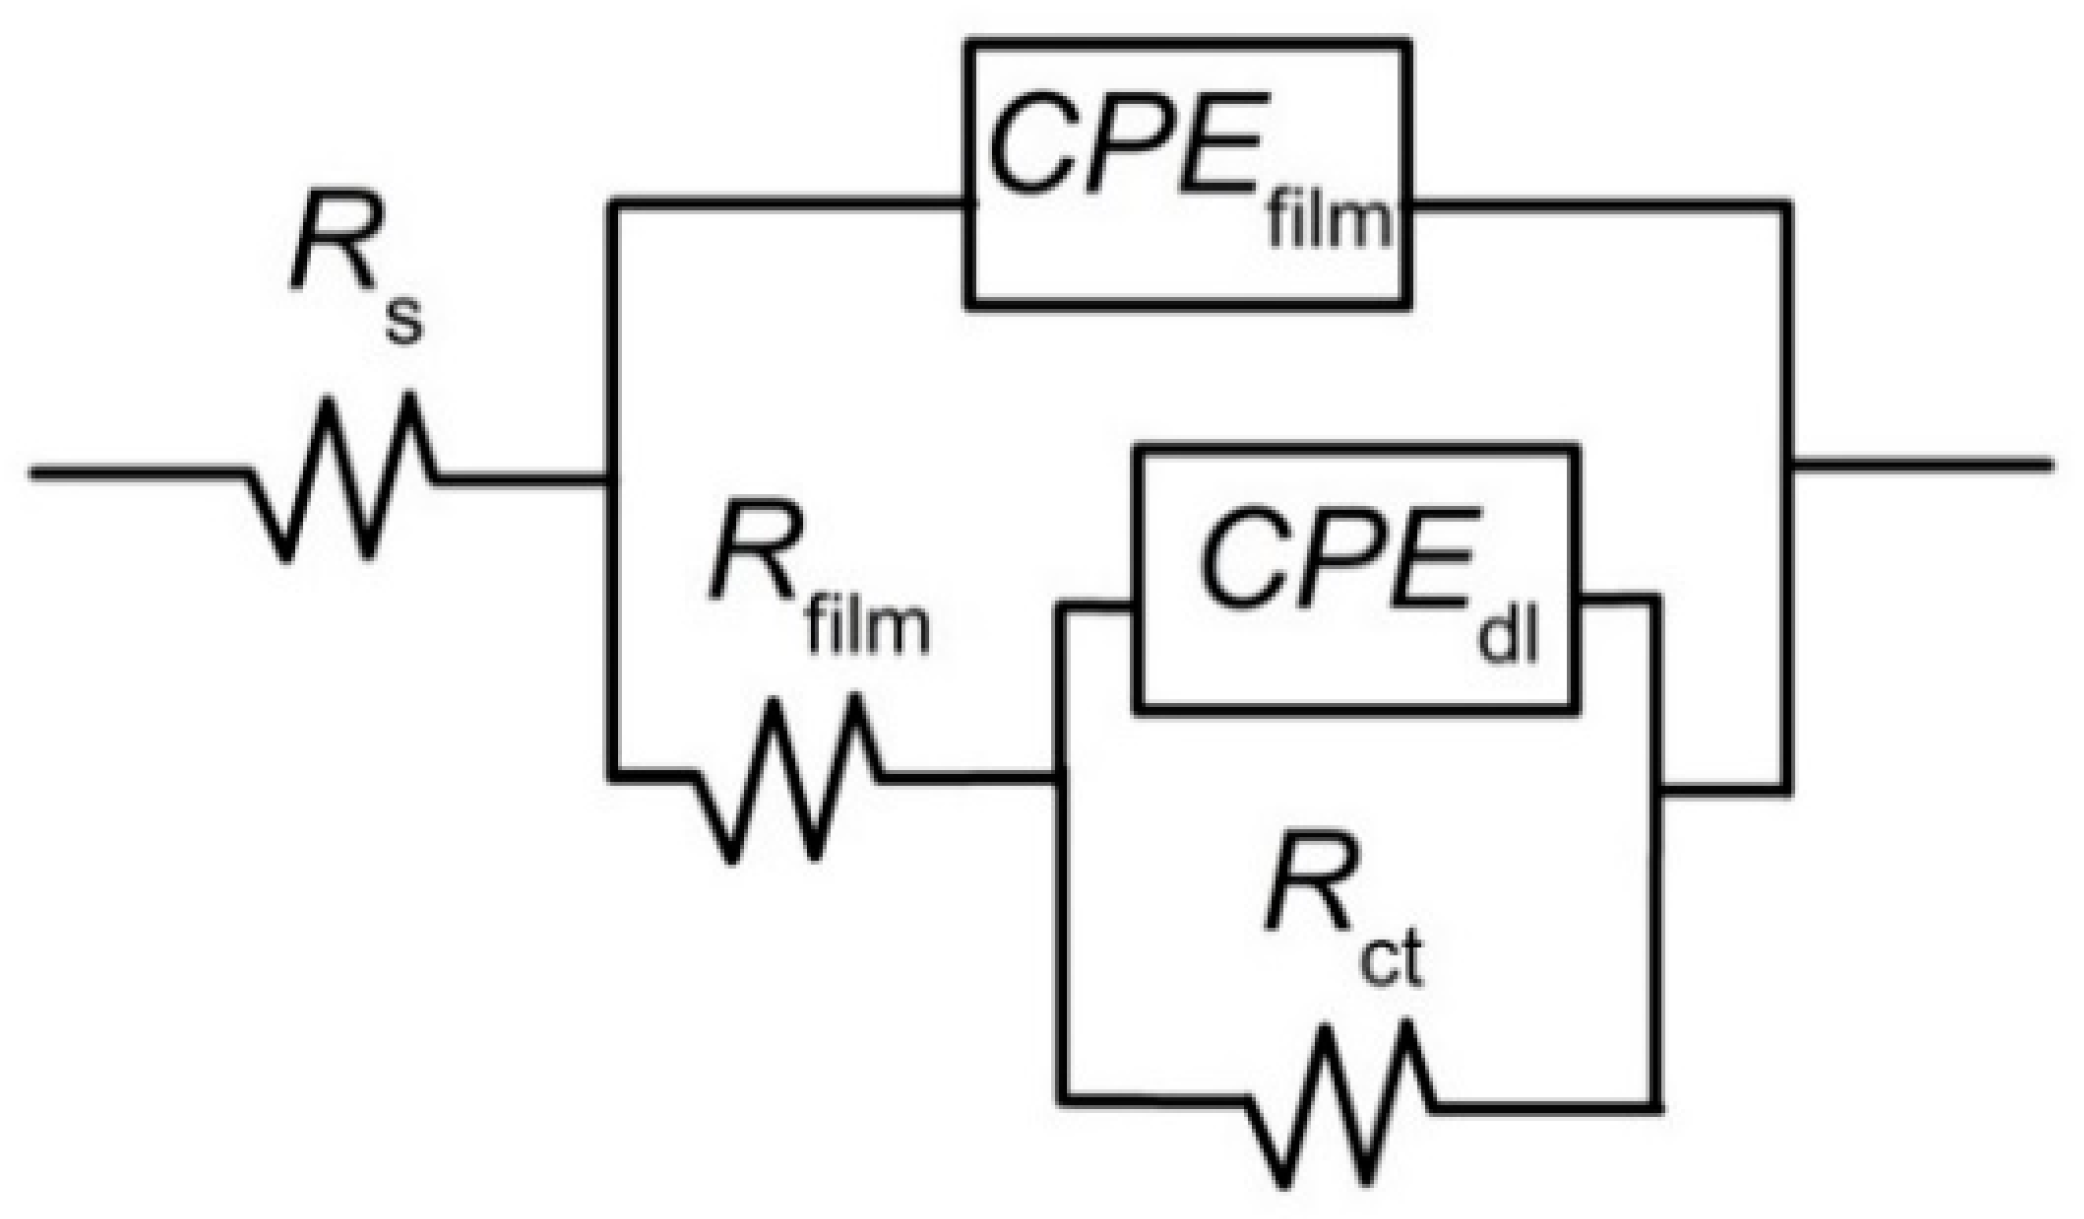
To fit the EIS experimental data, a hierarchical ladder distributed electrical equivalent circuit (EEC) with two time-constants was used. The two time-constant EECs proposed are also shown by the two changes in slope in the θ phase angle, indicating two relaxation processes (see Figure 6). The high- and low-frequency processes represent the response of the passive film and the electrochemical double-layer, respectively. The passive film (at intermediate frequencies) is indicated by the distributed constant phase element (CPEfilm) in parallel with the resistance of the film (Rfilm) (CPEfilm//Rfilm), while the electrochemical double-layer (at low frequencies) is represented by a capacitance (CPEdl) in parallel with the charge transfer resistance (Rct) (CPEdl//Rct) [29,30,31]. The value and order of magnitude of the Rct will indicate the corrosion resistance against the aggressive environment, providing information on susceptibility to localized depassivation and pit incubation [32]. The solution resistance (Rs) is connected in series, indicating the ohmic drop related to the ionic conductivity of the electrolyte.
After the fitting of the EIS experimental data with the proposed EEC, the following fitting parameters were gathered in Table 5.

4. Discussion

4.1. Microstructure and Hardness Analysis

The hardness of the Al10Cr30Fe25Mn30Ti5 HEA was obtained as 660 HV, which, compared to the other BCC HEAs listed in Table 6, is around the average, leaving aside some exceptions such as the 3000 HV of the Co21Cr19Fe20Mn19Ni20 [17] (for further comparisons between HEA see data base [33]). Although the BCC materials have a higher number of slip systems than the FCC, the slip planes in the BCC systems are not as closely packed as in the FCC, and therefore the BCC materials present a lower deformation ability and higher hardness than the FCC materials. Furthermore, the elemental composition, the manufacturing process, and the thermal treatment also influenced the final hardness. Thus, the hardness of this Al10Cr30Fe25Mn30Ti5 HEA in the as-cast condition is 730 HV, decreasing up to 490 HV after the homogenization heat treatment at 1200 °C due to dissolution of the β-Mn phase. Then, after the forging process and the air quenching treatment, the hardness of the Al10Cr30Fe25Mn30Ti5 HEA increases again due to the generation of a high dislocation density, as well as the precipitation of a low-volume fraction of β-Mn phase, as can be seen in Figure 3b.
Finally, it is worth mentioning that the density of the new designed Al10Cr30Fe25Mn30Ti5 HEA was 6.84 g/cm3, which was below most of the other HEAs except the Al20Fe20Mg20Ni20Ti20 due to the higher amount of Al and Ti compared to the one studied in this work, making for an HEA of only 4.64 g/cm3. This new designed Al10Cr30Fe25Mn30Ti5 HEA had the highest hardness-to-density ratio as compared to the other HEAs, which confers suitable application for lightweight materials exposed to strong mechanical stimulus and extreme environments.

4.2. Crystallographic HEXRD Analysis

By means of the peak integration method, the quantification of the BCC phase and the β-Mn phase present in the Al10Cr30Fe25Mn30Ti5 HEA was 94.76 and 5.24%, respectively, showing that most of the phase volume belongs to the BCC phase (see Equation (1)).
Vol . %   Phase = i peak 2 e i 2 e f Phase i phase ( i peak 2 e i 2 e f Phase )

4.3. Cyclic Potentiodynamic Polarization (CPP)

The CPP plots were performed to understand the electrochemical kinetics of the Al10Cr30Fe25Mn30Ti5 HEA, and analyzed to obtain the anodic (βa) and cathodic (βc) Tafel slopes and the Stern–Geary constant (B), as well as the electrochemical transfer coefficients of the anodic (αa) and cathodic (αc) electrode reaction kinetics (see Equations (2)–(4)) [38]:
B = β a   β c 2.303   ( β a + β c )
α a = RT n F 1 β a
α c = RT n F 1 β c
where R is the ideal gas constant (8.314 J mol−1 K−1), T is the temperature in K (at RT), n is the number of electrons, and F is the Faraday constant (96,485 C mol−1).
The βa and βc for both 2.5 M NaOH and 0.6 M NaCl electrolyte solutions are around 600 mV/dec, while the 0.5 M H2SO4 increases its value up to the 700–800 mV/dec, indicating lower dissolution kinetics and therefore better corrosion performance. Both equations, the Tafel slope, and the electrochemical transfer coefficients are inversely related, meaning that higher Tafel slopes exhibit low electrochemical activity and vice versa [39]. Similarly, as was seen on the Ecorr and icorr, as the pH decreased, both αa and αc decreased as well, confirming the better performance of the Al10Cr30Fe25Mn30Ti5 HEA in the acid medium.
Comparing the electrochemical corrosion properties of the new designed Al10Cr30Fe25Mn30Ti5 HEA to other HEA with similar compositions found in the literature, the corrosion protection of the new designed Al10Cr30Fe25Mn30Ti5 HEA is superior in all environments, regardless of the pH. The only HEA which behaves better in alkaline environment is the Cr19.6Ni20.2Co21.3Mn20.5Fe18.4, which is Al-free, thus explaining the nobler Ecorr and lower dissolution kinetics as found on the lower value of icorr and higher modulus of the impedance ǀZǀ, thus conferring superior corrosion protection properties. Nevertheless, in acidic and neutral environments contaminated with chlorides, the icorr is lower than most HEAs, and also large modulus of impedance ǀZǀ values are found at 10−5–10−8 A/cm2 and 105 Ω cm2, respectively.

4.4. Electrochemical Impedance Spectroscopy (EIS)

The EIS fitting data of the Al10Cr30Fe25Mn30Ti5 HEA revealed a similar corrosion behavior trend as the one seen in the CPP, where the most damaging environment was the alkaline (2.5 M NaOH). The time constant for the film (Rfilm//CPEfilm) had the lowest Rfilm value of 0.52 kΩ cm2 and the highest Yfilm 3.65 µS cm−2 sn,film, with a nfilm value of 0.82. Similarly, a low Rct value of 5.35 kΩ cm2 was found. Such a low Rct value indicates the low resistance for the electron transfer, thus indicative of the higher susceptibility to the environment. Then, 0.6 M NaCl showed a considerable increase on the corrosion properties, increasing its Rfilm, decreasing its Yfilm, and increasing the nfilm, with 1.53 kΩ cm2, 3.29 µS cm−2 sn,film, and 0.85, respectively. Finally, the most acidic environment (0.5 M H2SO4) displayed the highest Rfilm value as well as the lowest Yfilm [40]. Comparing the Rct values between the different samples, which are inversely related with the corrosion rate, a decreased Rct value as the pH increased can be seen, showing the lower Rct value of 5.35 kΩ cm2 at the alkaline pH (see Table 5). The charge transfer resistance value of the sample exposed to 0.5 M H2SO4 (Rct = 494.28 kΩ cm2) indicates that sulfuric acid promotes the formation of a protective passive oxide film on the Al10Cr30Fe25Mn30Ti5 HEA, as it is also found on the higher Rfilm value of 2.45 kΩ cm2, in addition to a low CPEfilm value of 1.54 × 10⁻⁵ F/cm2. The time constant attributed to the electrochemical double layer (CPEdl//Rct) shows the ease for the electron transfer, and thus the rate for the electrochemical corrosion reaction, which indicates the kinetics of the anodic dissolution of the passive film. The aluminum reaction at higher [OH] leads to the formation of Al(OH)3, which is the responsible for the faster anodic dissolution kinetics of Al10Cr30Fe25Mn30Ti5 HEA at the alkaline pH.
While an ideal capacitor (non-defective interface) allows to measure directly the capacitance, the CPE elements which represent a defective interface need to be modeled with a branched ladder hierarchically distributed RC network [41,42]. To calculate the effective capacitance of the CPE, the resistance is also considered. In the case of the effective capacitance of the passive film (Ceff,film), the equation from Mansfeld et al. considers the Yfilm, nfilm, and the frequency ( ω m ) value where the imaginary impedance has a maximum to correct the CPE (see Equation (5)) [43]:
C eff ,   film = Y film ( ω m ) n film 1
As can be seen from Table 5, the values of the Ceff,film were calculated, giving the highest value for the 2.5 M NaOH with 8.36 × 10⁻⁵ F cm−2, followed by the 0.6 M NaCl with 6.56 × 10⁻⁵ F cm−2, and 0.5 M H2SO4 with 1.54 × 10⁻⁶ F cm−2. The higher the capacitance, the lower the corrosion protection, as indicated by the lower impedance values as well as the higher current densities seen in the CPP. The effective capacitance value of the passive oxide film, Ceff,film, which is inversely proportional to the passive film thickness (see Equation (6)), indicates a more protective passive film in 0.5 M H2SO4. The lowest Ceff,film value is attributed to the more protective passive film and the highest value to the most defective and doped passive oxide film. The doping process of the passive film is related to higher interstitial vacancies, which may be attributed to the detrimental effect of the OH in the 2.5 M NaOH electrolyte solution. The passive film time constant also includes the higher Rfilm value of 2.45 kΩ cm2. In addition, the tested electrode in 0.5 M H2SO4 electrolyte revealed the higher Rct value of 494.28 kΩ cm2, which is in good agreement with the icorr values trend seen in the CPP.
With the Ceff,film values, the estimated thickness (dfilm) is also added using the inverse relationship seen in Equation (6):
C eff , film = ε o   ε film   A d film
where εo is the dielectric constant of the permittivity of the vacuum (8.84 × 10⁻¹⁴), εfilm is the dielectric constant of the passive oxide film (considered as 12 for HEA [44,45]), and A is the exposed surface area [46,47]. The obtained dfilm of the passive film is 1.27, 1.62, and 6.89 nm for HEA samples exposed to 2.5 M NaOH, 0.6 M NaCl, and 0.5 M H2SO4, respectively. These dfilm values are in the same order of magnitude of the other HEA passive films found in the literature [45]. In addition, it coincides with the other electrochemical results, where the worst corrosion behavior was for 2.5 M NaOH and the best performance was for 0.5 M H2SO4. The reason for the bad corrosion behavior of the presented HEA in the high alkaline environment is the Al content, as previously stated by several authors [3]. The addition of Al content enhances the growth of the BCC phase increasing the elemental segregation degree, besides promoting a less stable passive film compared to Cr oxides [6].
Moreover, it is well known that the Al does not provide corrosion protection in alkaline environments due to the metal dissolution by the hydroxides, which follows the electrochemical reaction Al → Al(OH)3 → Al(OH)4 [48]. Where the corrosion rate depends on the OH concentration based on Al + 3 H2O + OH → 3/2 H2 + Al(OH)4, a higher alkaline pH would thus lead to higher corrosion rates [49]. Even with the short exposure times, the differences in the electrochemical response of the passive oxide film can be seen from both the EIS data as well as by the analysis of the CPP. The one-hour exposure is enough to develop a passive oxide film in the HEA, as previously seen in the literature [18].

4.5. X-ray Photoelectron Spectroscopy (XPS)

The Al10Cr30Fe25Mn30Ti5 HEA samples were analyzed by XPS to study the different oxide products and correlate with the electrochemical dissolution mechanism. The XPS surface analysis of the HEA samples exposed to the three different electrolyte solutions included a depth profile analysis, which can be seen in Figure 7, Figure 8 and Figure 9. The initial XPS surface analysis of the Al10Cr30Fe25Mn30Ti5 HEA in the alkaline environment (2.5 M NaOH) showed a high carbon content due to atmospheric contamination, followed by oxygen (see Figure 7a). After sputtering down to 2 nm, the carbon content decreased in values between 15 and 10 at.% for the following depth profile analyses performed; in addition, the oxygen showed its highest content value of 35 at.%, and thereafter decreased as the depth increased. During the first 10 nm, the passive film is mainly composed out of chromium and iron oxides formation, including Cr2O3, Fe2O3, and the spinel FeCr2O4. The Al and Mn content increased after the first 10 nm, the point where Cr and Fe contents are plateauing (see Figure 7b).
Thus, after the formation of the chromium and iron oxides in the outermost layer, the Al and Mn oxides are formed in the inner layer close to the metal surface. This inner layer is less dense, as the oxygen concentration decreases after the first 10 nm; hence, the main components of the passive film are the Cr2O3, Fe2O3, and FeCr2O4. The passive film thickness of Al10Cr30Fe25Mn30Ti5 in the alkaline environment had a thickness of 10 nm, and it was rich in Cr, Fe, and some Al; however, the protectiveness came from the Cr and Fe oxides, as the Al present was as hydroxides (Al(OH)3), which then reacted with the high alkaline environment to dissolve into Al(OH)4. As discussed, the Al content enhanced the corrosion susceptibility in this environment due to the high OH concentration [49].
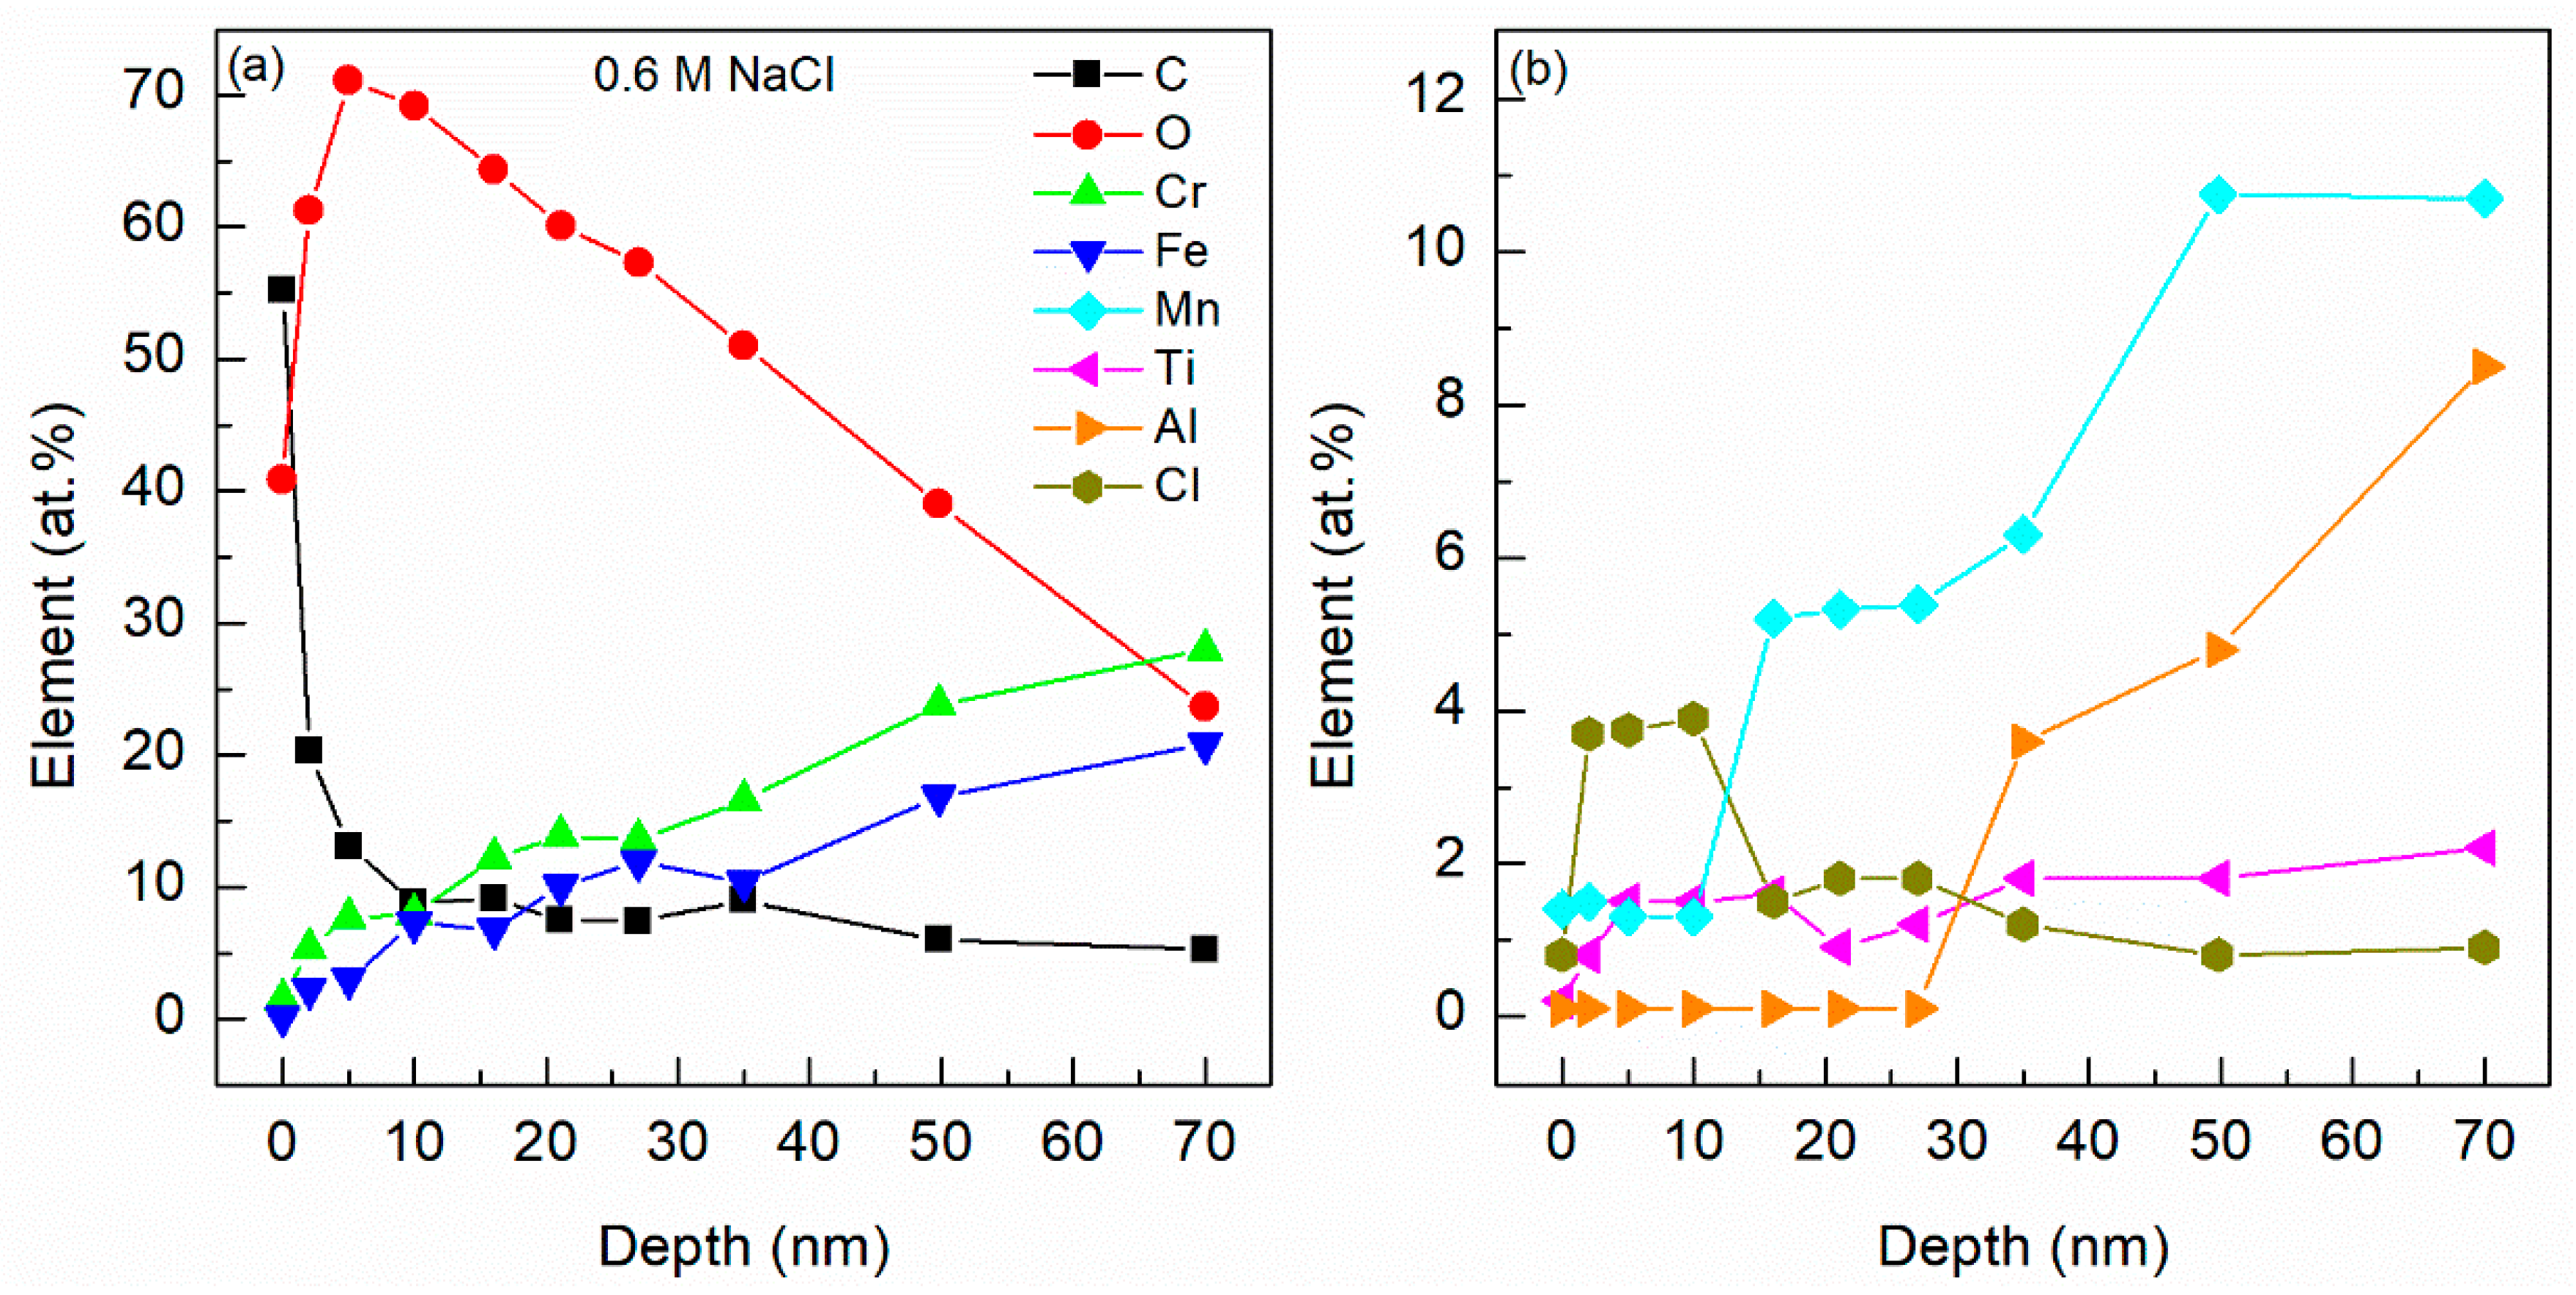
The XPS analysis of the Al10Cr30Fe25Mn30Ti5 HEA in the neutral pH (0.6 M NaCl) showed a high carbon content on the surface; however, it dropped drastically within the first 5 nm (see Figure 8). After the 5 nm depth, a maximum oxygen concentration was found to be 71.1 at.%, which decreased linearly down to 23.7 at.% after 70 nm depth. The two main alloying elements, Cr and Fe, gradually increased with depth, being below 15 at.% for depths below 25 nm. Nevertheless, as the depth increases, both metal concentrations increase, being that of Cr above that of Fe. While the tendency for the passive films is to form the Fe oxides on the outer layer and the Cr oxides underneath, the elemental composition of the Al10Cr30Fe25Mn30Ti HEA has a higher Cr content than Fe, 34.48 and 28.94 at.%, respectively, making the Cr to react even faster and produce Cr oxides on the outer layers (see Figure 8a) [50]. The Mn oxides do not play a significant role until reaching the 10 nm depth, where the Mn concentration is raised from 1.3 to 5.2 at.%, stabilizing around 30 nm, with another step found up to 11.7 at.% at 50 nm (see Figure 8b). The Al oxides were detected after 30 nm depth, increasing linearly thereafter as the depth increases. The Ti content keeps constant throughout the entire 70 nm range around 1.5 at.%. Finally, the Cl influenced the first 10 nm, as its concentration remained similar to that in the testing solution, around 3.8 at.%, after that the concentration dropped around 1 at.%. Even more, in this 70 nm passive film, it can be seen that the oxides composition also changes, reacting on the outermost surface the Cr and Fe oxides, and further inside, the Mn and Al oxides start getting some relevance after 30 nm.
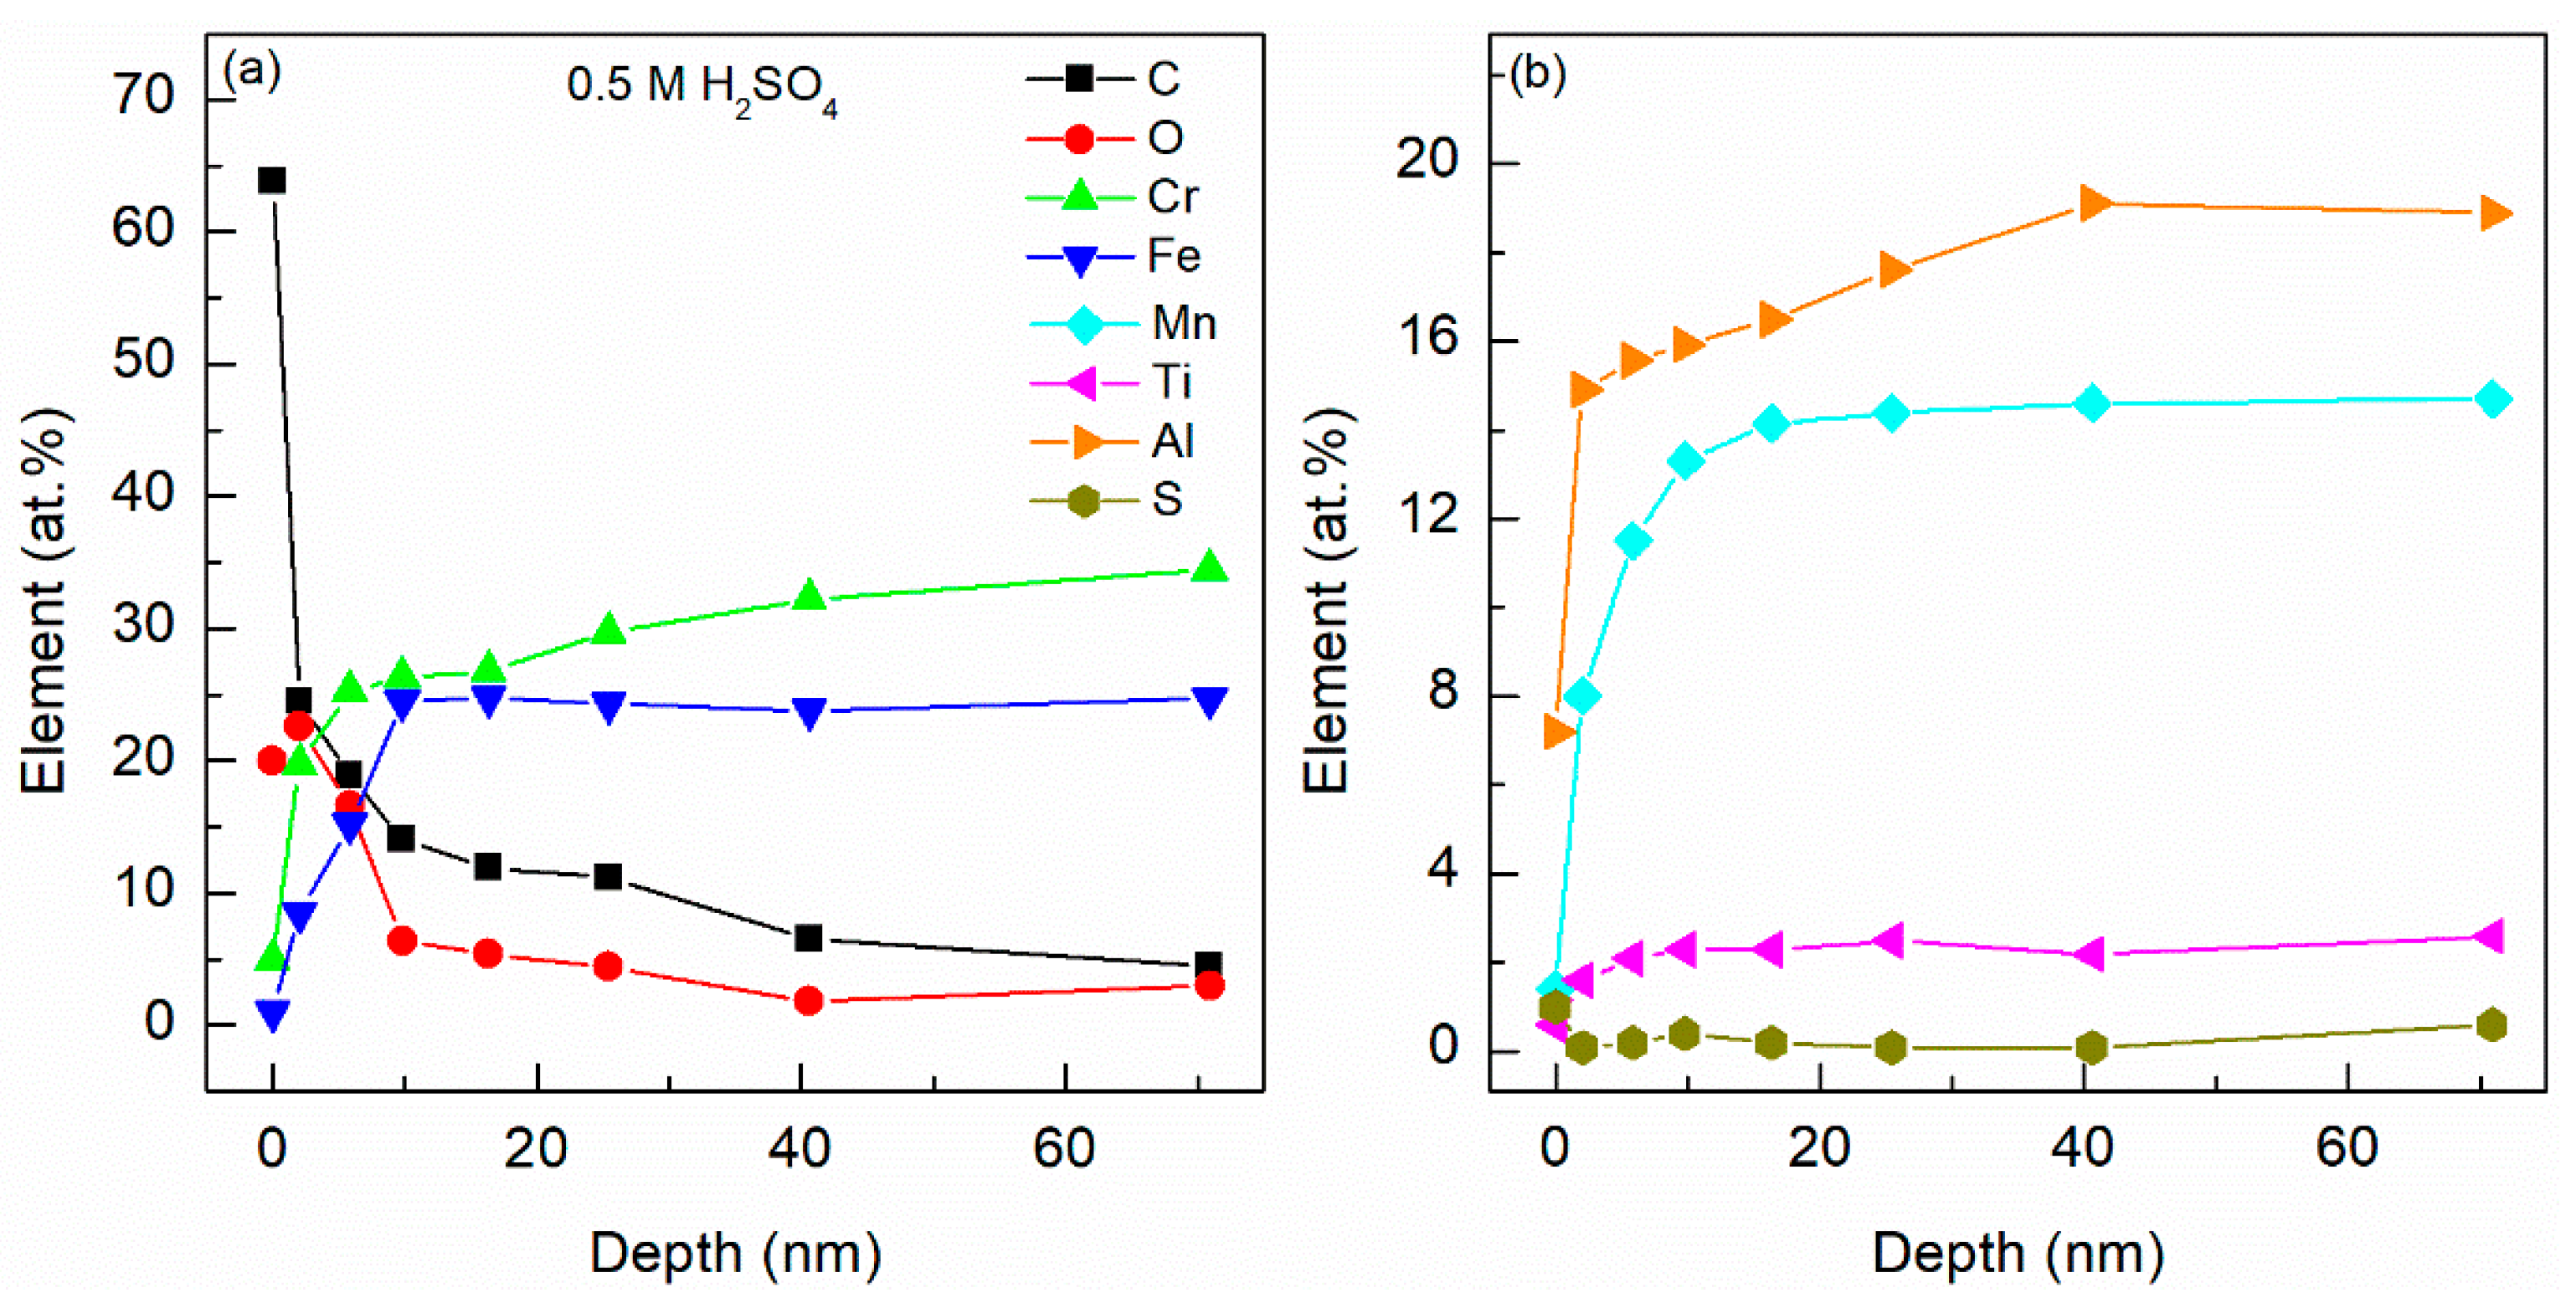
The XPS analysis of the Al10Cr30Fe25Mn30Ti5 HEA in the acidic solution (0.5 M H2SO4, pH 0.3) exhibited the highest Cr and Fe concentrations at the surface (Figure 9a,b), with values in the 25 at.%. The acid environment enhances the formation of the passive film rich in Cr oxides, as well as in Cr-Fe mixed oxides, thus conferring enhanced corrosion protection properties. In this acidic environment, the passive film is not as dense as that generated in the 0.6 M NaCl solution, where the XPS analyses revealed an oxygen peak content around 25 at.%. (5 nm depth) compared to the almost 70 nm of the neutral pH environment. The Al and Mn contents play a critical role in the formation of a stable and protective passive oxide film, where an enrichment in Mn was found after the 30 nm depth. A high Al content is seen in the film composition due to the stability of Al in an acidic pH 0.3. The great amount of Cr and Fe oxides confirms the outstanding corrosion performance of the Al10Cr30Fe25Mn30Ti5 HEA in the acidic medium, showing the lowest icorr and high ǀZǀ values, with 1.36 × 10⁻⁸ A/cm2 and 2.30 × 10⁵ Ω cm2, respectively.

4.6. Energy Dispersive X-ray Spectroscopy (EDX)

A visual inspection of the Al10Cr30Fe25Mn30Ti5 HEA samples was first conducted, looking for pits or signs of dissolution. Both acidic and neutral pH showed no pitting, but the alkaline environment 2.5 M NaOH did show clear signs of dissolution. After inspection, the 2.5 M NaOH sample was analyzed by SEM and EDX to further study the preferential dissolution of the HEA in the alkaline environment (see Figure 10).
From the EDX mapping, the outermost surface of the Al10Cr30Fe25Mn30Ti5 HEA sample was rich in Mn, Fe, and Cr, while the inside of the pit revealed a region mainly formed out of Ti and Al.
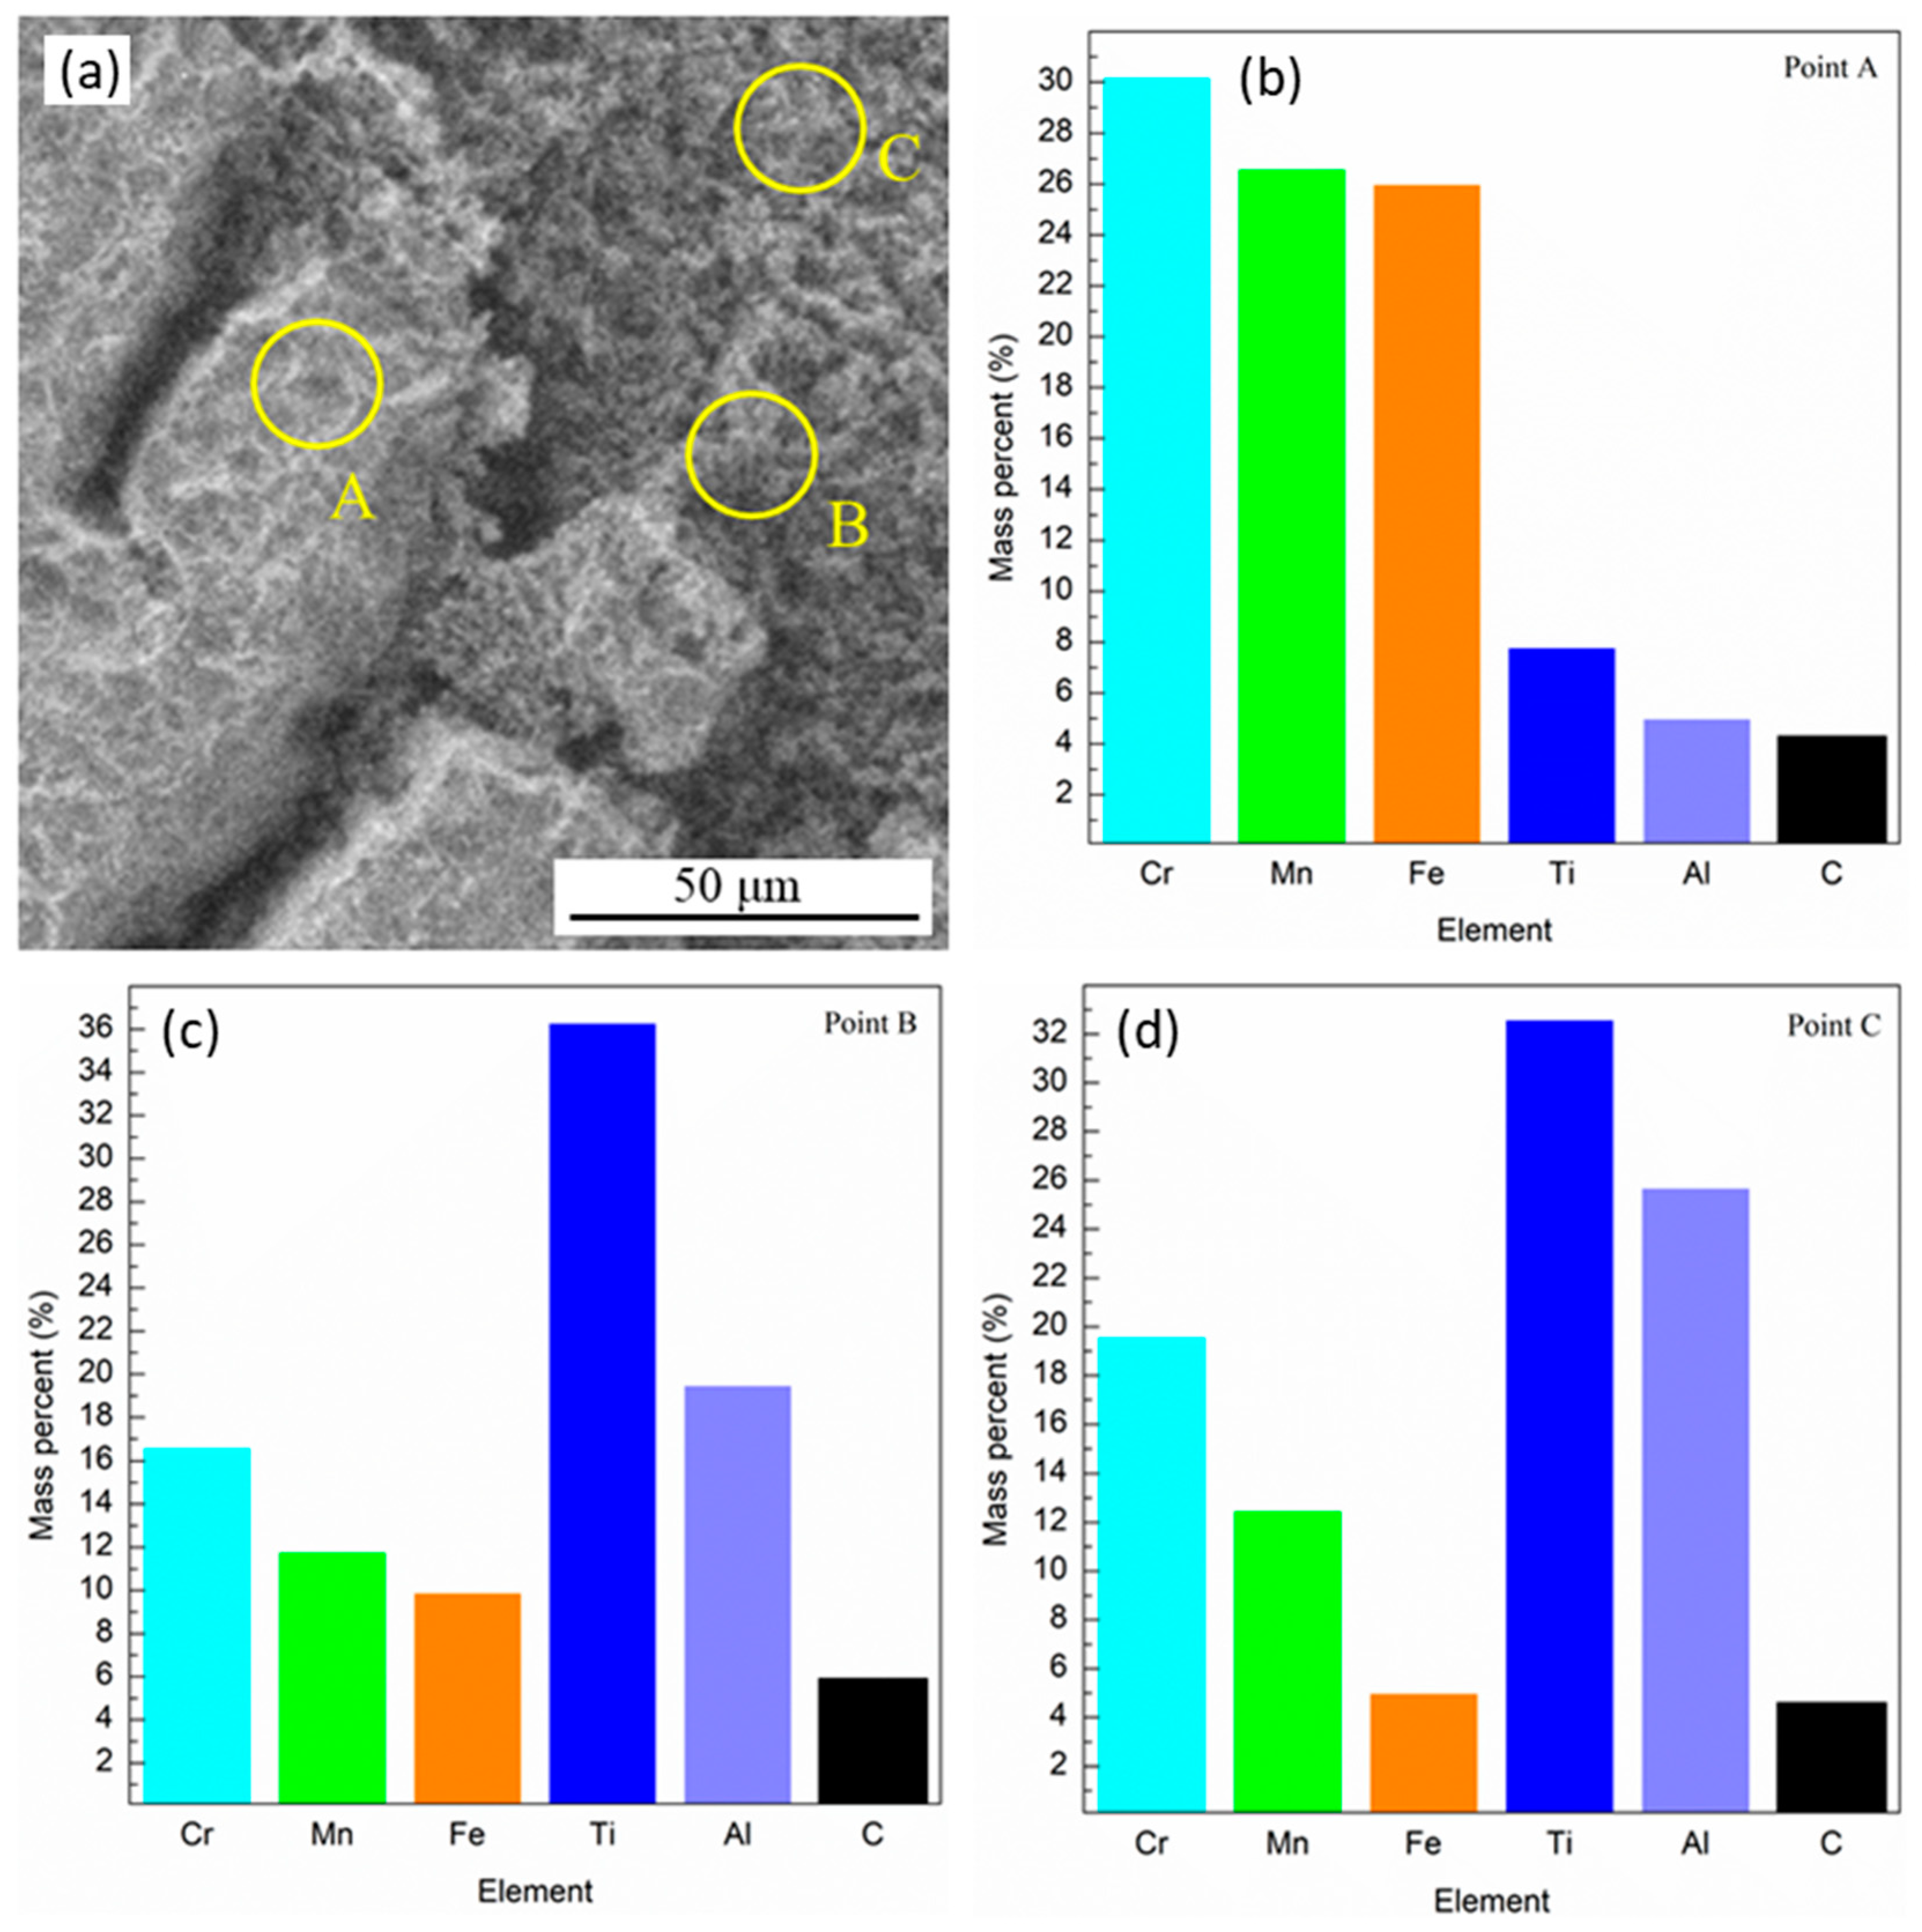
This shows how the alkaline environment preferentially dissolves the Al forming Al(OH)3 to then dissolve into Al(OH)4, indicated by the lower impedance response seen in the Nyquist plots. A selective elemental analysis of the surface of the pit and surroundings showed that, inside the pit, the Al concentration increases (see Figure 11). This agrees with the higher Al content measured by XPS, where it sharply increased once the passive film was gone (approximately 10 nm).
As a summary, the studied Al10Cr30Fe25Mn30Ti5 HEA showed outstanding corrosion performance in the acidic solution (0.5 M H2SO4), with low icorr values and high impedance values. In the neutral solution (0.6 M NaCl), while still being above the average compared to the literature, decreased its corrosion efficiency. Nevertheless, the high alkaline electrolyte solution (2.5 M NaOH) favors dissolution kinetics due to the spontaneous reaction of Al and OH, yielding Al(OH)3 and promoting passivity breakdown, which, under a high alkaline pH environment, evolves to Al(OH)4, thus dissolving the electrode surface film Al → Al(OH)3 → Al(OH)4 [48]. Where the corrosion rate depends on the OH concentration based on the electrochemical reaction of Al + 3 H2O + OH → 3/2 H2 + Al(OH)4, therefore high-concentration alkaline solutions would lead to higher corrosion rates [49].

5. Conclusions

After studying the crystallography, microstructure, and electrochemical corrosion properties in different environments and pHs for the Al10Cr30Fe25Mn30Ti5 HEA, the following conclusions are drawn:
The Al10Cr30Fe25Mn30Ti5 HEA is mainly composed of a BCC crystal structure with some β-Mn, having a ratio of 94.76% and 5.24%, respectively.
The Al10Cr30Fe25Mn30Ti5 HEA shows hardness values similar to other BCC HEAs at 660 HV, being also a light alloy compared to other HEAs, having a density of 6.84 g/cm3, thereby showing that the mechanical properties of the Al10Cr30Fe25Mn30Ti5 HEA exceed the conventional HEAs.
The anodic kinetics are activated as the pH increases, being that the high alkaline (2.5 M NaOH) environment is the most aggressive for the Al10Cr30Fe25Mn30Ti5 HEA. The preferential dissolution of the Al due to the high OH concentration promotes the formation of Al(OH)3, thus showing the highest icorr and lowest Ecorr values from all three environments.
The modulus of impedance response of the Al10Cr30Fe25Mn30Ti5 HEA is maximized in the acid and neutral pH, with a ǀZǀ in the 105 Ω cm2, thus indicating corrosion protection, while in alkaline environment, the impedance decreases to 103 Ω cm2.
By the XPS surface analysis, the formation of a stable passive film on the Al10Cr30Fe25Mn30Ti5 HEA for the neutral and acidic environments was revealed, showing high Cr and Fe contents, with dfilm values within the range from 30 to 70 nm thickness.
The elemental composition of the Al10Cr30Fe25Mn30Ti5 HEA makes it suitable for acid to neutral conditions, being able to form a stable passive film which protects it from the aggressive agents. However, the new HEA fails to withstand alkaline environments due to the Al alloying, because of the fast dissolution kinetics experienced by Al(OH)3.

Author Contributions

Conceptualization, D.M.B.; Methodology, U.M., J.R., P.P., P.A. and D.M.B.; Experimental design, U.M., J.R., P.P., P.A. and D.M.B.; Data analysis, U.M., J.R. and D.M.B.; Resources, D.M.B.; Writing—original draft preparation, U.M., J.R., P.P., P.A. and D.M.B.; Writing—review and editing, U.M., J.R., P.P., P.A. and D.M.B.; Visualization, D.M.B.; Supervision, D.M.B.; Project administration, D.M.B.; Funding acquisition, D.M.B. All authors have read and agreed to the published version of the manuscript.

Funding

This research was funded by Firestone Research, grant number 639430, and the University of Akron Fellowship, FRC-207160 and FRC-207865. P.A and P.P. acknowledge financial support of the Spanish Ministry of Science and Innovation under project PID2019-104382RBI00. The assistance of A. Stark during HEXRD measurements in P07 beamline of PETRA III, at the Deutsches-Elektronen-Synchrotron (DESY), is acknowledged in the framework of proposal I20210087EC.

Institutional Review Board Statement

Not applicable.

Informed Consent Statement

Not applicable.

Data Availability Statement

The raw/processed data required to reproduce these findings cannot be shared at this time as the data also form part of an ongoing study.

Acknowledgments

The authors acknowledge the technical support and facilities from the National Center for Education and Research on Corrosion and Materials Performance (NCERCAMP-UA), the College of Engineering and Polymer Science, and the University of Akron. The assistance of A. Stark during HEXRD measurements in P07 beamline of PETRA III, at the Deutsches-Elektronen-Synchrotron (DESY), is acknowledged in the framework of proposal I20191277EC.

Conflicts of Interest

The authors declare no conflict of interest.

References

  1. Jiang, S.; Lin, Z.; Xu, H.; Sun, Y. Studies on the microstructure and properties of AlxCoCrFeNiTi1−x high entropy alloys. J. Alloys Compd. 2018, 741, 826–833. [Google Scholar] [CrossRef]
  2. Liu, T.K.; Wu, Z.; Stoica, A.D.; Xie, Q.; Wu, W.; Gao, Y.F.; Bei, H.; An, K. Twinning-mediated work hardening and texture evolution in CrCoFeMnNi high entropy alloys at cryogenic temperature. Mater. Des. 2017, 131, 419–427. [Google Scholar] [CrossRef]
  3. Shi, Y.; Yang, B.; Liaw, P. Corrosion-resistant high-entropy alloys: A review. Metals 2017, 7, 43. [Google Scholar] [CrossRef] [Green Version]
  4. Lu, C.-W.; Lu, Y.-S.; Lai, Z.-H.; Yen, H.-W.; Lee, Y.-L. Comparative corrosion behavior of Fe50Mn30Co10Cr10 dual-phase high-entropy alloy and CoCrFeMnNi high-entropy alloy in 3.5 wt% NaCl solution. J. Alloys Compd. 2020, 842, 155824. [Google Scholar] [CrossRef]
  5. Shi, Y.; Yang, B.; Xie, X.; Brechtl, J.; Dahmen, K.A.; Liaw, P.K. Corrosion of Al CoCrFeNi high-entropy alloys: Al-content and potential scan-rate dependent pitting behavior. Corros. Sci. 2017, 119, 33–45. [Google Scholar] [CrossRef]
  6. Lee, C.P.; Chang, C.C.; Chen, Y.Y.; Yeh, J.W.; Shih, H.C. Effect of the aluminium content of AlxCrFe1.5MnNi0.5 high-entropy alloys on the corrosion behaviour in aqueous environments. Corros. Sci. 2008, 50, 2053–2060. [Google Scholar] [CrossRef]
  7. Wu, C.L.; Zhang, S.; Zhang, C.H.; Zhang, H.; Dong, S.Y. Phase evolution and cavitation erosion-corrosion behavior of FeCoCrAlNiTix high entropy alloy coatings on 304 stainless steel by laser surface alloying. J. Alloys Compd. 2017, 698, 761–770. [Google Scholar] [CrossRef]
  8. Shang, X.-L.; Wang, Z.-J.; Wu, Q.-F.; Wang, J.-C.; Li, J.-J.; Yu, J.-K. Effect of Mo addition on corrosion behavior of high-entropy alloys CoCrFeNiMox in aqueous environments. Acta Metall. Sin. 2019, 32, 41–51. [Google Scholar] [CrossRef] [Green Version]
  9. Han, L.-X.; Wang, C.-M.; Sun, H.-F. Microstructure and anticorrosion property of high-entropy alloy AlFeNiCrCoTi0.5Vx. Mater. Trans. 2016, 57, 1134–1137. [Google Scholar] [CrossRef] [Green Version]
  10. Liu, M. Effect of uniform corrosion on mechanical behavior of E690 high-strength steel lattice corrugated panel in marine environment: A finite element analysis. Mater. Res. Express 2021, 8, 66510. [Google Scholar] [CrossRef]
  11. Qiu, Y.; Thomas, S.; Gibson, M.A.; Fraser, H.L.; Birbilis, N. Corrosion of high entropy alloys. NPJ Mater. Degrad. 2017, 1, 15. [Google Scholar] [CrossRef] [Green Version]
  12. ASTM G106-89; Standard Practice for Verification of Algorithm and Equipment for Electrochemical Impedance Measurements. ASTM International: West Conshohocken, PA, USA, 2015. [CrossRef]
  13. ASTM G61-86; Standard Test Method for Conducting Cyclic Potentiodynamic Polarization Measurements for Localized Corrosion Susceptibility of Iron-, Nickel-, or Cobalt-Based Alloys. ASTM International: West Conshohocken, PA, USA, 2018. [CrossRef]
  14. Qiu, Y.; Gibson, M.A.; Fraser, H.L.; Birbilis, N. Corrosion characteristics of high entropy alloys. Mater. Sci. Technol. 2015, 31, 1235–1243. [Google Scholar] [CrossRef]
  15. Fu, Y.; Li, J.; Luo, H.; Du, C.; Li, X. Recent advances on environmental corrosion behavior and mechanism of high-entropy alloys. J. Mater. Sci. Technol. 2021, 80, 217–233. [Google Scholar] [CrossRef]
  16. Hassan, M.A.; Ghayad, I.M.; Mohamed, A.S.A.; El-Nikhaily, A.E.; Elkady, O.A. Improvement ductility and corrosion resistance of CoCrFeNi and AlCoCrFeNi HEAs by electroless copper technique. J. Mater. Res. Technol. 2021, 13, 463–485. [Google Scholar] [CrossRef]
  17. Shi, Y.; Mo, J.; Zhang, F.-Y.; Yang, B.; Liaw, P.K.; Zhao, Y. In-situ visualization of corrosion behavior of Al CoCrFeNi high-entropy alloys during electrochemical polarization. J. Alloys Compd. 2020, 844, 156014. [Google Scholar] [CrossRef]
  18. Xue, L.; Ding, Y.; Pradeep, K.G.; Case, R.; Castaneda, H.; Paredes, M. The grain size effect on corrosion property of Al2Cr5Cu5Fe53Ni35 high-entropy alloy in marine environment. Corros. Sci. 2022, 208, 110625. [Google Scholar] [CrossRef]
  19. Demchenko, I.N.; Melikhov, Y.; Syryanyy, Y.; Zaytseva, I.; Konstantynov, P.; Chernyshova, M. Effect of argon sputtering on XPS depth-profiling results of Si/Nb/Si. J. Electron Spectros. Relat. Phenom. 2018, 224, 17–22. [Google Scholar] [CrossRef] [Green Version]
  20. Pérez, P.; Garcés, G.; Frutos-Myro, E.; Antoranz, J.M.; Tsipas, S.; Adeva, P. Diseño y caracterización de tres aleaciones multiprincipales ligeras potencialmente candidatas a aleaciones de alta entropía. Rev. Metal. 2019, 55, 147. [Google Scholar] [CrossRef]
  21. Ortega, Y.; Monge, M.A.; Savoini, B.; Muñoz, A.; Pérez, P. Production and characterization of the Cr35Fe35V16.5Mo6Ti7.5 high entropy alloy. Nucl. Mater. Energy 2022, 30, 101148. [Google Scholar] [CrossRef]
  22. Liu, M.; Li, J. In-situ raman characterization of initial corrosion behavior of copper in neutral 3.5% (wt.) NaCl solution. Materials 2019, 12, 2164. [Google Scholar] [CrossRef] [PubMed] [Green Version]
  23. Lins, V.F.C.; Freitas, M.A.; e Silva, E.M.P. Corrosion resistance study of Fe–Mn–Al–C alloys using immersion and potentiostatic tests. Appl. Surf. Sci. 2005, 250, 124–134. [Google Scholar] [CrossRef]
  24. Nascimento, C.B.; Donatus, U.; Ríos, C.T.; de Oliveira, M.C.L.; Antunes, R.A. A review on corrosion of high entropy alloys: Exploring the interplay between corrosion properties, alloy composition, passive film stability and materials selection. Mater. Res. 2022, 25. [Google Scholar] [CrossRef]
  25. Zendejas Medina, L.; Tavares da Costa, M.V.; Paschalidou, E.M.; Lindwall, G.; Riekehr, L.; Korvela, M.; Fritze, S.; Kolozsvári, S.; Gamstedt, E.K.; Nyholm, L.; et al. Enhancing corrosion resistance, hardness, and crack resistance in magnetron sputtered high entropy CoCrFeMnNi coatings by adding carbon. Mater. Des. 2021, 205, 109711. [Google Scholar] [CrossRef]
  26. Zhu, M.; Zhao, B.; Yuan, Y.; Guo, S.; Wei, G. Study on corrosion behavior and mechanism of CoCrFeMnNi HEA interfered by AC current in simulated alkaline soil environment. J. Electroanal. Chem. 2021, 882, 115026. [Google Scholar] [CrossRef]
  27. Muftah, W.; Allport, J.; Vishnyakov, V. Corrosion performance and mechanical properties of FeCrSiNb amorphous equiatomic HEA thin film. Surf. Coat. Technol. 2021, 422, 127486. [Google Scholar] [CrossRef]
  28. Wang, Y.; Jin, J.; Zhang, M.; Wang, X.; Gong, P.; Zhang, J.; Liu, J. Effect of the grain size on the corrosion behavior of CoCrFeMnNi HEAs in a 0.5 M H2SO4 solution. J. Alloys Compd. 2021, 858, 157712. [Google Scholar] [CrossRef]
  29. Bertolini, L. Steel corrosion and service life of reinforced concrete structures. Struct. Infrastruct. Eng. 2008, 4, 123–137. [Google Scholar] [CrossRef]
  30. Bautista, A.; Alvarez, S.M.; Paredes, E.C.; Velasco, F.; Guzman, S. Corrugated stainless steels embedded in carbonated mortars with and without chlorides: 9-Year corrosion results. Constr. Build. Mater. 2015, 95, 186–196. [Google Scholar] [CrossRef]
  31. Zeng, Y.; Kang, L.; Wu, Y.; Wan, S.; Liao, B.; Li, N.; Guo, X. Melamine modified carbon dots as high effective corrosion inhibitor for Q235 carbon steel in neutral 3.5 wt% NaCl solution. J. Mol. Liq. 2022, 349, 118108. [Google Scholar] [CrossRef]
  32. Ryan, M.P.; Williams, D.E.; Chater, R.J.; Hutton, B.M.; McPhail, D.S. Why stainless steel corrodes. Nature 2002, 415, 770–774. [Google Scholar] [CrossRef] [PubMed]
  33. Gorsse, S.; Nguyen, M.H.; Senkov, O.N.; Miracle, D.B. Database on the mechanical properties of high entropy alloys and complex concentrated alloys. Data Br. 2018, 21, 2664–2678. [Google Scholar] [CrossRef] [PubMed]
  34. Peng, S.; Lu, Z.; Yu, L. Effects of Y2O3/Ti/Zr addition on microstructure and hardness of ODS-CoCrFeNi HEAs produced by mechanical alloying and spark plasma sintering. J. Alloys Compd. 2021, 861, 157940. [Google Scholar] [CrossRef]
  35. Ocak, B.C.; Goller, G. Investigation the effect of FeNiCoCrMo HEA addition on properties of B4C ceramic prepared by spark plasma sintering. J. Eur. Ceram. Soc. 2021, 41, 6290–6301. [Google Scholar] [CrossRef]
  36. Xiao, J.K.; Tan, H.; Chen, J.; Martini, A.; Zhang, C. Effect of carbon content on microstructure, hardness and wear resistance of CoCrFeMnNiCx high-entropy alloys. J. Alloys Compd. 2020, 847, 156533. [Google Scholar] [CrossRef]
  37. Mishra, R.K.; Shahi, R.R. A novel low-density semi-hard magnetic Al20Fe20Mg20Ni20Ti20 high entropy alloy. J. Magn. Magn. Mater. 2020, 516, 167342. [Google Scholar] [CrossRef]
  38. Guidelli, R.; Compton, R.G.; Feliu, J.M.; Gileadi, E.; Lipkowski, J.; Schmickler, W.; Trasatti, S. Defining the transfer coefficient in electrochemistry: An assessment (IUPAC Technical Report). Pure Appl. Chem. 2014, 86, 245–258. [Google Scholar] [CrossRef] [Green Version]
  39. Negahdar, L.; Zeng, F.; Palkovits, S.; Broicher, C.; Palkovits, R. Mechanistic aspects of the electrocatalytic oxygen evolution reaction over Ni−Co oxides. ChemElectroChem 2019, 6, 5588–5595. [Google Scholar] [CrossRef]
  40. Wan, S.; Zhang, T.; Chen, H.; Liao, B.; Guo, X. Kapok leaves extract and synergistic iodide as novel effective corrosion inhibitors for Q235 carbon steel in H2SO4 medium. Ind. Crops Prod. 2022, 178, 114649. [Google Scholar] [CrossRef]
  41. Bastidas, D.M. Interpretation of impedance data for porous electrodes and diffusion processes. Corrosion 2007, 63, 515–521. [Google Scholar] [CrossRef]
  42. Bastidas, D.M. High temperature corrosion of metallic interconnects in solid oxide fuel cells. Rev. Metal. 2006, 42, 425–443. [Google Scholar] [CrossRef]
  43. Hsu, C.H.; Mansfeld, F. Technical note: Concerning the conversion of the constant phase element parameter Y0 into a capacitance. Corrosion 2001, 57, 747–748. [Google Scholar] [CrossRef]
  44. Luo, H.; Zou, S.; Chen, Y.-H.; Li, Z.; Du, C.; Li, X. Influence of carbon on the corrosion behaviour of interstitial equiatomic CoCrFeMnNi high-entropy alloys in a chlorinated concrete solution. Corros. Sci. 2020, 163, 108287. [Google Scholar] [CrossRef]
  45. Nascimento, C.B.; Donatus, U.; Ríos, C.T.; Antunes, R.A. Electronic properties of the passive films formed on CoCrFeNi and CoCrFeNiAl high entropy alloys in sodium chloride solution. J. Mater. Res. Technol. 2020, 9, 13879–13892. [Google Scholar] [CrossRef]
  46. Hakiki, N.B.; Boudin, S.; Rondot, B.; Da Cunha Belo, M. The electronic structure of passive films formed on stainless steels. Corros. Sci. 1995, 37, 1809–1822. [Google Scholar] [CrossRef]
  47. Fajardo, S.; Bastidas, D.M.; Criado, M.; Bastidas, J.M. Electrochemical study on the corrosion behaviour of a new low-nickel stainless steel in carbonated alkaline solution in the presence of chlorides. Electrochim. Acta 2014, 129, 160–170. [Google Scholar] [CrossRef] [Green Version]
  48. Deepa, P.; Padmalatha, R. Corrosion behaviour of 6063 aluminium alloy in acidic and in alkaline media. Arab. J. Chem. 2017, 10, S2234–S2244. [Google Scholar] [CrossRef] [Green Version]
  49. Zhang, J.; Klasky, M.; Letellier, B.C. The aluminum chemistry and corrosion in alkaline solutions. J. Nucl. Mater. 2009, 384, 175–189. [Google Scholar] [CrossRef]
  50. Martin, U.; Bosch, J.; Ress, J.; Bastidas, D.M. Long-term stability and electronic properties of passive film of lean-duplex stainless steel reinforcements in chloride containing mortar. Constr. Build. Mater. 2021, 291, 123319. [Google Scholar] [CrossRef]
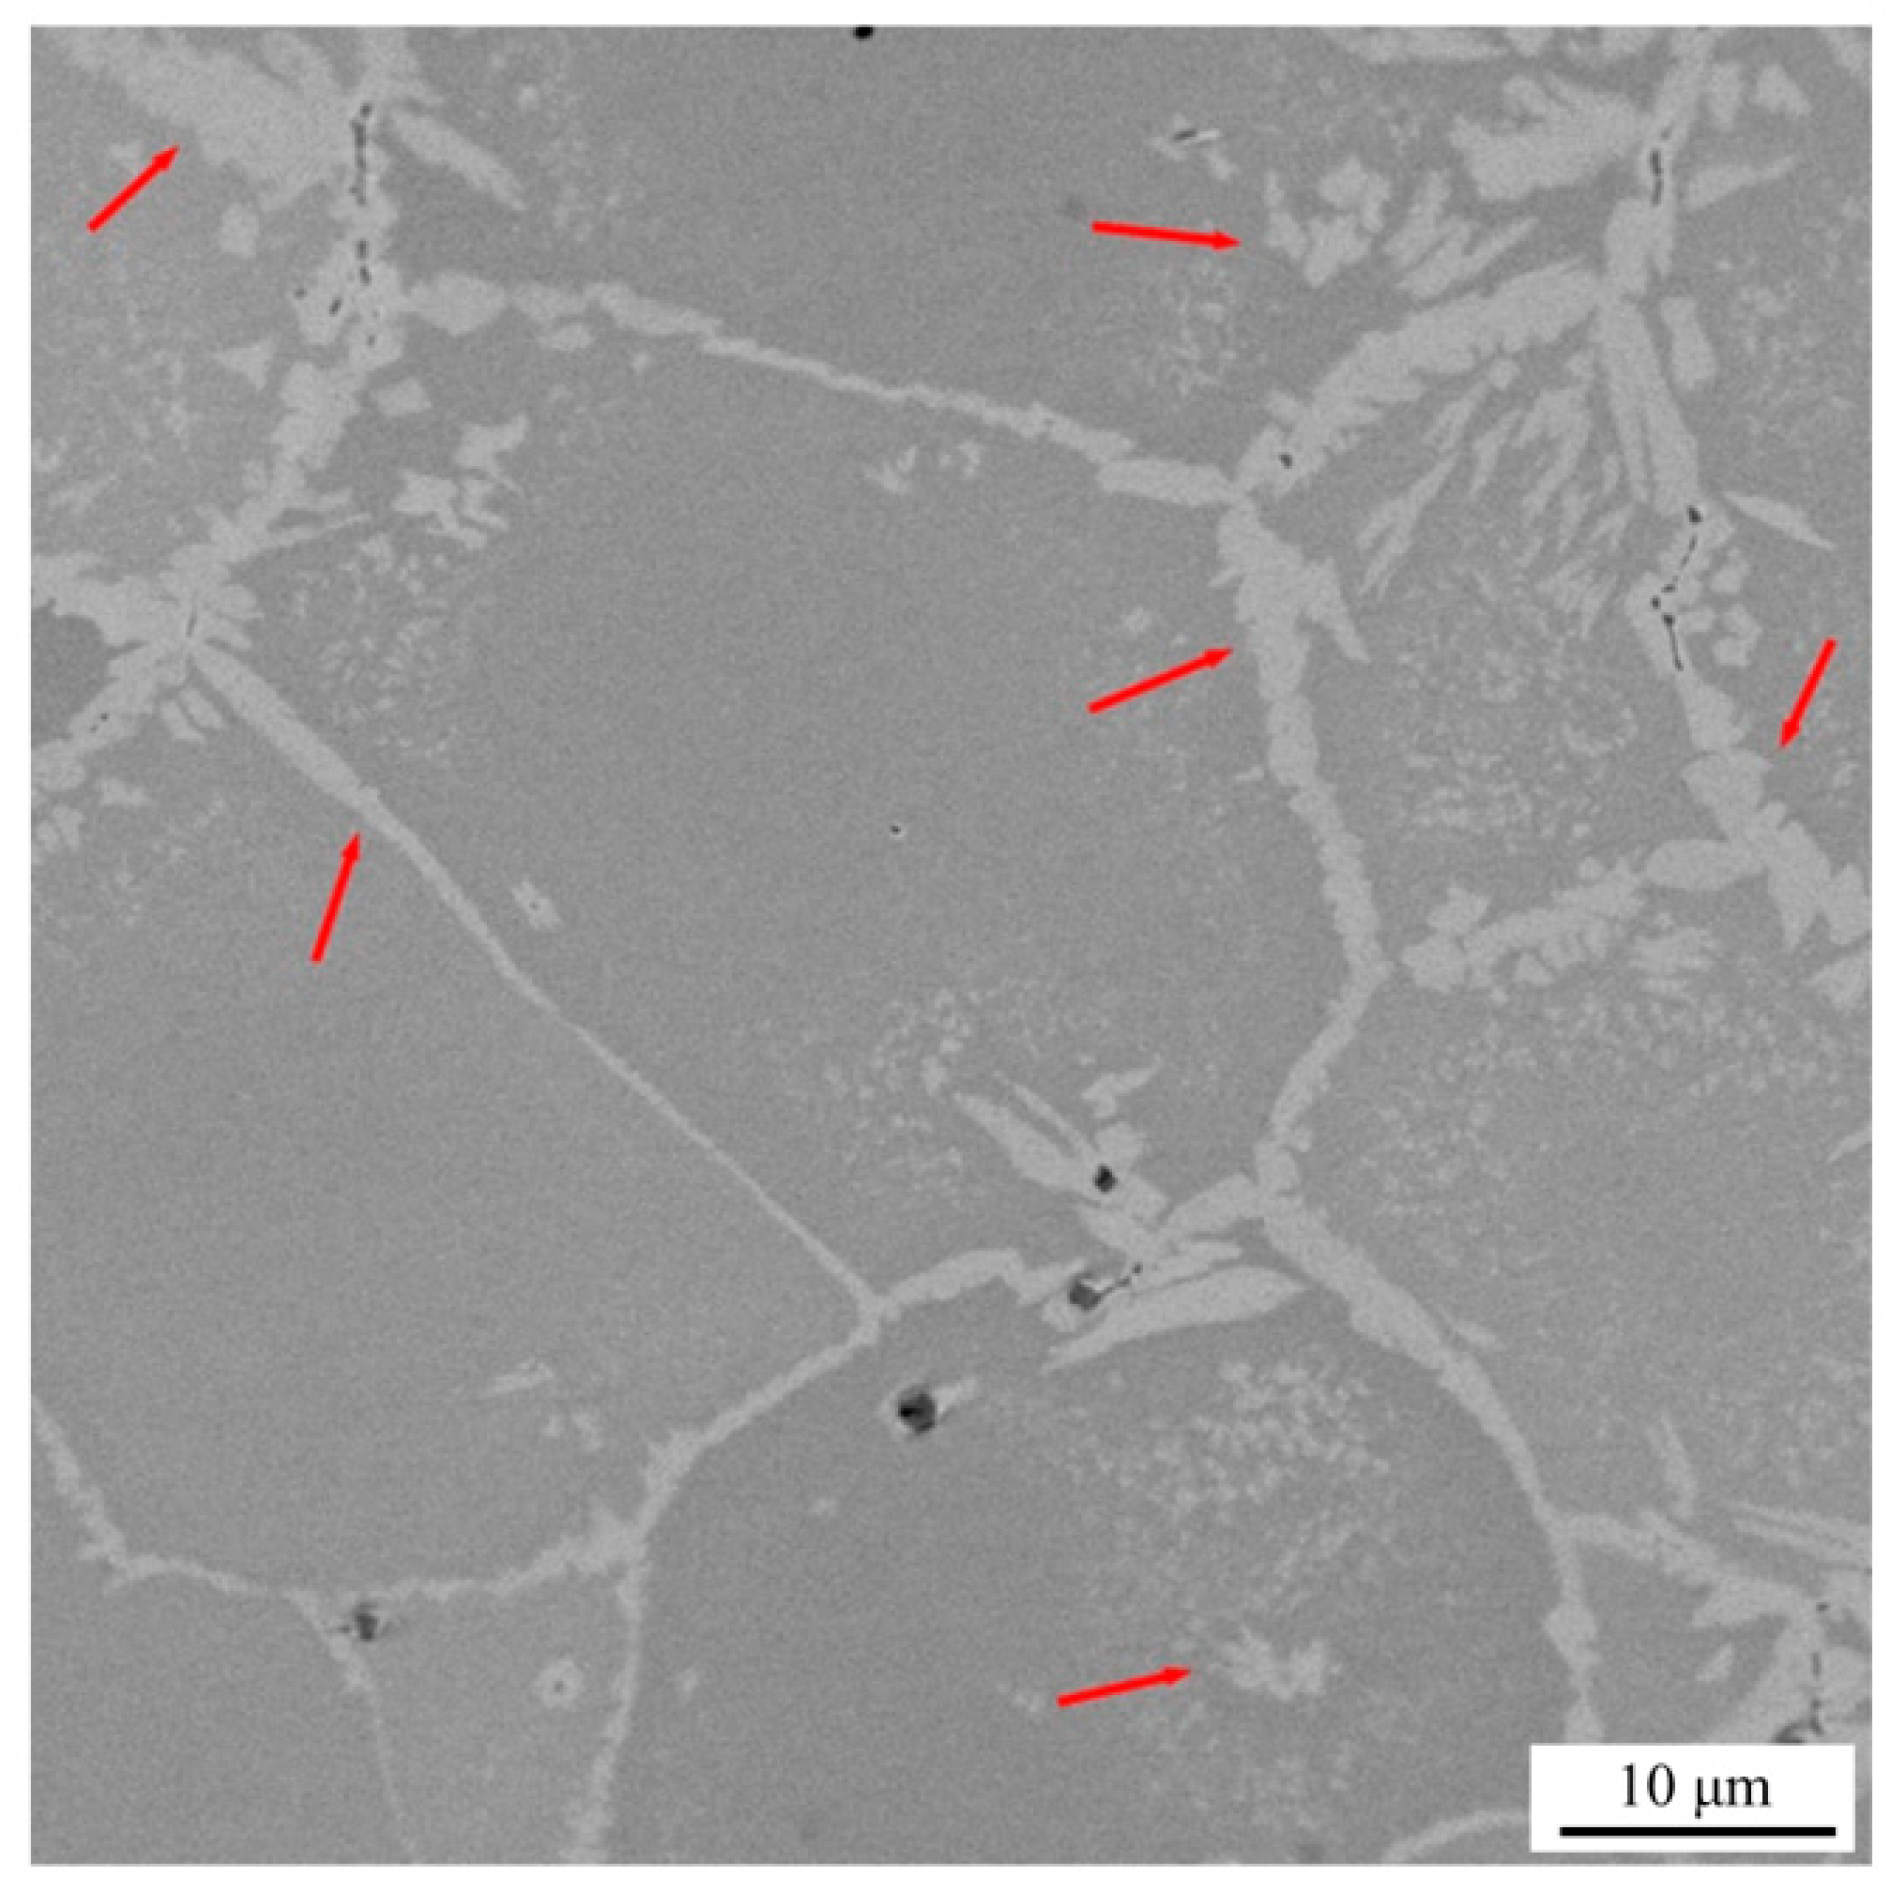
Figure 1. Microstructure of the as-cast Al10Cr30Fe25Mn30Ti5 HEA. Red arrows label some examples of the secondary phases present in the alloy.
Metals 12 01736 g001
Figure 2. Microstructure of the forged Al10Cr30Fe25Mn30Ti5 HEA at 1200 °C. (a) Optical micrograph showing a general view of the microstructure, and (b) SEM image, in which can be distinguished small secondary phases, particles (labeled by red arrows) along the grain boundaries of BCC grains.
Metals 12 01736 g002
Figure 3. HEXRD patterns for the as-cast and annealed Al10Cr30Fe25Mn30Ti5 HEA at 1200 °C, and subsequently quenched in water.
Metals 12 01736 g003
Figure 4. CPP curves for Al10Cr30Fe25Mn30Ti5 HEA in acidic 0.5 M H2SO4 (pH 0.3), neutral 0.6 M NaCl (pH 7), and alkaline 2.5 M NaOH (pH 14) electrolyte solutions.
Metals 12 01736 g004
Figure 5. EIS plots for Al10Cr30Fe25Mn30Ti5 HEA in acidic 0.5 M H2SO4 (pH 0.3), neutral 0.6 M NaCl (pH 7), and alkaline 2.5 M NaOH (pH 14) electrolyte solutions: (a) Nyquist plots, and (b) Bode plots.
Metals 12 01736 g005
Figure 6. EEC with two time constants proposed to model the EIS response of the Al10Cr30Fe25Mn30Ti5 HEA.
Metals 12 01736 g006
Figure 7. XPS showing depth profiles and elemental analysis (at.%) for Al10Cr30Fe25Mn30Ti5 HEA in 2.5 M NaOH: (a) C, O, Cr, Fe, and (b) Mn, Ti, Al, and Cl.
Metals 12 01736 g007
Figure 8. XPS showing depth profiles and elemental analysis (at.%) for Al10Cr30Fe25Mn30Ti5 HEA in 0.6 M NaCl: (a) C, O, Cr, Fe, and (b) Mn, Ti, Al, and Cl.
Metals 12 01736 g008
Figure 9. XPS showing depth profiles and elemental analysis (at.%) for Al10Cr30Fe25Mn30Ti5 HEA in 0.5 M H2SO4: (a) C, O, Cr, Fe, and (b) Mn, Ti, Al, and Cl.
Metals 12 01736 g009
Figure 10. EDX analysis of Al10Cr30Fe25Mn30Ti5 HEA in 2.5 M NaOH after the CPP: (a) SEM micrograph ×120, (b) EDX mapping, and EDX mapping of (c) Mn, (d) Cr, (e) Fe, (f) O, (g) Ti, and (h) Al.
Metals 12 01736 g010
Figure 11. EDX analysis of Al10Cr30Fe25Mn30Ti5 HEA in 2.5 M NaOH after the CPP: (a) SEM micrograph ×120, and EDX elemental composition of: (b) region A, (c) region B, and (d) region C.
Metals 12 01736 g011
Table 1. Elemental composition of Al10Cr30Fe25Mn30Ti5 HEA.
ElementCrMnFeAlTi
Content (at.%)303025105
Content (wt.%)30.532.227.35.34.7
Table 2. Average composition (at.%) of the as-cast Al10Cr30Fe25Mn30Ti5 HEA and compositions of the matrix and secondary phase particles.
RegionCrMnFeAlTi
Average 31.528.925.68.06.0
Matrix38.125.823.68.34.2
Secondary phase24.329.628.86.111.1
Table 3. Electrochemical parameters from the CPP curves for Al10Cr30Fe25Mn30Ti5 HEA in acidic 0.5 M H2SO4 (pH 0.3), neutral 0.6 M NaCl (pH 7), and alkaline 2.5 M NaOH (pH 14) electrolyte solutions.
Electrolyte
Solution
Ecorr
mVSCE
icorr
A/cm2
βa
mV/dec
βc
mV/dec
B
mV
αaαc
2.5 M NaOH−3311.61 × 10−5592–6011290.1650.121
0.6 M NaCl−1984.10 × 10−7549–5731210.0470.045
0.5 M H2SO4−1731.36 × 10−8719–8201610.0360.031
A standard deviation below 10% for all values was obtained.
Table 4. Corrosion properties comparison between different HEAs.
HEAElectrolyte
Solution
Ecorr
(mVSCE)
icorr
(A/cm2)
ǀZǀ
(Ω cm2)
Ref.
Al10Cr30Fe25Mn30Ti52.5 M NaOH−3311.61 × 10−53.21 × 10³This work
0.6 M NaCl−1984.10 × 10−71.26 × 10⁴
0.5 M H2SO4−1731.36 × 10−82.25 × 10⁵
Cr18Mn18Fe21Co21Ni220.05 M H2SO4−3208.0 × 10−61.25 × 10⁵[25]
Cr19.6Ni20.2Co21.3Mn20.5Fe18.40.4 M Na2CO3
1 M NaHCO3
−2503.0 × 10−61.0 × 10⁵[26]
CoCrFeNi0.6 M NaCl−1302.11 × 10−61.2 × 10⁴[16]
Cu 5 wt.% + AlCoCrFeNi−19712.97 × 10−61.7 × 10³
FeCrSiNb thin film0.6 M NaCl+608.66 × 10⁻¹⁰[27]
0.6 M H2SO4+3601.22 × 10−8
Co21Cr19Fe20Mn19Ni200.5 M H2SO4−36657.9 × 10−61.0 × 10³[28]
Table 5. Fitting EIS parameters for Al10Cr30Fe25Mn30Ti5 HEA exposed to different pH electrolyte solutions at RT.
Electrolyte
Solution
RsRfilmYfilmnfilmRctYdlndlCeff,filmχ2 (*)
Ω cm2kΩ cm2µS/cm2 snfilm kΩ cm2µS/cm2 sndl F/cm2
2.5 M NaOH3.910.523.650.825.35987.620.798.36 × 10−52.69 × 10⁻³
0.6 M NaCl13.441.533.290.8511.3935.010.816.56 × 10−51.91 × 10⁻³
0.5 M H2SO42.482.451.120.93494.289.280.741.54 × 10−51.45 × 10⁻³
* Error < 10% for all values.
Table 6. Hardness and density properties comparison between HEAs.
HEAHardness
(HV)
Density
(g/cm3)
Ref.
Al10Cr30Fe25Mn30Ti56606.84This work
CoCrFeNi676[34]
FeNiCoCrMo10008.86[35]
CoCrFeNi2258.34[16]
Cu 5 wt.% AlCoCrFeNi4007.21
FeCrSiNb thin film1530[27]
CoCrFeMnNiC0.6566.4[36]
Co21Cr19Fe20Mn19Ni203000[28]
Al20Fe20Mg20Ni20Ti2094.54.64[37]
Publisher’s Note: MDPI stays neutral with regard to jurisdictional claims in published maps and institutional affiliations.