Article

Modeling of Abnormal Grain Growth That Considers Anisotropic Grain Boundary Energies by Cellular Automaton Model

1
School of Physics and Materials Science, Nanchang University, Nanchang 330031, China
2
Advanced Equipment and Technology R&D Center, Zhejiang Yiduan Precision Machinery Co., Ltd., Ningbo 315702, China
3
School of Materials Science and Engineering, Tianjin University, Tianjin 300350, China
*
Author to whom correspondence should be addressed.
Metals 2022, 12(10), 1717; https://doi.org/10.3390/met12101717
Submission received: 23 September 2022 / Revised: 9 October 2022 / Accepted: 11 October 2022 / Published: 13 October 2022

Abstract

:
A new cellular automaton (CA) model of abnormal grain growth (AGG) that considers anisotropic grain boundary energies was developed in this paper. The anisotropic grain boundary energy was expressed based on two types of grains, which correspond to two components of different crystallographic orientation in textured materials. The CA model was established by assigning different grain boundary energies and grain-growth-driven mechanisms to four types of grain boundaries formed by two types of grains. The grain boundaries formed by different kinds of grains adopted the lowest energy principle, while the grain boundaries formed by the same kind of grains adopted the curvature-driven mechanism. The morphology calculated by the CA model shows the characteristics of AGG. Then, the Johnson–Mehl–Avrami (JMA) model was fitted to predict the growth kinetics. By analyzing the fitting results, the JMA model is capable of predicting the growth kinetics of AGG. The Avrami exponent p decreases from about 1.5 to 1 with the initial number of Type II grains increasing. The investigation of the Hillert model and grain size distribution further indicates that the microstructure evolution is consistent with AGG. Therefore, the analysis of morphology and kinetics indicates that AGG can be fairly well-simulated by the present CA model.

1. Introduction

The internal cause of grain growth is that the material has the characteristic of self-reducing grain boundary energy, and the external cause is the physical factors that promote the change of grain, such as grain boundary curvature and temperature [1,2,3]. Accordingly, based on the cellular automaton (CA) method, different driving mechanisms for grain growth have been developed, including the curvature-driven mechanism, lowest energy principle, and thermodynamic driving mechanism [4,5,6,7]. However, at present, the CA method mainly simulates grain growth under the condition of an isotropic grain boundary based on the above mechanism. The condition of an isotropic grain boundary assumes that the grain boundary energy and grain boundary mobility of different grain boundaries are equal. In fact, the grain boundary is not in an isotropic condition and there are differences in grain boundary energy, grain boundary mobility, and solute segregation between different grain boundaries [8,9,10,11,12].
In recent years, grain growth under anisotropic conditions has attracted extensive attention. Anisotropic conditions, such as phase transformation and the second phases, are the main factors causing abnormal grain growth (AGG). For example, Dake et al. reported that AGG appears to be intimately tied to the alpha-to-gamma phase transformation just above 900 °C in nanocrystalline materials [13]. Kotan et al. found that with the increase in temperature, the appearance of the fcc γ-phase could be used to explain AGG in a nanocrystalline Fe91Ni8Zr1 alloy [14]. In addition, some scholars studied AGG caused by the second phases in many materials, such as Cu, Zn, and HEAs [15,16,17], which is a very important method to produce bimodal grains. In contrast with the mixed grains, which seriously weaken the mechanical performance of the part, the bimodal grains could be beneficial to optimize strength and ductility due to the combination of smaller and larger grains [18]. Therefore, it is of great significance to control AGG for regulating material properties. Whether it is the phase transformation or the second phases, these conditions affect the grain growth by acting on the grain boundary energy and grain boundary mobility.
For single-phase materials, anisotropic grain boundary energy and grain boundary mobility are the main factors affecting grain growth. However, on the one hand, anisotropic grain boundary is difficult to be fully described by analytical methods, since a general grain boundary requires as many as five degrees of freedom to define the energy and mobility [19]. On the other hand, it is difficult to carry out in situ physical experiments to study the microstructure evolution characteristics during grain growth under anisotropic conditions. Therefore, the computer simulation has become a powerful tool to verify the results of grain growth and explore new hypotheses. For example, Srolovitz et al. [20] expressed anisotropic grain boundary energy by assuming that there are two types of grains in the microstructure—one with a high probability of grain growth and the other with a low probability of grain growth—and Monte Carlo (MC) was applied to simulate AGG that considers anisotropic grain boundary energies. Grest et al. [19] assumed that grain boundary energy is a function of grain orientation, so different grain orientations in the microstructure lead to different grain boundary energies. The MC model was developed based on this assumption. It was found that with the increase in anisotropic grain boundary energy, the grain size distribution became wider and the grain growth index decreased from 0.42 to 0.25. Rollett et al. [21] described anisotropic grain boundary energy by assigning a higher energy to boundaries between like types compared to boundaries between grains of unlike types. For this case, AGG only occurred for an energy ratio greater than 2 and then the wetting of the matrix by AGG occurred. Although the above research can be used as a reference for how to express anisotropic grain boundary energy, some inherent defects of the MC method seriously limit its popularization and application in the study of grain growth under anisotropic conditions. On the one hand, the MC method is usually based on the lowest energy principle, which makes it difficult to study the grain growth driven by curvature and thermodynamic activation. On the other hand, the MC method has strong randomness, that is, the possible orientation of one location needs to be randomly selected from other locations and whether a new orientation can finally be accepted is related to the random number of that location. This strong randomness seriously affects the final calculation results, such as nucleation being inconsistent with the actual situation and calculation efficiency reduction [22,23,24].
Compared to the MC method, the CA model is not only more flexible in simulating different physical phenomena but also more effective in calculation, which can reveal the mechanism of grain growth and accurately display grain morphology, distribution, and size. Therefore, it has great potential in simulating AGG. However, so far, even though there are some studies showing the effects of isotropic grain boundary energies on normal grain growth [25,26,27,28], it is rather limited to AGG with anisotropic grain boundary energy based on the CA model [29,30]. Therefore, the CA model, which can be used to investigate the influences of anisotropic grain boundary energy on AGG, needs to be further studied.
In this work, a new CA model was developed to simulate AGG with anisotropic grain boundary energies based on the curvature-driven mechanism and the lowest energy principle. The anisotropic grain boundary energy was manifested by two distinct types of grains and the morphology and growth kinetics were clarified to substantiate the accuracy of the model. A detailed description of the CA model including the transition rules and the basic physical metallurgical principles are presented in this paper.

2. CA Model for AGG

The CA model of AGG that considers anisotropic grain boundary energies involves the expression of anisotropic grain boundary energy and the formulation of state transition rules in accordance with the physical mechanism.
In Rollett’s study [21], anisotropic grain boundary energy was described based on two types of grains (Type I and Type II) corresponding to two components of different crystallographic orientations in textured materials. Two kinds of grains formed four kinds of grain boundaries, which were the Type I-Type I, Type I-Type II, Type II -Type I and Type II-Type II boundaries. To study the kinetics of AGG, Type II-Type II boundaries were assumed to have low energy, while other boundaries had high energy.
Square lattices of 500 Δ x × 500 Δ y are used for the following simulations and Δ x = Δ y = 1   μm . Every cell has three state variables: one orientation variable, one grain type variable and one grain boundary variable. The grain boundary variable distinguishes between different grains. The orientation variable and the grain type variable are uniform inside a grain. The periodic boundary condition simulates the infinite space. The von Neumann neighborhood with the nearest neighbor sites is adopted in the simulation model, as shown in Figure 1. The cellular automaton step (CAS) measures time in the CA model. The temperature was assumed to be constant, so the effect of the change in temperature on the transition probability was neglected. Based on the reasonable assumption stated above, the state transition rules that consider the curvature-driven mechanism and the lowest energy principle were established.
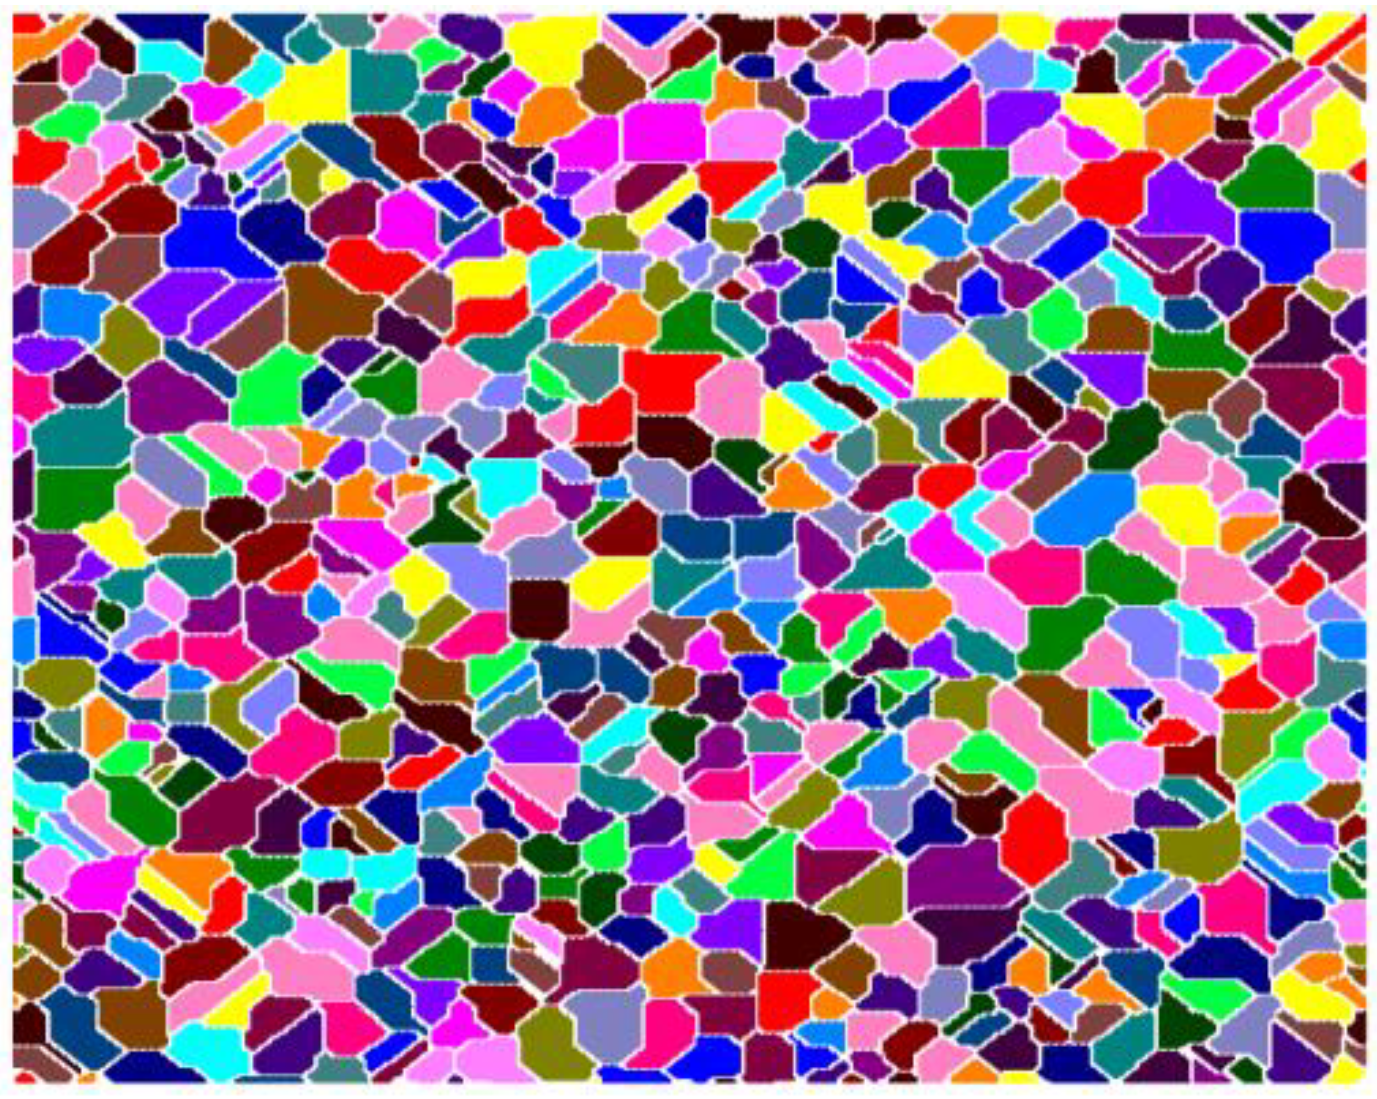
(1) The first step of the CA model is to classify the grains. The simulations were performed with 638 grains and each grain had a different and unique orientation, as shown in Figure 2, and Parameter C was established to distinguish between Type I and Type II orientations. Parameter C can be regarded as distinguishing between different texture orientations. Given that the orientation at the ith site is S i , if S i C , then the grain is Type II and the value of the grain type variable is set to 2. On the other hand, if S i > C , the grain is Type I and the grain type value is 1. Because the orientation values are continuously distributed from 1 to 638, the C value is equal to the number of Type II grains.
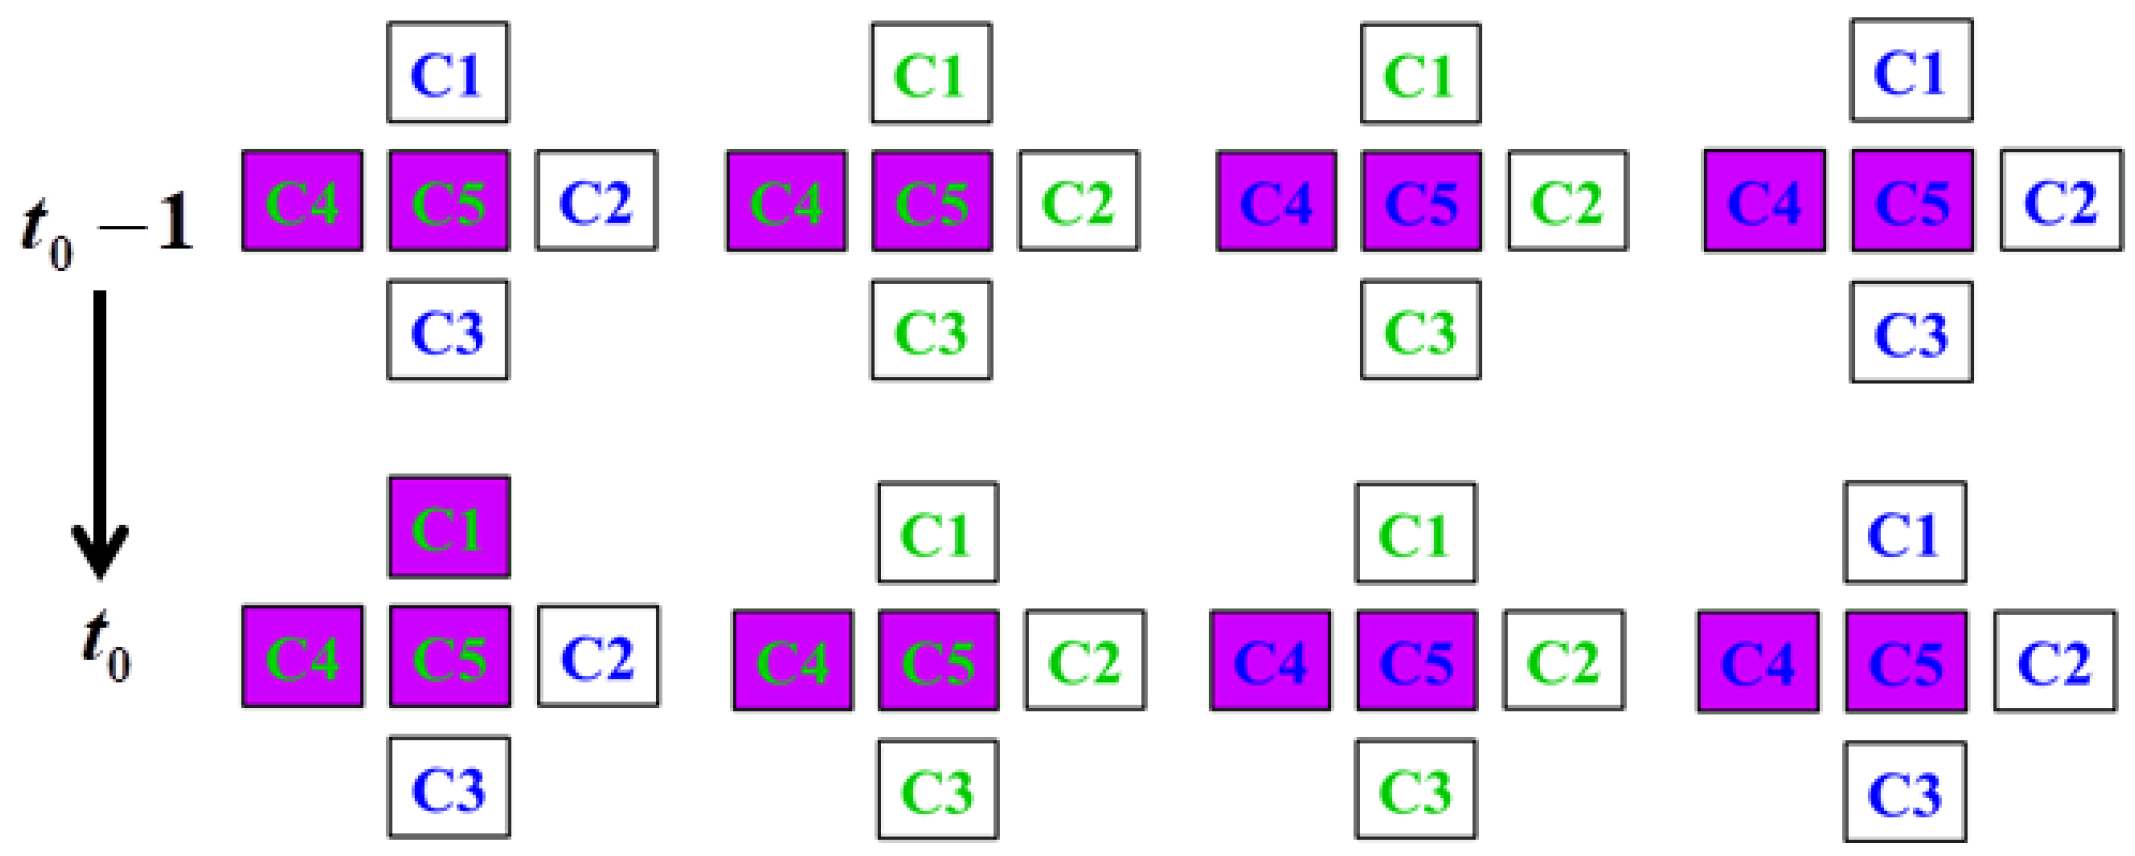
(2) The second step of the CA model is to distinguish between different types of grain boundaries and then affect the movement of grain boundaries. As the first step determines the grain type of the center cell, then the grain type of the neighbor cell determines the type of grain boundary. For example, if the grain type value of the center cell C5 is 2, check the type value of the cells C1, C2, C3, and C4. If the value is 1, then the Type II-Type I boundary is formed. Otherwise, the Type II-Type II grain boundary is formed. The energetics that describes the interaction between cells is defined in Equation (1). S i is the orientation of the site i while S j is the orientation of the site j , which is one of the neighbors of site i . J 1 and J 2 are positive constants such that J 1 > J 2 ; the summation of j is over the M nearest neighbors of the ith site. According to the lowest energy principle, the cell C5, whose type value is 2, expands its state to the neighbor, whose grain type value is 1. Then, the Type II-Type I boundary is transformed to the Type II-Type II boundary, which leads to a decrease in interfacial energy. The transformation from the Type II-Type II boundary to the Type II-Type I boundary is impossible due to the increase in interfacial energy caused by this transformation. The Type I-Type II boundary does not change to the Type I-Type I boundary because the interfacial energy of such a transformation remains unchanged, and vice versa. A detailed explanation of the movement of different types of grain boundaries is shown in Figure 3. Therefore, Type II grains can engulf Type I grains, while Type I grains cannot consume Type II grains. It is reasonable to deduce that Type II grains may grow abnormally.
E = J 2 j M 1 δ S i S j S i C     and     S j C T y p e   II T y p e   II J 1 j M 1 δ S i S j S i > C     and     S j > C T y p e   I T y p e   I S i > C     and     S j C T y p e   I T y p e   II S i C     and     S j > C T y p e   II T y p e   I
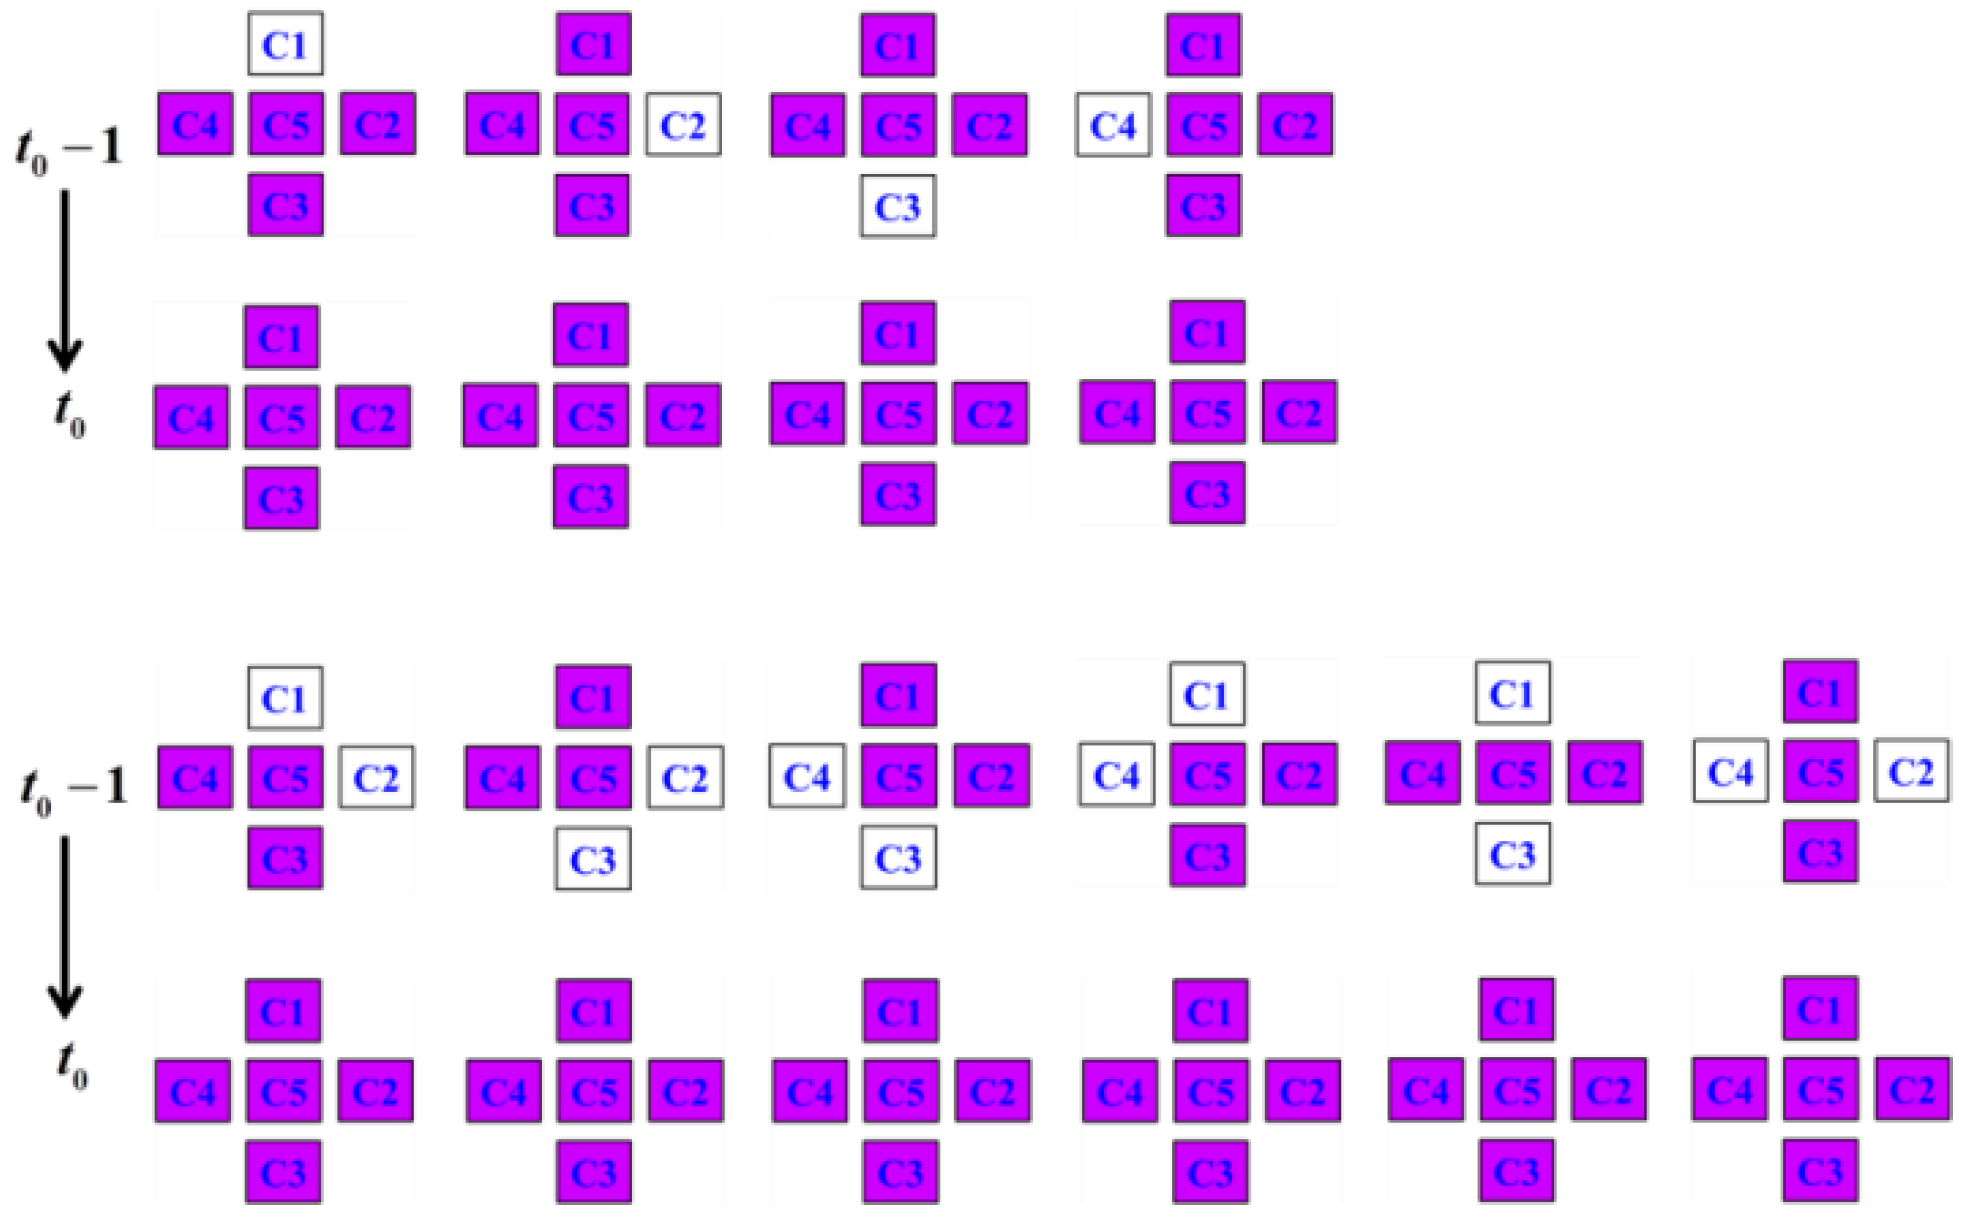
(3) The third step of the CA model influences the movement of the Type I-Type I and Type II-Type II boundaries. For example, if the type value of cells C5 and C1 is 1, which forms the Type I-Type I boundary, then the number of the same orientation as the cell C5 in the cells C1, C2, C3, and C4 is counted. If the number is not less than 2, which is a critical value, the state of the neighbor cells transforms to that of cell C5. On the one hand, it can be explained that if the number is three, the curvature-driven mechanism provides the driving force of grain growth as shown in Figure 4. On the other hand, two is half of four neighbors, which guarantees that the like types of grain grow uniformly in all directions. Similarly, the third step of the CA model also works with the condition that the boundary type is Type II-Type II.

3. Results and Discussion

In order to verify the accuracy of the CA model and reveal the microstructure evolution of AGG, it is very necessary to analyze the morphology, growth kinetics, local kinetics, and grain size distribution.

3.1. Morphology

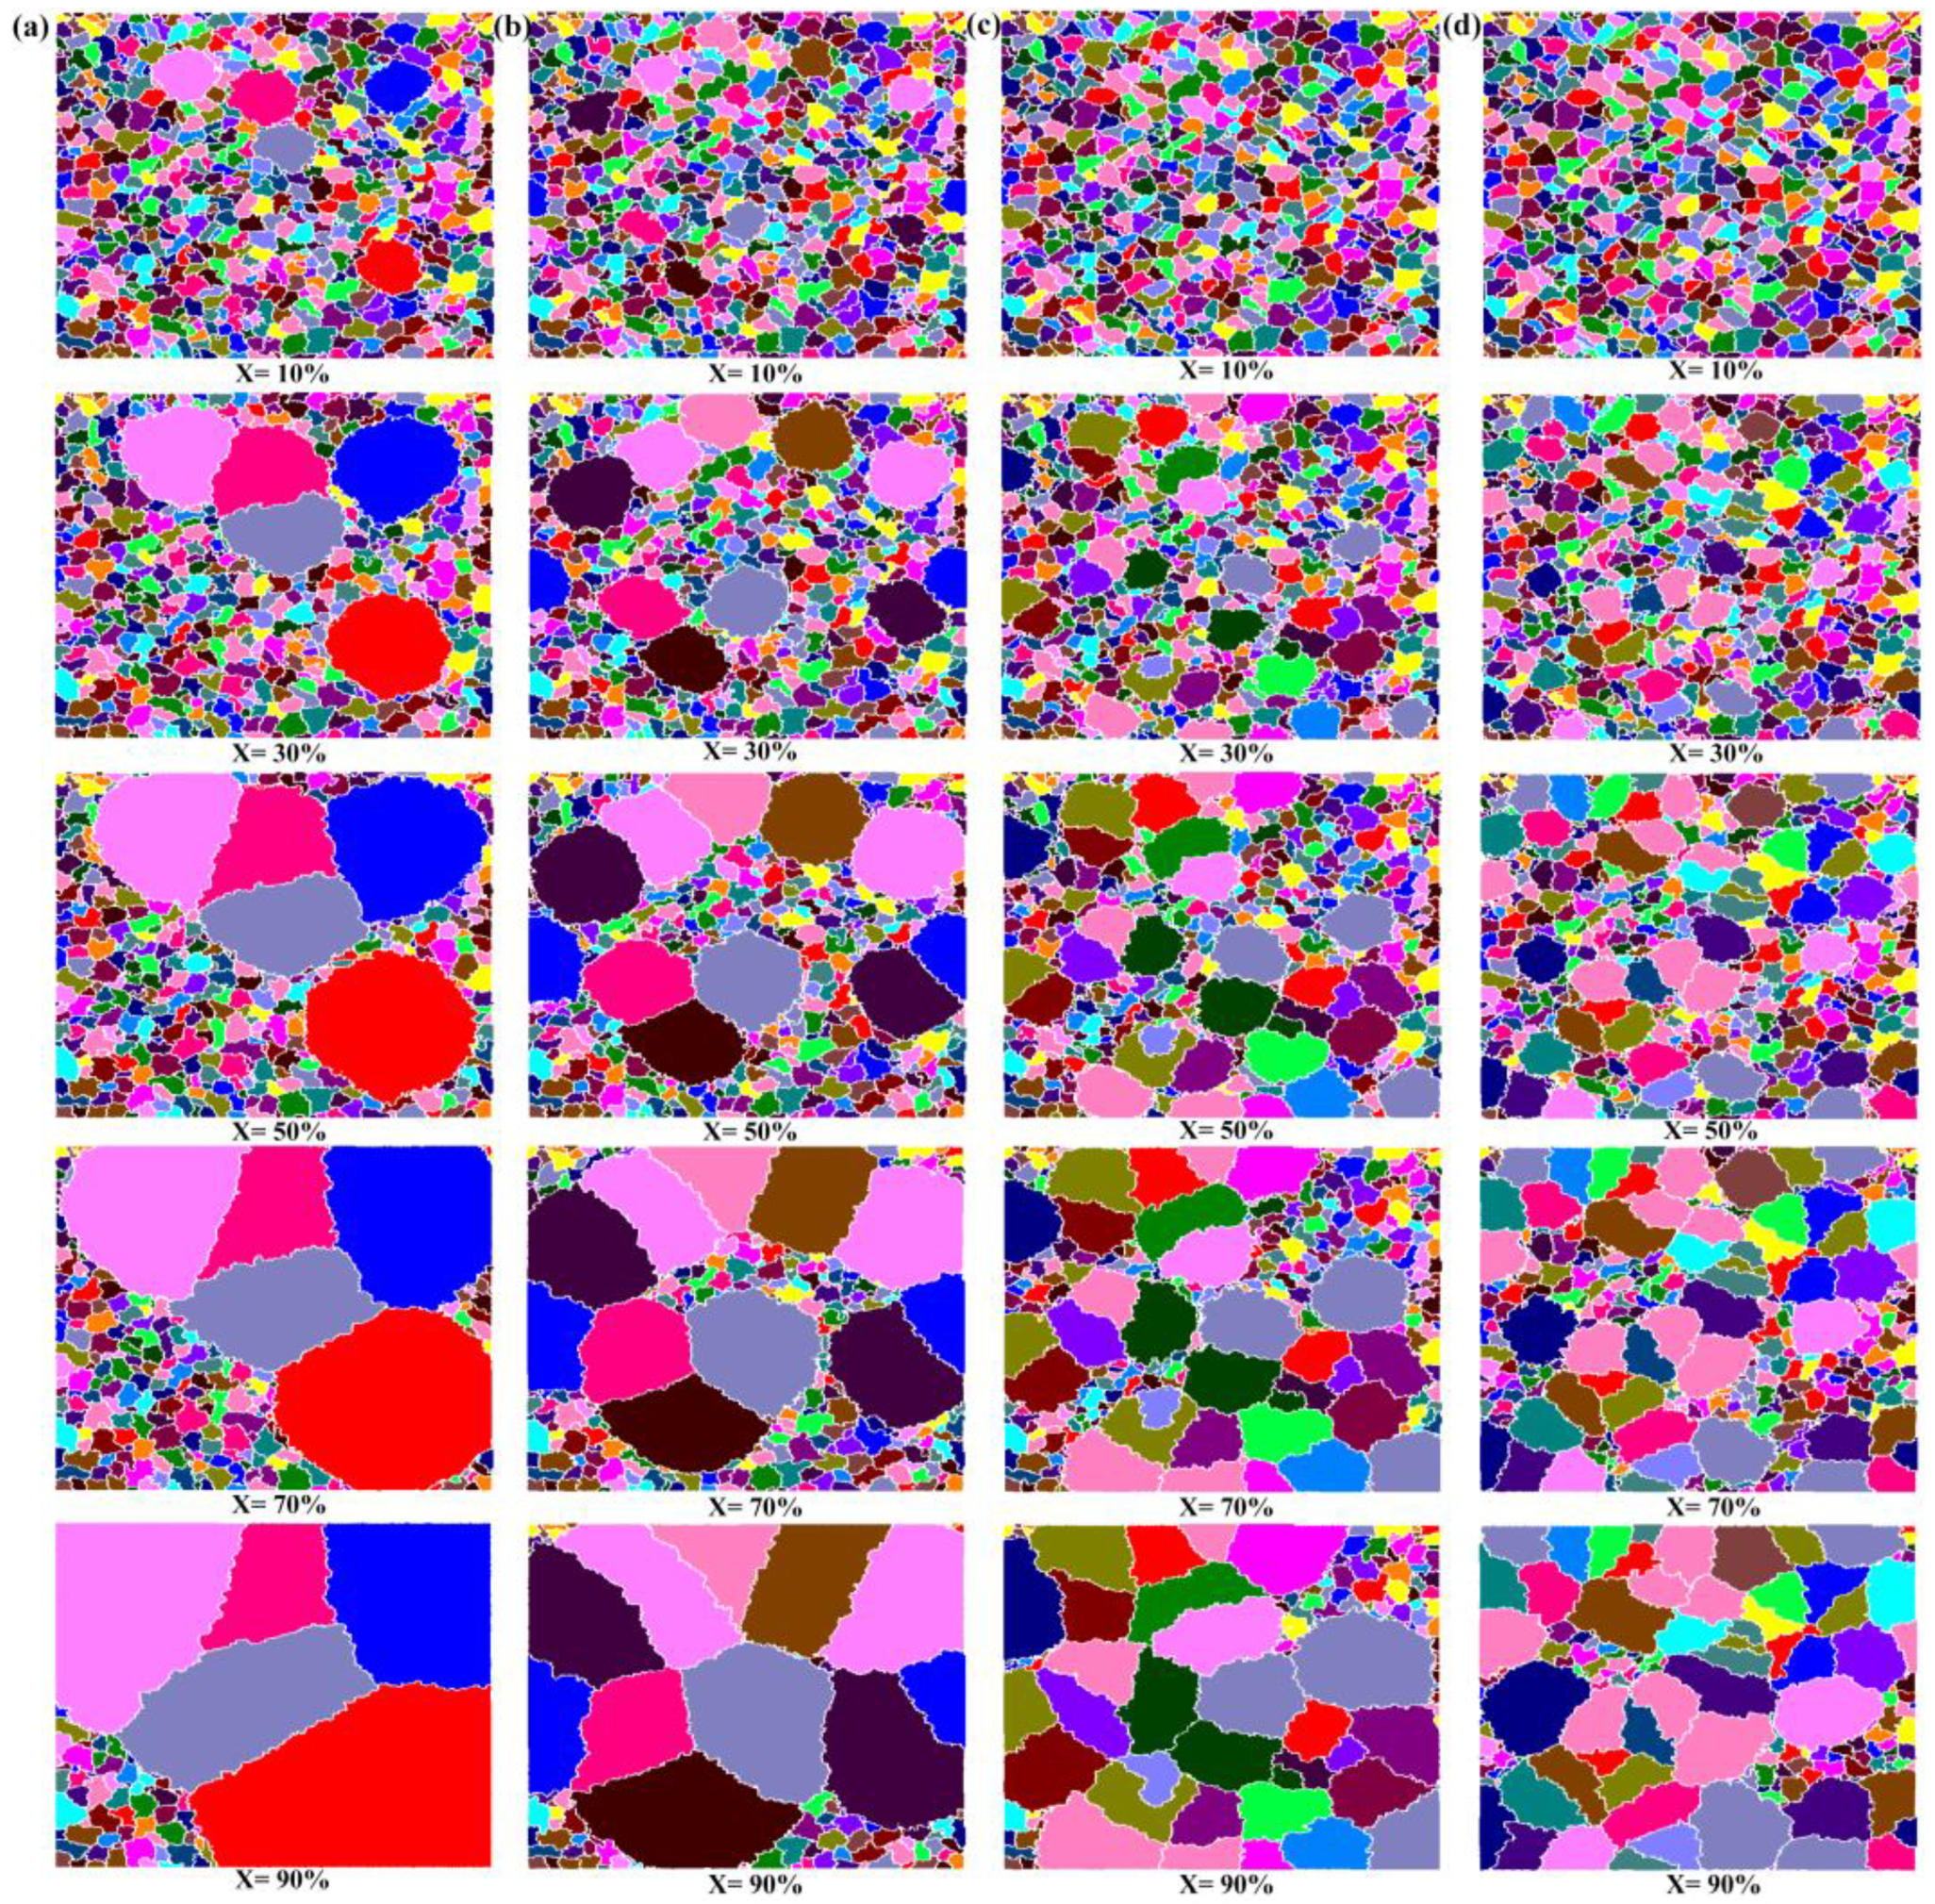
The grain was supposed to be circular. The average grain area was represented by the number of cells in it. The radius of the grain was calculated according to the average grain area. In the CA model, because the orientation of grains is unique and different from each other, there is no AGG caused by the coalescence between grains with the same orientation. The AGG of one large Type II grain was simulated to determine the nature of the growth of the secondary grains, as shown in Figure 5. With the simulation time increasing, the large grain dramatically grows in size. The relationship between the radius of the Type II grain and time is plotted in Figure 6. It can be seen that the radius linearly increases with time and this phenomenon has also been reported by many other studies [20,21]. To make the simulation more realistic, different simulation conditions when the value of Parameter C is 5, 10, 29, and 47 were performed, which results in 5, 10, 29, and 47 initially present Type II grains, respectively, as shown in Figure 7. The grown grains have the polygonal shape with zigzag rather than smooth grain boundary, which is consistent with the grain growth mechanism. At the initial stage of growth, abnormally grown grains are dispersed in the structure. With the increase in simulation time, the abnormal grains consume the adjacent small matrix grain and the AGG occurs by way of secondary recrystallization [31]. There is no AGG caused by the wetting of the matrix and grain coalescence reported by Rollett [21]. To explain, the CA model can consider the curvature-driven mechanism and avoid grain coalescence while the MC model cannot. With the increase in the number of the initial Type II grains, the proportion of the Type II-Type I boundary decreases while the proportion of the Type II-Type II boundary increases, which was also substantiated by Enomoto [32]. Moreover, the mean grain size becomes smaller while the number of Type II grains increases.

3.2. Growth Kinetics

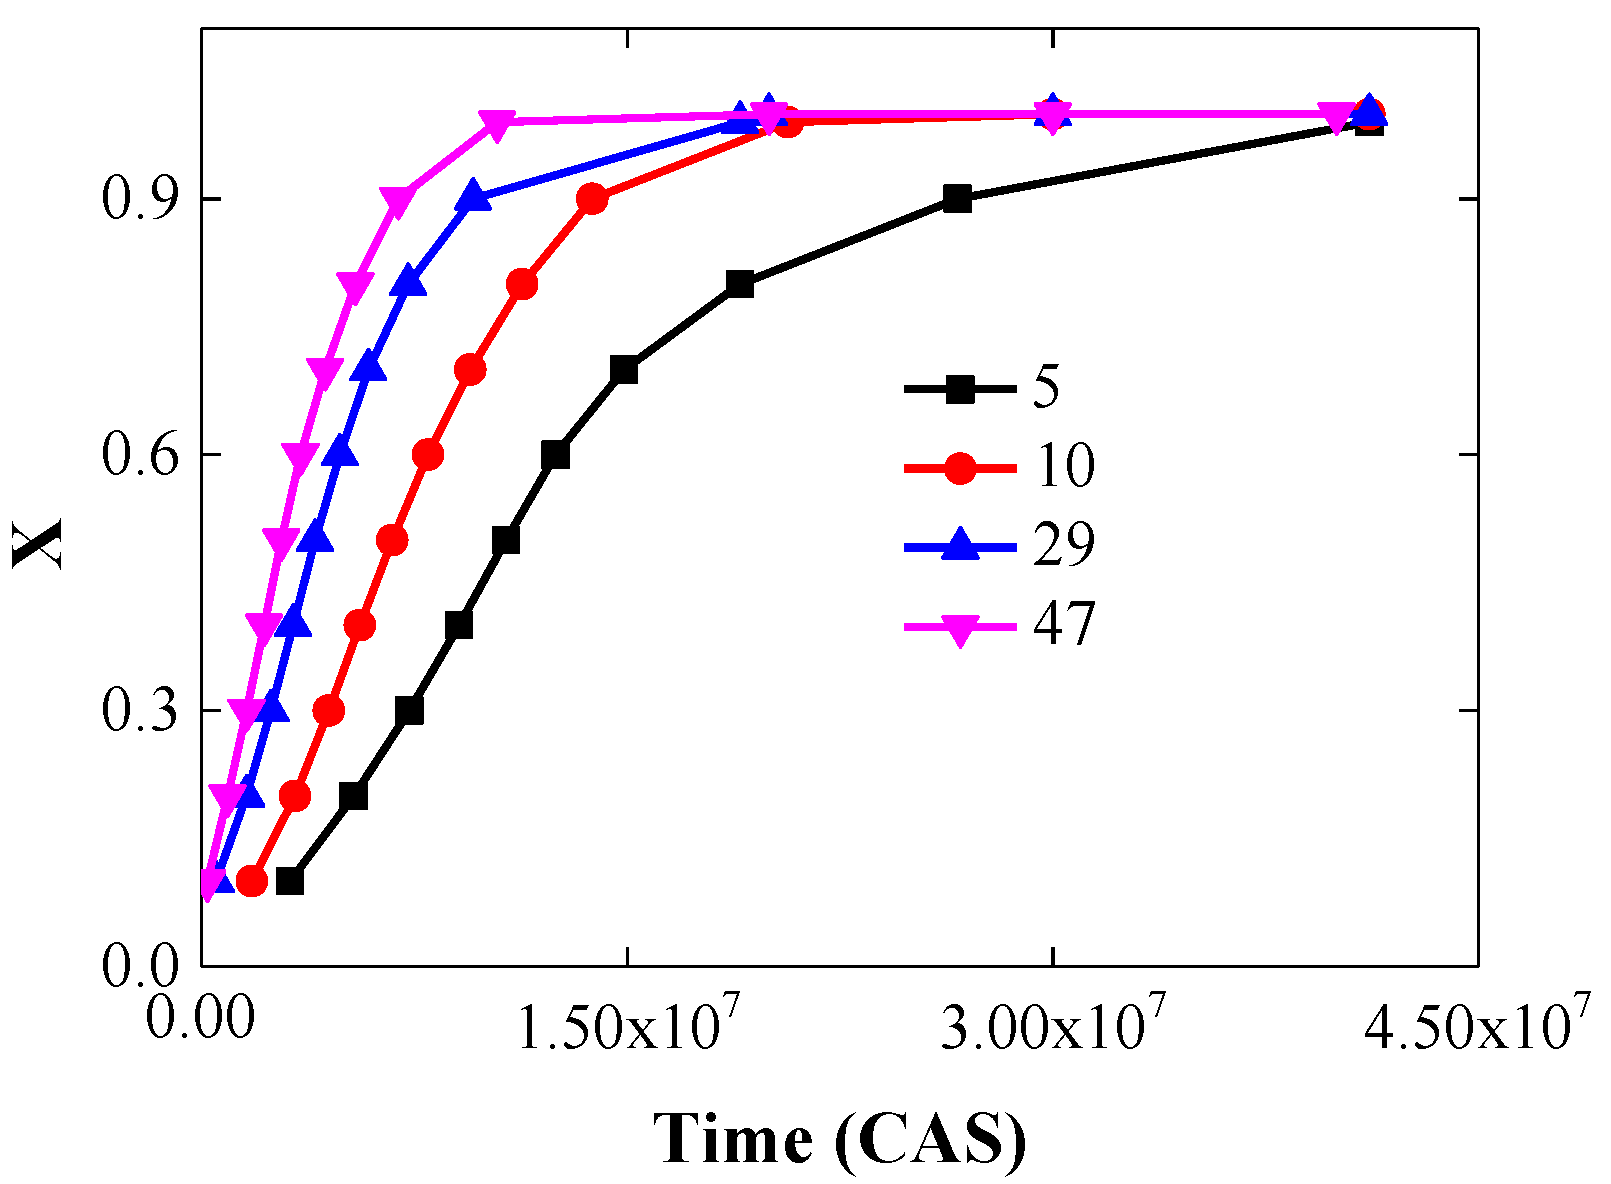
The relationship between the fractional area of secondary grains and time is plotted in Figure 8. It can be seen that, for a given number of the secondary grains at the start of the simulation, the grain growth rate is very fast, but with the extension of time, the grain growth rate slows down. In the later stage of simulation, the grain growth rate is very slow. To explain, the migration of the Type II-Type I boundary dominates the grain growth in the initial stage. However, with time increasing, the Type II-Type II boundaries determine the grain growth rate, which moves relatively slowly. For a given time, the area fraction of the abnormal grains increases with the increasing number of Type II grains. The Johnson–Mehl–Avrami (JMA) model is used to analyze the growth kinetics, as shown below [20,21].
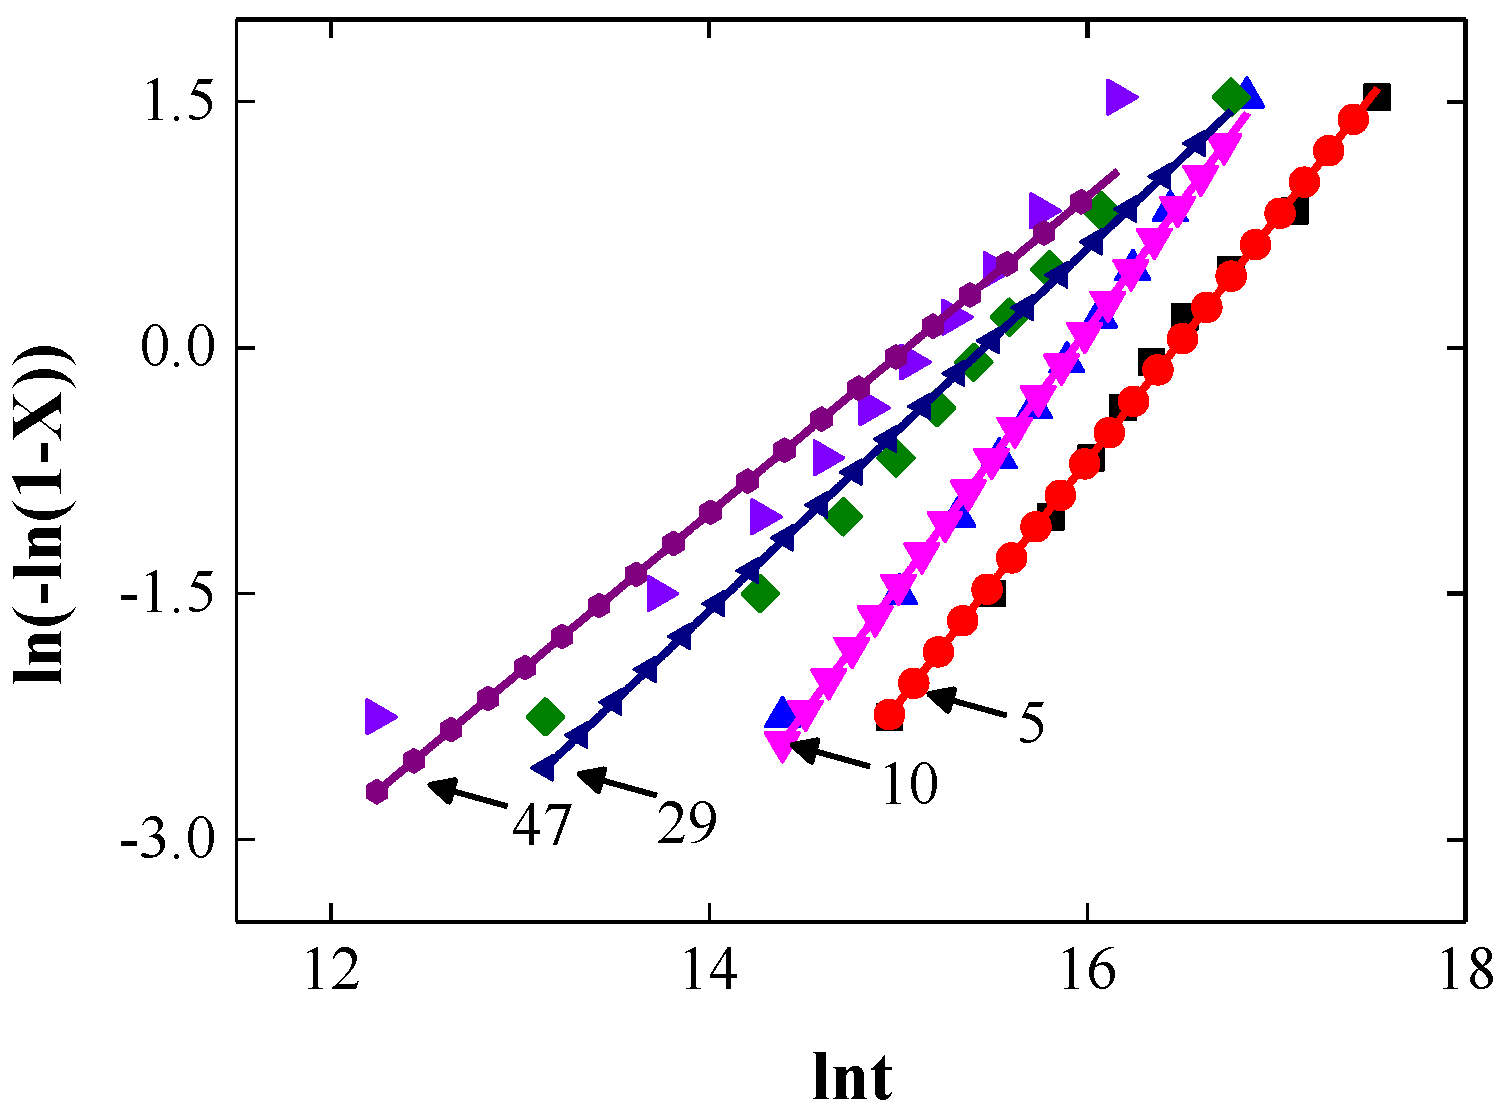
X = 1 b exp α t p
where X and t represent the area fraction and CAS, respectively. The value of b is obtained by substituting X = 0 for t = 0 and b is 1. The Avrami exponent p is obtained by calculating the slope of l n l n 1 X vs. l n t . Figure 9 shows the JMA plot of the simulation results with the different numbers of initially present Type II grains. It can be found that the JMA model can adequately predict the growth kinetics. The value of Avrami exponent p varies with the number of Type II grains. For the smaller number of Type II grains, p is about 1.5 while for the larger number of Type II grains, p is about 1. Grest et al. [19] also reported that the growth exponent decreases as the anisotropy is increased.
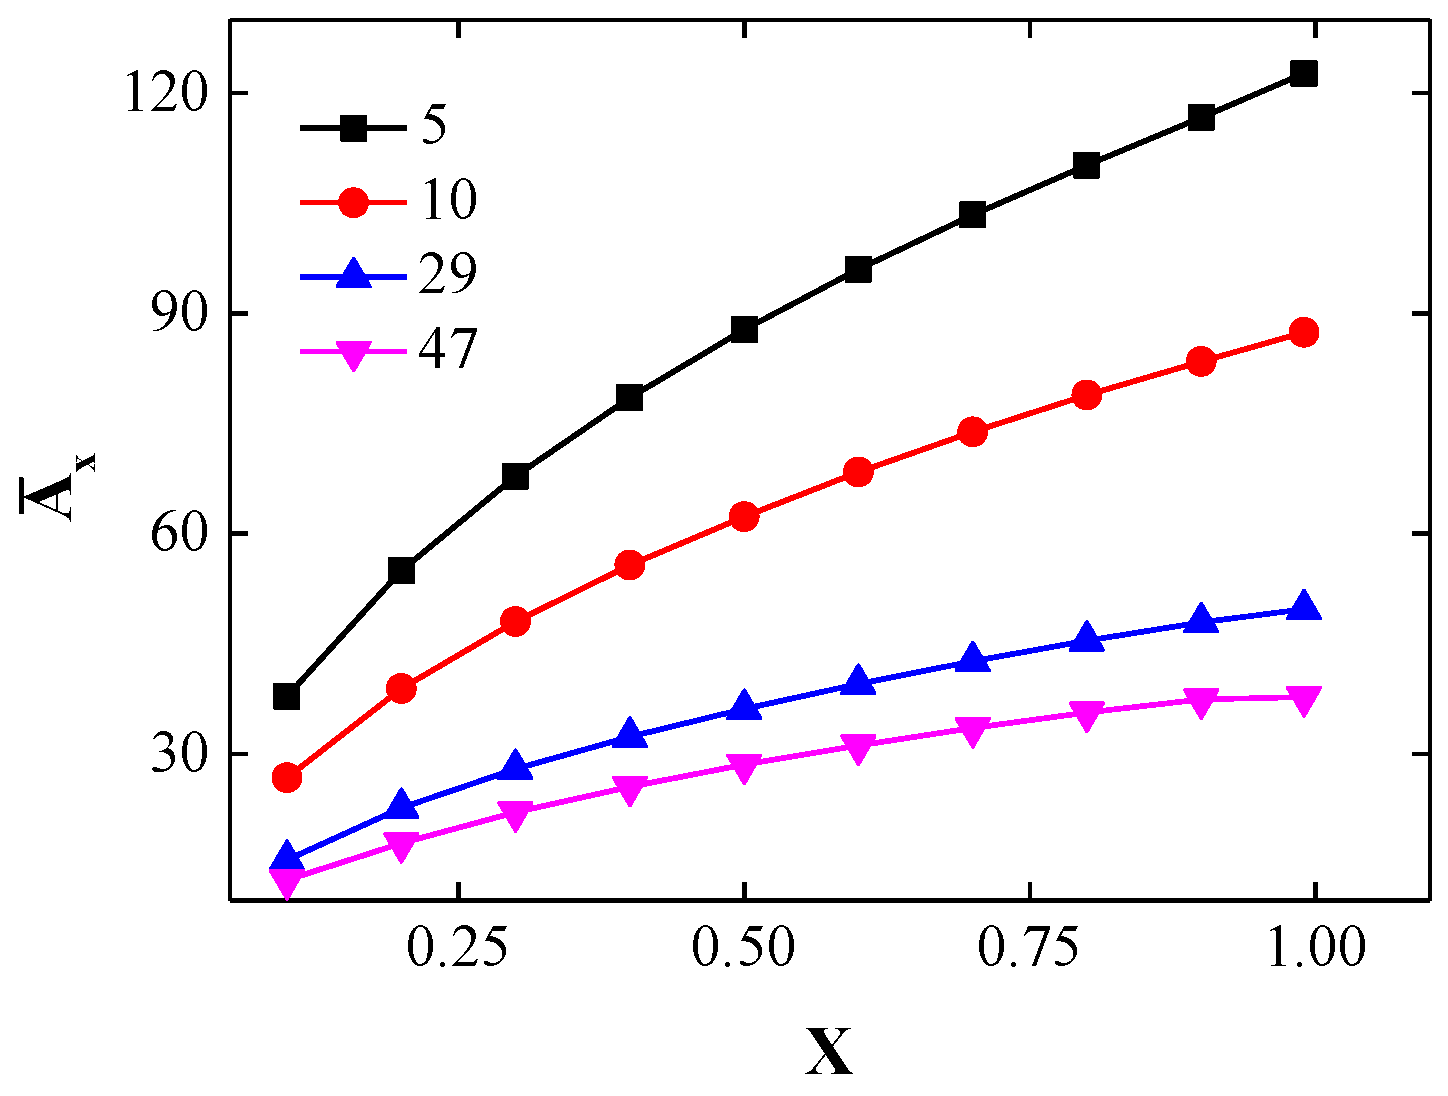
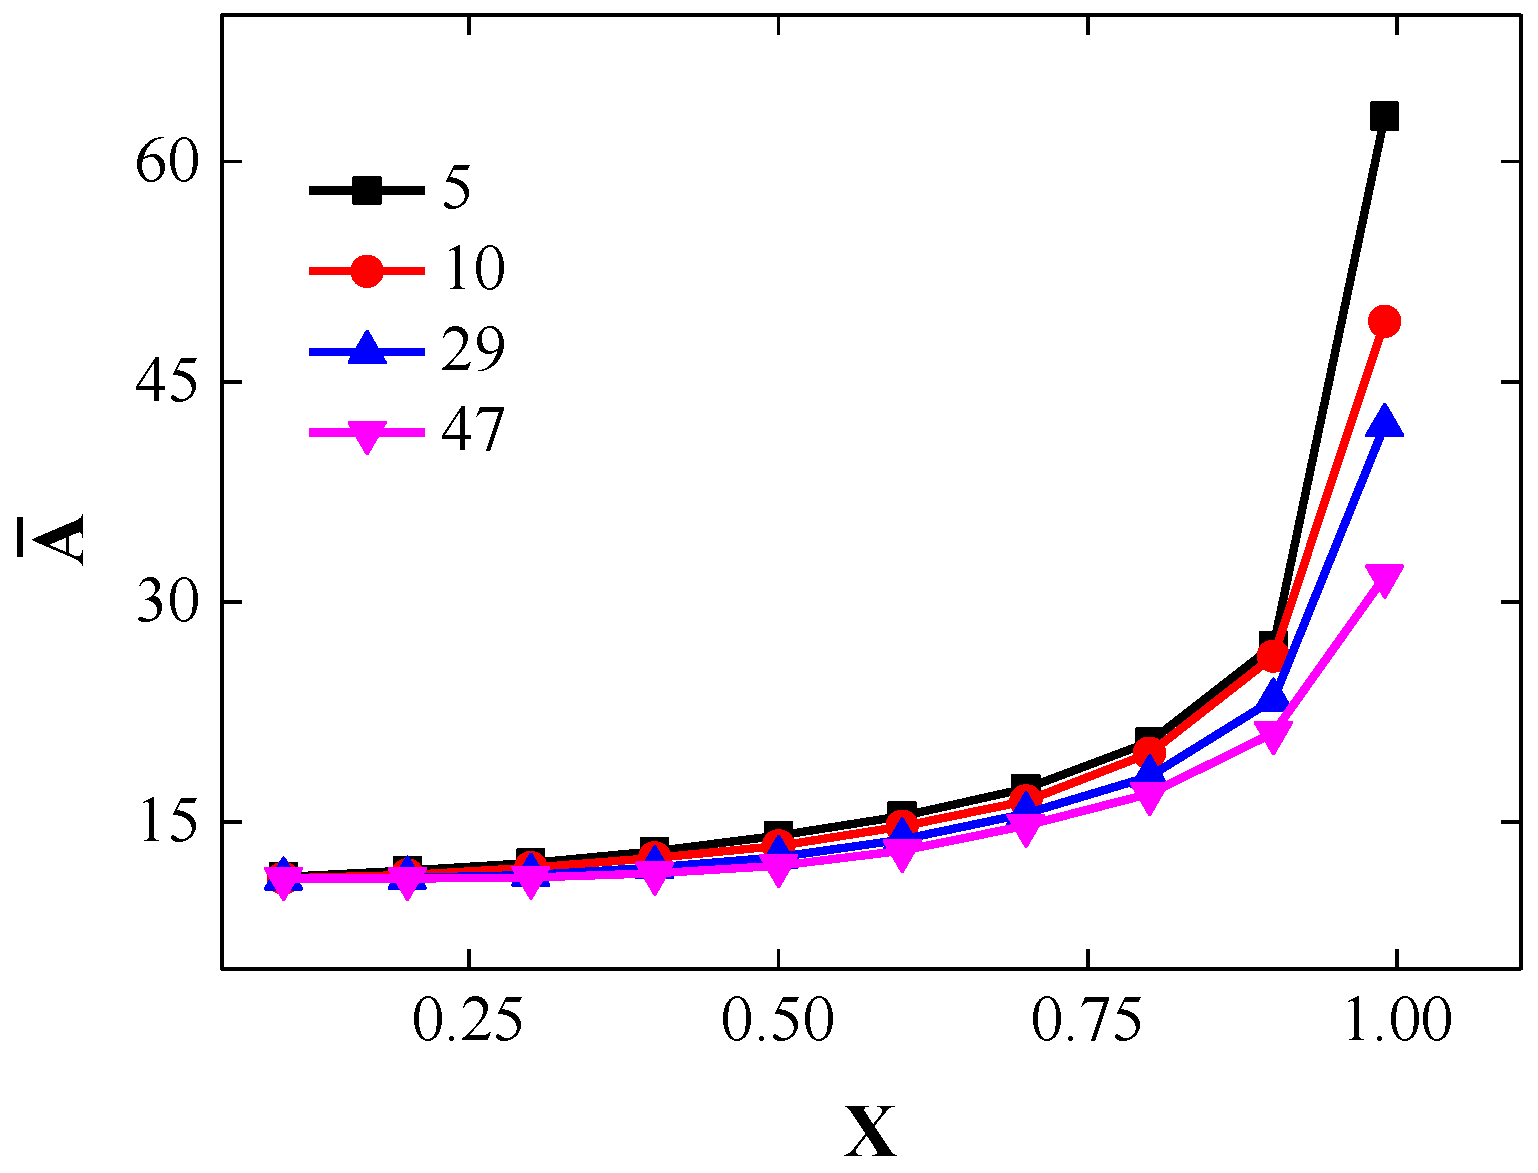
The relationship of the mean grain size of the secondary grains A x ¯ vs. the area fraction of the secondary grains is shown in Figure 10. The mean grain size nonlinearly increases with the area fraction of the secondary grains. Because the number of the secondary grain is the smallest, the mean grain size with five grains is the largest at a given area fraction. Figure 11 shows the plot of the mean grain size of all grains A ¯ vs. the area fraction of the secondary grains. It can be found that both A x ¯ and A ¯ increase with the decrease in the number of Type II grains. When the area fraction of the secondary grains is small, the mean grain size slowly increases. When the area fraction is larger than 70%, the mean grain size rapidly increases. This is because when the area fraction of the secondary grains is low, the small-sized matrix grains account for the majority. However, when the area fraction is high, the large-sized abnormally grown grains account for the majority.

3.3. Local Kinetics

During AGG, the abnormal grains consume the small grains to achieve rapid growth. Therefore, it is necessary to investigate the growth of individual grains with different sizes. Hillert proposed the relationship between the growth rate of an individual grain and its size as shown in Equation (3) [2]. k is a positive coefficient, R is the radius of a given grain, and R a is the average grain radius. The kinetics of individual grains at the different area fractions of 10%, 30%, 50%, 70%, and 90% with 5, 10, 29, and 47 initially present Type II grains is shown in Figure 12. It can be found that most of the grains with radii larger than R a grow while the grains with radii smaller than R a shrink. The number of grains that grow is less while the number of grains that shrink is much more, which indicates that a small number of grains grow abnormally. The proportion of grains with the same average grain size is close to zero, which indicates that the grain size distribution is extreme. The speed of grain growth is at least twice that of grain shrinkage, while the shrinkage rate of grains with different radii is basically the same, so there is no linear relationship between d R / d t and 1 / R 1 / R a , which is obviously different from the normal grain growth [28].
d R d t = k ( 1 R 1 R a )

3.4. Grain Size Distribution

While both A x ¯ and A ¯ have substantial changes, the total grain size distribution is a weighted average of these two types of behaviors. Figure 13 shows some results of the grain size distribution with 47 Type II grains at different area fractions. The grain size distribution first widens and then narrows. It widens because the secondary grains become larger and the Type II-Type I boundary dominates the microstructure evolution. Then, it narrows because the grain size is controlled by relatively uniform secondary grains at the later stage of growth and Type II-Type II boundaries dominate the microstructure evolution. When the secondary grain is 47, the grain size distribution only obeys the logarithmic normal distribution at the initial stage of grain growth. At the area fraction of 10%, there is no grain whose size is not less than 2 times the mean grain size. Meanwhile, the grains with 3 times the size of the mean grain size appear at the area fraction of 50% and those grains disappear at the area fraction of 90%. With the increase in the area fraction of Type II grains, the number of grains smaller than the average grain size rapidly decreases while the number of grains larger than the average grain size increases. From 50% to 90%, the number of grains with a size equal to the average grain size is kept at a very low ratio. Therefore, the grain size distribution indicates that the microstructure is non-uniform, which shows the characteristics of AGG [15,16].

4. Conclusions

A new CA model for AGG that considers anisotropic grain boundary energies was developed in this study. The anisotropic grain boundary energy described here is based on two types of grains corresponding to two components of different crystallographic orientations. The CA model was built by considering the lowest energy principle and using the curvature-driven mechanism. The morphology and growth kinetics were analyzed to substantiate the accuracy of the CA model and reveal the microstructure evolution of AGG. Even though there is no experimental investigation of abnormal grain growth, the presented analysis and conclusions can be supported by other studies as stated in this paper. It is shown that AGG that considers anisotropic grain boundary energies can be well-simulated by the CA model proposed in the paper.
(1)
The anisotropic grain boundary energy is described based on two types of grains (Type I and Type II), which form four kinds of grain boundaries (Type I-Type I, Type I-Type II, Type II-Type I and Type II-Type II boundaries). By using a curvature-driven mechanism for the grain boundaries formed by the same kind of grains and the lowest energy principle for the grain boundaries formed by different kinds of grains, the state transition rules of AGG that considers anisotropic grain boundary energies was established.
(2)
In the CA model, different grains in the system are endued with different and unique orientations and thus grain coalescence is completely avoided. The morphology shows that a few grains consume adjacent small grains to achieve AGG by way of secondary recrystallization.
(3)
The JMA model and Hillert model are used to describe the growth kinetics of grain growth. The Avrami exponent p decreases from 1.5 to 1 with the increase in the initial Type II grains. The analysis based on growth kinetics and grain size distribution is also consistent with the microstructure evolution of AGG, which also substantiates the accuracy of the CA model for AGG.
(4)
Even though the CA model provided in this paper applies Rollett’s model to describe anisotropic grain boundary energy, the previously reported phenomenon of AGG caused by the wetting of the matrix and grain coalescence never occurs. This is mainly due to the difference between the CA model used in this paper and the MC model provided by Rollett in the expression of the grain growth mechanism. In other words, the CA model can consider the curvature-driven mechanism and avoid grain coalescence while the MC model cannot. Therefore, the research results of this paper are also an important supplement to the previous research results regarding AGG.

Author Contributions

L.Y. (Liyan Ye) designed and drafted the manuscript; B.M. revised the manuscript; L.Y. (Liming Yu) performed manuscript review. All authors have read and agreed to the published version of the manuscript.

Funding

This work is supported by key research program in Ningbo city, Zhejiang province (Project number: 2022Z108).

Institutional Review Board Statement

Not applicable.

Informed Consent Statement

Not applicable.

Data Availability Statement

The data used to support the findings of this study are available from the corresponding author upon request.

Conflicts of Interest

The authors declare no conflict of interest.

References

  1. Su, F.Y.; Liu, W.L.; Wen, Z. Three-dimensional cellular automaton simulation of austenite grain growth of Fe-1C-1.5Cr alloy steel. J. Mater. Res. Technol. 2020, 9, 180–187. [Google Scholar]
  2. Hillert, M. On the theory of normal and abnormal grain growth. Acta Metall. 1965, 13, 227–238. [Google Scholar] [CrossRef]
  3. Liu, Y.; Militzer, M.; Perez, M. Phase field modelling of abnormal grain growth. Materials 2019, 12, 4048. [Google Scholar] [CrossRef] [PubMed] [Green Version]
  4. Liu, Y.X.; Ke, Z.J.; Li, R.H.; Song, J.Q.; Ruan, J.J. Study of Grain Growth in a Ni-Based Superalloy by Experiments and Cellular Automaton Model. Materials 2021, 14, 6922. [Google Scholar] [CrossRef]
  5. Wang, L.X.; Fang, G.; Qian, L.Y. Modeling of dynamic recrystallization of Magnesium alloy using cellular automata considering initial topology of grains. Mater. Sci. Eng. A 2017, 711, 268–283. [Google Scholar] [CrossRef]
  6. Chen, F.; Zhu, H.J.; Zhang, H.M.; Cui, Z.S. Mesoscale Modeling of Dynamic Recrystallization: Multilevel Cellular Automaton Simulation Framework. Metall. Mater. Trans. A 2020, 51, 1286–1303. [Google Scholar] [CrossRef]
  7. Zhu, H.J.; Chen, F.; Zhang, H.M.; Cui, Z.S. Review on modeling and simulation of microstructure evolution during dynamic recrystallization using cellular automaton method. Sci. China Technol. Sci. 2020, 63, 357–396. [Google Scholar] [CrossRef]
  8. Hu, B.; Zhang, H.Q.; Zhang, J.; Yang, M.J.; Du, Y.; Zhao, D.D. Progress in interfacial thermodynamics and grain boundary complexion diagram. Acta Met. Sin Eng. 2021, 57, 1199–1214. [Google Scholar]
  9. Li, Y.J.; Fu, R.D.; Li, Y.; Peng, Y.; Liu, H.J. Abnormal grain growth in the heat affected zone of friction stir welded joint of 32Mn-7Cr-1Mo-0.3N steel during post-weld heat treatment. Metals 2018, 8, 254. [Google Scholar] [CrossRef] [Green Version]
  10. Hallberg, H.; Bulatov, V.V. Modeling of grain growth under fully anisotropic grain boundary energy. Model. Simul. Mater. Sci. Eng. 2019, 27, 045002. [Google Scholar] [CrossRef]
  11. Hu, J.F.; Wang, X.H.; Zhang, J.Z.; Luo, J.; Zhang, Z.J.; Shen, Z.J. A general mechanism of grain growth-I. Theory. J. Mater. 2021, 7, 1007. [Google Scholar] [CrossRef]
  12. Salama, H.; Kundin, J.; Shchyglo, O.; Mohles, V.; Marquardt, K.; Steinbach, I. Role of inclination dependence of grain boundary energy on the microstructure evolution during grain growth. Acta Mater. 2020, 188, 641–651. [Google Scholar] [CrossRef]
  13. Dake, J.M.; Krill, C.E. Abnormal grain growth in nanocrystalline materials. Mater. Sci. Forum. 2013, 753, 317–320. [Google Scholar] [CrossRef]
  14. Kotan, H.; Darling, K.A.; Saber, M. An in situ experimental study of grain growth in a nanocrystalline Fe91Ni8Zr1 alloy. J. Mater. Sci. 2013, 48, 2251–2257. [Google Scholar] [CrossRef] [Green Version]
  15. Sonnweber-Ribic, P.; Gruber, A.P.; Dehm, G.; Strunk, H.P.; Arzt, E. Kinetics and driving forces of abnormal grain growth in thin Cu films. Acta Mater. 2012, 60, 2397–2406. [Google Scholar] [CrossRef]
  16. Bednarczyk, W.; Kawalko, J.; Rutkowski, B.; Watroba, M.; Gao, N.; Starink, M.J.; Bala, P.; Langdon, T.G. Abnormal grain growth in a Zn-0.8Ag alloy after processing by high-pressure torsion. Acta Mater. 2021, 207, 116667. [Google Scholar] [CrossRef]
  17. Tekin, M.; Polat, G.; Kotan, H. An investigation of abnormal grain growth in Zr doped CoCrFeNi HEAs through in-situ formed oxide phases. Intermetallics 2022, 146, 107588. [Google Scholar] [CrossRef]
  18. Yadollahpour, M.; Hosseini-Toudeshky, H. Materials properties and failure prediction of ultrafine grained materials with bimodal grain size distribution. Eng. Comput. 2017, 33, 125–136. [Google Scholar] [CrossRef]
  19. Grest, G.S.; Srolovitz, D.J.; Anderson, M.P. Computer simulation of grain growth-IV. anisotropic grain boundary energies. Acta Metall. 1985, 33, 509–520. [Google Scholar] [CrossRef]
  20. Srolovitz, D.J.; Grest, G.S.; Anderson, M.P. Computer simulation of grain growth-V. abnormal grain growth. Acta Metall. 1985, 33, 2233. [Google Scholar] [CrossRef]
  21. Rollett, A.D.; Srolovitz, D.J.; Anderson, M.P. Simulation and theory of abnormal grain growth-anisotropic grain boundary energies and mobilities. Acta Metall. 1989, 37, 1227–1240. [Google Scholar] [CrossRef] [Green Version]
  22. Yu, Q.; Esche, S.K. Modeling of grain growth kinetics with Read-Shockley grain boundary energy by a modified Monte Carlo algorithm. Mater. Lett. 2002, 56, 47–52. [Google Scholar] [CrossRef]
  23. Yu, Q.; Esche, S.K. A new perspective on the normal grain growth exponent obtained in two-dimensional Monte Carlo simulations. Modelling Simul. Mater. Sci. Eng. 2003, 11, 859–861. [Google Scholar]
  24. Miodownik, M.A. A review of microstructural computer models used to simulate grain growth and recrystallisation in aluminium alloys. J. Light Met. 2002, 2, 125–135. [Google Scholar] [CrossRef]
  25. Jin, Z.Y.; Yu, D.H.; Wu, X.T. Simulation of grain growth behavior of hot-extruded pure magnesium by cellular automata. J. Plast. Eng. 2016, 23, 209–215. [Google Scholar]
  26. Kroc, J.; Paidar, V. Modelling of the effect of triple junctions on grain boundary migration by a cellular automaton. J. Phys. IV 2001, 11, 85–92. [Google Scholar] [CrossRef]
  27. Xiong, F.Y.; Huang, C.Y.; Kafka, O.L.; Lian, Y.P.; Yan, W.T.; Chen, M.J.; Fang, D.N. Grain growth prediction in selective electron beam melting of Ti-6Al-4V with a cellular automaton method. Mater. Des. 2020, 199, 109410. [Google Scholar] [CrossRef]
  28. He, Y.Z.; Ding, H.L.; Liu, L.F.; Shin, K.S. Computer simulation of 2D grain growth using a cellular automata model based on the lowest energy principle. Mater. Sci. Eng. C 2006, 429, 236–246. [Google Scholar] [CrossRef]
  29. Janssens, K. An introductory review of cellular automata modeling of moving grain boundaries in polycrystalline materials. Math. Comput. Simul. 2010, 7, 1361–1381. [Google Scholar] [CrossRef]
  30. Li, X.; Zhou, Q.; Chen, M.H.; Wang, X.F. Cellular automata simulation for grain growth based on anisotropic grain boundary mobility and grain boundary energy. Mater. Mech. Eng. 2012, 36, 82–87. [Google Scholar] [CrossRef]
  31. Tripathy, H.; Rai, A.K.; Hajra, R.N.; Raju, S.; Saibaba, S. Modelling the role of nucleation on recrystallization kinetics: A cellular automata approach. AIP Conf. Proc. 2016, 1731, 030009. [Google Scholar]
  32. Enomoto, M.; Kamiya, M.; Nagai, T. Computer simulation of two-dimensional grain growth with anisotropic grain boundary energy and mobility by vertex model. Mater. Sci. Forum. 1996, 204, 71–82. [Google Scholar] [CrossRef]
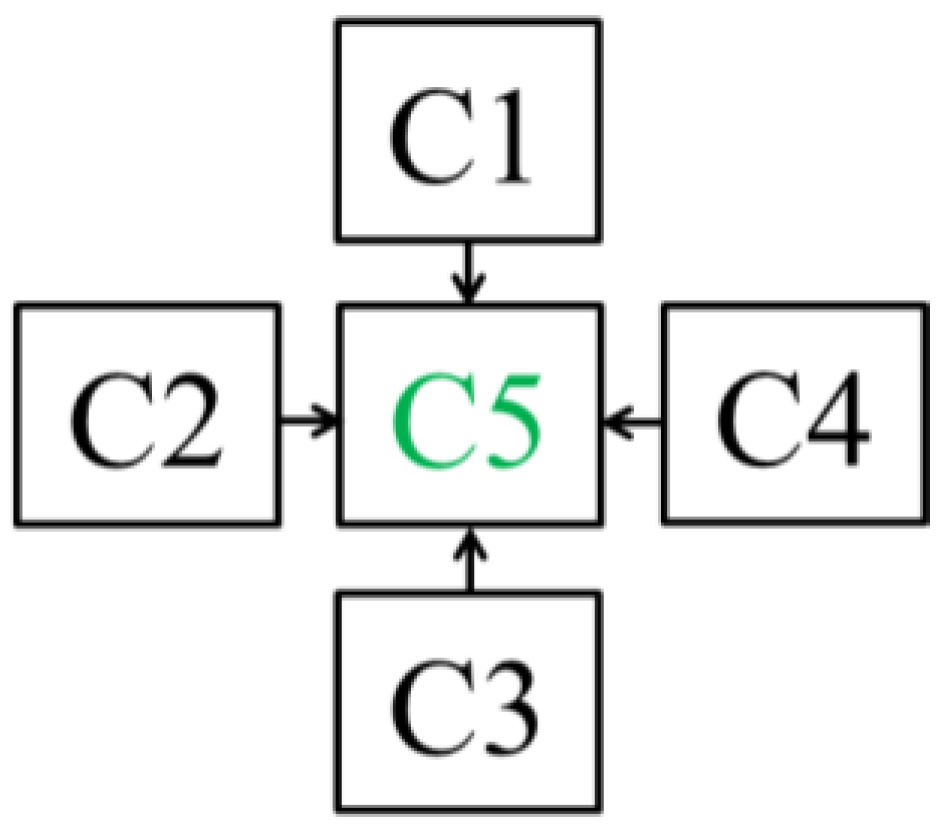
Figure 1. Example of the von Neumann neighborhood considering the nearest neighbors ( C5 with the green color is the center cell, C1, C2, C3, and C4 are the nearest neighbors).
Metals 12 01717 g001
Figure 2. The initial microstructure for AGG.
Metals 12 01717 g002
Figure 3. The movement of different types of grain boundaries according to the second step of the CA model.
Metals 12 01717 g003
Figure 4. Explaining the third step of the CA model for Type I-Type I boundary considering the curvature-driven mechanism.
Metals 12 01717 g004
Figure 5. Microstructure evolution with a single abnormal grain at different CASs.
Metals 12 01717 g005
Figure 6. The linear relationship between the radius of the secondary grain and time.
Metals 12 01717 g006
Figure 7. AGG at different area fractions with different numbers of Type II grains: (a) 5, (b) 10, (c) 29, and (d) 47.
Metals 12 01717 g007
Figure 8. The area fraction vs. time.
Metals 12 01717 g008
Figure 9. Fitting curves of l n l n 1 X vs. l n t .
Metals 12 01717 g009
Figure 10. Plot of A x ¯ vs. the area fraction of the Type II grains.
Metals 12 01717 g010
Figure 11. Plot of A ¯ vs. the area fraction of the Type II grains.
Metals 12 01717 g011
Figure 12. Kinetics of individual grains during AGG. The number of original datapoints are more than ten thousand. In order to clearly display the results without affecting the accuracy, some points are skipped.
Metals 12 01717 g012
Figure 13. Grain size distribution with initial 47 Type II grains at different area fractions: (a) 10%, (b) 30%, (c) 50%, (d) 70%, and (e) 90%.
Metals 12 01717 g013
Publisher’s Note: MDPI stays neutral with regard to jurisdictional claims in published maps and institutional affiliations.