Article

Corrosion and Electrochemical Properties of Laser-Shock-Peening-Treated Stainless Steel AISI 304L in VVER Primary Water Environment

1
Institute of Thermomechanics, The Czech Academy of Sciences, 182 00 Prague, Czech Republic
2
Department of Power Engineering, Faculty of Environmental Technology, University of Chemistry and Technology of Prague, Technická 5, 166 28 Prague, Czech Republic
3
Institute of Physics, The Czech Academy of Sciences, Na Slovance 1999/2, 182 21 Prague, Czech Republic
4
Institute of Theoretical and Applied Mechanics, The Czech Academy of Sciences, Centrum Excelence Telč, Batelovská 485, 588 56 Telc, Czech Republic
5
HiLASE Centre, Za Radnicí 828, 252 41 Dolni Brezany, Czech Republic
6
ENSTA Bretagne IRDL UMR 6027, 2 Rue François VERNY, 29806 Brest, France
*
Author to whom correspondence should be addressed.
Metals 2022, 12(10), 1702; https://doi.org/10.3390/met12101702
Submission received: 18 August 2022 / Revised: 21 September 2022 / Accepted: 26 September 2022 / Published: 12 October 2022
(This article belongs to the Topic Corrosion and Protection of Metallic Materials)

Abstract

:
Laser Shock Peening (LSP) is a surface treatment technique for metallic materials. It induces plastic deformation at the surface of up to around 1 mm in depth. This process introduces residual stresses that lead to strain hardening, and potentially improvements in fatigue, stress corrosion cracking (SCC) and general corrosion behaviour in many, but not all, corrosive media. In this paper, two specimens made of AISI 304L stainless steel, one LSP-treated and one un-treated, were tested at 280 °C and 8 MPa in VVER (or PWR) primary circuit water chemistry using in situ Electrochemical Impedance Spectroscopy (EIS). This experiment serves to qualify the influence of LSP on the changes in corrosion behaviour in high-temperature, high-density water. The residual stress (RS) measurement of the surface showed a compression RS. Before LSP treatment, RS at the surface was 52.2 MPa in the rolling direction 0°RD and 10.42 MPa in the transverse rolling direction 90°RD. After the treatment, surface RS was −175.27 MPa and −183.51 MPa for Scan and TScan directions, respectively. The effect of compressive RS at the surface was studied and showed an increase in corrosion rate. The analysis of oxide layer by SEM revealed differences between LSP-treated and untreated AISI 304L specimens and their connection to corrosion rates.

1. Introduction

Investigated for the first time during the 1970s [1], Laser Shock Peening (LSP) has been an industrial surface treatment process for more than twenty years. This surface treatment technology has the potential to harden the surface of metallic materials and change their corrosion properties [2], stress corrosion cracking properties [3] and fatigue properties [4]. Since the 1990s, this method has also been investigated for the treatment of components of nuclear reactors, e.g., by Toshiba [5].
The principle of laser shock peening consists of focusing a high-power-density (>1 GW/cm2) pulsed laser beam (pulse duration between 10 and 30 ns) on the surface of metallic target covered by a thermal protective coating (see Figure 1). A thermal protective layer (black paint, vinyl tape, aluminium tape, etc.) is used to avoid the ablation of a metallic specimen. When the laser beam irradiates the surface, a thin layer (<1 μm) of material is ablated and ionised, leading to the formation of an expanding plasma [6,7,8]. This plasma expansion leads to mechanical loading, which is applied to the target, resulting in a shock wave propagation into the specimen [9,10]. This shock wave generates compressive plastic deformation in depth (up to 1 mm) and surface strengthening [11].
The irradiation of the metallic target can be performed in both a direct or confined regime. When the interaction of the laser beam takes place directly on the metal surface, the plasma can freely expand in air or vacuum, and the momentum transfer to the material is limited by the low level of pressure induced (P < 1 GPa). Furthermore, the plasma pressure is limited by the fluence limitation in air, and the plasma duration is a little longer than the pulse duration. The use of confinement medium (glass or water) can affect the plasma expansion and, therefore, increase the pressure by one order of magnitude and prolong the plasma pulse duration by 2–3 times compared to the direct regime at the same power density [10,12].
Microstructural changes are induced on the surface layer after LSP treatment, such as grain refinement [13,14,15] and a highly deformed microstructure [13,16], with an accompanying increase in compressive residual stresses [16,17,18], microhardness [16,17,19] and increased surface roughness [19]. However, the significant relaxation of residual stresses was reported by Geng et al. [13] in LSP-treated alloy IN718 after merely 10 min exposure to high-temperature (up to 900 °C) molten salts, although a slight increase in the corrosion resistance of the LSP-treated samples was observed nonetheless. Typically, the higher pulse energy of the laser [16,19] and higher number of laser treatments [14,16,18] lead to higher compressive residual stresses and microhardness. However, Chukwuike et al. [19] observed that increasing the laser power density and the overlap of the laser impacts does not improve the surface mechanical properties of copper indefinitely, but rather shows an optimum at medium overlap and power density. Laser shock peening, compared to other surface treatments, such as shot peening and ultra-sonic impact peening, generate a better surface finish [20,21,22,23], higher depths of residual stress [4,24] and a higher intensity of residual stress in depth [4].
The LSP treatment also enhances corrosion/oxidation resistance of metals in many corrosive environments [13,14,17,18,19,20,25]. Improvements in the resistance to pitting have been reported in NaCl solutions at ambient temperatures [20,25]. Peyre et al. [20] observed an improvement in the corrosion resistance of an AISI 316L exposed to 30 g/L NaCl solution (pH 6.8), reporting a lower passivation current Ipass and higher pitting potential Epit on LSP-treated samples, which indicates a more stable passive layer. Similar improvements in the corrosion characteristics of AISI 304 stainless steel in 0.598 mol/L NaCl solution, as well as an increased SCC resistance in the same environment, was reported by Lu [25]. Similarly to the mechanical properties, the beneficial effect of the LSP treatment tends, in many cases, to increase with increasing pulse intensity and the number of treatments [14,18,25]. However, Wei et al. [17] observed that a single LSP treatment of AISI 304 stainless steel surface led to increased corrosion resistance in an acidic chloride solution, but a sample treated twice exhibited similar corrosion resistance to an untreated sample. High-temperature oxidation may also be improved by LSP. Rai et al. [14] reported a significant improvement in the oxidation resistance of ferritic-martensitic steel P91 in air at 700 °C, which was further increased by repeated laser treatments. The authors report that the enhanced diffusion of Cr through the affected surface layer at early stages of oxidation, which facilitates the formation of a protective chromium-rich oxide layer, is believed to be behind the improved corrosion resistance.
The results of corrosion testing of LSP-treated materials have been reported for many corrosive environments. On a general note, in a comprehensive overview, Guzonas and Cook [26] noted that surface treatments that induce severe cold work increased the corrosion resistance in supercritical water but were detrimental to corrosion resistance in subcritical water. Indeed, Penttilä et al. [27] observed a lower corrosion rate of machined 316L stainless steel sample exposed to supercritical water compared to an as-received and ground sample. At subcritical temperatures and pressures, however, Lozano-Perez et al. [28] reported that the oxidation rate of 304 stainless steel in a PWR environment was enhanced by cold work.
As data on the influence of LSP treatment on corrosion properties in high-temperature environments are limited, this paper presents the results of experiments characterizing the differences between LSP-treated and untreated AISI 304L austenitic stainless steel in a simulated VVER primary water environment. The corrosion process was followed by in situ electrochemical impedance spectroscopy (EIS) measurements. Characteristics of the corrosion processes during oxidation derived from EIS are presented, together with the measurements of surface roughness and residual stresses. Surface analysis was performed by SEM. All tested specimens came from the same batch of AISI 304L, which exhibited in as-received condition a positive residual stress at the surface.

2. Materials and Methods

2.1. Materials and Specimens

The studied material was stainless steel AISI 304L-2B, delivered in the form of 100 mm × 100 mm × 5 mm plates. The chemical composition of AISI 304L stainless steel is given in Table 1. To decrease the roughness, a polishing step used magnetic polishing. Before LSP treatment, round flat specimens were cut from the initial plate by electro-erosion machining. This cutting method minimizes the hardening and introduction of additional residual stresses induced by conventional tooling and milling. The specimens were 12 mm in diameter and a thickness of 5 mm.

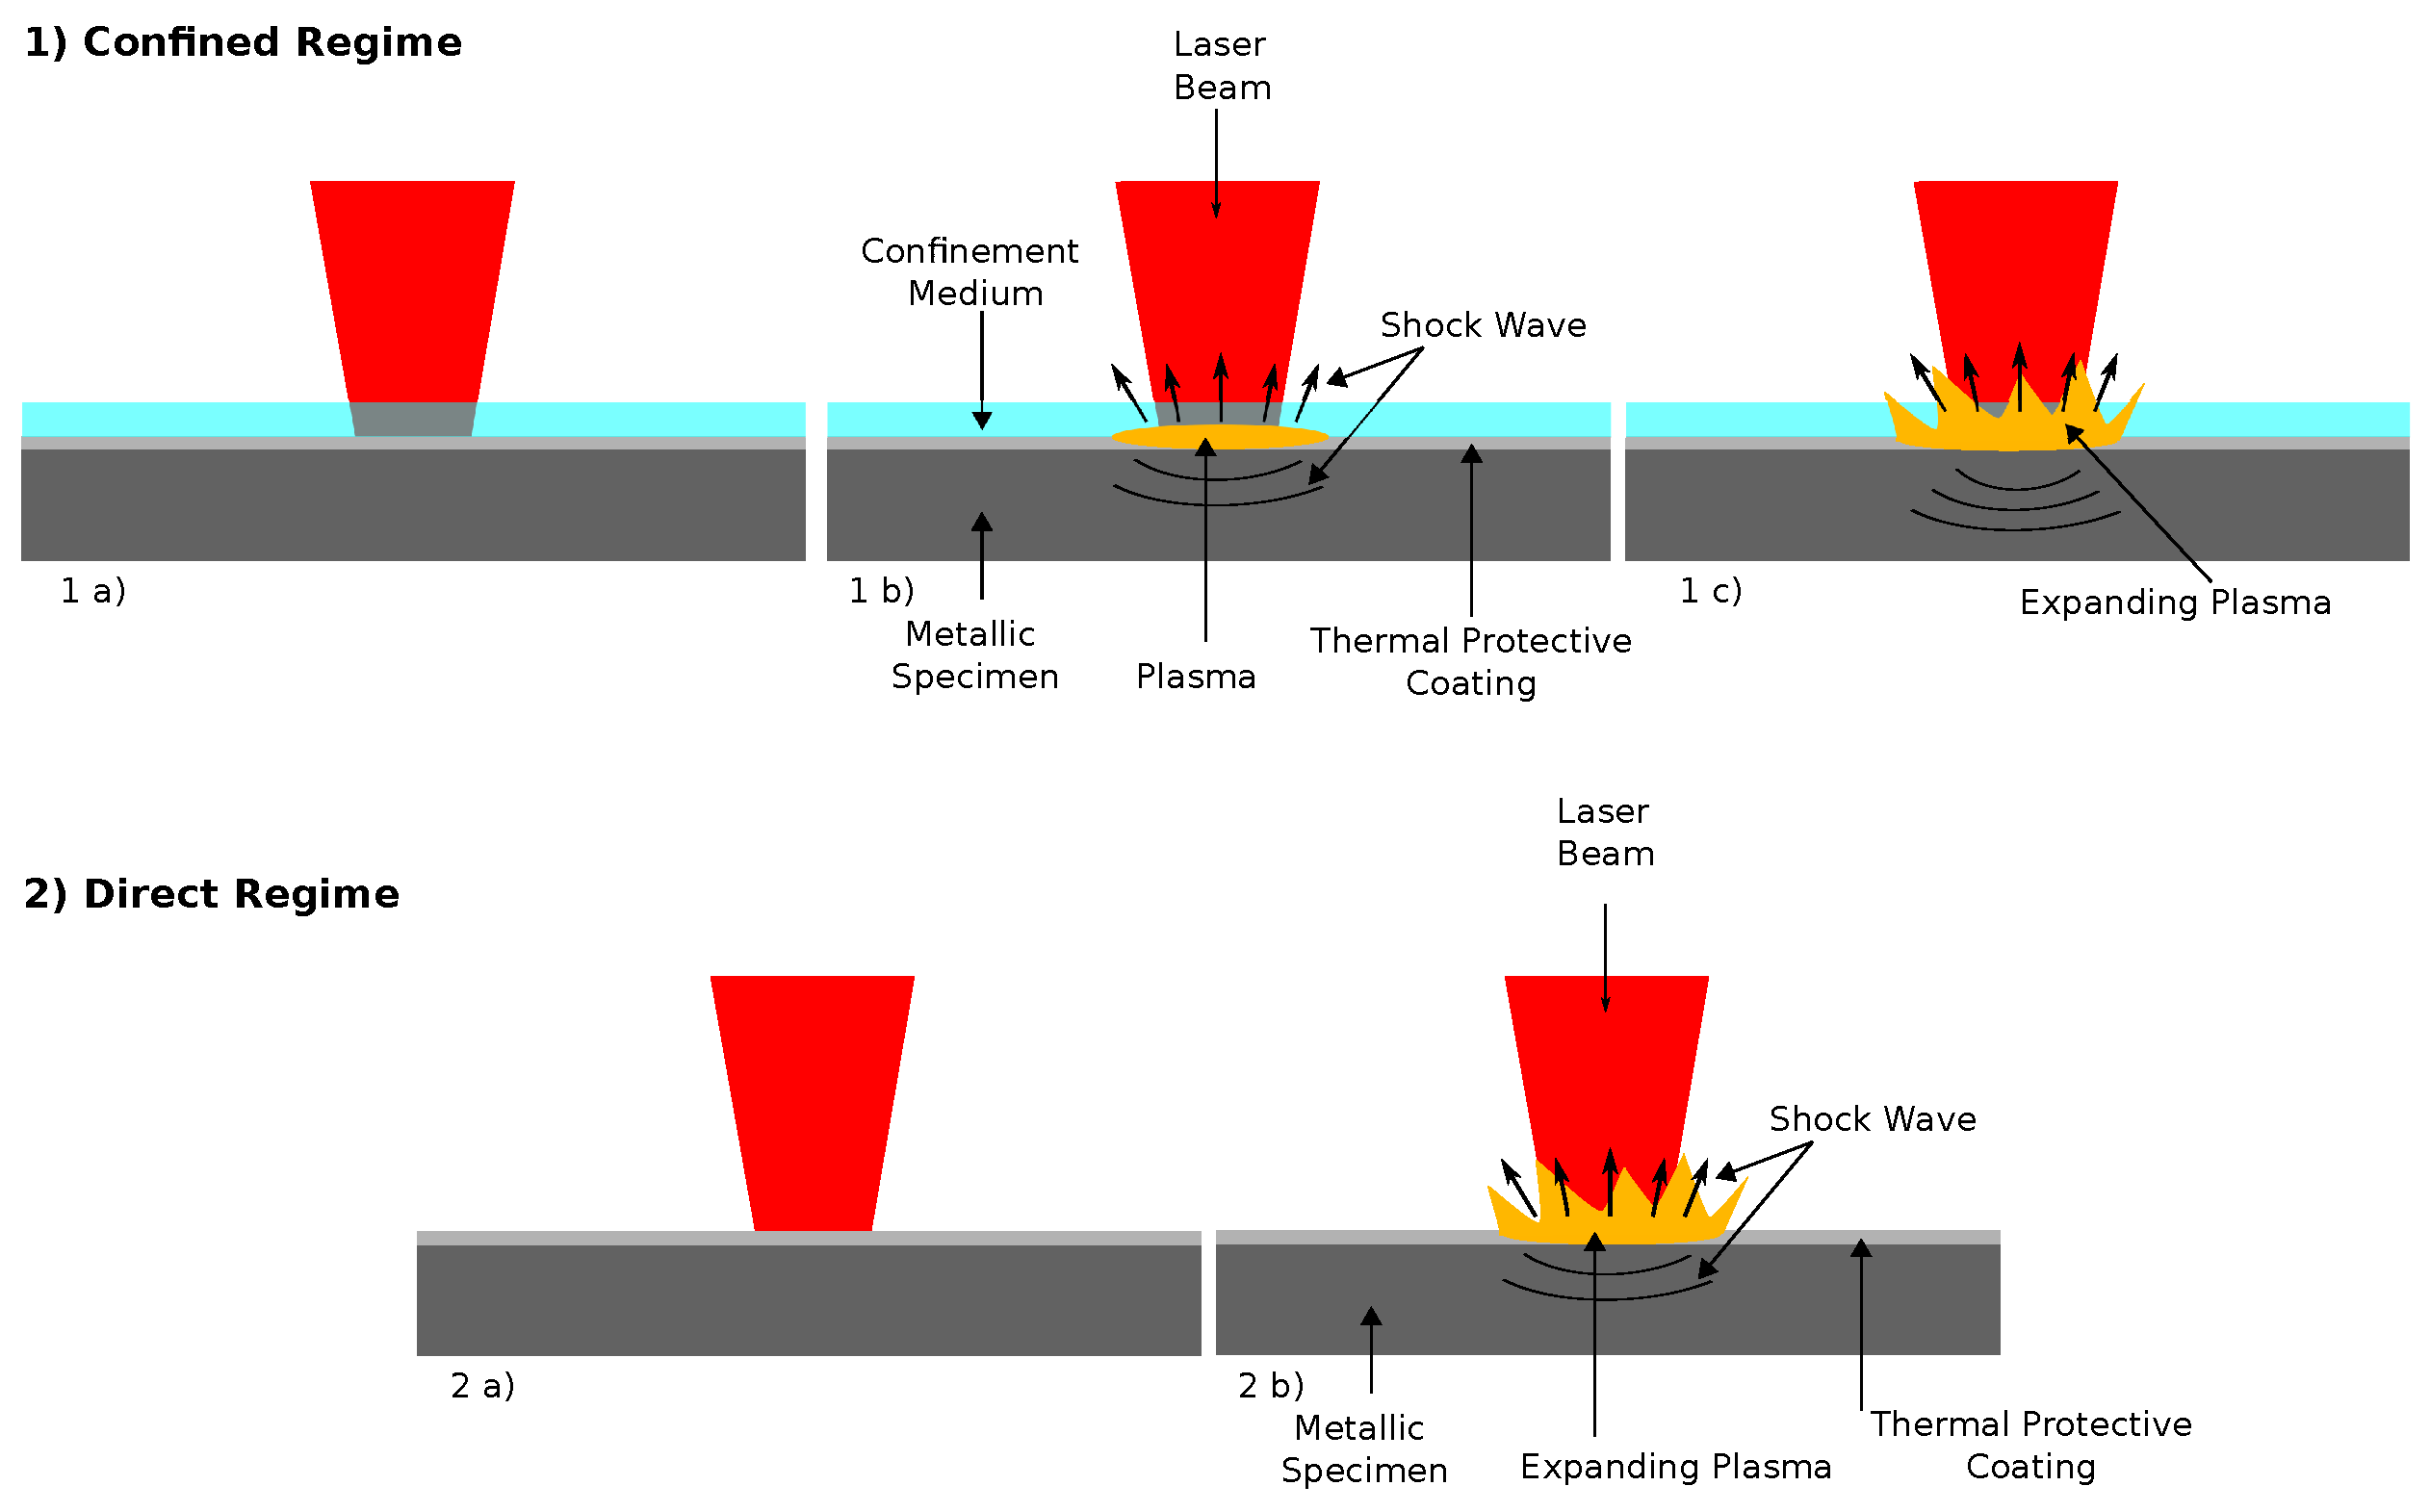
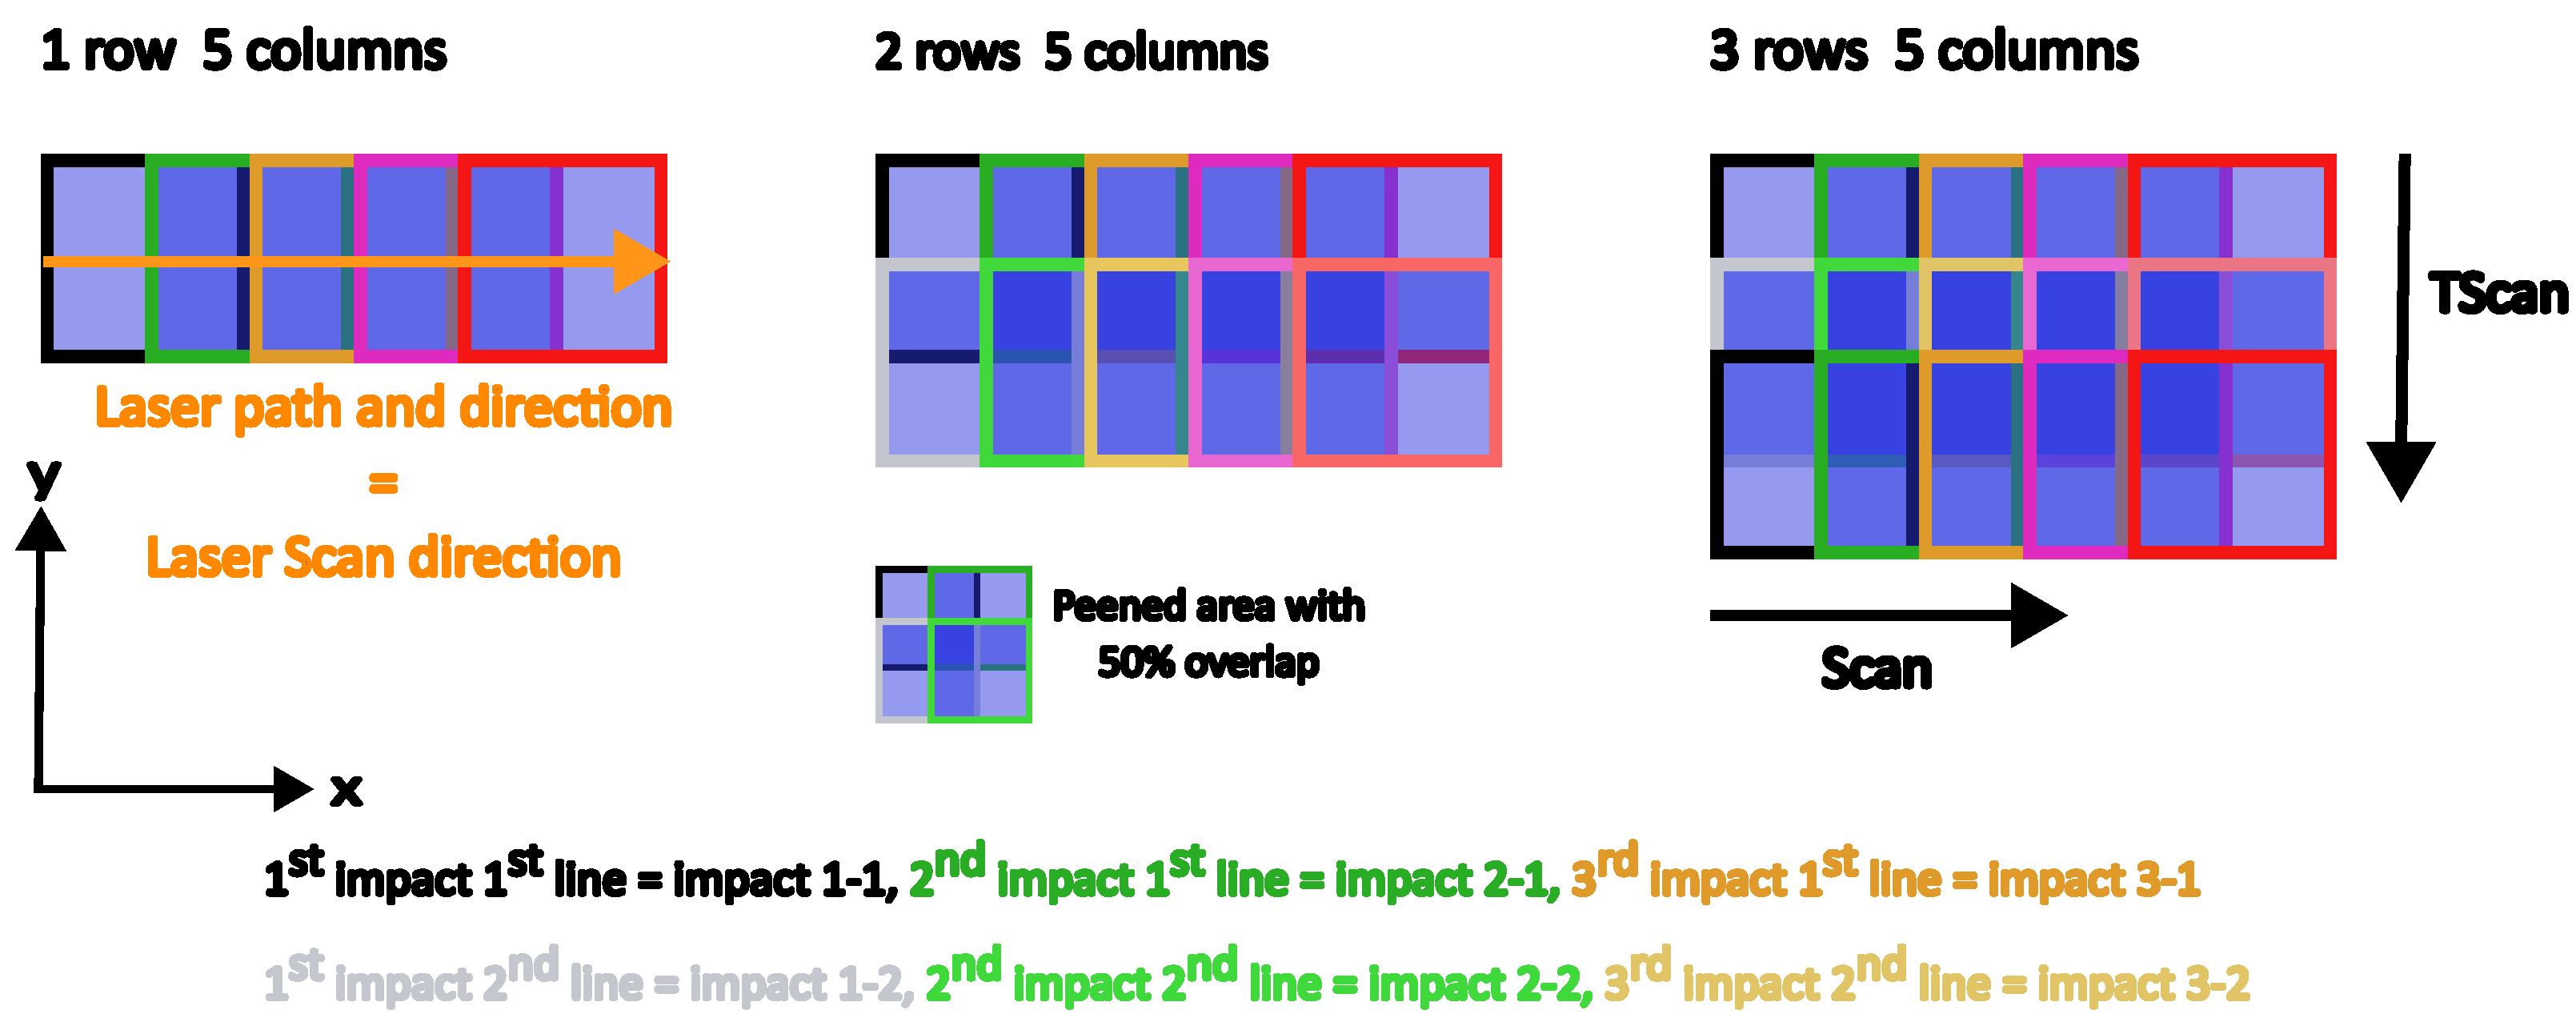
2.2. Laser Shock Peening Treatment

The LSP treatment was performed at the HILASE centre of excellence in Czech Republic using a laser BIVOJ, a Yb-YAG diode pump cryogenically cooled multi-slab laser operating at 1030 nm, delivering a laser pulse of up to 10 J with a pulse duration of 10 ns and a repetition rate of 10 Hz [8,29]. Both the spatial and temporal shapes of the pulse were quasi-square. Before the treatment, a thermal protective layer was applied to the sample. A vinyl tape with the reference 3M 471 was used. Tap water was used as confinement medium. The laser pulse energy was 1.6 J and laser edge size was 2 mm, resulting in a power density of 4 GW/cm2. At every shot, the target was moved by a microcontrol displacement robot arm in X an Y directions, with micrometer accuracy. During this treatment, an overlap of 50% of laser impact was applied, resulting in the elementary area (0.5 mm × 0.5 mm) being impacted four times (see Figure 2).
  • Impact 1-1 (black) is covered at 50% in X-direction by impact 2-1.
  • Impact 2-1 (dark green) is covered at 50% in X-direction by the impact 3-1.
  • Impact 1-2 (grey) covers the impacts 1-1 and 2-1 at 50% in Y-direction, and so forth.

2.3. Roughness Measurement

Roughness of as-received/magnetically polished, as well as the LSP-treated, samples was measured with profilometer 1D Mitutoyo surftest model SJ-410. The roughness measurement evaluation respected the standard ISO 4287:1997. Only arithmetic roughness Ra was measured.

2.4. XRD Residual Stress Measurement

The stress measurements were performed with an X-ray diffractometer (XRD) Rikagu automate II using the sin 2 ψ method. In this method, several Bragg peaks were measured at different angle ψ , which is the angle between the normal of the sample and normal of the diffracting plane. The Bragg peak location is linked with the inter-planar spacing d. If an anisotropic strain is present, d becomes angle dependent, which causes a shift in the Bragg peaks. The stress is then calculated by fitting the peak position data in d versus sin 2 ψ plot using the X-ray diffraction elastic constants of the material. These constants relate to the Young’s modulus of the material of interest. The measurement parameters are listed in Table 2.
The XRD residual stress measurements were performed on the surface and not in depth. To obtain the residual stress profile in depth, it is necessary to gradually remove layers of the metal by electro-polishing with 85.5:12.5 vol% CH3OH:H2SO4 electrolytic solution. As this method is destructive, it was avoided to keep LSP-treated samples for further testing. The residual stress measurement evaluation respected the standard ASTM E1426-14(2019)e1.

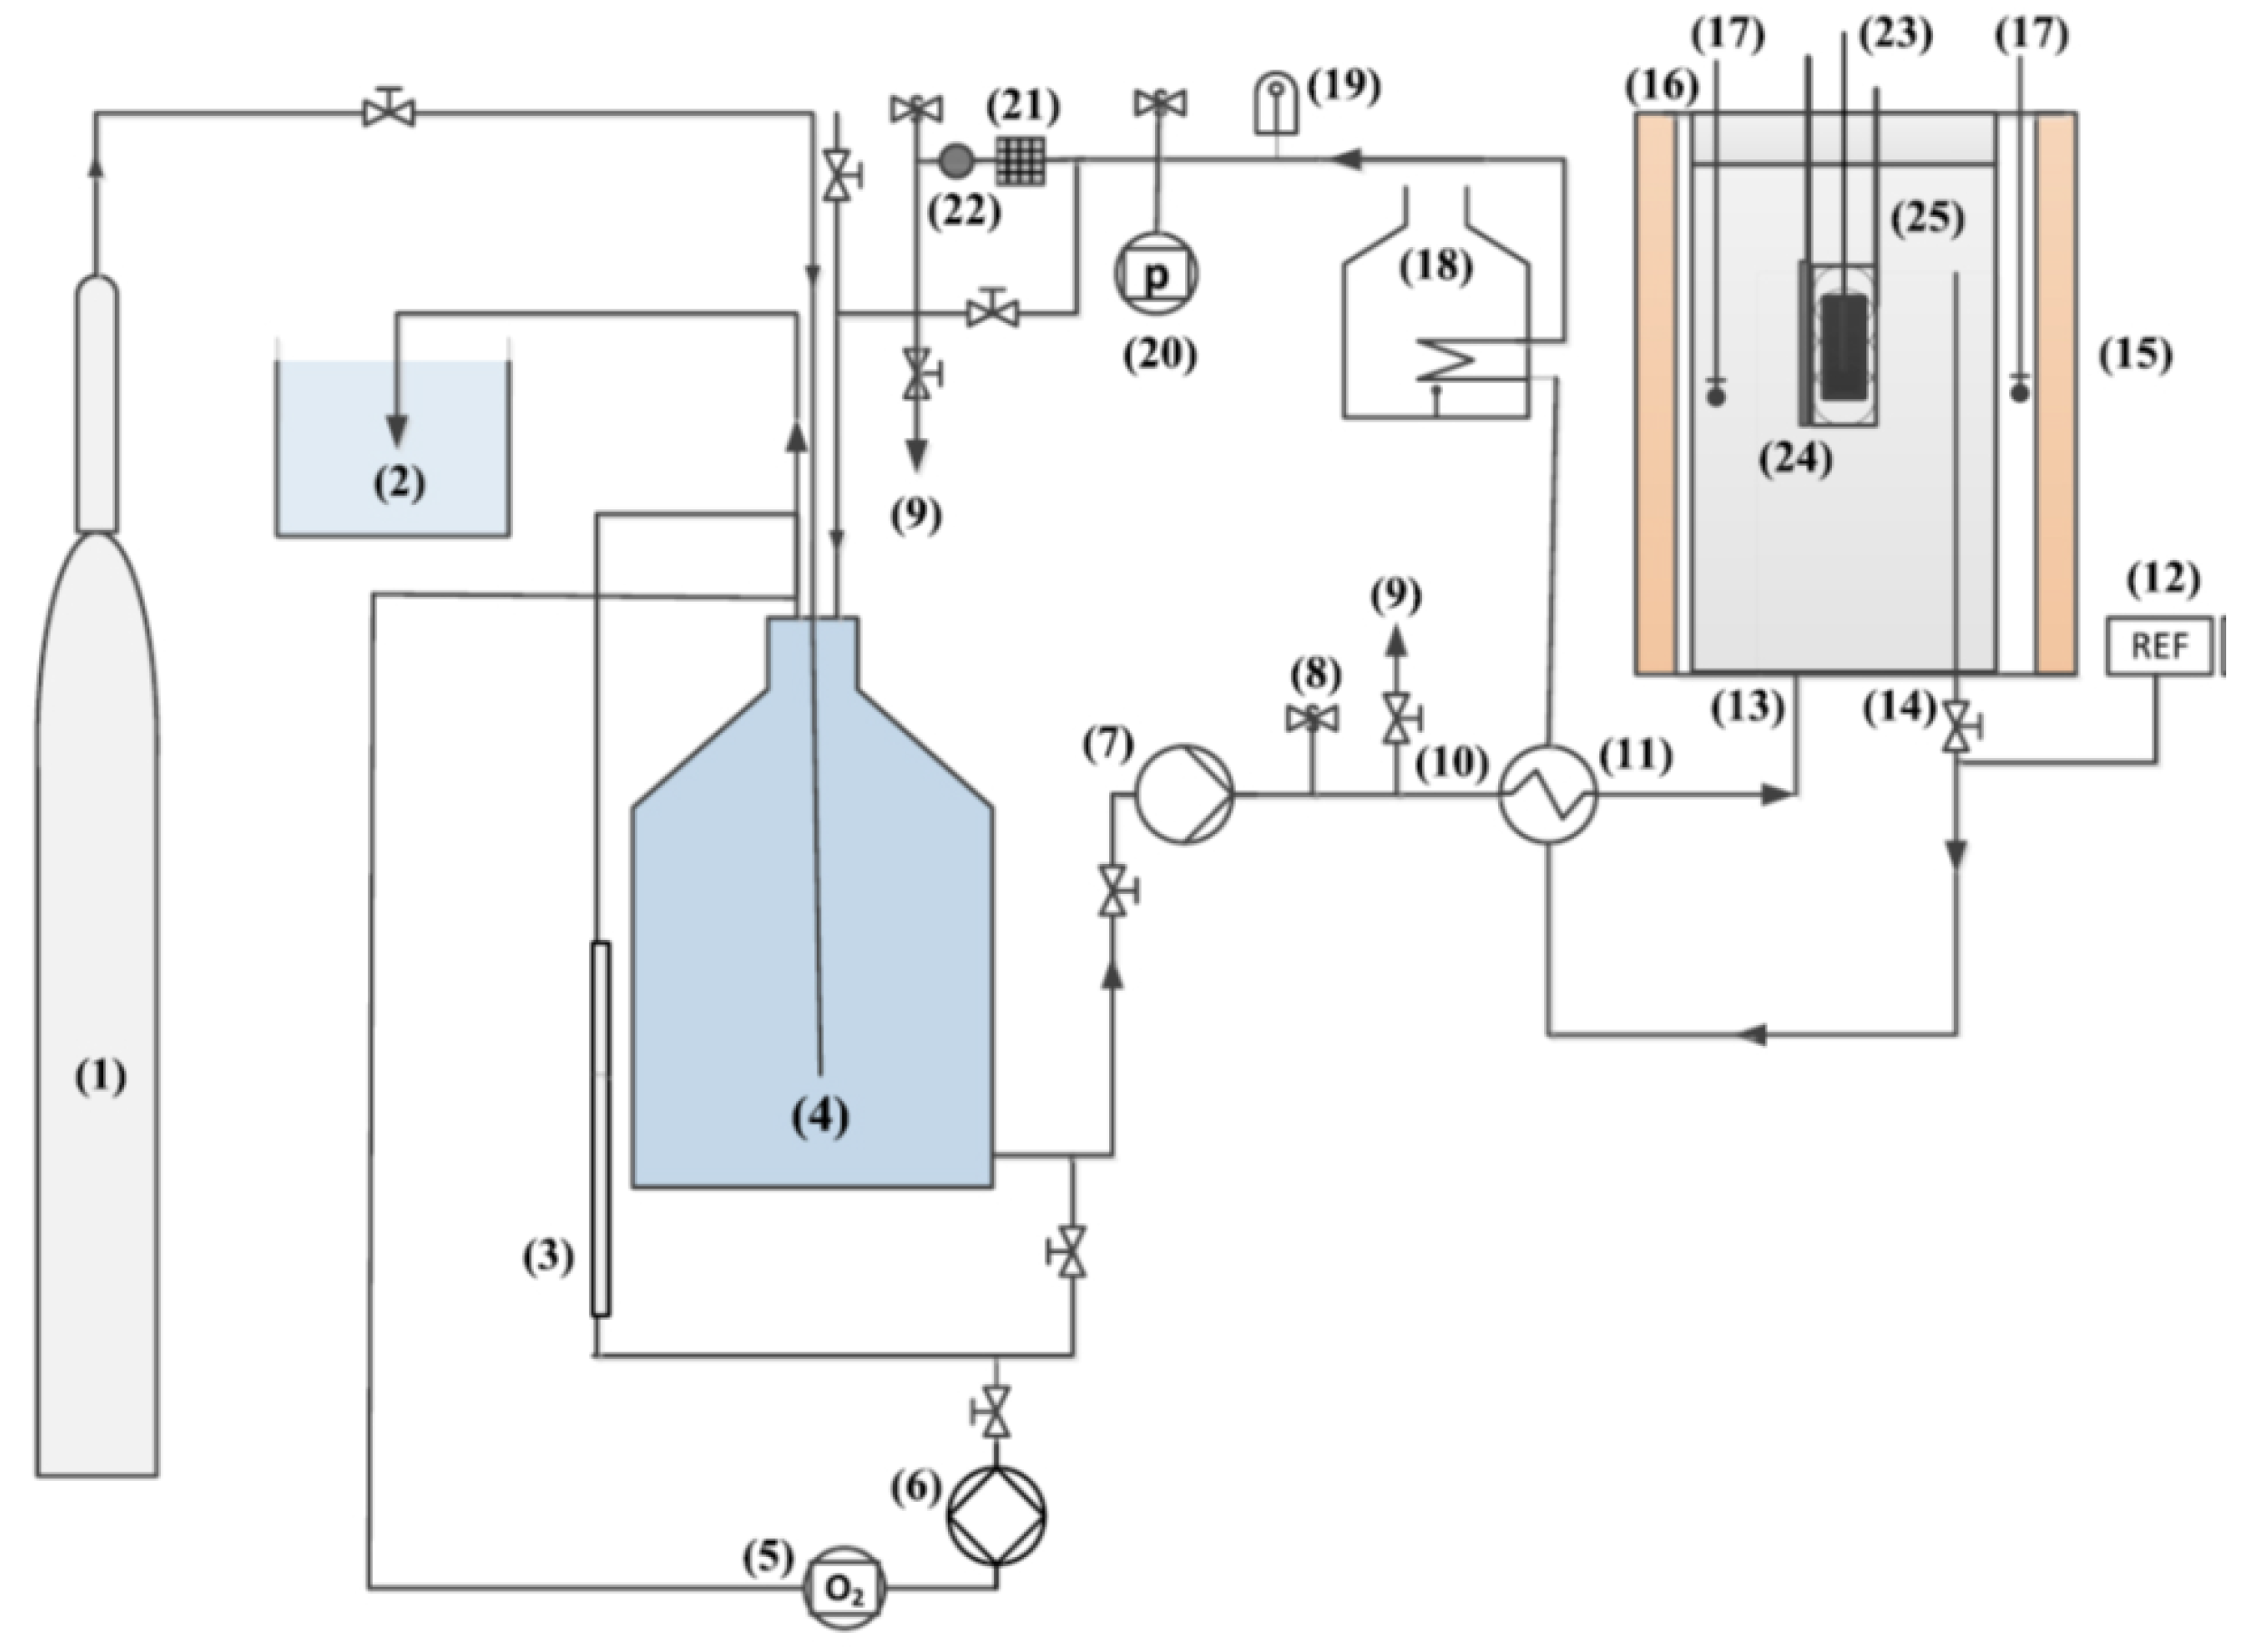
2.5. Electrochemical Impedance Spectroscopy (EIS) in Autoclave

The autoclave is shown in Figure 3. The working temperature and pressure are 280 °C and 8 MPa. The medium was demineralized water, containing 1050 ppm B+ as H3BO3, 15.9 ppm K+ as KOH and 1 ppm Li+ as LiOH. The loop was deareated by argon to stabilize the oxygen concentration at less than 8 μg/L.
The electrode set-up consisted of the studied samples, which served as working electrodes. A platinum wire was wound coaxially around each working electrode, which served as the counter-electrode. An external pressure-balanced Ag/AgCl reference electrode filled with saturated KCl was installed in the loop. However, the impedance response of the reference electrode was found in the frequency domain of interest for the performed measurements, altering the obtained impedance spectra. Therefore, all impedance spectra were acquired in a modified 3-electrode set-up, where the Pt coaxial to the working electrode was used as the counter-electrode and a second Pt-wire of another sample was used as the reference electrode.
Impedance spectra were acquired using Gamry Instruments 600 potentiostat during the entire experiment at more or less regular intervals, mostly depending on the possibility of obtaining points at frequencies as low as 15 μHZ. Three specimens were exposed during the experiment, two treated with LSP and one as-received, with the latter designated as the untreated specimen further in the text. However, one of the LSP-treated specimens was short-circuited since the start of the experiment and no meaningful data could be obtained. The impedance spectra were measured in the corrosion potential with an amplitude of 15 mV in the frequency range 100 kHz–15 μHz whenever possible; in case of excessive scatter in the low-frequency domain, the measurement was terminated earlier. Satisfactory impedance values could be acquired for the vast majority of measurements down to 100 μHz. Below this frequency, the influence of long measuring time was already apparent; as the oxide layer grew thicker during the measurement, impedance values were higher by the time the measurement of each spectrum was finished.

3. Results and Discussion

3.1. Residual Stress and Surface Roughness Measurements

In the case of untreated specimen, the XRD residual stress measurements were performed on the surface of three different specimens, in 0°RD and in 90°RD. The surface residual stress was 52.20 ± 7.33 MPa and 10.42 ± 6.23 MPa for 0°RD and 90°RD, respectively. For the LSP-treated specimen, the XRD residual stress measurements were performed on the surface of three different specimens, in laser scan direction (Scan) and in transverse laser scan direction (TScan). The depth profile of the residual stress is not available, because few specimens were treated and all of them were used for corrosion testing, as explained in XRD residual stress section. The surface residual stress was −175.27 ± 6.61 MPa and −183.51 ± 3.05 MPa for Scan and TScan directions, respectively.
The surface roughness of all surface types was estimated by 1D profilometer. For the untreated specimen, surface roughness in 90°RD was 0.220 ± 0.017 μm and in 0°RD 0.080 ± 0.010 μm. For the LSP-treated sample, the surface roughness was 0.390 ± 0.016 μm in Scan direction and 0.600 ± 0.052 μm in TScan direction. The LSP generated a substantial increase in roughness in all directions. The difference in roughness between the two directions could be explained by the original difference in teh roughness of the untreated specimen. This difference could also be a consequence of: (1) the not exactly reproducible shot in laser energy and duration, (2) local differences in the specimen surface, (3) local variations in the confinement or of the tape adhesion on the specimen. This is not be investigated in this study, although it remains a topic of interest for further works. For the estimation of roughness factor by EIS (see next section), an untreated specimen was polished with a diamond paste with a particle size of 0.7 μm. The surface roughness of the diamond-polished (DP) specimen was 0.053 ± 0.023 μm in 90°RD and 0.048 ± 0.033 μm in 0°RD.

3.2. Estimation of the Roughness Factor by EIS

As stated above, the roughness of the metal surface increases after LSP treatment. Therefore, the roughness factor of both the untreated polished and the LSP-treated sample was calculated from the high-frequency effective capacitance estimated from impedance spectra measured in a borate buffer (pH 8.6) at ambient temperature and pressure. The ratio of the effective capacitance C e f f of each sample to the C e f f of the DP specimen was calculated to provide the roughness factor. The real surface of both samples was then estimated as the product of the geometrical surface times the roughness factor. The real surface area values were used to normalize the equivalent circuit parameters to the surface area of the sample.
The measured impedance spectra were evaluated in the frequency range from approx. 500 Hz to 1 Hz using an equivalent circuit consisting of a resistance R s in series with a parallel combination of another resistance R 1 and a so-called constant phase element (CPE), where R s is the resistance of the environment, R 1 is the faradaic resistance and the CPE represents a non-ideal capacitance of the double-layer. The non-ideal behavior of the capacitive response is caused by the spatial distribution of the capacitance over the rough surface. The impedance Z C P E of the Constant Phase Element (CPE) may be expressed as follows:
Z C P E = 1 Q · ( j ω ) n
where Q is the CPE coefficient, n is the CPE exponent, j is the imaginary unit and ω is the angular frequency. (Note that, for n = 1, CPE is an ideal capacitor and Q = C is its capacitance.) In order to calculate the roughness factor, the effective capacitance C e f f is then calculated using the parameters of the equivalent circuit, as follows:
C e f f = Q 1 n R S R 1 R S + R 1 1 n n
Finally, the roughness factor ( R F ) is calculated as follows:
R F u n t r e a t e d = C e f f u n t r e a t e d C e f f p o l i s h e d
R F L S P = C e f f L S P C e f f p o l i s h e d
The parameters of the equivalent circuit of all specimens and the calculated effective capacitances C e f f are summarized in Table 3.
Hence, the R F of the untreated sample was 3.04 and that of the LSP-treated sample was 4.23. Assuming that the geometrical surface of both specimens was 1.13 cm2, the real surface of the untreated sample was 3.44 cm2 and that of the LSP-treated sample was 4.78 cm2.

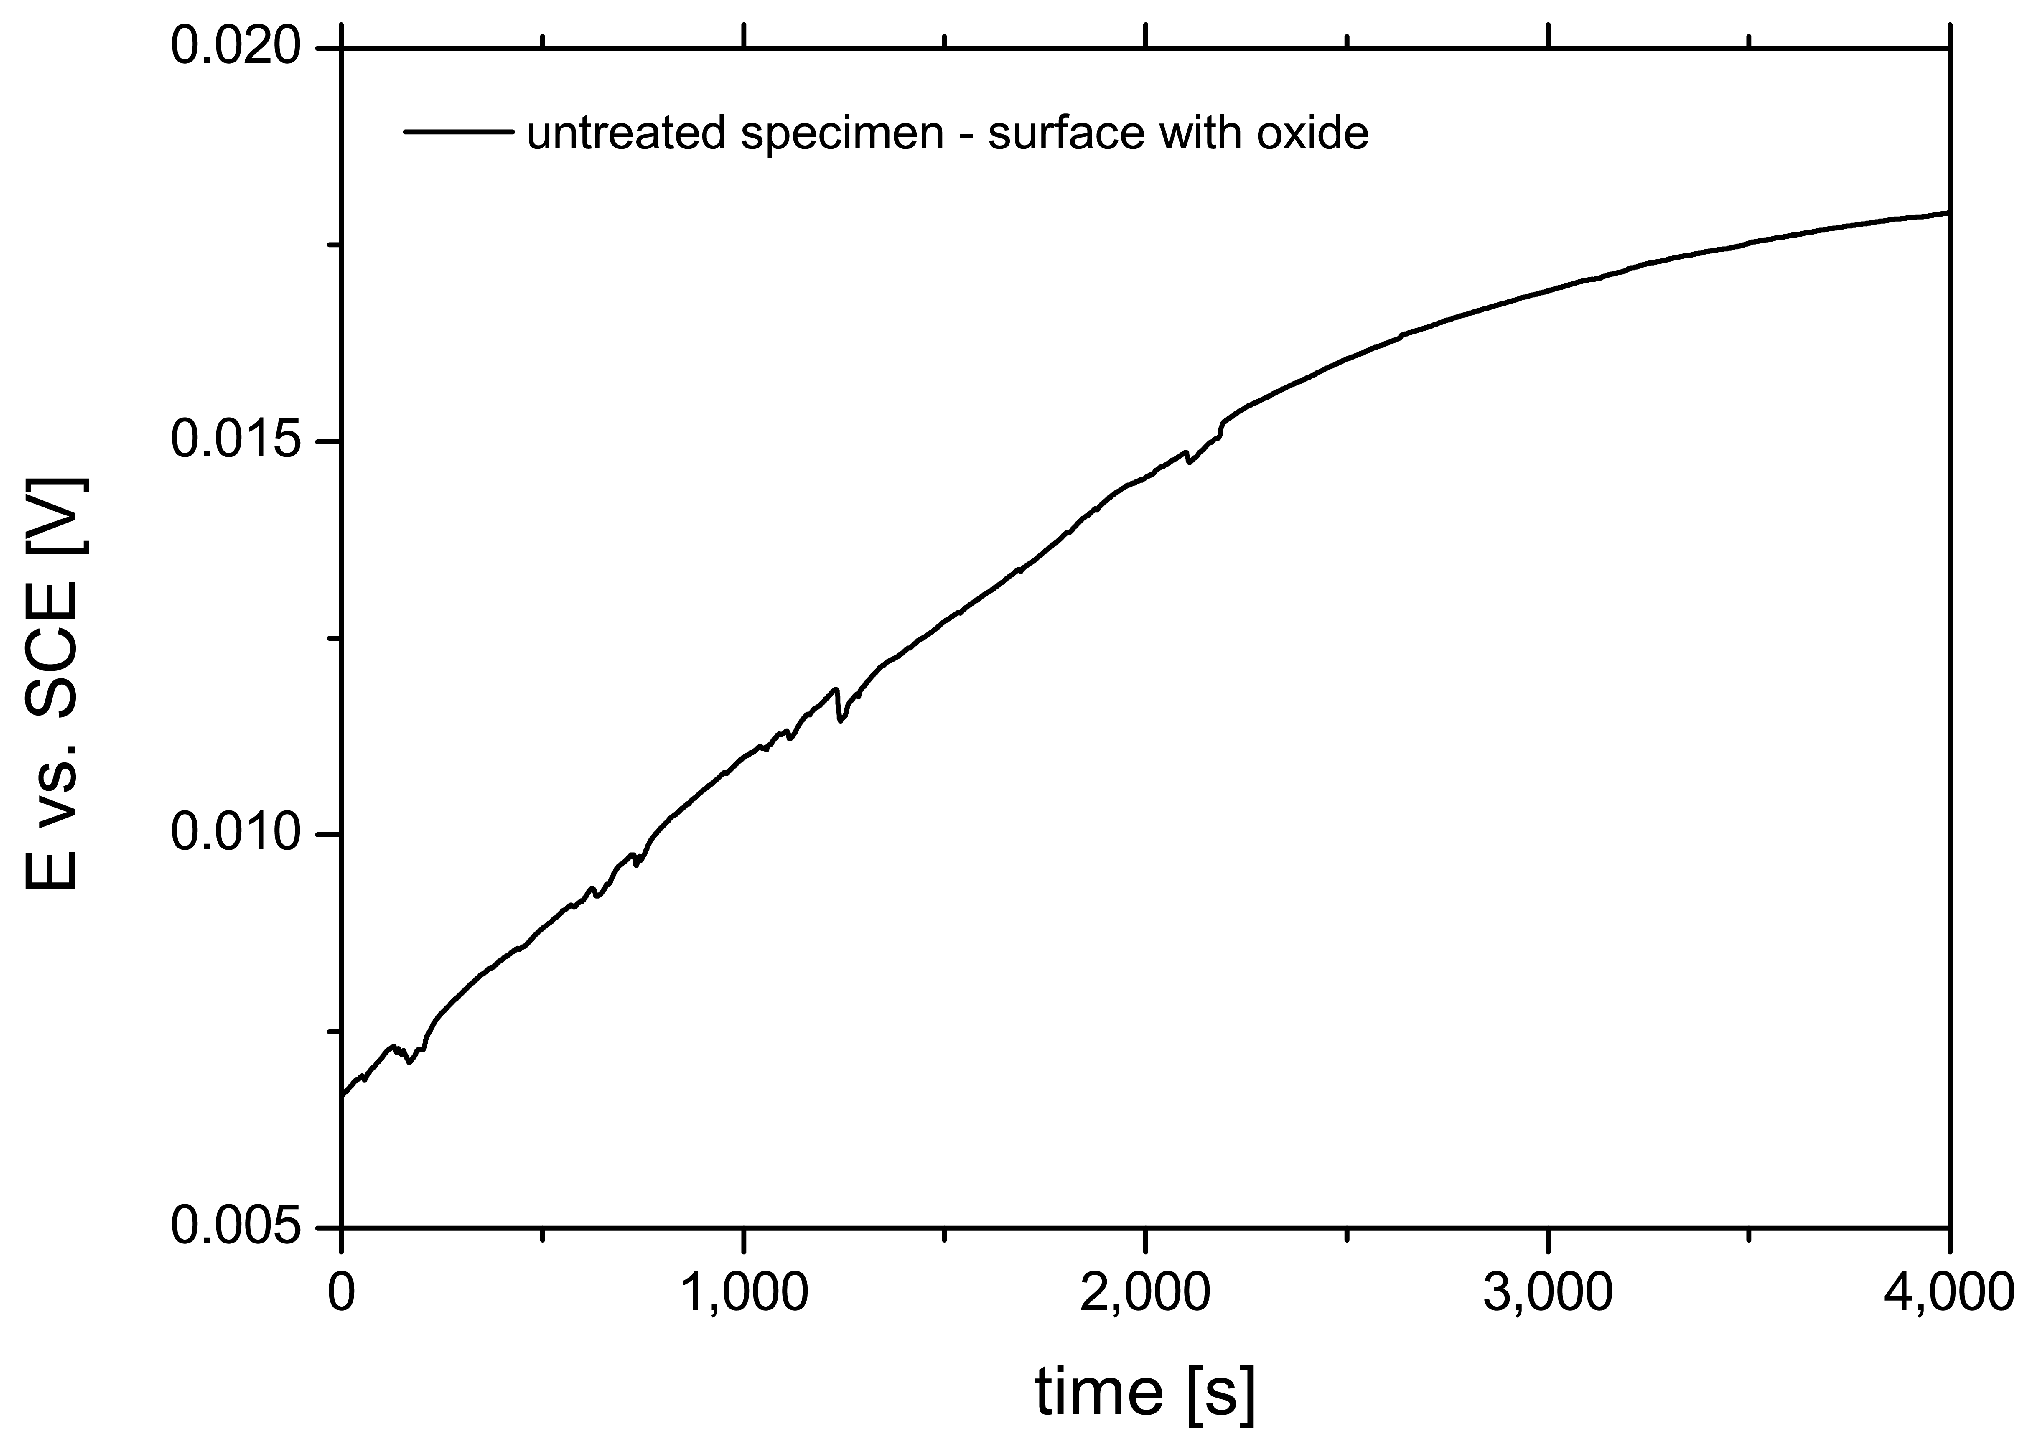
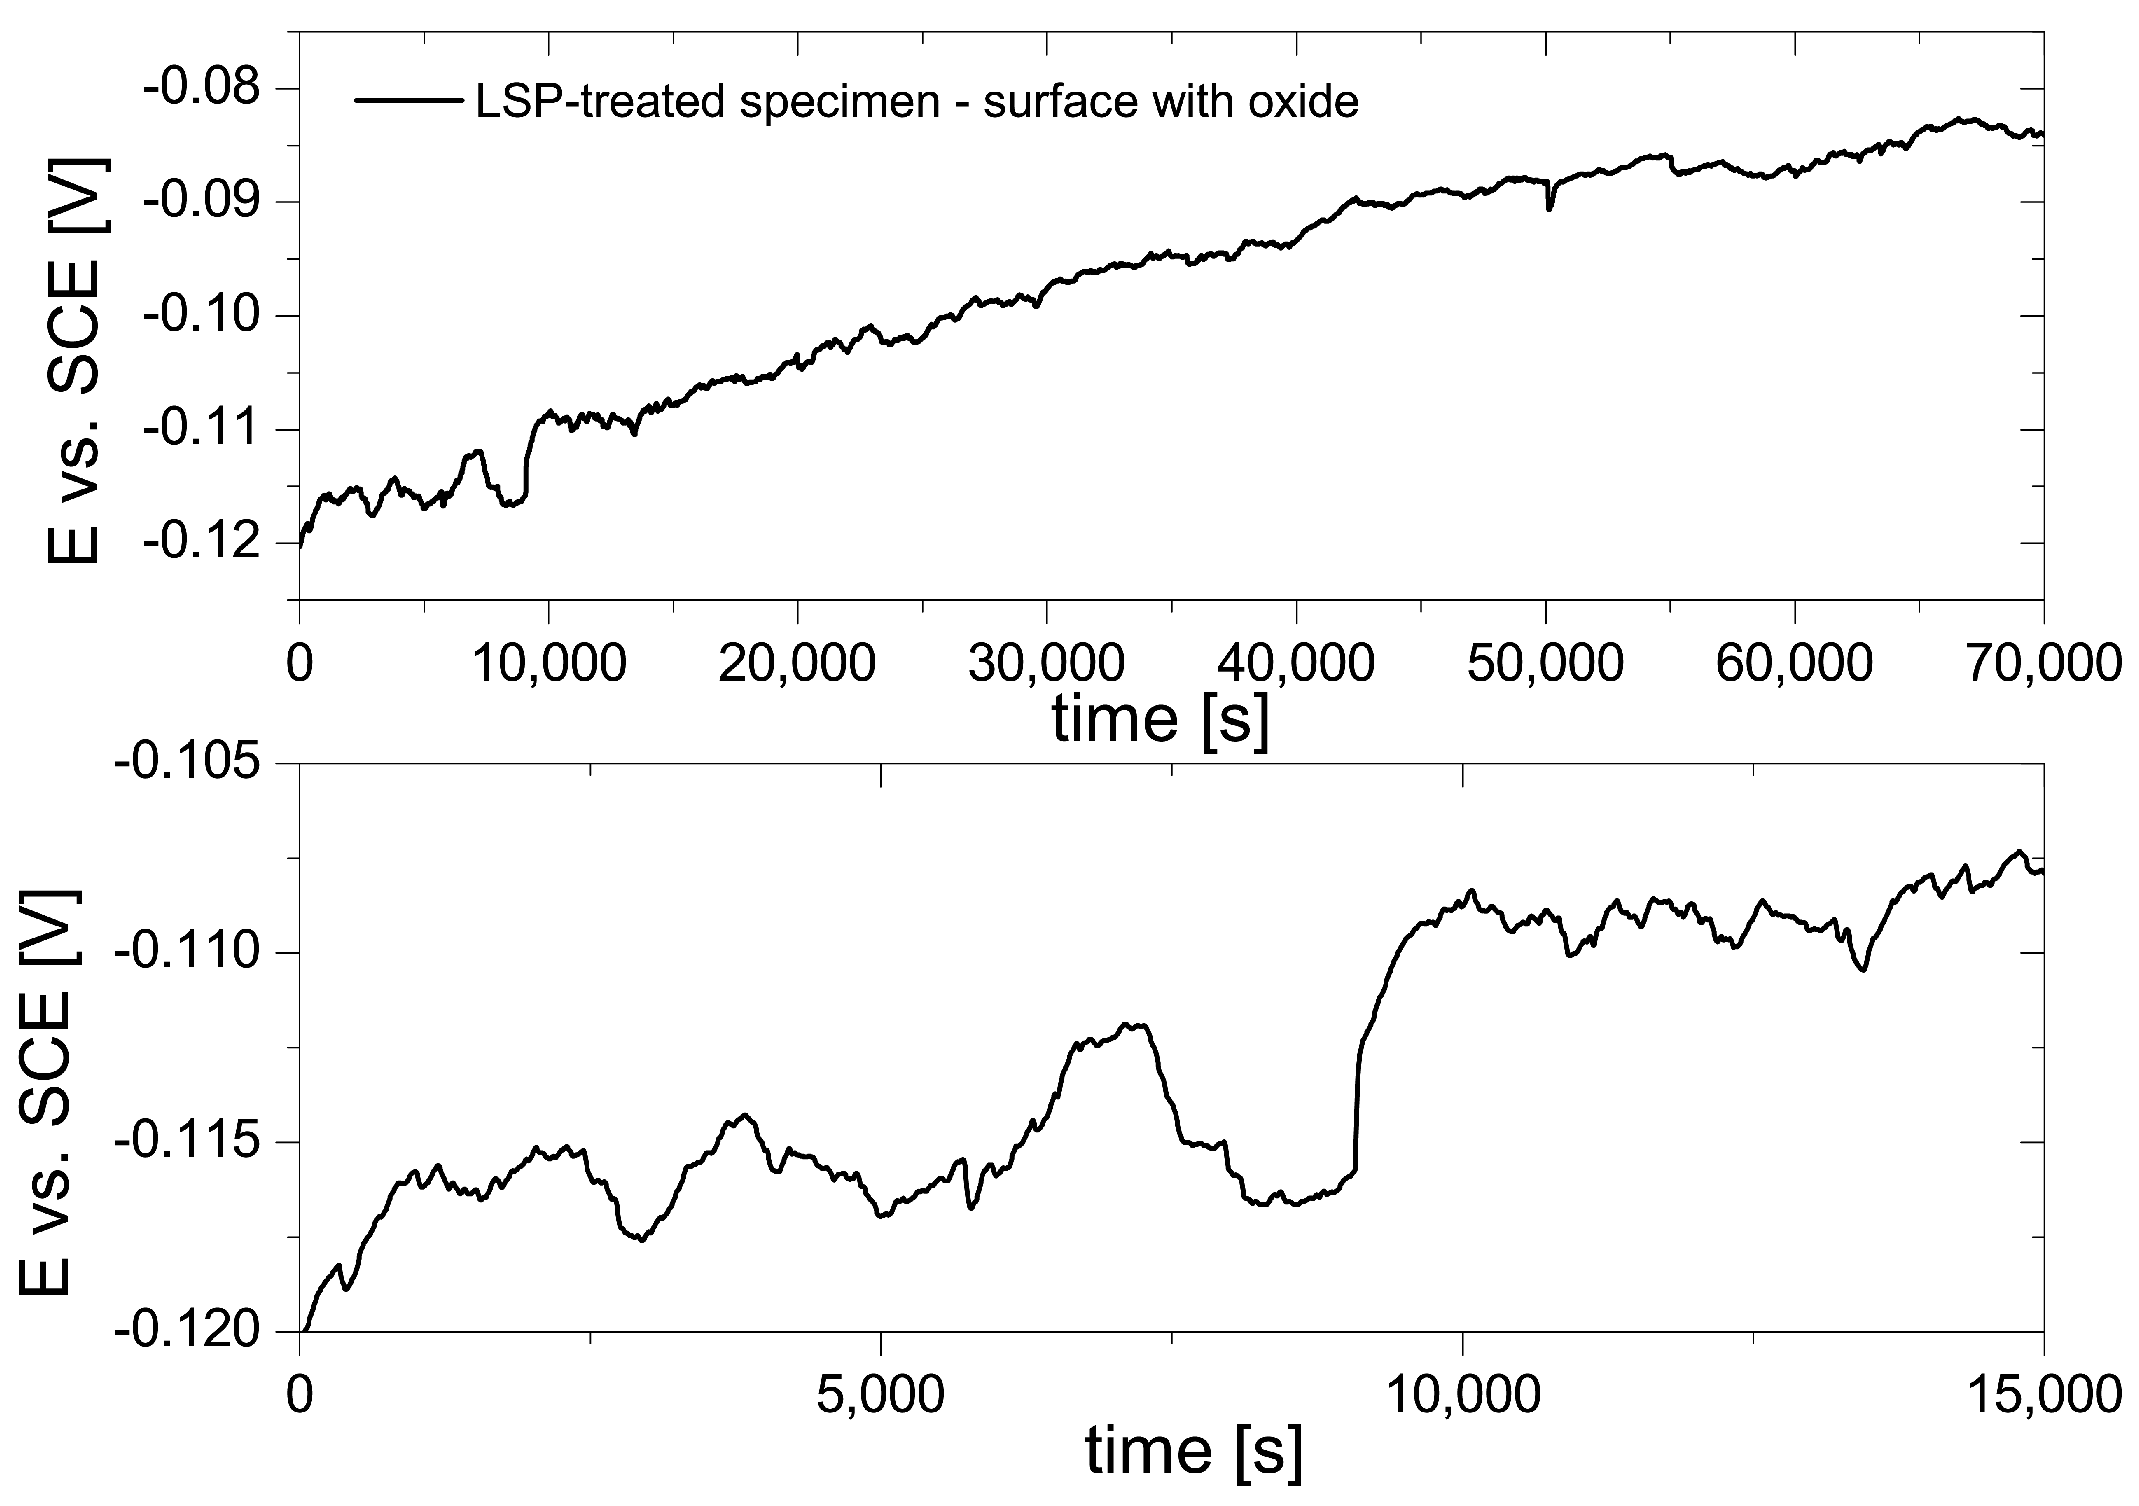
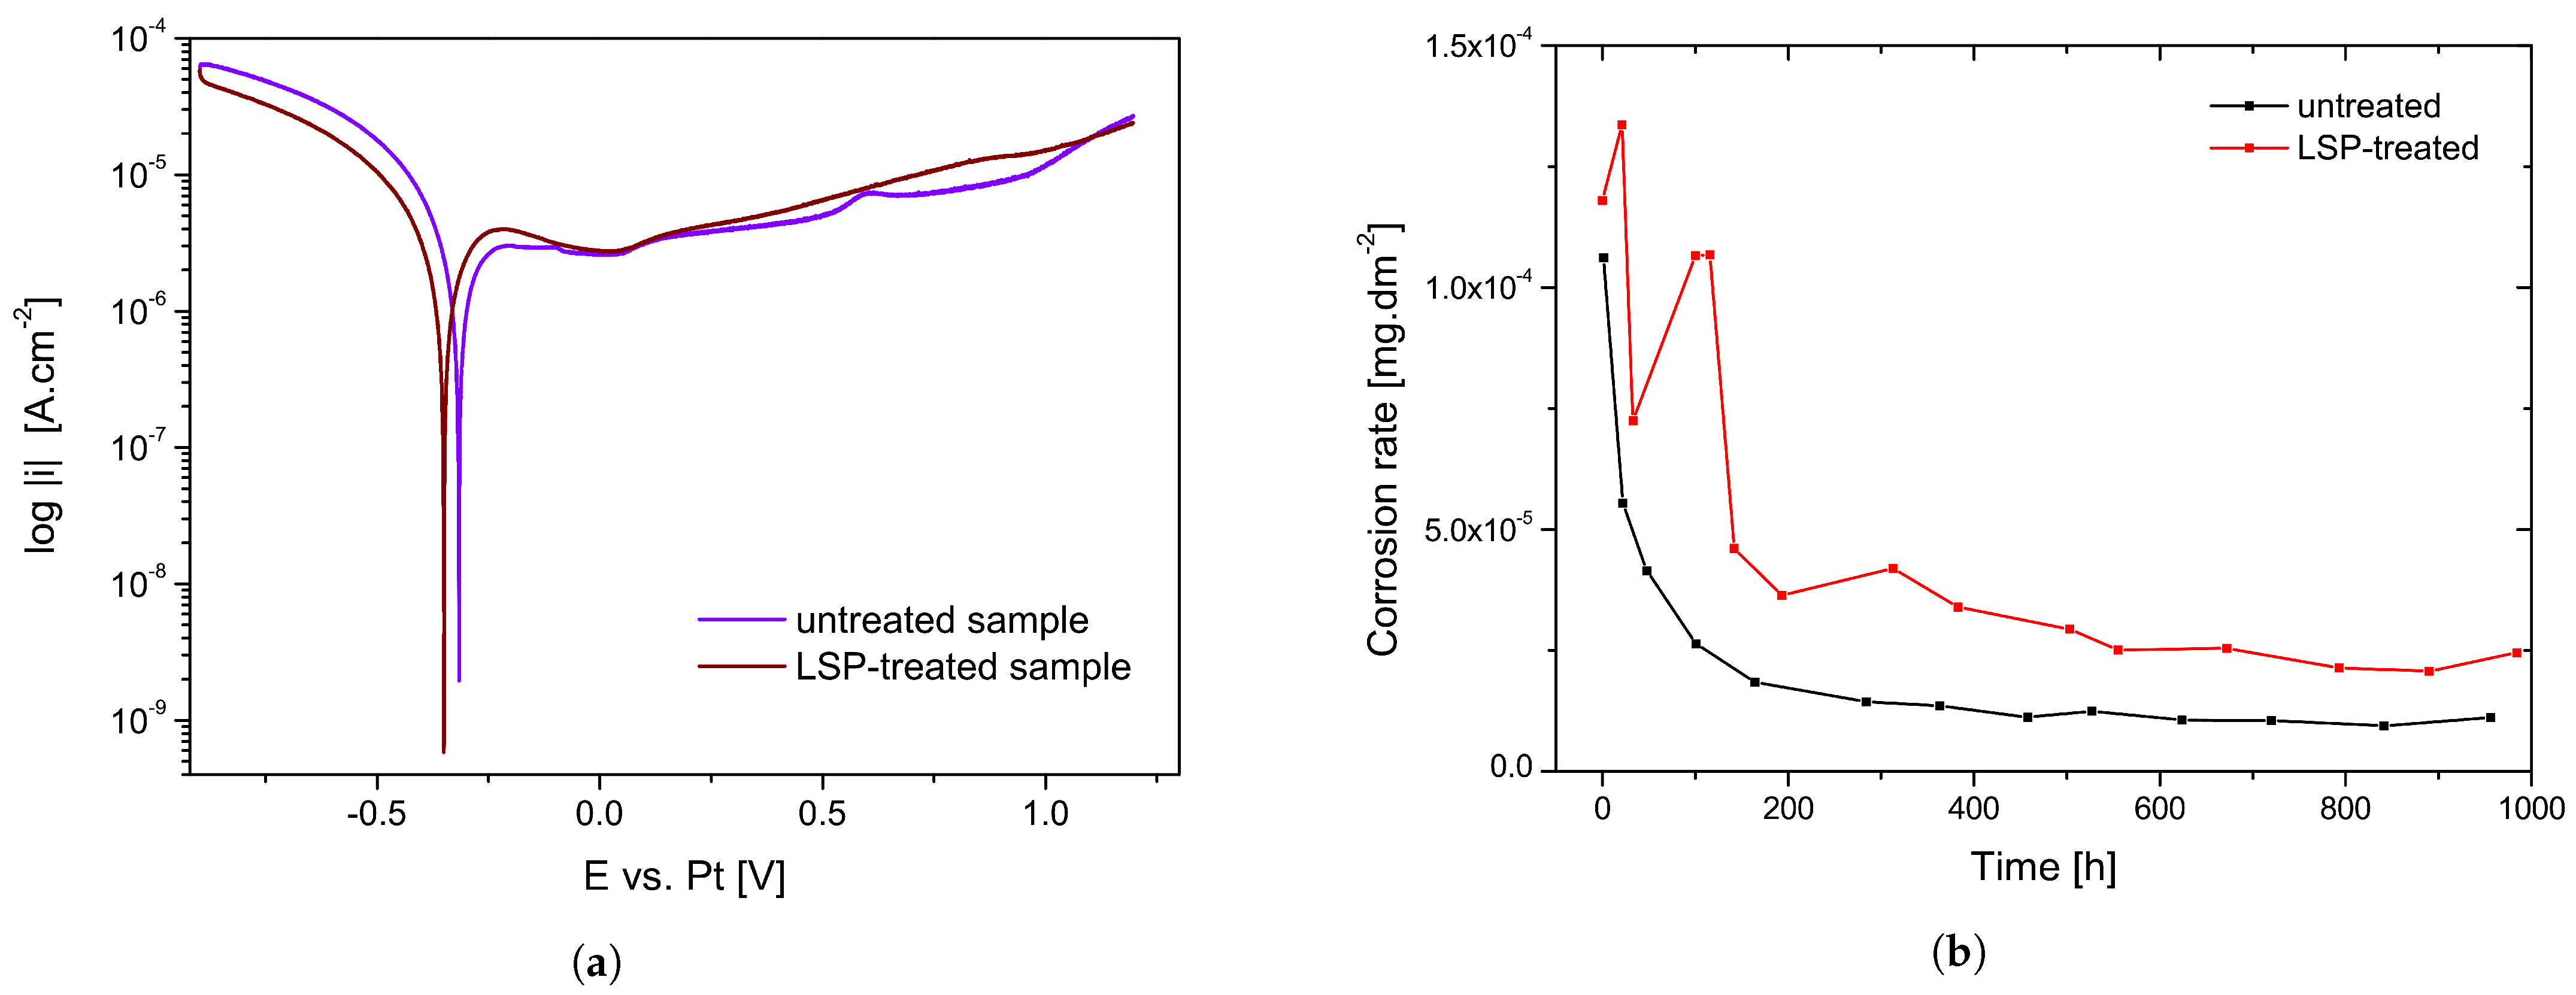
3.3. Corrosion Potential Measurements

Differences were observed in the behavior of the LSP-treated material upon inspection of the evolution of the corrosion potential over time. While no apparent differences could be observed on bare surfaces of both untreated and LSP-treated samples, samples oxidized during exposure in the autoclave exhibited different behavior, as shown in Figure 4 and Figure 5. In the latter case, the corrosion potential exhibited significant fluctuations, possibly pointing to a lower uniformity of the oxide layer, which may be the result of more significant irregularities in the LSP-treated surface, which lead to more distributed corrosion characteristics, such as faradaic resistance, double-layer capacitance, etc., compared to the untreated specimen. Differences have been observed upon SEM analysis of the oxide layer as well. Larger crystals, as well as a larger distribution of crystal sizes, have been observed on the LSP-treated sample compared to the untreated one, where the layer is composed of smaller crystals within a more narrow size range. SEM observations are shown and discussed in more detail in Section 3.5.

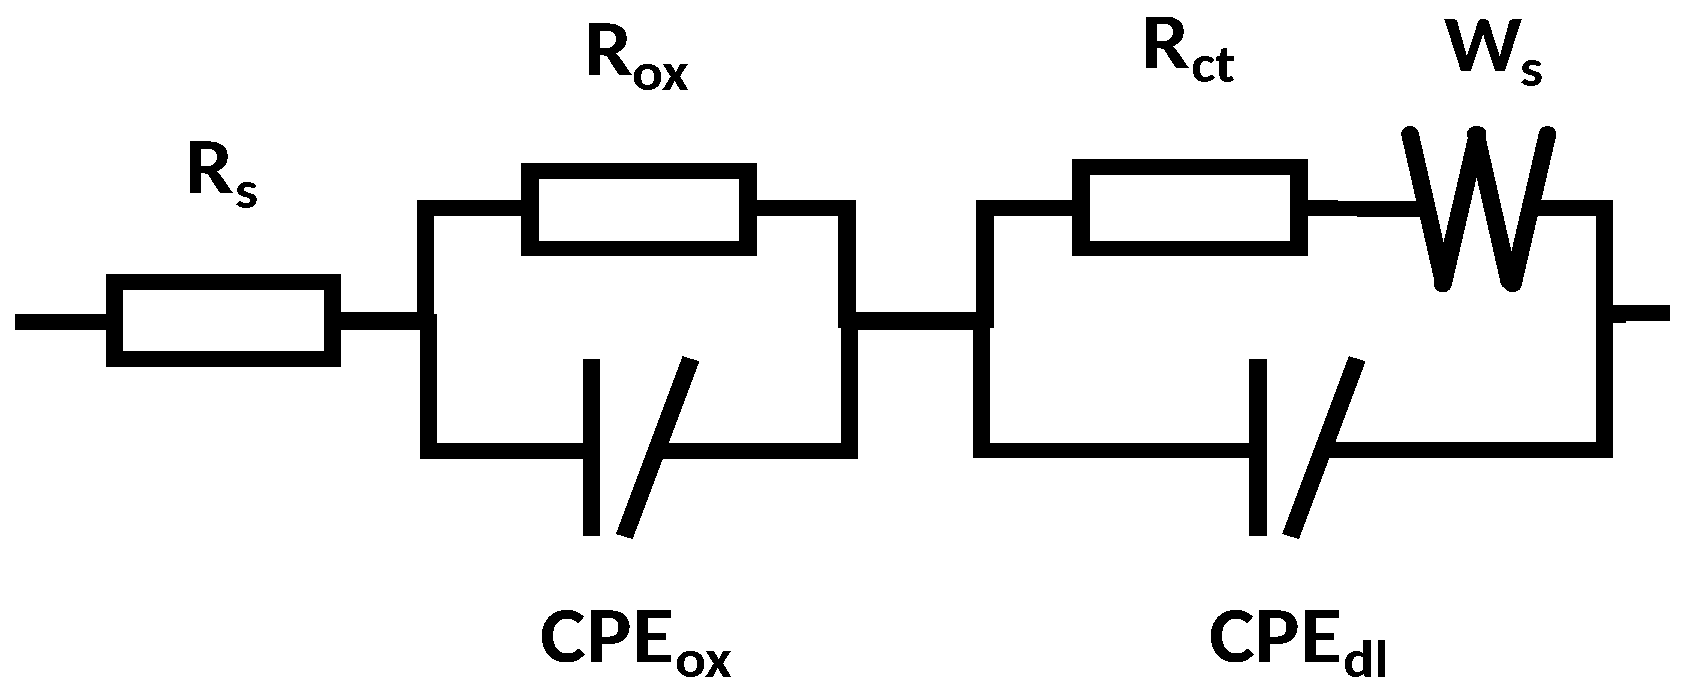
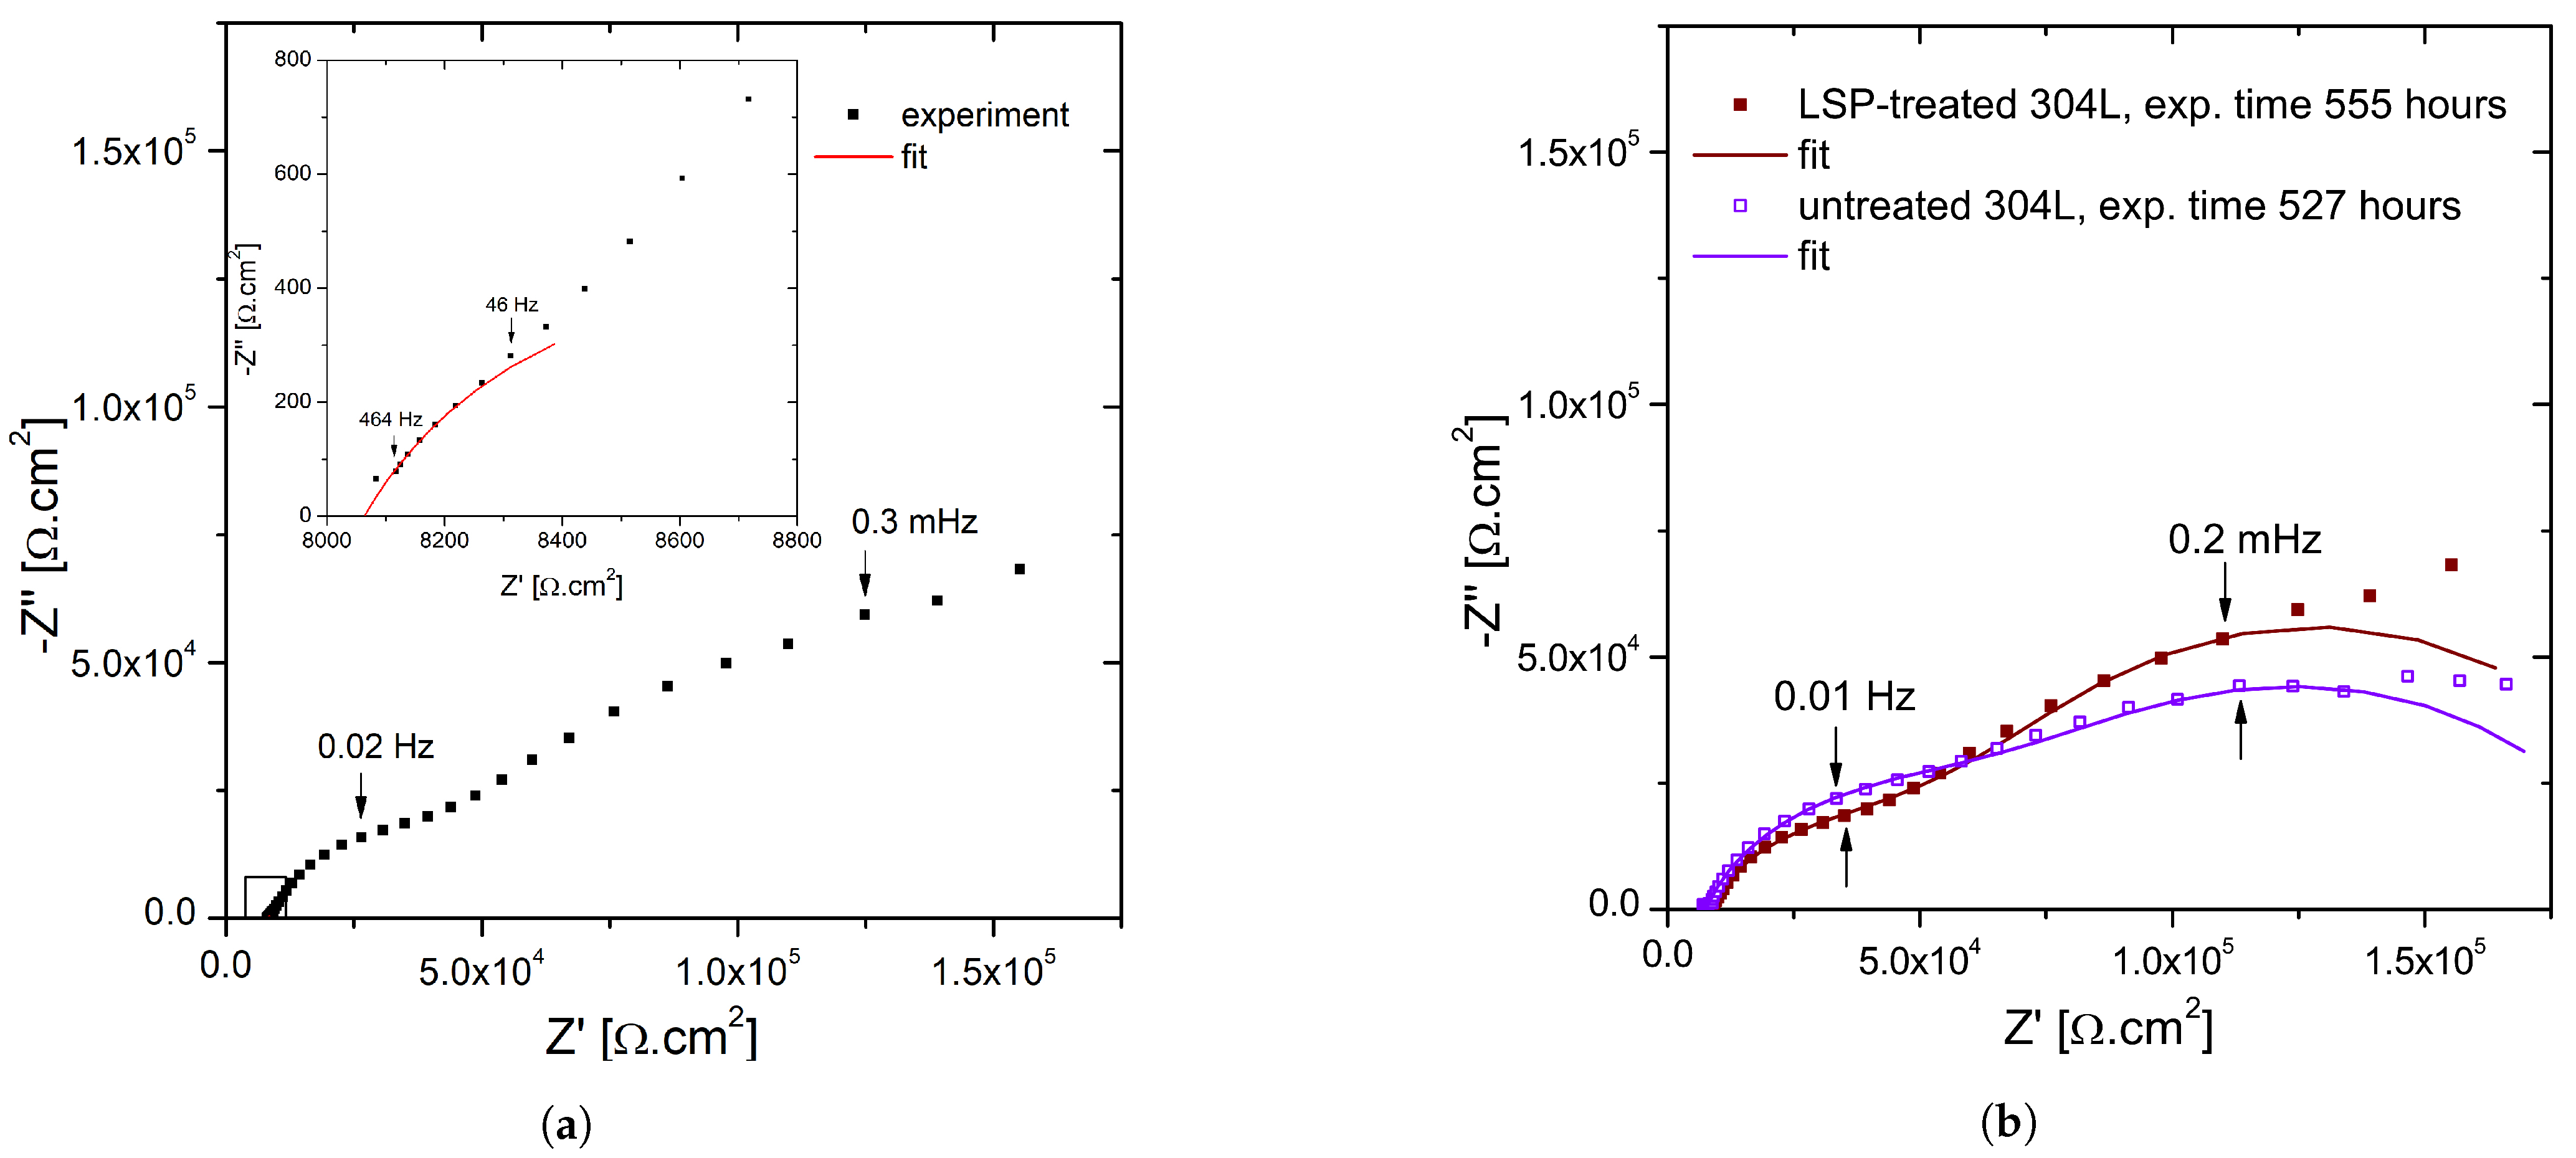
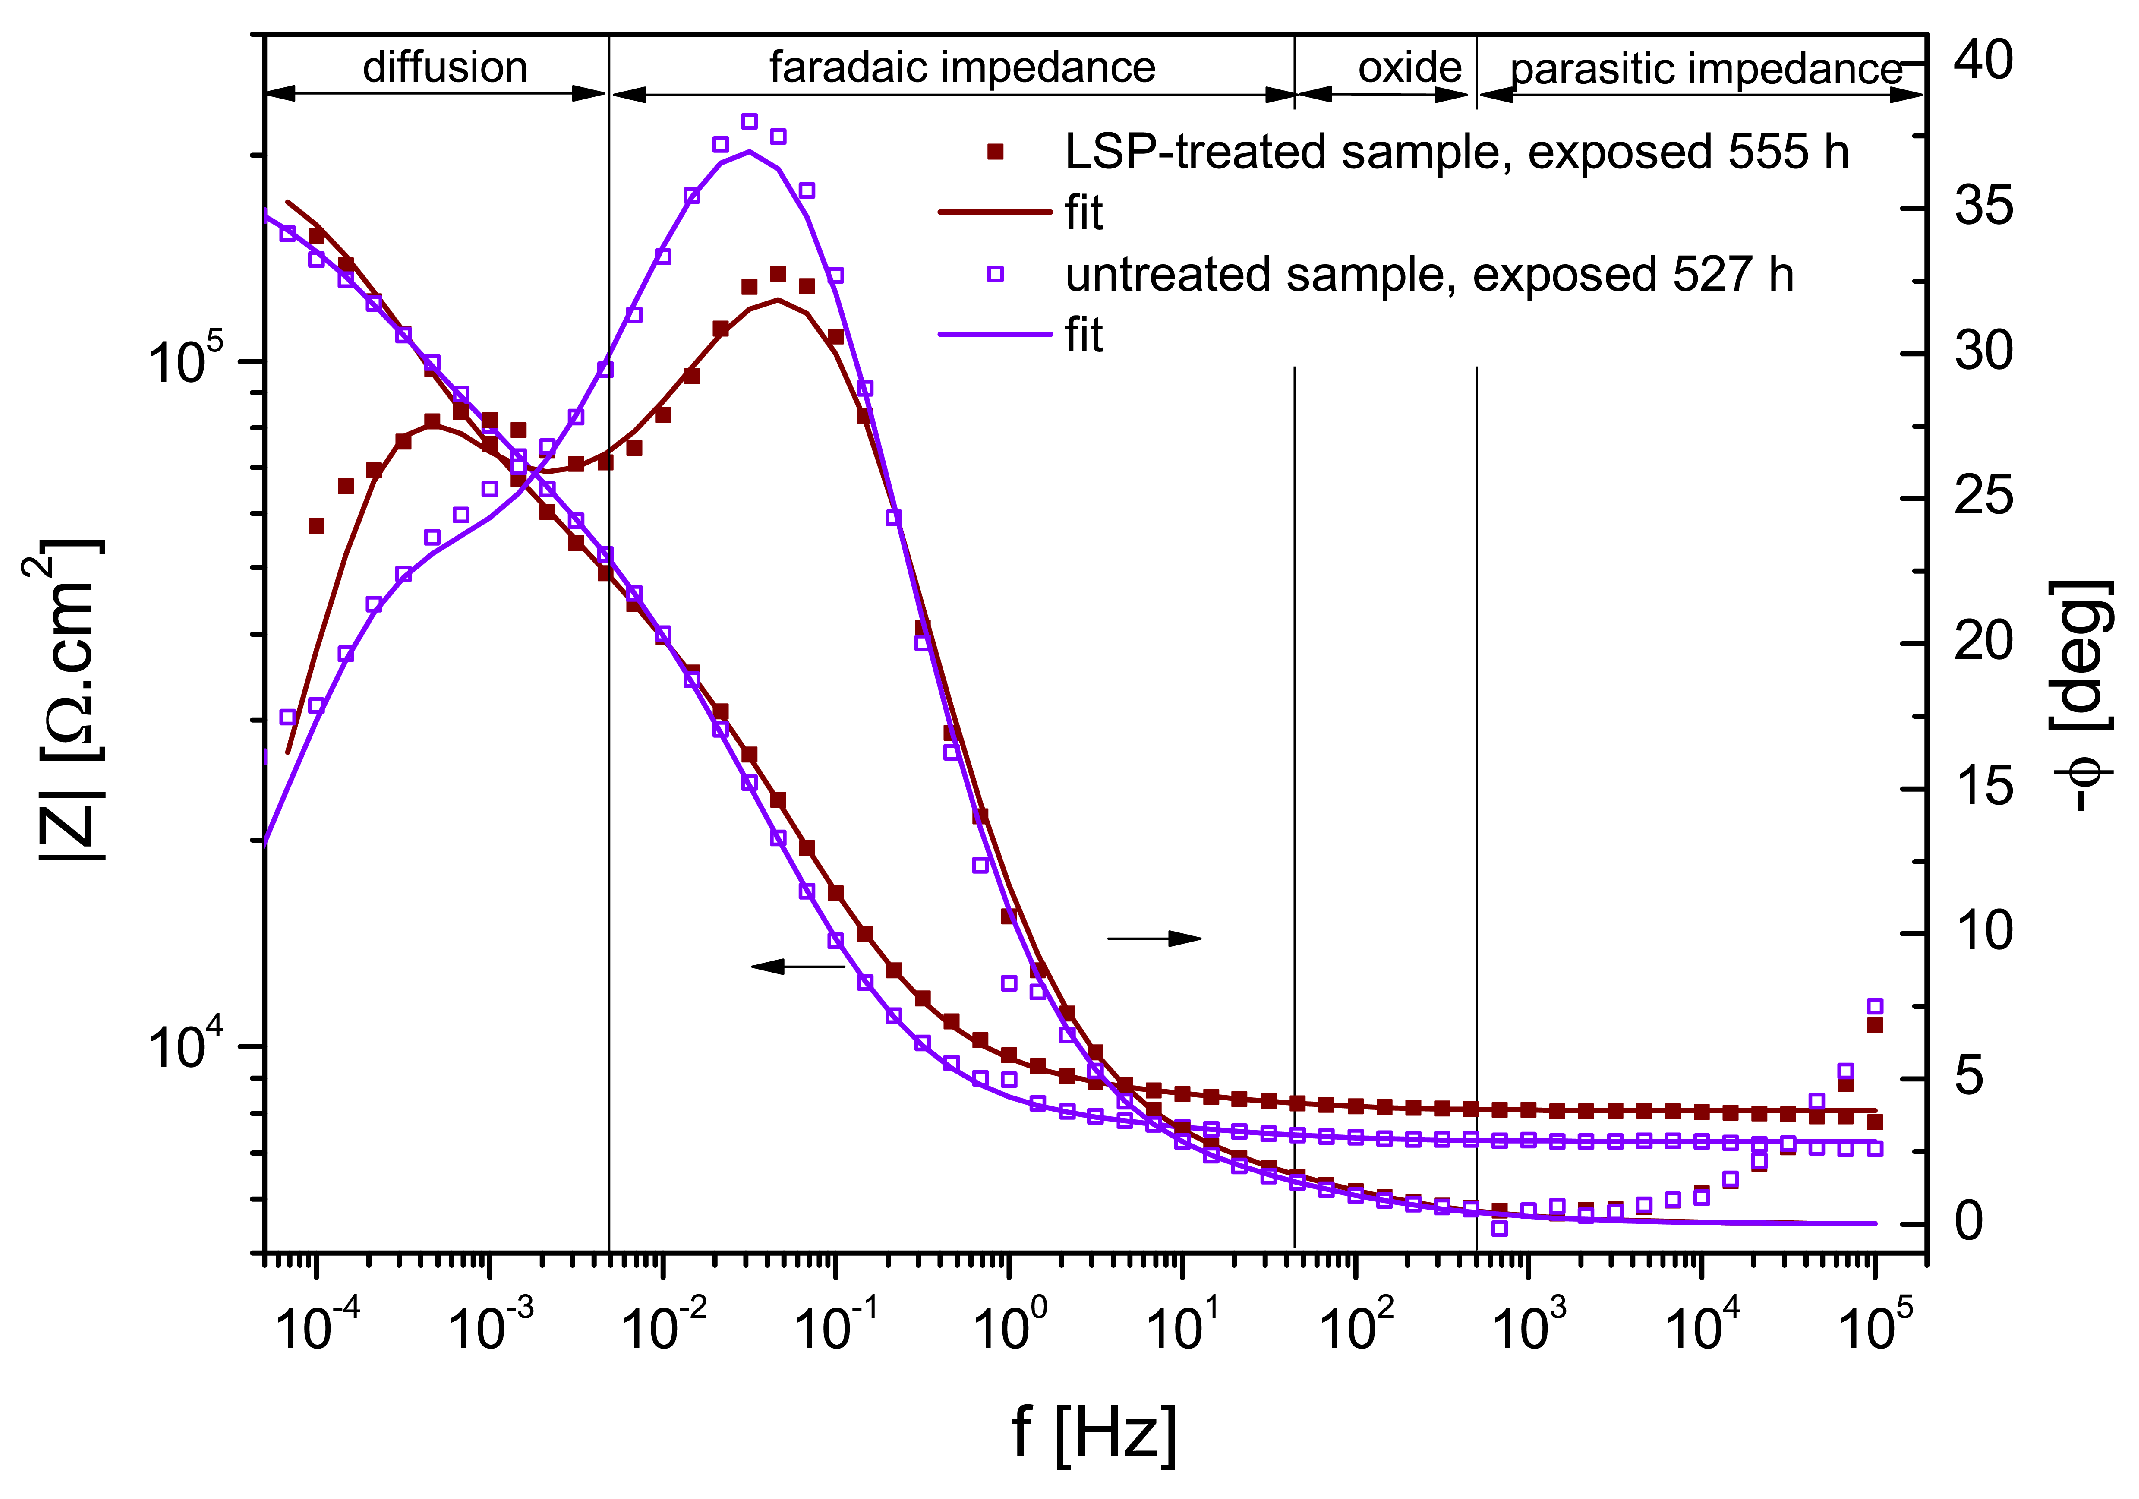
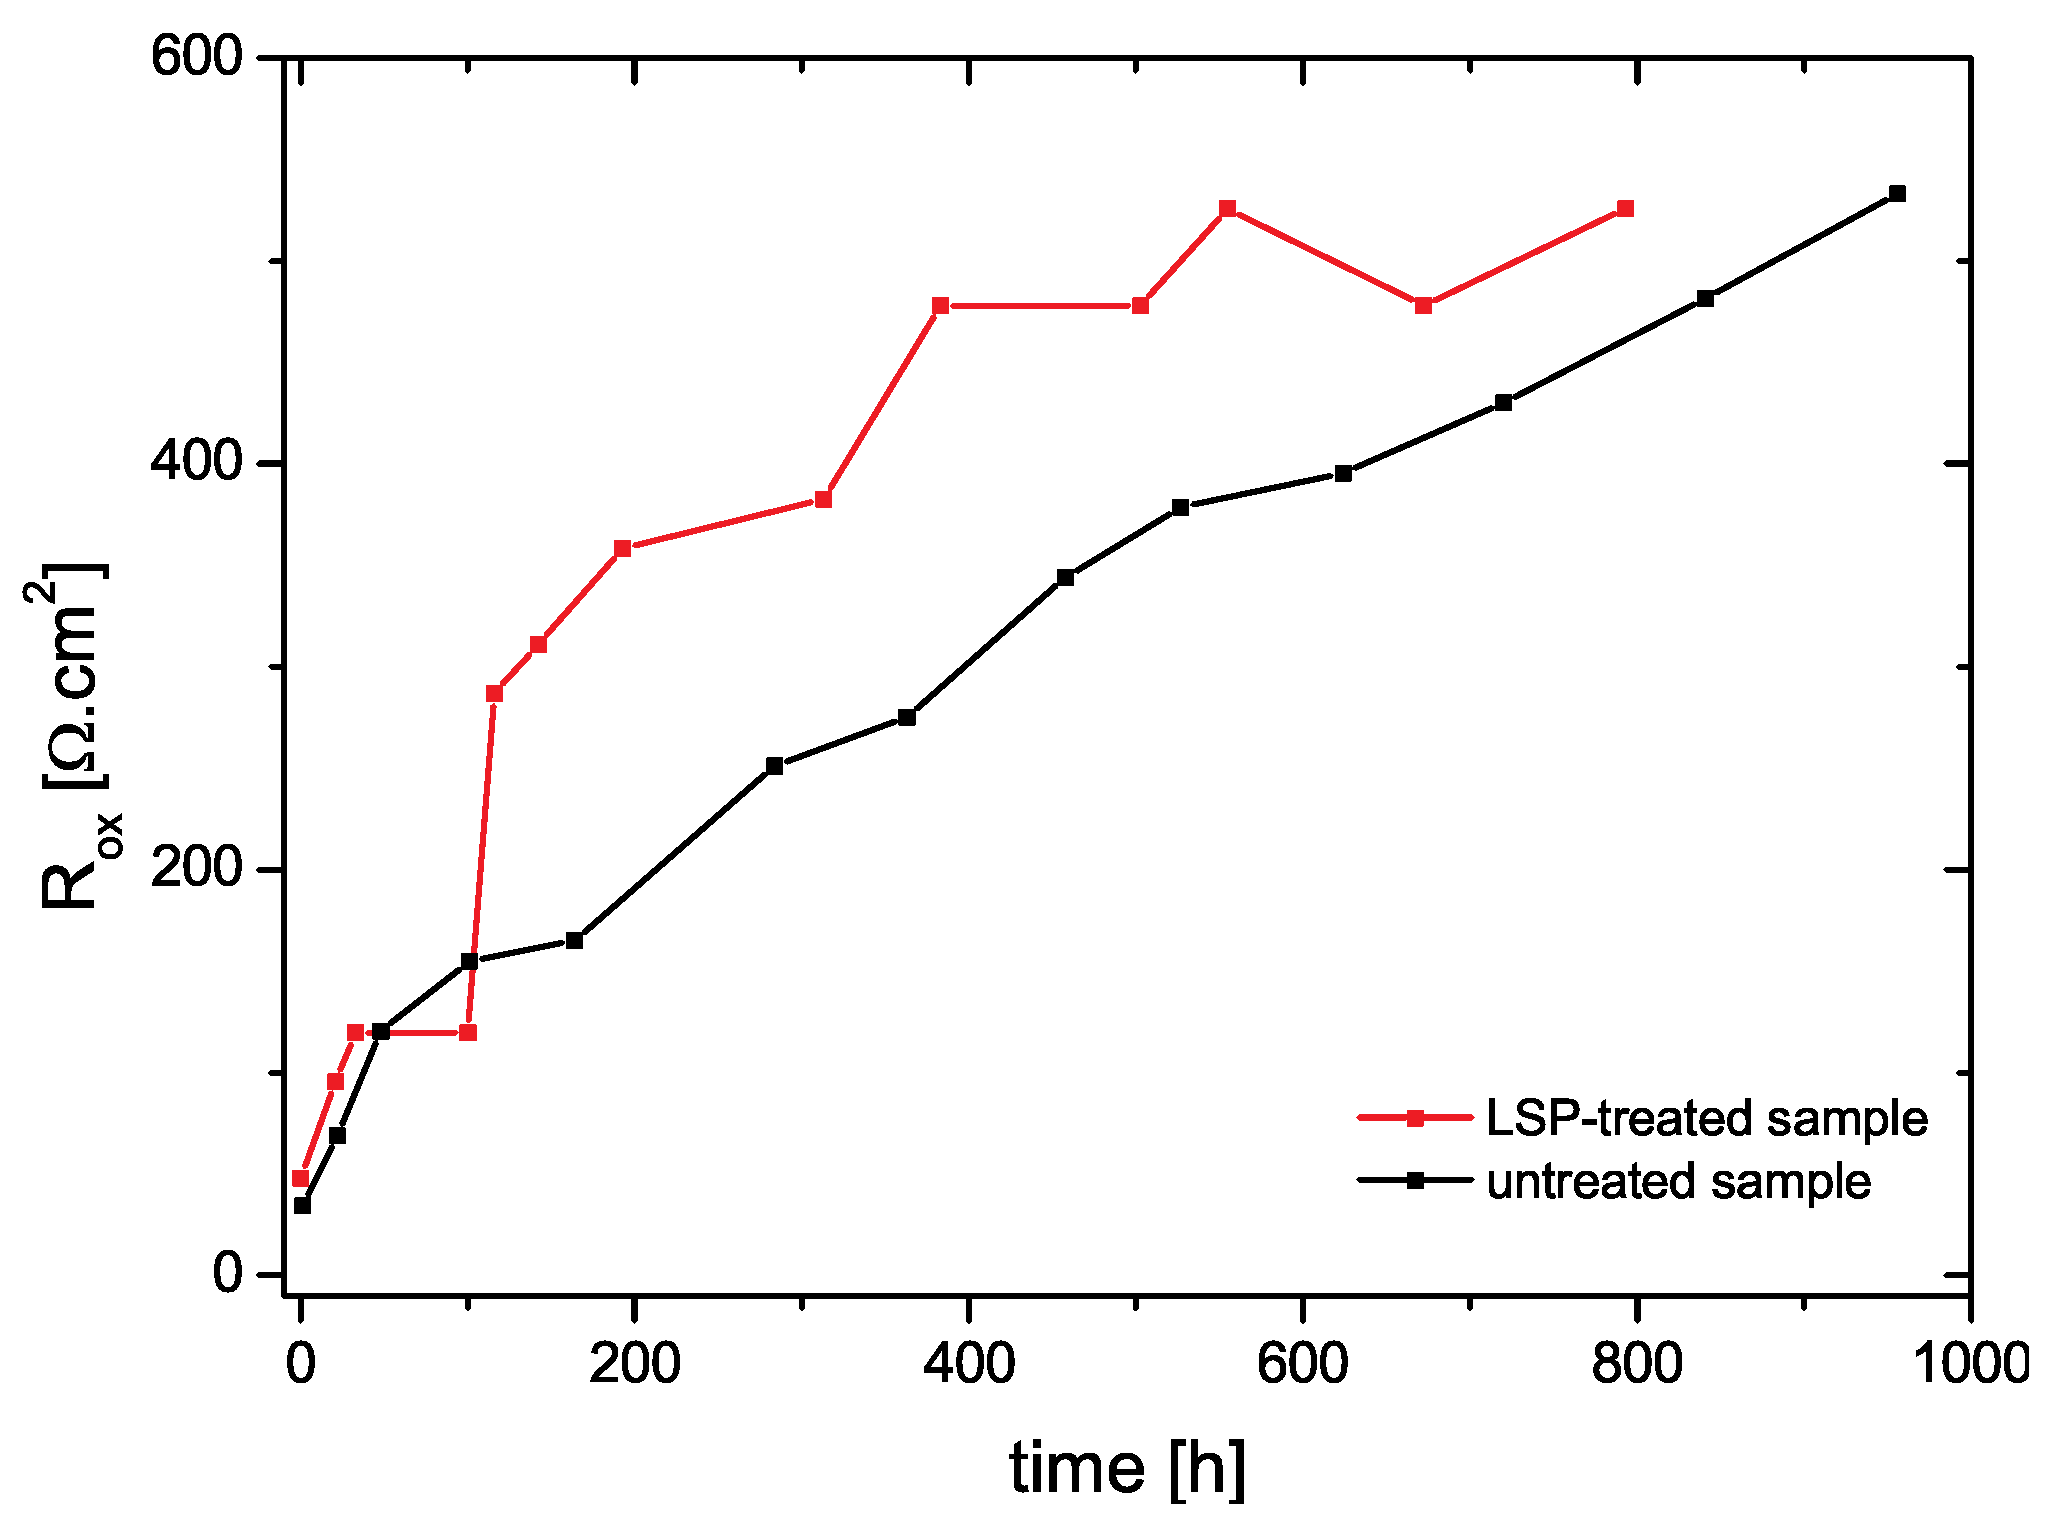
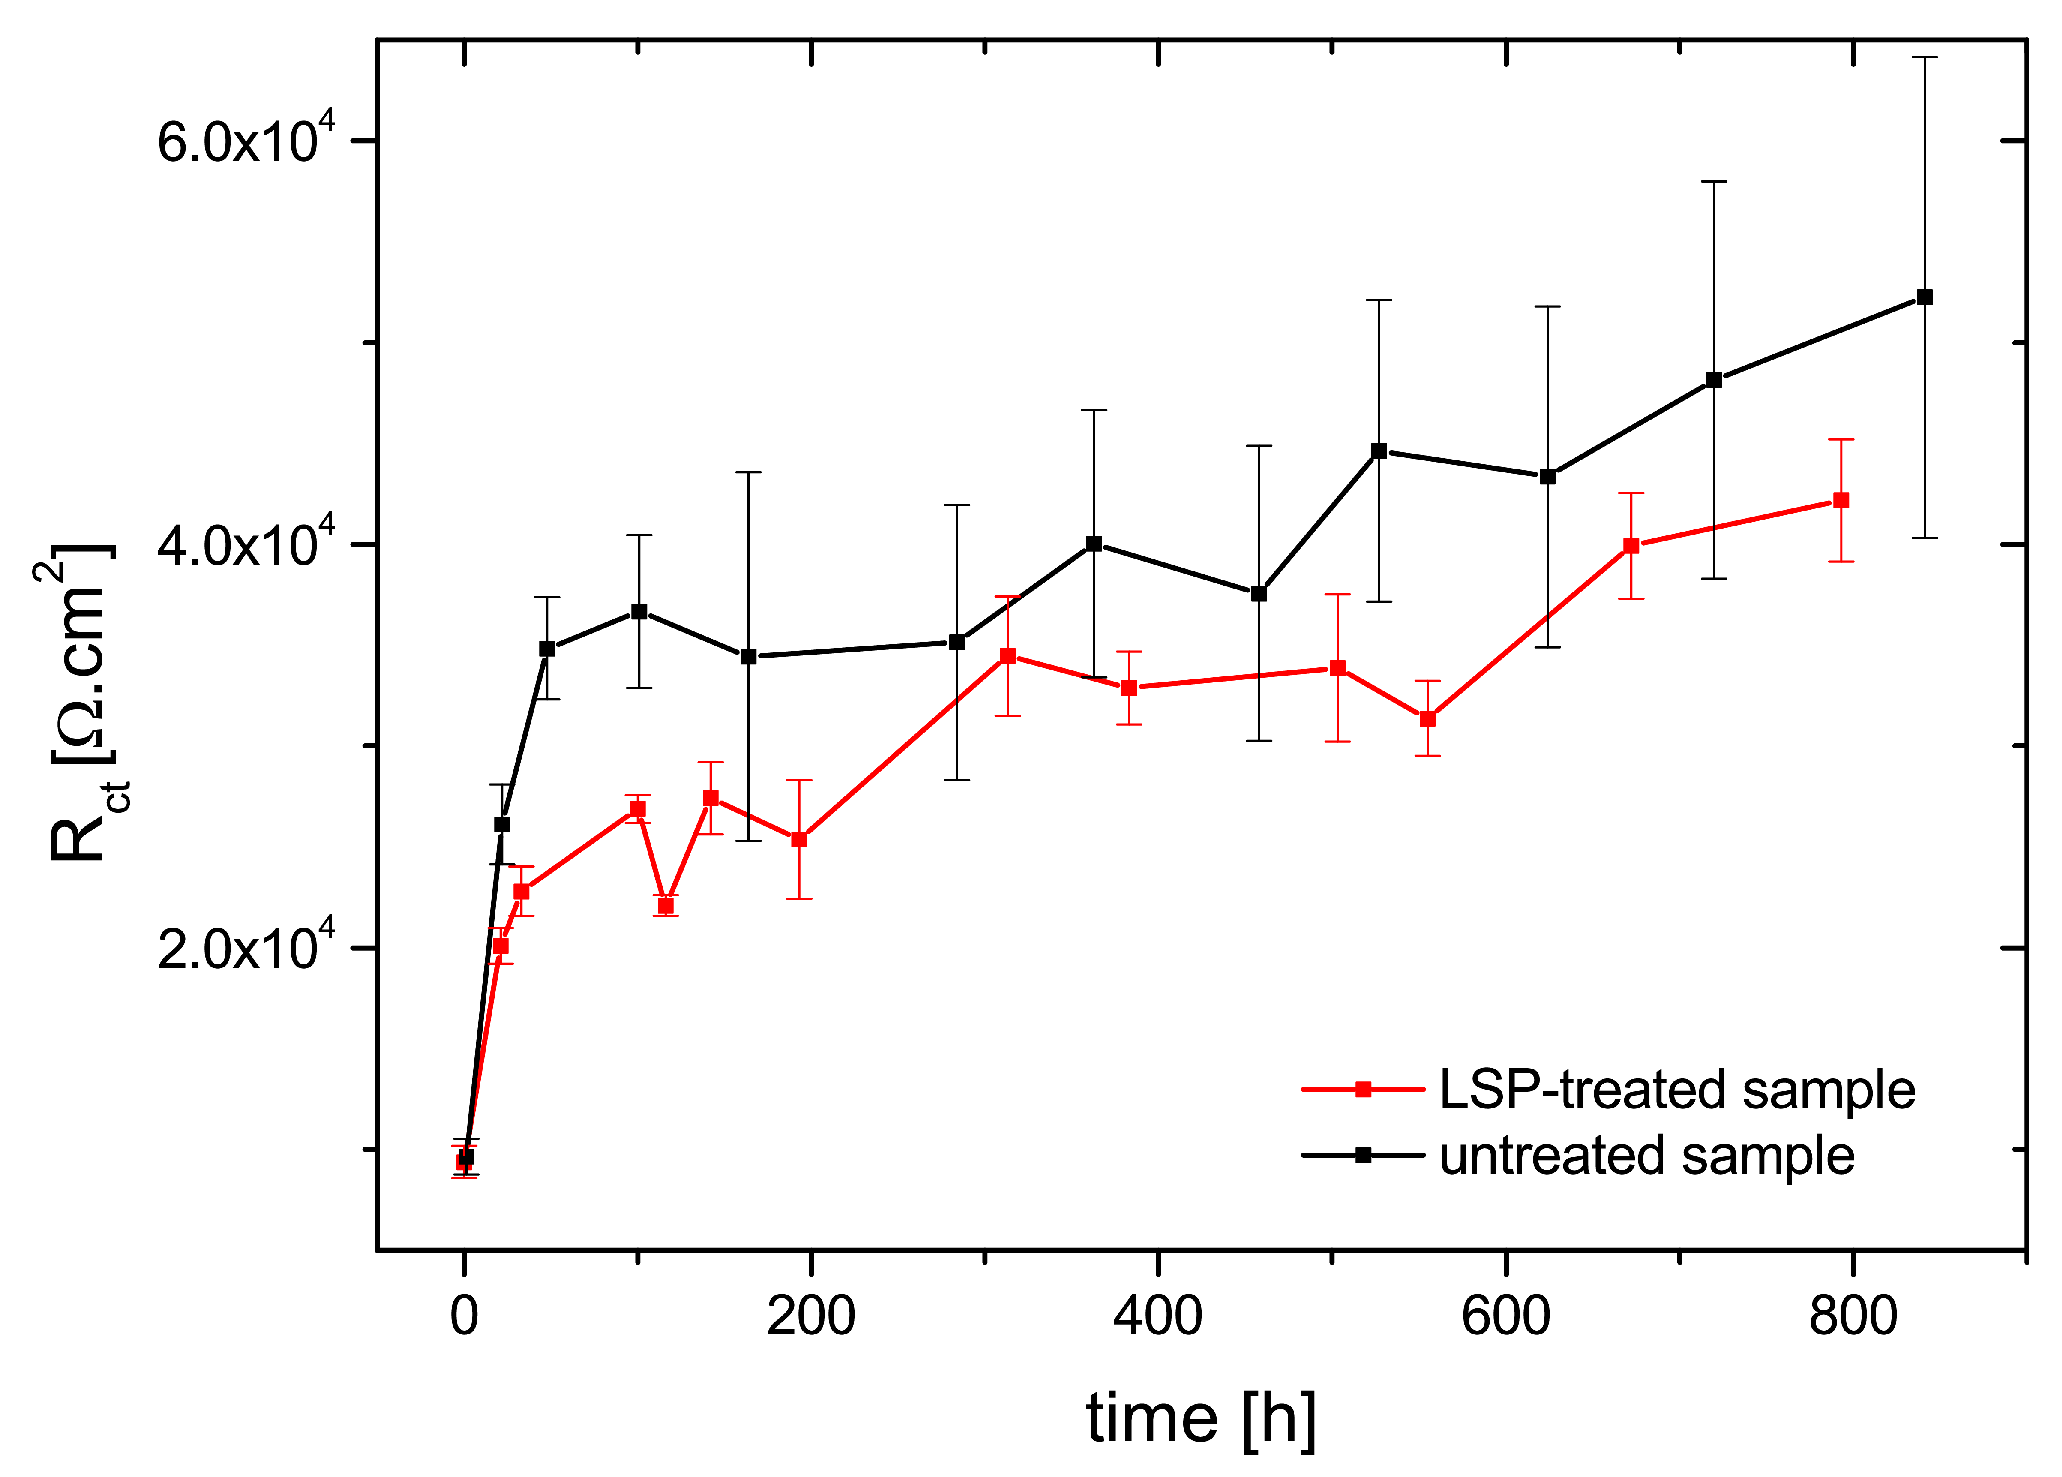
3.4. Electrochemical Impedance Spectroscopy Measurements

All impedance spectra were evaluated using the ZView software version 3.5 h by Scribner. The measured impedance spectra were all modelled using the impedance of the equivalent circuit shown in Figure 6.
In this circuit, R s represents the resistance of the environment. The time constant R o x C P E o x , apparent at high frequencies, represents the response of the oxide layer; as the oxides that grow on stainless steels are semiconductors, the measured resistance R o x ranges from about 2 to 3 orders of magnitude lower than the charge transfer resistance R c t found in low frequencies. Therefore, the response of the oxide layer was only found in a short interval of frequencies, between approximately 500 and 50 Hz. Furthermore, the software algorithm was unable to properly evaluate this time constant, finding it impossible to discern it from the much larger arc formed by the R c t C P E d l time constant at lower frequencies; hence, this time constant was manually evaluated.
A Nyquist diagram of an impedance spectrum measured on an LSP-treated sample after 555 h exposure is shown in Figure 7a, including the details of the oxide response and the result of its manual evaluation. Figure 7b shows the same impedance spectrum, together with an impedance spectrum of the untreated specimen, measured at 527 h. From the shape of the spectra, it may be concluded that the corrosion mechanism was unchanged by the laser treatment, although a large difference was measured in the overall corrosion rate between the two specimens, as will be discussed further. The same specta in Bode diagram are shown in Figure 8 (the time constants are separated by vertical lines).
The estimated values of the resistance of the oxide layer R o x vs. exposure time are plotted in Figure 9. The resistance of the oxide was slightly higher on the LSP-treated sample compared to the untreated sample, suggesting a thicker oxide layer; hence, the oxidation proceeded a little faster than it did in the former.
The second time constant, found at frequencies between approximately 50 Hz and 5 mHz, represents the parallel connection of the charge transfer (faradaic) resistance R c t and the non-ideal capacitance (CPE) of the double layer C P E d l , which characterize the corrosion process. As mentioned above, the charge transfer resistance R c t ranged from 2 to 3 orders of magnitude higher than the resistance of the oxide R o x ( R c t evolved from approximately 1 × 10⁴ Ωcm2 to 5 × 10⁴ Ωcm2, and R o x from approximately 30 Ωcm2 to 500 Ωcm2). R c t , which is inversely proportional to the corrosion rate, increased with increasing exposure time; the increase in R c t may be associated with the formation and growth of a protective oxide layer on the steel surface that hinders charge and mass transfer across the oxide layer and, therefore, lowers the corrosion rate. The evolution of R c t with exposure time is shown in Figure 10. This shows that the charge transfer resistance of the LSP-treated sample was slightly lower than that of the untreated sample at all exposure times, suggesting a higher corrosion rate for the LSP-treated sample.
The third time constant, represented in the equivalent circuit by the Warburg element, may be assigned to the diffusion of a species relevant to the corrosion process. Upon inspection of the spectra, a short line with a slope of 45°, typical of the standard Warburg impedance, is apparent at around 5 mHz to 1 mHz, however, at lower frequencies, this transitions into a semi-circle, typical behavior for the Finite Length Warburg (FLW) impedance. An approximation of the spectra revealed that the so-called fractal, or generalized, FLW impedance provides the best fit; deviations from the ideal behavior may be ascribed to frequency dispersion on an inhomogeneous surface. The FLW impedance typically appears in systems with a one-dimensional diffusion through a finite-length layer and fixed activity of the diffusing species at one interface. The fractal FLW impedance may be described by Equation (5) [30]:
Z f . F L W ω = Z 0 j ω τ 0 n tanh j ω τ 0 n , n 0.5
where Z 0 = R T l z 2 F 2 A C e q D ˜ d ln a d ln c , and τ 0 = l 2 D ˜
Z 0 represents the Warburg coefficient; in this case, the diffusion resistance at the low-frequency limit, j the imaginary unit, ω angular frequency, τ 0 the characteristic time constant, R universal gas constant, T temperature, l is the thickness of the diffusion layer, z charge of mobile ion, F Faraday constant, A the electrode surface, C e q the equilibrium concentration of the diffusing species, D ˜ the the chemical diffusion coefficient, a activity of diffusing species and c concentration of diffusing species. For n = 0.5, Equation (5) takes the form of the ‘ideal’ FLW impedance.
As the points at the lowest frequencies had to be discarded from evaluation, as discussed above, the results of the evaluation of the Warburg impedance were distorted by significant errors. There was no clear distinction between the values of the diffusion resistance between the untreated and the LSP-treated sample, as seen in Figure 11, as in the case of R o x and R c t . Although a clear assessment may not be possible at this point due to the above-mentioned errors, if we assume that the above-mentioned observations on the evolution of R c t and Z 0 are correct, the results would point to the conclusion of Yang et al. [31], who considered that the transport of defects through the oxide layer (diffusion) and the interfacial reactions on alloy 690 in a simulated PWR environment are not interconnected.
Figure 12b shows the evolution of an instantaneous corrosion rate that was calculated from impedance data using the Stern–Geary Equation (6). To calculate corrosion rate, a mixed charge transfer-diffusion control was assumed; hence, the polarization resistance in Equation (6) was calculated as the sum of the charge transfer and diffusion resistance (i.e., Z 0 ). The Tafel slopes were estimated from the measured polarization curves at 280 °C, as shown in Figure 12a. It is apparent that both samples exhibited passive behaviour; hence, the anodic Tafel slopes in both cases tended towards infinity. A Tafel extrapolation of the cathodic curves resulted in cathodic Tafel slopes in the untreated specimen β c u n t r e a t e d = 436.7   mV and that of the LSP-treated sample β c L S P t r e a t e d = 210.7   mV . The corrosion current density of the samples was calculated using the modified Stern–Geary equation for the case when β a :
i c o r r = | β c | 2.3 R P | β c |
where β c is the cathodic Tafel slope, and R p is the polarization resistance. The corrosion current densities were converted into mass loss in mg dm−2 using Faraday’s law.
The values of the integral corrosion rate of both specimens during the performed experiment (i.e., 1000 h) are given in Table 4, together with several data taken from the literature. In this study, the corrosion rate of the LSP-treated specimen was higher by a factor of 2.4 than that of the untreated specimen. It is necessary to note that even the untreated specimen is slightly cold-worked, as stated above, but the stresses are tensile in nature as opposed to the LSP-treated sample, which exhibited compressive stresses. From the listed corrosion rates, it can be concluded that any degree of cold work, irrespective of its nature (inducing tensile or compressive stresses), entails a higher corrosion rate in an aqueous electrolyte.

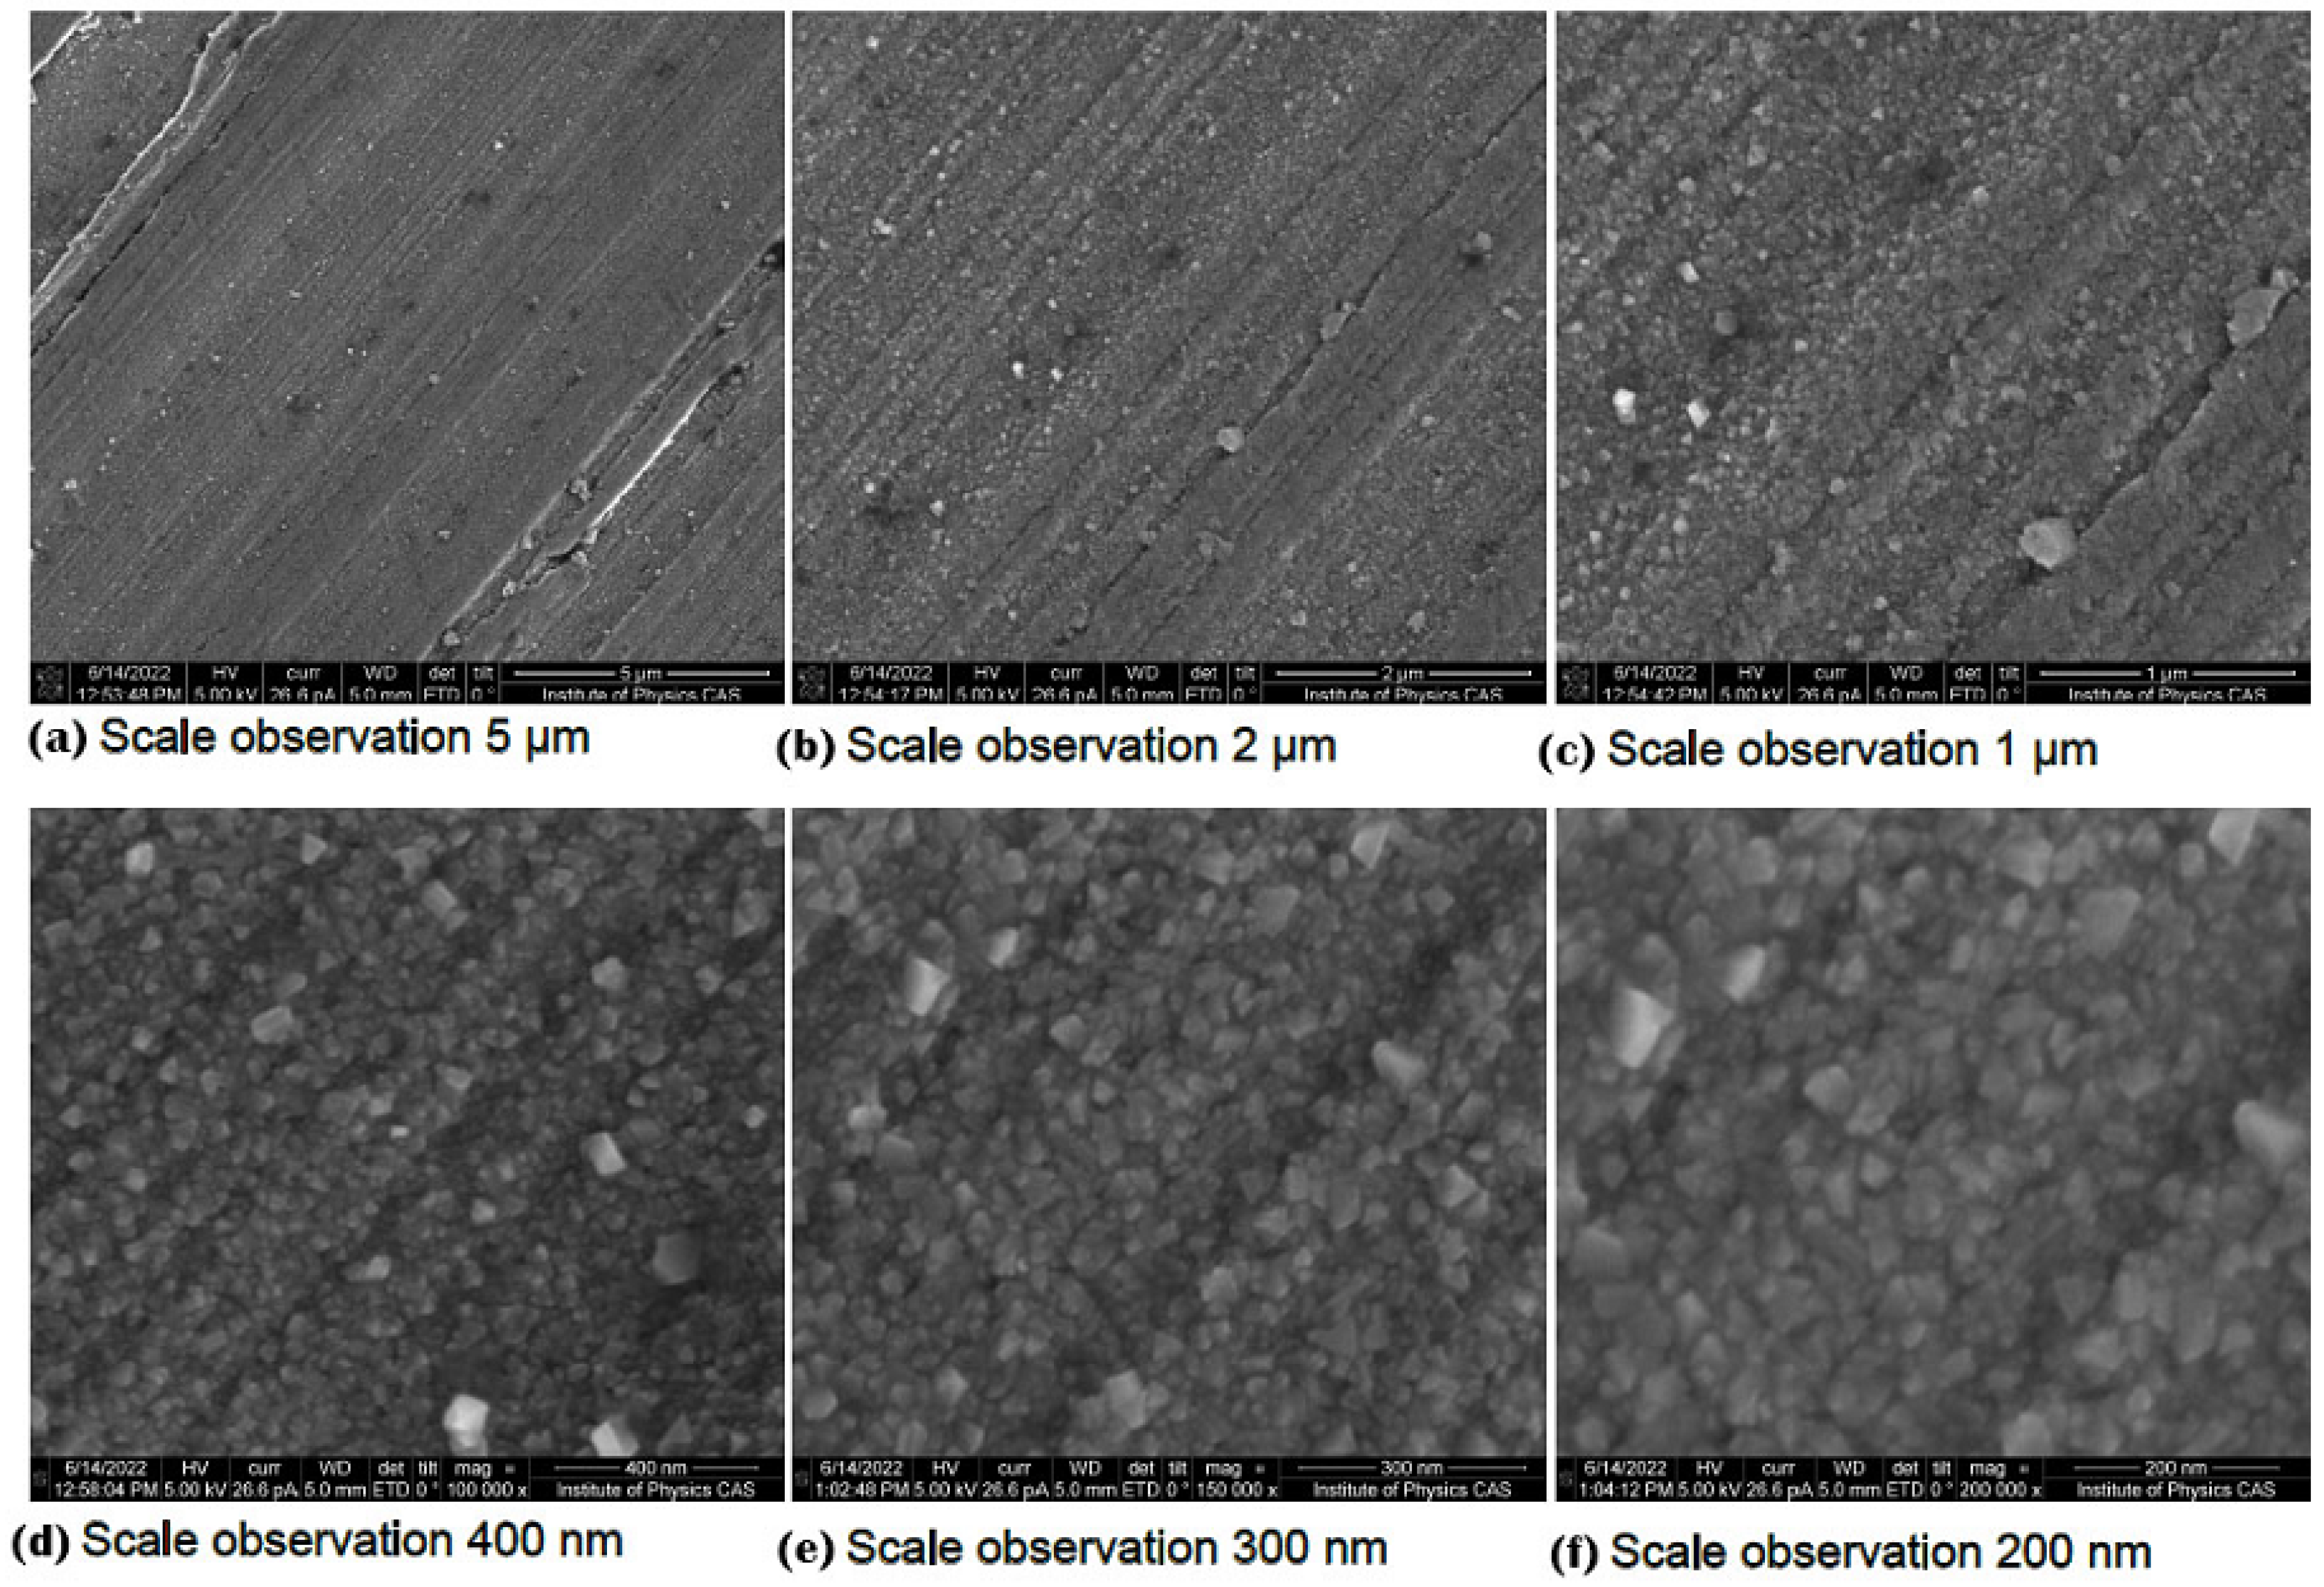
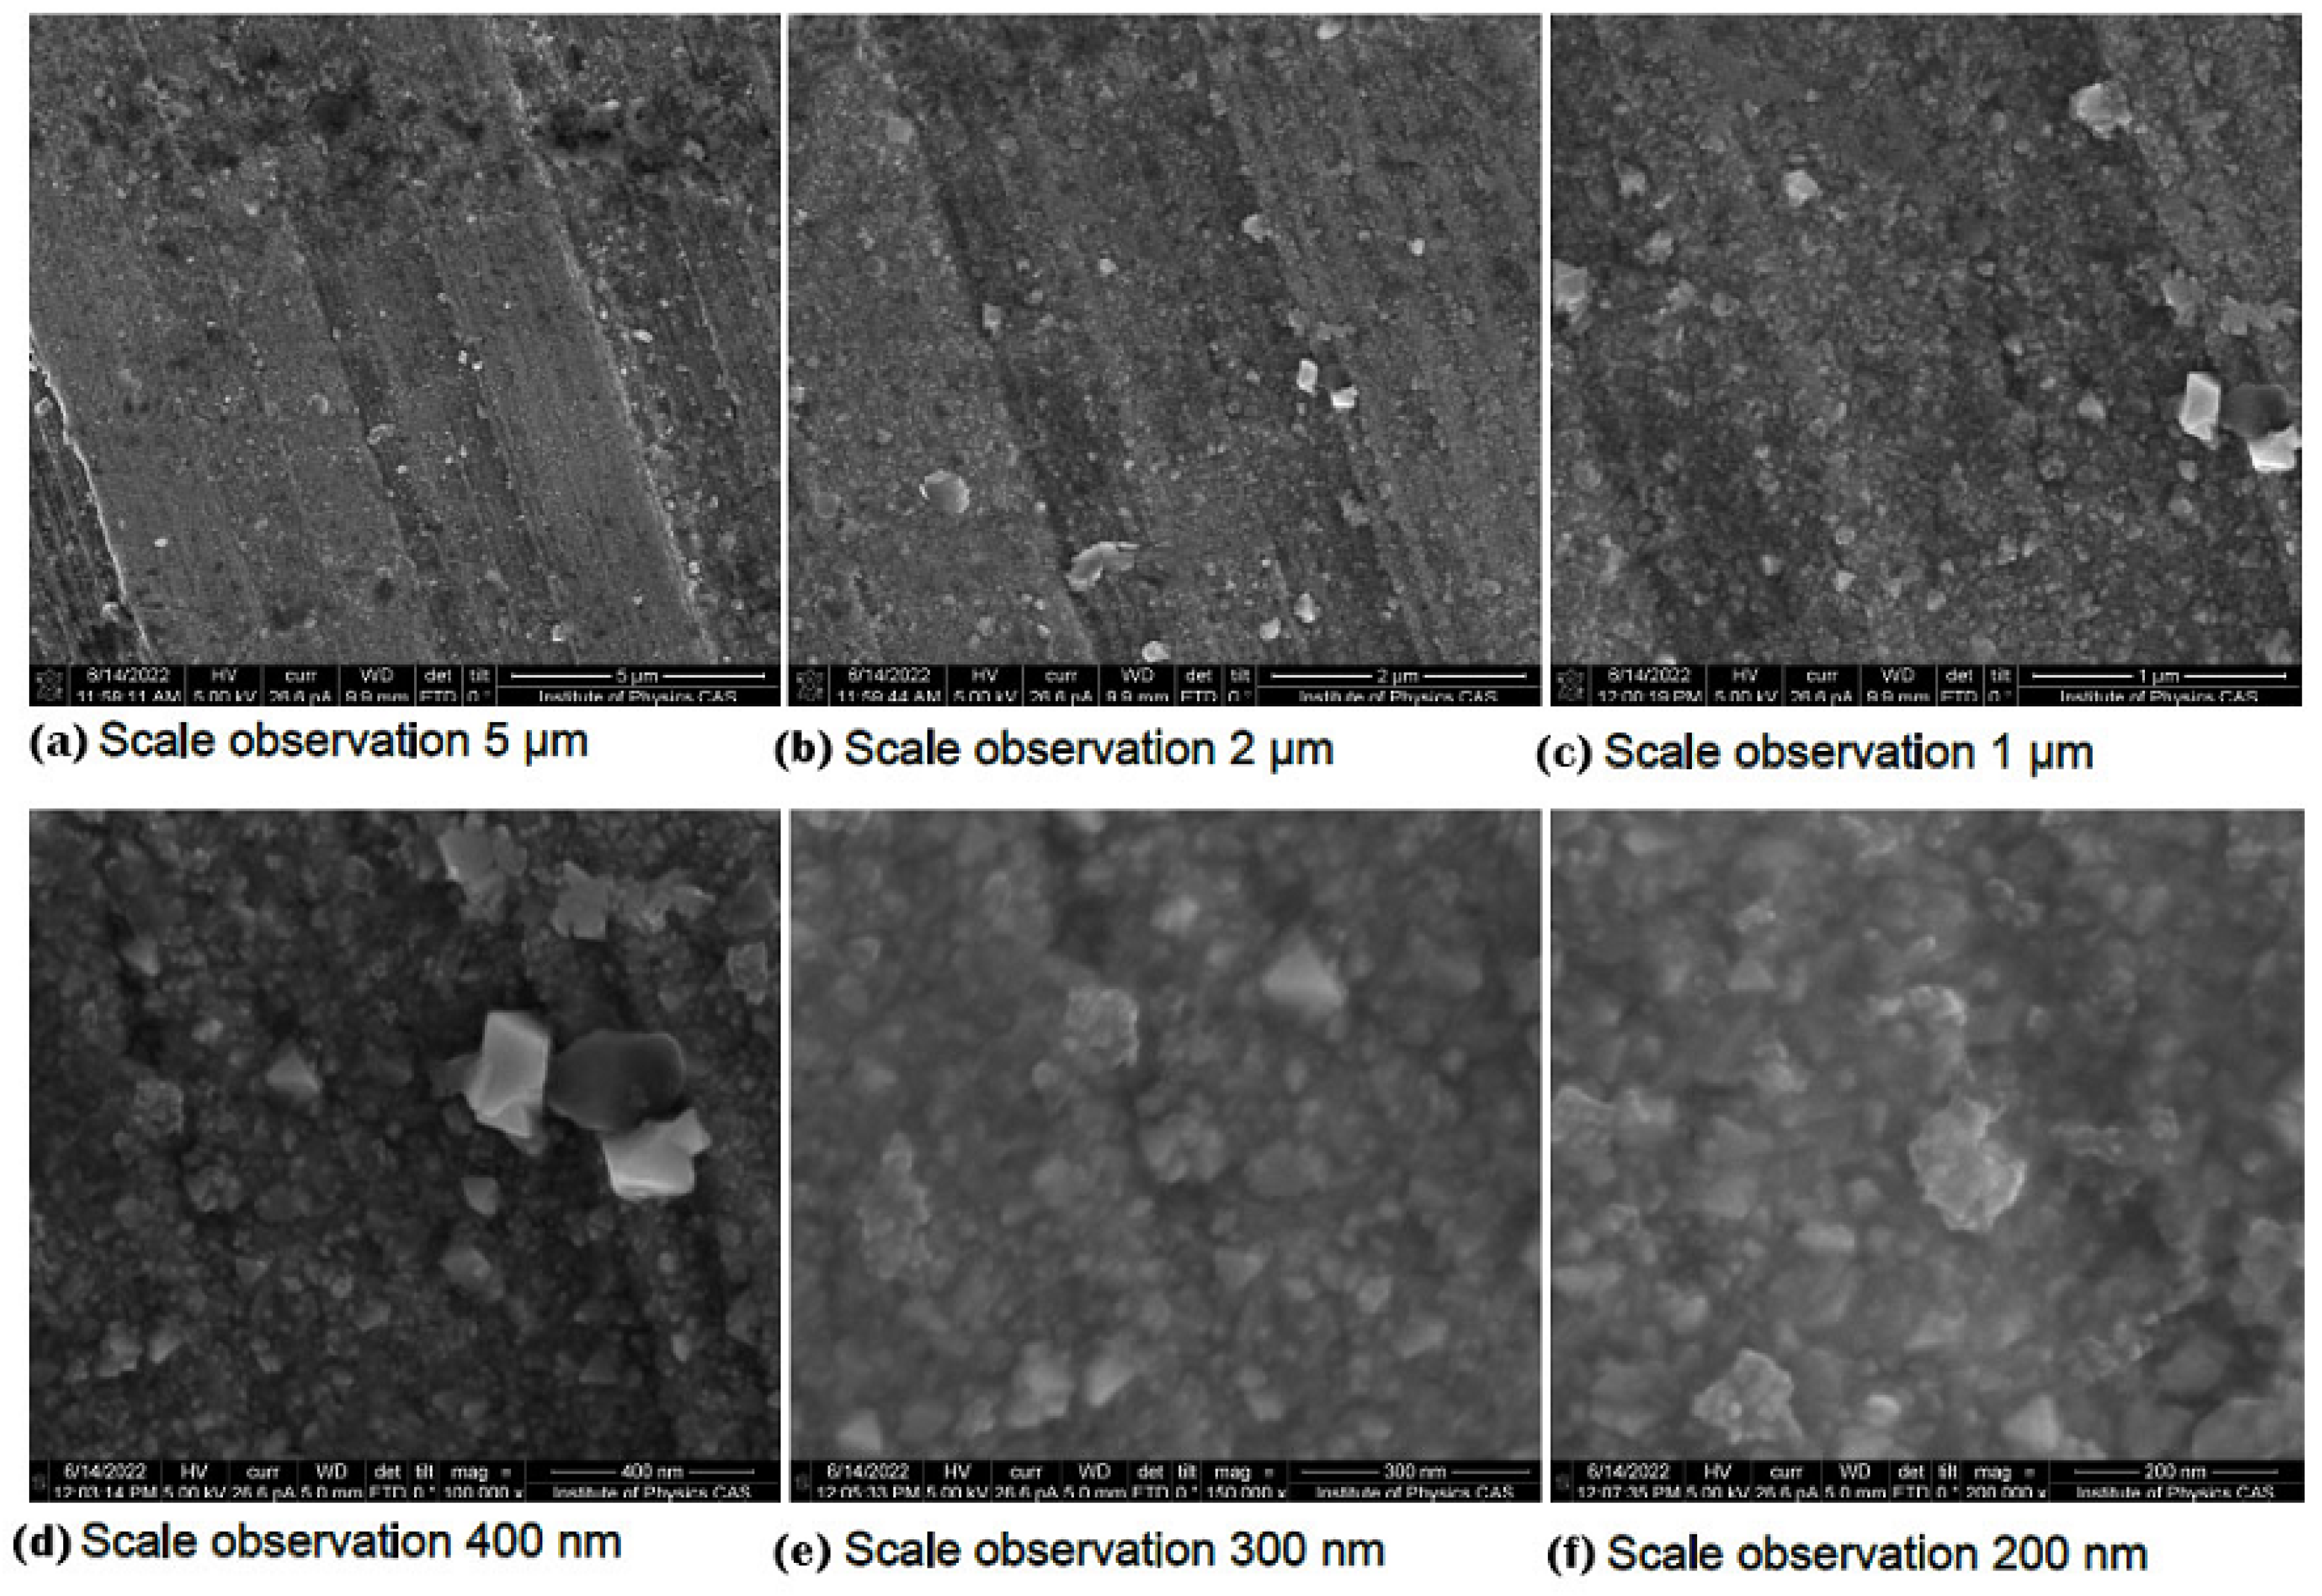
3.5. Surface Analysis with FEG-SEM

Figure 13 and Figure 14 show, at different magnifications, the surface oxide layer of untreated and LSP-treated specimens, respectively. The surface corrosion layer of the untreated specimen was more uniform and contained smaller crystals of the spinel oxides, whereas the LSP-treated specimen contained a broader range of crystal sizes. This seems to cohere with the observations of Ziemniak et al. [34] of oxide layers on AISI 304 in hydrogenated water at 260 °C, who reported a more compact oxide layer with smaller crystals, which existed in a narrow size range on an electropolished, strain-free sample. This contrasted with the oxide layer on a machined (cold-worked) sample, with larger crystals in a broad size range and a lower surface number density. The reported difference in corrosion rates between the electropolished and machined samples was greater by more than a factor of 3. Finally, Zemniak concludes that the oxide layer on the electropolished sample provided more protectivity owing to its smaller porosity. These conclusions seem to be relevant to the observations made in this study, supported by the evolution of the corrosion potential E c o r r shown in Figure 4 and Figure 5.

4. Conclusions

Electrochemical investigation, using in situ electrochemical impedance spectroscopy, of the corrosion behaviour of the stainless steel AISI 304L treated with laser shock peening (LSP), was performed in a simulated VVER environment at 280 °C and 8 MPa.
The AISI 304L samples were treated with LSP using a laser with 1.6 J energy and a 50% overlap. Both the untreated and LSP-treated samples were exposed for 1000 h in a simulated VVER environment during a single experiment in the autoclave.
Analysis of impedance spectra showed the presence of three time constants: the time constant at the highest frequencies was the response of the oxide layer. As the oxide layer on stainless steels is rather conductive, the relevant part of the spectra was manually evaluated. The second time constant present at medium frequencies was attributed to the faradaic impedance representative of the corrosion process. The time constant at the lowest frequencies was representative of the diffusion of species across the oxide layer, which participate in the corrosion reaction and the formation of the oxide layer.
The corrosion rate of the LSP-treated sample in the simulated VVER environment was found to be higher by a factor of 2.4 compared to the untreated sample, accompanied by the formation of a less protective oxide layer.
It can be assumed that any degree of cold work, irrespective of its nature, leads to a higher corrosion rate in an high-temperature aqueous electrolyte.

Author Contributions

Conceptualization, X.A., M.A.-R.; methodology, X.A., M.A.-R., J.M. (Jan Macák); formal analysis, X.A., M.A.-R., J.M. (Jan Macák); investigation, X.A., M.A.-R.; resources, J.M. (Jan Maňák), R.K., M.A., J.M. (Jan Macák), A.V., J.B.; writing—original draft preparation, X.A., M.A.-R.; writing—review and editing, M.A., R.K., J.M. (Jan Macák). All authors have read and agreed to the published version of the manuscript.

Funding

This work was supported by the Centre of Excellence for Nonlinear Dynamic Behaviour of Advanced Materials in Engineering CZ.02.1.01/0.0/0.0/15_003/0000493 (Excellent Research Teams) in the framework of Operational Programme Research, Development and Education within institutional support RVO:61388998. This work was supported by the grant projects with No. 22-00863K of the Czech Science Foundation (CSF) within institutional support RVO:61388998. This work received funding from EU Horizon 2020 Programme of EURATOM (H2020-NFRP-2019/2020) under grant agreement n°945234 (ECC-SMART). This work was supported by European Structural and Investing Funds, Operational Programme Research, Development and Education (Grant agreement NO CZ.02.1.01/0.0/0.0/15_006/ 0000674) and from the European Union’s Horizon 2020 research and innovation programme (Grant agreement NO 739573). This work was supported from the grant of Specific University Research – No. A1-FTOP-2022-001 by the Ministry of Education, Youth and Sports of the Czech Republic.

Institutional Review Board Statement

Not applicable.

Informed Consent Statement

Not applicable.

Data Availability Statement

Not applicable.

Conflicts of Interest

The authors declare no conflict of interest.

Abbreviations

The following abbreviations are used in this manuscript:
LSPLaser Shock Peening
EISElectrochemical Impedance Spectroscopy
RSresidual stress
XRDX-ray diffractometer
Scanlaser scan direction
TScantransverse laser scan direction
Aelectrode surface
aactivity of diffusing species
cconcentration of diffusing species
C e f f effective capacitance
C e f f a s r e c effective capacitance for untreated specimen
C e f f p o l i s h e d effective capacitance for diamond polished specimen
C e f f L S P effective capacitance for LSP-treated specimen
C e q equilibrium concentration of the diffusing species
CPEconstant phase element
C P E o x constant phase element of the oxide layer
C P E d l constant phase element of the double layer
D ˜ chemical diffusion coefficient
FLWFinite Length Warburg
FFaraday constant
E c o r r corrosion potential
jimaginary unit
lthickness of the diffusion layer
nCPE exponent
QCPE coefficient
R universal gas constant R F a s r e c roughness factor for as-received specimen
R F L S P roughness factor for LSP-treated specimen
R s resistance of the environment
R 1 faradaic resistance of the double layer
R P polarization resistance
R o x resistance of the oxide layer
R c t resistance of charge transfer
T temperature zcharge of mobile ion
Z f . F L W fractal FLW impedance
Z 0 Warburg coefficient
β c cathodic Tafel slope
τ 0 characteristic time constant
ω angular frequency
Z C P E impedance of the CPE

References

  1. Clauer, A.H. Laser Shock Peening, the Path to Production. Metals 2019, 9, 626. [Google Scholar] [CrossRef] [Green Version]
  2. Zhang, L.; Zhang, Y.; Lu, J.; Dai, F.; Feng, A.; Luo, K.; Zhong, J.; Wang, Q.; Luo, M.; Qi, H. Effects of laser shock processing on electrochemical corrosion resistance of ANSI 304 stainless steel weldments after cavitation erosion. Corros. Sci. 2013, 66, 5–13. [Google Scholar] [CrossRef]
  3. Telang, A.; Gill, A.S.; Kumar, M.; Teysseyre, S.; Qian, D.; Mannava, S.R.; Vasudevan, V.K. Iterative thermomechanical processing of alloy 600 for improved resistance to corrosion and stress corrosion cracking. Acta Mater. 2016, 113, 180–193. [Google Scholar] [CrossRef] [Green Version]
  4. Peyre, P.; Fabbro, R.; Merrien, P.; Lieurade, H. Laser shock processing of aluminium alloys. Application to high cycle fatigue behaviour. Mater. Sci. Eng. A 1996, 210, 102–113. [Google Scholar] [CrossRef]
  5. Sano, Y.; Mukai, N.; Okazaki, K.; Obata, M. Residual stress improvement in metal surface by underwater laser irradiation. Nucl. Instrum. Methods Phys. Res. Sect. B Beam Interact. Mater. Atoms 1997, 121, 432–436. [Google Scholar] [CrossRef]
  6. Ambartsu, R.; Basov, N.; Boiko, V.; Zuev, V.; Krokhin, O.; Kryukov, P.; Senatski, Y.; Stoilov, Y. Heating of matter by focused laser radiation. Sov. J. Exp. Theor. Phys. 1965, 21, 1061–1064. [Google Scholar]
  7. Mora, P. Theoretical model of absorption of laser light by a plasma. Phys. Fluids 1982, 25, 1051. [Google Scholar] [CrossRef]
  8. Scius-Bertrand, M.; Videau, L.; Rondepierre, A.; Lescoute, E.; Rouchausse, Y.; Kaufman, J.; Rostohar, D.; Brajer, J.; Berthe, L. Laser induced plasma characterization in direct and water confined regimes: New advances in experimental studies and numerical modelling. J. Phys. D Appl. Phys. 2021, 54, 055204. [Google Scholar] [CrossRef]
  9. Peyre, P.; Fabbro, R. Laser shock processing: A review of the physics and applications. Opt. Quantum Electron. 1995, 27, 1213–1229. [Google Scholar]
  10. Fabbro, R.; Fournier, J.; Ballard, P.; Devaux, D.; Virmont, J. Physical study of laser-produced plasma in confined geometry. J. Appl. Phys. 1990, 68, 775–784. [Google Scholar] [CrossRef]
  11. Ballard, P.; Fournier, J.; Fabbro, R.; Frelat, J. Residual stress induced by laser-shocks. J. Phys. IV 1991, 01, C3-487–C3-494. [Google Scholar] [CrossRef]
  12. Fairand, B.P.; Clauer, A.H. Laser generation of high-amplitude stress waves in materials. J. Appl. Phys. 1979, 50, 1497–1502. [Google Scholar] [CrossRef]
  13. Geng, Y.; Dong, X.; Wang, K.; Yan, X.; Duan, W.; Fan, Z.; Wang, W.; Mei, X. Effect of microstructure evolution and phase precipitations on hot corrosion behavior of IN718 alloy subjected to multiple laser shock peening. Surf. Coat. Technol. 2019, 370, 244–254. [Google Scholar] [CrossRef]
  14. Rai, A.K.; Biswal, R.; Gupta, R.K.; Rai, S.K.; Singh, R.; Goutam, U.K.; Ranganathan, K.; Ganesh, P.; Kaul, R.; Bindra, K.S. Enhancement of oxidation resistance of modified P91 grade ferritic-martensitic steel by surface modification using laser shock peening. Appl. Surf. Sci. 2019, 495, 143611. [Google Scholar] [CrossRef]
  15. Trdan, U.; Skarba, M.; Grum, J. Laser shock peening effect on the dislocation transitions and grain refinement of Al–Mg–Si alloy. Mater. Charact. 2014, 97, 57–68. [Google Scholar] [CrossRef]
  16. Wang, C.; Luo, K.; Bu, X.; Su, Y.; Cai, J.; Zhang, Q.; Lu, J. Laser shock peening-induced surface gradient stress distribution and extension mechanism in corrosion fatigue life of AISI 420 stainless steel. Corros. Sci. 2020, 177, 109027. [Google Scholar] [CrossRef]
  17. Wei, X.; Zhang, C.; Ling, X. Effects of laser shock processing on corrosion resistance of AISI 304 stainless steel in acid chloride solution. J. Alloys Compd. 2017, 723, 237–242. [Google Scholar] [CrossRef]
  18. Lu, J.; Han, B.; Cui, C.; Li, C.; Luo, K. Electrochemical and pitting corrosion resistance of AISI 4145 steel subjected to massive laser shock peening treatment with different coverage layers. Opt. Laser Technol. 2017, 88, 250–262. [Google Scholar] [CrossRef] [Green Version]
  19. Chukwuike, V.; Echem, O.; Prabhakaran, S.; AnandKumar, S.; Barik, R. Laser shock peening (LSP): Electrochemical and hydrodynamic investigation of corrosion protection pre-treatment for a copper surface in 3.5 % NaCl medium. Corros. Sci. 2021, 179, 109156. [Google Scholar] [CrossRef]
  20. Peyre, P.; Scherpereel, X.; Berthe, L.; Carboni, C.; Fabbro, R.; Béranger, G.; Lemaitre, C. Surface modifications induced in 316L steel by laser peening and shot-peening. Influence on pitting corrosion resistance. Mater. Sci. Eng. A 2000, 280, 294–302. [Google Scholar] [CrossRef]
  21. John, M.; Kalvala, P.R.; Misra, M.; Menezes, P.L. Peening Techniques for Surface Modification: Processes, Properties, and Applications. Materials 2021, 14, 3841. [Google Scholar] [CrossRef] [PubMed]
  22. Siddaiah, A.; Mao, B.; Liao, Y.; Menezes, P.L. Surface characterization and tribological performance of laser shock peened steel surfaces. Surf. Coat. Technol. 2018, 351, 188–197. [Google Scholar] [CrossRef]
  23. Maleki, E.; Unal, O.; Guagliano, M.; Bagherifard, S. The effects of shot peening, laser shock peening and ultrasonic nanocrystal surface modification on the fatigue strength of Inconel 718. Mater. Sci. Eng. A 2021, 810, 141029. [Google Scholar] [CrossRef]
  24. Gujba, A.; Medraj, M. Laser Peening Process and Its Impact on Materials Properties in Comparison with Shot Peening and Ultrasonic Impact Peening. Materials 2014, 7, 7925–7974. [Google Scholar] [CrossRef] [Green Version]
  25. Lu, J.; Qi, H.; Luo, K.; Luo, M.; Cheng, X. Corrosion behaviour of AISI 304 stainless steel subjected to massive laser shock peening impacts with different pulse energies. Corros. Sci. 2014, 80, 53–59. [Google Scholar] [CrossRef]
  26. Guzonas, D.; Cook, W. Cycle chemistry and its effect on materials in a supercritical water-cooled reactor: A synthesis of current understanding. Corros. Sci. 2012, 65, 48–66. [Google Scholar] [CrossRef]
  27. Penttilä, S.; Toivonen, A.; Li, J.; Zheng, W.; Novotny, R. Effect of surface modification on the corrosion resistance of austenitic stainless steel 316L in supercritical water conditions. J. Supercrit. Fluids 2013, 81, 157–163. [Google Scholar] [CrossRef]
  28. Lozano-Perez, S.; Kruska, K.; Iyengar, I.; Terachi, T.; Yamada, T. The role of cold work and applied stress on surface oxidation of 304 stainless steel. Corros. Sci. 2012, 56, 78–85. [Google Scholar] [CrossRef]
  29. Rostohar, D.; Arnoult, X.; Böhm, M.; Brajer, J.; Kaufman, J.; Zulić, S.; Mocek, T. HILASE center: Development of new-generation lasers for laser shock peening. In Proceedings of the Advanced Laser Processing and Manufacturing II; Liu, J., Hong, M., Xiao, R., Eds.; SPIE: Beijing, China, 2018; p. 31. [Google Scholar] [CrossRef]
  30. Boukamp, B.A. Derivation of a Distribution Function of Relaxation Times for the (fractal) Finite Length Warburg. Electrochim. Acta 2017, 252, 154–163. [Google Scholar] [CrossRef]
  31. Yang, J.; Li, Y.; Xu, A.; Fekete, B.; Macdonald, D.D. The electrochemical properties of alloy 690 in simulated pressurized water reactor primary water: Effect of temperature. J. Nucl. Mater. 2019, 518, 305–315. [Google Scholar] [CrossRef]
  32. Maekawa, T.; Kagawa, M.; Nakajima, N. Corrosion Behaviors of Stainless Steel in High-Temperature Water and Superheated Steam. Trans. Jpn. Inst. Met. 1968, 9, 130–136. [Google Scholar] [CrossRef]
  33. Ziemniak, S.; Hanson, M. Corrosion behavior of 304 stainless steel in high temperature, hydrogenated water. Corros. Sci. 2002, 44, 2209–2230. [Google Scholar] [CrossRef] [Green Version]
  34. Ziemniak, S.E.; Hanson, M.; Sander, P.C. Electropolishing effects on corrosion behavior of 304 stainless steel in high temperature, hydrogenated water. Corros. Sci. 2008, 50, 2465–2477. [Google Scholar] [CrossRef]
Figure 1. Principle of LSP processing.
Metals 12 01702 g001
Figure 2. Principle laser path, direction and overlapping of peened area.
Metals 12 01702 g002
Figure 3. Experimental loop: (1) argon bottle, (2) water closure, (3) level measurement, (4) storage vessel, (5) oximeter, (6) pump of oximeter, (7) pressure pump, (8) safety valve, (9) and (10) valve, (11) preheating, (12) reference electrode, (13) entry into the autoclave, (14) output from the autoclave, (15) autoclave, (16) heating, (17) temperature sensors, (18) cooler, (19) hydro-accumulator, (20) pressure sensor, (21) filter, (22) pressure control, (23) working electrode, (24) pseudo-reference electrode, (25) counter electrode.
Metals 12 01702 g003
Figure 4. Evolution of corrosion potential E c o r r on oxidized surfaces after exposure testing in autoclave of untreated AISI-304L.
Metals 12 01702 g004
Figure 5. Evolution of corrosion potential E c o r r on oxidized surfaces after exposure testing in autoclave of LSP-treated AISI-304L.
Metals 12 01702 g005
Figure 6. Equivalent circuit used to model the measured impedance spectra.
Metals 12 01702 g006
Figure 7. (a) Manual evaluation of the high-frequency part of the spectrum, representing the response of the oxide layer, is shown in detail. (b) Impedance spectra in Nyquist diagram of LSP-treated sample exposed for 555 h and untreated sample exposed for 527 h.
Metals 12 01702 g007
Figure 8. Impedance spectra in Bode diagram of LSP-treated sample exposed for 555 h and untreated sample exposed for 527 h.
Metals 12 01702 g008
Figure 9. Time evolution of oxide resistance R o x of untreated and LSP-treated SS 304L.
Metals 12 01702 g009
Figure 10. Evolution of the charge transfer resistance R c t during exposure of untreated and LSP-treated sample of AISI-304L in VVER environment at 280 C .
Metals 12 01702 g010
Figure 11. Time evolution of the diffusion resistance Z 0 for LSP-treated and untreated AISI 304L.
Metals 12 01702 g011
Figure 12. (a) Polarization curves. (b) Instantaneous corrosion rate of untreated and LSP-treated specimen.
Metals 12 01702 g012
Figure 13. FEG-SEM images of surface layer oxide crystals of untreated specimen, images (af) at gradually increasing magnifications.
Metals 12 01702 g013
Figure 14. FEG-SEM images of surface layer oxide crystals of LSP-treated specimen, images (af) at gradually increasing magnifications.
Metals 12 01702 g014
Table 1. Chemical composition in wt.%.
CSiMnPSCrNiNFe
0.0240.4911.4680.2200.007518.29611.80.0436Balance
Table 2. XRD parameters of residual stress measurements on LSP-treated AISI 304L.
Radiation sourceCrKα1
Smoothing methodSavitzky-Golay
ψ angles0 °C to 60 °C
Aperture size1 mm
Bragg’s angle128.8 °C
Young’s modulus180 MPa
Table 3. Equivalent circuit parameters used for estimation of the roughness factor.
Rs [Ω cm2]R1 [Ω cm2]Q−1 sn cm−2]nCeff [F cm−2]
polished sample81.168,6856.29 × 10−60.8962.6 × 10−6
untreated sample81.723,3122.09 × 10−50.8687.9 × 10−6
LSP-treated81.283613.33 × 10−50.8431.1 × 10−5
Table 4. Corrosion rate of AISI 304L in high-temperature aqueous environments.
Specimen Designation [mg dm−2]
untreated specimen56.65
LSP-treated specimen137.53
pickled polished specimen at 300 °C deaerated demineralized water [32]7.8
abraded specimen at 300 °C deaerated demineralized water [32]17.8
machined specimen at 260 °C deionized water hydrogenated [33]39.25
Publisher’s Note: MDPI stays neutral with regard to jurisdictional claims in published maps and institutional affiliations.

