Abstract
In order to reveal the effects of the glass solidification bottling process of high-level liquid radioactive wastes on the welded joints of containers, the microstructure evolution and mechanical properties of 310S stainless steel welded joints were investigated. For this purpose, samples were heat-treated in a resistance furnace at 1100 °C, with two groups of samples being thermally shocked and heat-treated in the furnace. The results indicated that the grain-size distribution changed from unimodal to bimodal for the thermally shocked samples, which was caused by abnormal growth due to the grain growth driving force during recrystallization. Spinel oxide ((Fe, Cr, Ni)3O4) and Cr2O3 were the main oxides at 1100 °C. The dislocations almost disappeared and needle-like structures that were rich in N and Cr formed in the welded joints after being thermally shocked. The tensile properties of the thermally shocked welded joints showed decreases in yield strength and plasticity. The fracture morphologies of the samples heated in the furnace and the as-welded samples presented with dimples. However, the morphologies of the fracture surfaces of the thermally shocked samples presented large numbers of secondary cracks and smooth characteristics.
1. Introduction
High-level liquid radioactive wastes are generated from nuclear facility operations and decommissioning. Their safe disposal and environmental remediation is essential to the sustainable development of nuclear energy [1]. The glass solidification process is primarily employed for high-level radioactive waste [2]. AISI 310S austenitic stainless steel has been extensively applied in nuclear power plants and solidification containers owing to its prominent high-temperature properties, such as its excellent mechanical properties and oxidation resistance [3]. Nowadays, 25Cr-20Ni filler metal is used as a consumable for the welding containers of glass solidification high-level liquid radioactive wastes [4]. Such a solidification container must bear instantaneous elevated thermal shock of up to 1100 °C for a period of time during the production process of bottling liquid radioactive wastes. Nassiraei et al. [5,6,7] reported that the strengthened steel members in welded joints are remarkably decreased at temperatures above 800 °C, as confirmed by test verifications and accurate simulation calculations. The elevated thermal shock made an enormous challenge to the container’s materials at 1100 °C. In order to improve the elevated thermal shock properties, a micro-alloying rare earth element (Ce) was added to the base metal and Ta and N were added to the welding filler, respectively [8,9,10]. The elements Ce, Ta, and N have been reported to have beneficial effects on the elevated properties and corrosion resistance of austenitic stainless steel [11,12,13].
An elevated temperature of up to 1100 °C would cause serious grain growth during the process of bottling. With the grain growth, the grain structure coarsened through the reduced fraction of the high-angle grain boundaries [14]. In general conditions, an original grain or secondary recrystallized grain will grow rapidly by absorbing the surrounding smaller grains, a process called abnormal grain growth (AGG) [15,16]. It is frequently found that the AGG phenomenon occurs in the bimodal structure, as the distribution of grain size finally transforms from bimodal to unimodal through the absorption of adjacent abnormal grains [17]. However, the AGG phenomenon can suddenly occur in the unimodal structures of 310S welded joints after enduring 1100 °C thermal shock. For this abnormal phenomenon, the heat treatment condition plays a crucial role.
The heat treatment regime, such as annealing temperature, annealing time, and heating rate, has a significant influence on a material’s microstructure and properties. Li et al. [18] found that the yield strength of 316L stainless steel decreased with increased annealing times, while the ductility increased due to the heterogeneous lamella structure. In another study, Li et al. [19] reported that a large amount of (Fe, Cr)23C6 was precipitated at the ferrite grain boundaries after annealing below 740 °C. The precipitation of (Fe, Cr)23C6 can be prevented by increasing the annealing temperature, while the elongation can be decreased. The reversion annealing process has successfully been performed on austenite stainless steel, with a pronounced grain refinement effect [20,21]. The researchers found that the bimodal grain structure was obtained due to the occurrence of static recrystallization and the reverse transformation of martensite to austenite. After annealing at 900 °C, a good combination of strength and elongation was achieved through the formation of bimodal microstructures. Sara et al. [22] found that the kinetics of austenite recrystallization could be enhanced by raising the annealing temperature. As reported by Sun et al. [23], the heating rate can influence austenite transformation during isothermal annealing, especially a high heating rate (of more than 40 °C/s), which can make the martensite reversion mechanisms change from diffusional to a shear-type.
The safe service life of a solidification container is ensured by its mechanical properties after suffering thermal shock of up to 1100 °C during the bottling process. Many studies have contributed to the integrity assessment of such containers, which is affected by transient thermal shock. Thamaraiselvi et al. [24] reported that the crack resistance capacities of samples subjected to thermal shock were reduced. Thermal shock reduced the plastic zones that were revealed at the crack tip. Chapuliot et al. [25] developed a method for testing the fracture behaviors of tensile samples subjected to thermal shock. It was shown that the samples that underwent thermal shock failed at lesser loads. Kumar et al. [26] performed thermomechanical fatigue tests on 316LN austenitic stainless steel welded joints using a thermal cycle. They observed that intergranular damage increased with the increases in the thermal range and hold times. At the same time, the oxidation resistance was damaged during the thermal shock process. Therefore, it is possible to essentially transform metallurgical properties after thermal shock in the bottling process.
Based on the above survey, it is evident that no comprehensive analysis has been reported that compares the effects of thermal shock on the microstructure evolution, mechanical property performance, and elevated temperature oxidation of 310S welded joints during the bottling process. It is important to emphasize that the elevated properties of 310S stainless steel has been improved with the addition of Ce. On the other hand, these weld joints are essential in nuclear power plants and chemical industries. Therefore, it is important to study the evolution of microstructure, property performance, and recrystallization behavior in the thermal shock induction instantaneous heating and isothermal heating processes. In this paper, the microstructures, properties, and elevated temperature oxidations of 310S welded joints are systematically studied using an optical microscope (OM), a scanning electron microscope (SEM), electron back scattered diffraction (EBSD), X-ray diffraction (XRD), and a transmission electron microscope (TEM).
2. Materials and Methods
2.1. Welding Process and Thermal Shock
The base metal sheets of 310S in a solution condition with dimensions of 200 mm × 100 mm × 6.5 mm were welded by plasma arc welding (PAW). The filler materials were 25Cr-20Ni welding wires with diameters of 1.2 mm. The main chemical compositions of the base metals (BMs) and filler materials are listed in Table 1. The pure argon was applied as the shielding gas to protect the welding pool, and the flow rate was approximately 15 L/min. The PAW procedure was performed using the single-layer and single-pass techniques with an I-groove and no gap, with a welding current of 160 A, a welding voltage of 25 V, and a welding speed of 15 mm/s. The welding parameters are presented in Table 2.

Table 1.
The main chemical compositions of the BMs and filler materials (wt. %).
Table 2.
Welding parameters used in the welding process.
The samples with dimensions of 60 mm × 14 mm × 3 mm were cut from the weldment, based on the GB/T 228.1-2021 standard, and the weld metal (WM) was in the middle, as shown in Figure 1. The samples were ground using sandpaper and cleaned in alcohol before the thermal shock and oxidation tests. A resistance furnace was employed for the thermal shock tests and elevated temperature oxidation tests.

Figure 1.
Schematic diagram of the weld joint and the sampling position of the thermal shock.
Two heat treatment processes with different heating conditions, labeled thermal shock (TS) and furnace heating (FH), were applied, respectively. In order to simulate the actual liquid glass bottling process, the heat treatment temperature chosen was 1100 °C. The whole bottling process lasted for approximately 6 h, and different holding times were used to research the oxidation resistance of the welded joints. The resistance furnace was heated up to 1100 °C with a holding of 20 min, and then the TS samples were put into the furnace for different holding times (1 h, 6 h, or 10 h) and cooled down in the furnace. The TS samples were then put into the elevated-temperature furnace and rapidly heated to 1100 °C. The FH samples were treated with the same holding times and cooling conditions but with different heating rates. The FH samples were put into the furnace at room temperature and heated at a rate of 13 °C/s. For comparison, the as-welded samples not treated. In order to ensure reproducibility of the experiments, two microstructure samples and three mechanical property samples were tested in this study.
2.2. Mechanical Property Tests and Microstructure Observations
After the heat treatments, the samples for were cut from the weld joints to undergo the mechanical property and microstructure tests. The samples with gauge sizes of 30 mm in length and 3 mm × 3 mm in section were used in the tensile tests. The universal tensile tests were performed on a SANS-CMT 5205 tensile testing machine (Changchun SANS Testing Machine Co., Ltd., Shenzhen, China), at room temperature, based on the GB/T 228.1-2010 standard, with a strain rate of 0.2 mm/min. The mechanical properties of the 310S welded joints at elevated temperature are presented in Table 3. In order to reveal the grain boundaries and dendrites, an etching reagent consisting of 10% oxalic acid was used to reveal the optical morphology at 8 V DC for 10 s. Subsequently, the samples’ the microstructure characteristics were observed and analyzed with a Zeiss Axio Observer Z1 (Carl Zeiss AG, Jena, Germany), an FEI QUANTA 450 (FEI company, Hillsboro, OR, USA), and an EBSD (ZEISS MERLIN Compact, Carl Zeiss AG, Jena, Germany). The oxide scales’ XRD patterns on the surfaces of the 310S welded joints at various oxidation durations were characterized with a Bruker D2 using Cu Kα radiation at 30 kV over a 2 θ range between 20° and 90°. Moreover, TEM (FEI Tecnai G2 20, FEI company, Hillsboro, OR, USA) was employed to acquire more details about the dislocations and the element segregations.
Table 3.
Mechanical properties of the welded joints at elevated temperatures.
3. Experimental Results and Analysis
3.1. Microstructures of the Welded Joints
3.1.1. Optical Micrographs
The microstructures of the 310S welded joints of the as-welded and heat-treated samples (with the same duration times of 6 h but with different heating conditions) are shown in Figure 2. The fine equated crystal structure exists in the base metal and vermicular ferrite was inserted at the dendritic grain boundaries of the austenite matrix of the weld metal prior to heat treatment, as shown in Figure 2a,d, respectively. In contrast, a larger number of grains quickly grew due to being held in the furnace at up to 1100 °C, as shown in Figure 2b,e. The average grain size grew from approximately 60 μm (the as-welded samples) to 170 μm (the FH samples). However, the abnormal grain growth occurred in samples that were exposed to the 1100 °C thermal shock, as shown in Figure 2c,f. Normally, grain growth exhibits a normal pattern at elevated temperatures due to the quick element diffusion in the austenite matrix, high mobility of the high angle grain boundaries and high driving force [27]. However, the abnormal grain growth could evidently occur in the thermally shocked samples at 1100 °C, as shown in Figure 2c,f. To investigate the influence of the thermal shock at 1100 °C, the microstructure evolution and properties of the samples were studied at various durations and different heating conditions.

Figure 2.
Optical micrographs of the 310S welded joint of the as-welded (a,d), FH (b,e), and TS (c,f) samples at 1100 °C (base metal (BM) (a–c) and weld metal (WM) (d–f)).
3.1.2. Microstructural Evolution of the Welded Joints
To further verify the above phenomenon, EBSD analysis was performed with the same duration time of 6 h but for different heating conditions of up to 1100 °C. The IPF presented with a random orientation of the welded joints, as shown in Figure 3. These TS samples appeared to have few substructures in contrast to the as-welded samples. Generally, the mean grain size of the heat-treated samples increased with the treatment temperature and holding time [23]. The corresponding grain size distribution histograms are shown in Figure 4, which illustrate the microstructural evolution due to heat treatment at 1100 °C. The as-welded samples were composed of relatively finer grains (average grain size of 60 μm in the WM) and 59% of the grain sizes were smaller than 50 μm. On the contrary, the TS samples were made up larger grains (average grain size of up to 185 μm in the WM) and 35% of the grain sizes were larger than 200 μm. Moreover, dendrites were not found in the weld centerlines of the TS samples; however, the dendrites in the middle of the as-welded and FH samples had inclined angles at the weld centerlines. Grain coarsening and growth occurred in the FH samples held at 1100 °C, and the grain size distribution was unimodal. However, the abnormal mode was evident in the TS samples, which showed a bimodal distribution of grain size. The histograms of the bimodal structures showed that the microstructures were mixtures of fine grains (FGs) and coarse grains (CGs). The results were consistent with the optical micrographs. This phenomenon can be ascribed to the mechanism of secondary recrystallization [28]. The differences in crystal orientation in the original metastable austenite of the as-welded samples resulted in strain gradients accumulating across the various grains. The corresponding driving force promoted recrystallization as an individual process in each grain. Some recrystallized grains grew quickly, while other grains grew slowly at elevated temperatures [29]. Thus, the bimodal structure was generated by recrystallization during the thermal shock process.

Figure 3.
EBSD analysis of the welded joints for as-welded (a,d), FH (b,e), and TS (c,f) samples at 1100 °C (base metal (a–c) and weld metal (d–f)).
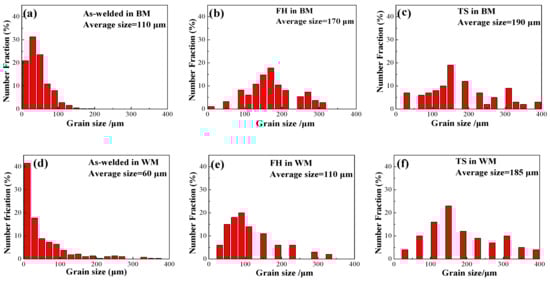
Figure 4.
The grain-size distribution histograms of the as-welded (a,d), FX (b,e), and TS (c,f) samples at 1100 °C (base metal (a–c) and weld metal (d–f)).
The grain reference orientation deviation (GROD) mappings and misorientation angles analyzed by electron backscatter diffraction (EBSD) for the as-welded, FH, and TS samples are shown in Figure 5, respectively. It is shown that the GROD was extended in the grains of the sub-grain microstructures, which grew larger after the 1100 °C heat treatment. These phenomena suggest that the sub-boundary energy, which relies on the mis-orientation angles between the sub-grains, is a major driving force in the current AGG [14]. The AGG is a phenomenon in which a few large grains rapidly grow in a fine-grained matrix. The grain boundary (GB) migration is driven by the capillarity forces generated from the GB curvature [17]. The AGG was formed by the GB migration that consumed the sub-grains during the thermal shock process. Further, the abnormal growth was accelerated by the increasing misorientation between the sub-grains. These results suggest that the sub-boundary energy is a driving force of the AGG, which is supported by the thermodynamic analysis [30].

Figure 5.
Grain reference orientation deviation (GROD) mapping of the weld metal for the as-welded (a,d), FH (b,e), and TS (c,f) samples.
When we contrasted the GROD mapping of the WM at various conditions, it was found that the thermal shock grain sizes grew larger and the mis-orientations became remarkable. This phenomenon supports the hypothesis that the formation of the sub-grains was annexed through the loss of uniformity.
The WM recrystallized grain analysis of the as-welded and heat-treated samples was carried out to make clear the evolution of the microstructure during the thermal shock process, as shown in Figure 6. The WM of the as-welded and FH samples are mainly comprised of sub-grains with small recrystallized grains, as shown in Figure 6a,b. However, the TS samples were mainly comprised of recrystallized grains (77%). This phenomenon supports the hypothesis that the AGG was generated by recrystallization in the thermal shock process.

Figure 6.
Grain orientation spread maps: (a) as-welded, (b) FH, and (c) TS samples and (d) the fractions of recrystallized, sub-structured, and deformed grains in the various specimens.
3.1.3. Deep Microstructure Features
The as-welded samples show large numbers of dislocations near the grain boundaries, as shown in Figure 7. It can be seen that more dislocations are distributed near the grain boundaries, and they are especially concentrated in the intersections of the triple grain boundaries. Further, the dislocations also presented within the grains. The increased dislocation density could play an important role in dislocation strengthening based on constitutive modeling [31]. The high dislocation density could presumably be understood to be a consequence of the M23C6 carbides during the solidification and thermal stress from the volume change in the crystals during the cooling process. In order to further verify the particle in Figure 7b, the EDS maps are shown in Figure 8. The particle is rich in Cr, Ni, N, and C, and Mn is visible around the grain boundary. The formation of the M23C6 carbides is detrimental to the plastic deformation. With the increase in tensile stress, more secondary cracks accumulate around the M23C6 carbides along the grain boundary, which leads to more crack nucleation in the as-welded joints.

Figure 7.
TEM observation of the as-welded samples: (a) triple grain boundary and (b) austenite grain boundary.

Figure 8.
EDS maps from the weld metal and as-welded samples.
It can be seen in Figure 9 that the dislocation densities decrease in the samples subjected to thermal shock with duration times of 6 h. The reason for this reduction in the dislocation densities is that dislocations moved and different numbers of dislocations were offset at elevated temperatures [32]. Due to the limited movement of the dislocations at room temperature, the dislocations could not be completely offset in the short time, as shown in Figure 7, where some dislocations at the grains and grain boundaries were observed. When the service temperature was increased to 1100 °C, the atoms had enough diffusion ability, and thus the movement of the dislocations was fast and the different numbers of dislocations could attract each other and be offset in the short amount of time, even if they had a relatively far distance. Therefore, the dislocations almost disappeared, as shown as in Figure 9, where only a few short dislocations were observed. Due to the thermal shock, the sample formed a large number of rod-like structures, as seen in Figure 9, and it was rich in N and Cr, and possibly in the Cr2N phase. There were no plastic deformations of the Cr2N particles breaking first before the cracks occurred in the austenitic matrix. The Cr2N particles broke from the matrix, thereby nucleating voids, which grew and coalesced by the heterogeneous deformations. The rod-like morphology of the Cr2N also reduced its contributions to the crack growth resistance.

Figure 9.
TEM observation and EDS maps of the TS samples of the weld metal: (a) TEM and (b) EDS.
3.2. Surface Oxide Scales of the Welded Joints after Exposure to 1100 °C
In order to investigate the phase structures of the oxide scales of the samples exposed for different durations, the phase structures were characterized by XRD and the diffraction patterns are shown in Figure 10. The patterns show that the spinel oxide (Fe, Cr, Ni)3O4 and Cr2O3 are the main oxides in the 310S welded joints. The two types of oxides rapidly generated on the surfaces of the welded joints when the welded joints’ exposure times reached 1h at 1100 °C. According to the diffraction patterns, no new types of oxides were formed with the increase in exposure duration. The austenitic matrix was also indicated in the diffraction patterns of the thermal shock samples, especially for the short-duration samples, such as those exposed for 1 h. This phenomenon may be ascribed to the thin oxide scales and the spallation of the oxide scales. The formation of oxides can generate more stress and promote the nucleation of cracks in the welded joints, which results in a great amount of oxide spallation at elevated temperatures [33,34].

Figure 10.
XRD patterns of the welded joints that underwent thermal shock at 1100 °C for various durations: (a) WM, and (b) BM.
The surface morphologies and the EDS on the surfaces of the welded metals after thermal shock at 1100 °C for different durations are shown in Figure 10. Significant amounts of oxide particles rapidly formed on the surfaces of the samples after a duration of only 1 h, as shown in Figure 11a. The sizes of the oxide particles increased with the exposure duration, as shown in Figure 11b,c. Moreover, there are some spallation areas that emerged in the oxide scales for the 10 h duration samples at 1100 °C. This phenomenon indicates that the 310S welded metals suffered from oxide spallation after thermal shock at 1100 °C during the long-term bottling process. The grey particles mainly contain the elements Cr, Fe, Mn, O, and C, as shown in Figure 11, which presents that the grey particles are mainly spinel oxides (Fe, Cr, Ni)3O4 and Cr2O3.
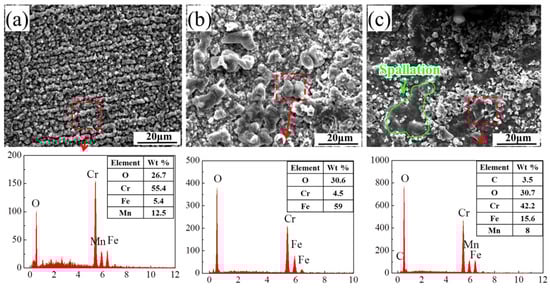
Figure 11.
SEM morphologies of the oxide scales and the EDS on the surfaces of the welded metals at different durations: (a) 1 h, (b) 6 h, and (c) 10 h.
3.3. Variations in the Mechanical Properties after Thermal Shock
Strength and plasticity always present a trade-off relation in austenite stainless steel. While the plasticity was improved by the grain coarsening in this study, the yield strength (YS) was slightly decreased under the same tensile conditions, as shown in Figure 12a. According to the studies by A. Rezaee, the yield strength was greatly impacted by the average grain sizes and dislocation densities of the specimens [35]. The relationship was found to follow the Hall–Petch relationship, given by the formula σy = σ0 + kd0.5, where σy is the yield strength, σ0 is the friction stress, K is a constant, and d is the average grain size [36]. A comparison of the as-welded and TS samples shows differences in the yield strength in this study: the as-welded samples were 362 MPa and the TS samples were 318 MPa. We can clearly note that the as-welded samples were shown to have fine grain sizes and high dislocation densities (Figure 2 and Figure 7). At the same time, the grain size distribution greatly influenced the σ0 and k. For examples, the grain size distributions of the TS and FH samples with different heating rates were unimodal and bimodal, and the yield strength was 318 MPa and 346 MPa, respectively, as shown in Figure 12a. With a similar strain hardening rate (SHR) (shown in Figure 7b), the yield strength of the TS samples at 1100 °C for 6 h (318 ± 10 MPa) was 9% lower than that of the FH samples at 1100 °C (346 ± 10 MPa) and the elongation was 10% lower (46 ± 4% vs. 51 ± 4%, respectively). The results indicate that the thermal shock can reduce the yield strength and plasticity. In order to clarify the mechanism for the damaged yield strength and plasticity in the samples after thermal shock compared with the furnace heat-treated samples, the strain hardening rate was used to discuss the plastic behaviors in the tensile process. In the case of the tensile samples, the strain hardening rate first rapidly decreased at low strains, followed by a gradual decline, with a final sharp decrease until necking to fracture.
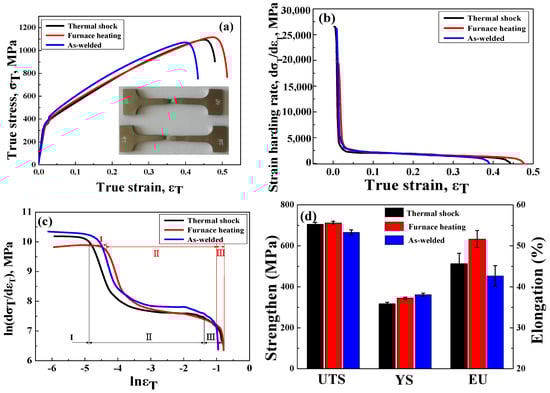
Figure 12.
Changes in the mechanical properties of the TS and FH samples (for 6 h durations) and the as-welded samples, respectively. (a) True stress–strain curves. (b) Strain hardening rate–true strain curves. (c) The C–J analysis (ln (dσT/dεT) vs. lnεT). (d) Distribution histograms of the mechanical properties.
The Crussard–Jaoul (C–J) analysis could be used to further contrast the strain hardening rates into three stages, as shown in Figure 12c [37]. The strain ranges for each stage in all samples are summarized in Table 4. The differences in the SHR in both specimens are most likely related to the microstructural evolution before tension [38].
Table 4.
The values of the true strains of each stage of the samples based on the C–J analysis.
In Stage I, the logarithmic value of the strain hardening rate rapidly decreased in the FH samples with larger strain ranges than that of the TS samples (0.134 vs. 0.008, respectively). The rapidly decreasing SHR was mainly influenced by the multiplication and slip of the dislocations [39]. Due to the smaller average grain size in the welded metal of the FH samples (110 μm), in contrast with the TS samples (185 μm), the dislocation motion resistance was increased by more grain boundaries, which resulted in a lower SHR. In Stage II, the ln (dσT/dεT) value decreased slowly in all samples and the strain ranges of the FH samples had similar strain ranges with those of the TH samples (0.410 vs. 0.404, respectively). The synergistic mechanisms of the deformation twins and dislocation slips worked in company with the local strains, leading to a similar strain range in Stage II. In Stage III, the ln (dσT/dεT) decreased rapidly, and the larger strain ranges for the FH samples (0.513 vs. 0.451, respectively) further delayed fracturing.
The representative fracture morphologies of the tensile samples from the heat-treated and as-welded samples are shown in Figure 13. It can be seen in Figure 13 that the fracture surface of the 310S austenite stainless steel welded joints that endured the thermal shock condition (TS) showed a combination of ductile and quasi-cleavage fractures. The ductile segments with micro-dimple features and the quasi-cleavage segments with torn edges are apparent at the fractures of the TS samples. Few austenitic stainless steel with FCC lattices have quasi-cleavage fractures at ambient temperatures. The quasi-cleavage is usually found in materials with BCC and HCP crystals at low temperatures [40]. The quasi-cleavage fractures can be ascribed to the existence of the Cr2N brittle phases and the heterogeneous grain distributions in the TS samples. According to Figure 9a, it can be concluded that the brittle phase Cr2N was precipitated in the TS samples. By increasing the tensile stress in the austenite welded joints, the growth of the cracks near the brittle phase Cr2N reach critical values prior to the shear stress, which leads to the plastic deformation of the austenite phase and results in quasi-cleavage fracture modes. Secondly, the main reason that secondary cracks appeared at the surfaces of fractures is the heterogeneous grain distributions, which lead to the discrepant deformation processes of the two grains.

Figure 13.
SEM morphology of the as-welded (a,d), furnace-heated (FH) (b,e), and thermally shocked (TS) (c,f) samples.
It can be seen from Figure 13b that the heat-treated samples (TH) have more ductile fracture modes than the joints that endured thermal shock. As shown in Figure 2 and Figure 4, the FH samples with different heating processes transitioned from bimodal grain distributions to the unimodal grain distributions. The source of the large dimples with sizes of approximately 10 μm is, generally, the unsolved precipitate phase.
The fracturing of the as-welded austenite stainless steel joints is also shown in Figure 13a. The as-welded joints are also ductile, with finer dimples than the heat-treated welded joints. This is because the grains of the as-welded joints did not grow in the 1100 °C heat treatment. Micro-cracks also appeared in the fracture surfaces of the as-welded joints. The different thermal cycles at the welding processes result in a fraction of the M23C6 carbides being located along the austenite grain boundary, with the carbides dispersed along the grain boundary. The most important parameter for commanding the fracture in the as-welded sample was the fraction of M23C6 carbides along the austenite grain boundary.
4. Conclusions
In order to investigate the effects of the bottling process in the glass solidification of high-level liquid radioactive waste, the microstructure evolution and mechanical properties of 310S stainless steel welded joints under heat treatment and thermal shock were investigated. The conclusions can be drawn as follows:
(1) When the samples were heated to 1100 °C in a furnace from an ambient temperature, the grain size distribution was unimodal, and the driving force of the grain growth was promoted by the sub-boundary energy.
(2) For the samples that suffered thermal shock, where the samples were heated directly to 1100 °C, the grain size distribution changed from unimodal to bimodal and the driving force of the grain growth was accelerated by recrystallization.
(3) Spinel oxide ((Fe, Cr, Ni)3O4) and Cr2O3 were formed in the simulation conditions of the bottling process. The dislocations almost disappeared and the needle-like structures rich in N and Cr were formed in the weld beam.
(4) The tensile properties of the thermally shocked welded joints showed decreases in yield strength and plasticity compared to the heat-treated samples. The fracture morphologies of the thermally shocked samples presented a large number of cracks and smooth characteristics.
Author Contributions
Conceptualization, Y.J.; methodology, Y.J.; validation, Y.J. and Y.K.; formal analysis, Y.J.; investigation, Y.J.; resources, Y.J.; data curation, Y.J., Y.K. and C.W.; writing—original draft preparation, Y.J.; writing—review and editing, Y.K. and C.W.; visualization, Y.J.; supervision, H.C.; project administration, Y.J.; funding acquisition, H.C. All authors have read and agreed to the published version of the manuscript.
Funding
This research was funded by the LingChuang Research Project of China National Nuclear Corporation.
Data Availability Statement
The data presented in this study are available on request from the corresponding author.
Acknowledgments
The authors would like to acknowledge the financial support provided by the LingChuang Research Project of China National Nuclear Corporation. The authors also wish to acknowledge the supply of the stainless steel and welded joint samples from China Erzhong Group Co., Ltd.
Conflicts of Interest
The authors declare no conflict of interest.
References
- Kearney, S.; Yorkshire, A.S.; Geddes, D.A.; Hanein, T.; Nelson, S.; Provis, J.L.; Walkley, B. Chapter 25—Cement-based stabilization/solidification of radioactive waste. In Low Carbon Stabilization and Solidification of Hazardous Wastes; Tsang, D.C.W., Wang, L., Eds.; Elsevier: Amsterdam, The Netherlands, 2022; pp. 407–431. [Google Scholar] [CrossRef]
- Tan, S. Chapter 26—Glass-based stabilization/solidification of radioactive waste. In Low Carbon Stabilization and Solidification of Hazardous Wastes; Tsang, D.C.W., Wang, L., Eds.; Elsevier: Amsterdam, The Netherlands, 2022; pp. 433–447. [Google Scholar] [CrossRef]
- Lo, K.H.; Shek, C.H.; Lai, J.K.L. Recent developments in stainless steels. Mater. Sci. Eng. R Rep. 2009, 65, 39–104. [Google Scholar] [CrossRef]
- Zhang, X.; Li, D.; Li, Y.; Lu, S. Effect of aging treatment on the microstructures and mechanical properties evolution of 25Cr-20Ni austenitic stainless steel weldments with different Nb contents. J. Mater. Sci. Technol. 2019, 35, 520–529. [Google Scholar] [CrossRef]
- Nassiraei, H.; Mojtahedi, A.; Lotfollahi-Yaghin, M.A.; Zhu, L. Capacity of tubular X-joints reinforced with collar plates under tensile brace loading at elevated temperatures. Thin-Walled Struct. 2019, 142, 426–443. [Google Scholar] [CrossRef]
- Nassiraei, H. Static strength of tubular T/Y-joints reinforced with collar plates at fire induced elevated temperature. Mar. Struct. 2019, 67, 102635. [Google Scholar] [CrossRef]
- Nassiraei, H.; Lotfollahi-Yaghin, M.A.; Neshaei, S.A.; Zhu, L. Structural behavior of tubular X-joints strengthened with collar plate under axially compressive load at elevated temperatures. Mar. Struct. 2018, 61, 46–61. [Google Scholar] [CrossRef]
- Samanta, S.K.; Mitra, S.K.; Pal, T.K. Effect of rare earth elements on microstructure and oxidation behaviour in TIG weldments of AISI 316L stainless steel. Mater. Sci. Eng. A 2006, 430, 242–247. [Google Scholar] [CrossRef]
- Wei, L.; Zheng, J.; Chen, L.; Misra, R.D.K. High temperature oxidation behavior of ferritic stainless steel containing W and Ce. Corros. Sci. 2018, 142, 79–92. [Google Scholar] [CrossRef]
- Zahid, H.M.; Xiong, J.T.; Li, J.; Farah, S.; Zhang, L.J.; Zhou, X.R. Effect of Ta microalloying on joint performance by tailoring the microstructure during laser beam welding of Ti-22Al-27Nb. Mater. Sci. Eng. A 2022, 845, 143157. [Google Scholar] [CrossRef]
- Lu, Y.; Wang, Q.; Wen, D.; Dong, C.; Zhang, R.; Liaw, P.K. Microstructural stability of Ta minor-alloying HR3C stainless steel at 973 K. Mater. Chem. Phys. 2020, 239, 122306. [Google Scholar] [CrossRef]
- Ganesh Kumar, J.; Prasad Reddy, G.V.; George, A.; Saikumaran, A.; Mythili, R.; Anil Kumar, P.; Das Gupta, A.; Vasudevan, M. Evaluation of tensile properties of thermally aged 316LN stainless steel with varying nitrogen content using ABI technique. Mater. Sci. Eng. A 2021, 806, 140819. [Google Scholar] [CrossRef]
- Liu, R.; Qiao, Y.; Yan, M.; Fu, Y. Mechanical and corrosion resistant properties of martensitic stainless steel plasma nitrocarburized with rare earths addition. J. Rare Earths 2012, 30, 826–830. [Google Scholar] [CrossRef]
- Kusama, T.; Omori, T.; Saito, T.; Kise, S.; Tanaka, T.; Araki, Y.; Kainuma, R. Ultra-large single crystals by abnormal grain growth. Nat. Commun. 2017, 8, 345. [Google Scholar] [CrossRef]
- Hillert, M. On theory of normal and abnormal grain growth. Acta Metall. 1965, 13, 227–238. [Google Scholar] [CrossRef]
- Frost, H.J.; Thompson, C.V.; Walton, D.T. Simulation of thin-film grain structures—II. abnormal grain-growth. Acta Metall. Mater. 1992, 40, 779–793. [Google Scholar] [CrossRef]
- Humphreys, F.J.; Hatherly, M. Recrystallization and Related Annealing Phenomena, 2nd ed.; Elsevier: Oxford, UK, 2004; pp. 187–194. [Google Scholar]
- Li, J.S.; Cao, Y.; Gao, B.; Li, Y.S.; Zhu, Y.T. Superior strength and ductility of 316L stainless steel with heterogeneous lamella structure. J. Mater. Sci. 2018, 53, 10442–10456. [Google Scholar] [CrossRef]
- Li, R.; Fu, B.-G.; Dong, T.-S.; Li, G.-L.; Li, J.-K.; Zhao, X.-B.; Liu, J.-H. Effect of annealing treatment on microstructure, mechanical property and anti-corrosion behavior of X2CrNi12 ferritic stainless steel. J. Mater. Res. Technol. 2022, 18, 448–460. [Google Scholar] [CrossRef]
- Forouzan, F.; Najafizadeh, A.; Kermanpur, A.; Hedayati, A.; Surkialiabad, R. Production of nano/submicron grained AISI 304L stainless steel through the martensite reversion process. Mater. Sci. Eng. A 2010, 527, 7334–7339. [Google Scholar] [CrossRef]
- Rezaei, H.A.; Ghazani, M.S.; Eghbali, B. Effect of post deformation annealing on the microstructure and mechanical properties of cold rolled AISI 321 austenitic stainless steel. Mater. Sci. Eng. A 2018, 736, 364–374. [Google Scholar] [CrossRef]
- Kheiri, S.; Mirzadeh, H.; Naghizadeh, M. Tailoring the microstructure and mechanical properties of AISI 316L austenitic stainless steel via cold rolling and reversion annealing. Mater. Sci. Eng. A 2019, 759, 90–96. [Google Scholar] [CrossRef]
- Sun, G.S.; Hu, J.; Zhang, B.; Du, L.X. The significant role of heating rate on reverse transformation and coordinated straining behavior in a cold-rolled austenitic stainless steel. Mater. Sci. Eng. A 2018, 732, 350–358. [Google Scholar] [CrossRef]
- Thamaraiselvi, K.; Vishnuvardhan, S. Studies on the effect of thermal shock on crack resistance of 20MnMoNi55 steel using compact tension specimens. Nucl. Eng. Technol. 2021, 53, 3112–3121. [Google Scholar] [CrossRef]
- Chapuliot, S.; Lacire, M.H.; Marie, S.; Nédélec, M. Thermomechanical analysis of thermal shock fracture in the brittle/ductile transition zone. Part I: Description of tests. Eng. Fract. Mech. 2005, 72, 661–673. [Google Scholar] [CrossRef]
- Suresh Kumar, T.; Nagesha, A.; Kannan, R. Thermal cycling effects on the creep-fatigue interaction in type 316LN austenitic stainless steel weld joint. Int. J. Press. Vessel. Pip. 2019, 178, 104009. [Google Scholar] [CrossRef]
- Padilha, A.F.; Plaut, R.L.; Rios, P.R. Annealing of Cold-worked Austenitic Stainless Steels. ISIJ Int. 2003, 43, 135–143. [Google Scholar] [CrossRef]
- Shirdel, M.; Mirzadeh, H.; Parsa, M.H. Abnormal grain growth in AISI 304L stainless steel. Mater. Charact. 2014, 97, 11–17. [Google Scholar] [CrossRef]
- Aletdinov, A.; Mironov, S.; Korznikova, G.F.; Konkova, T.; Zaripova, R.G.; Myshlyaev, M.M.; Semiatin, S.L. Martensite-to-Austenite Reversion and Recrystallization in Cryogenically-Rolled Type 321 Metastable Austenitic Steel. Metall. Mater. Trans. A 2019, 50A, 1346–1357. [Google Scholar] [CrossRef]
- Hu, B.A.; Zhang, H.Q.; Zhang, J.; Yang, M.J.; Du, Y.; Zhao, D.D. Progress in Interfacial Thermodynamics and Grain Boundary Complexion Diagram. Acta Metall. Sin. 2021, 57, 1199–1214. [Google Scholar] [CrossRef]
- Kang, J.-H.; Kim, S.-J. Critical Assessment 33: Dislocation density-based constitutive modelling for steels with austenite. Mater. Sci. Technol. 2019, 35, 1128–1132. [Google Scholar] [CrossRef]
- Dai, K.; He, P.; Zhu, L.; Zhang, F.; Chen, F.; Zhai, X.; Xiao, W. Effect of solution treatment on microstructure and cryogenic toughness of 316LN austenite stainless steel weld metal welded by NG-MAG arc welding. Fusion Eng. Des. 2017, 125, 178–188. [Google Scholar] [CrossRef]
- Zhang, X.; Li, D.; Li, Y.; Lu, S. Oxidation behaviors of Fe-25Cr-20Ni-χNb austenitic weld metals at 1100 °C in ambient air: Role of elemental niobium. Corros. Sci. 2019, 159, 108137. [Google Scholar] [CrossRef]
- Madern, N.; Monnier, J.; Baddour-Hadjean, R.; Steckmeyer, A.; Joubert, J.-M. Characterization of refractory steel oxidation at high temperature. Corros. Sci. 2018, 132, 223–233. [Google Scholar] [CrossRef]
- Rezaee, A.; Kermanpur, A.; Najafizadeh, A.; Moallemi, M. Production of nano/ultrafine grained AISI 201L stainless steel through advanced thermo-mechanical treatment. Mater. Sci. Eng. A 2011, 528, 5025–5029. [Google Scholar] [CrossRef]
- Kashyap, B.P.; Tangri, K. On the Hall-Petch relationship and substructural evolution in type 316L stainless steel. Acta Metall. Mater. 1995, 43, 3971–3981. [Google Scholar] [CrossRef]
- Ke, R.; Wan, X.; Zhang, Y.; Hu, C.; Wu, K. The impact of annealing temperature on the microstructure—Properties relationship of reversion-induced austenitic stainless steels. Mater. Sci. Eng. A 2022, 843, 143100. [Google Scholar] [CrossRef]
- Ke, R.; Wan, X.; Zhang, Y.; Hu, C.; Wu, K. Insight in the impact of pre-deformation on structure—Deformation—Property relationship in Cr-Mn-N stainless steel. Mater. Charact. 2022, 184, 111689. [Google Scholar] [CrossRef]
- Hu, J.; Du, L.-X.; Xu, W.; Zhai, J.-H.; Dong, Y.; Liu, Y.-J.; Misra, R.D.K. Ensuring combination of strength, ductility and toughness in medium-manganese steel through optimization of nano-scale metastable austenite. Mater. Charact. 2018, 136, 20–28. [Google Scholar] [CrossRef]
- Giang, N.A.; Kuna, M.; Hütter, G. Influence of carbide particles on crack initiation and propagation with competing ductile-brittle transition in ferritic steel. Theor. Appl. Fract. Mech. 2017, 92, 89–98. [Google Scholar] [CrossRef]


Publisher’s Note: MDPI stays neutral with regard to jurisdictional claims in published maps and institutional affiliations. |
© 2022 by the authors. Licensee MDPI, Basel, Switzerland. This article is an open access article distributed under the terms and conditions of the Creative Commons Attribution (CC BY) license (https://creativecommons.org/licenses/by/4.0/).