Article

Recrystallization Texture Analysis of FeCoNiCrMnAl0.5 High-Entropy Alloy Investigated by High-Energy X-ray Diffraction

1
Xinjiang Key Laboratory of Solid-State Physics and Devices, Xinjiang University, Urumqi 830046, China
2
School of Physics Science and Technology, Xinjiang University, Urumqi 830046, China
3
Beijing Advanced Innovation Center for Materials Genome Engineering, State Key Laboratory for Advanced Metals and Materials, University of Science and Technology Beijing, Beijing 100083, China
*
Authors to whom correspondence should be addressed.
Metals 2022, 12(10), 1674; https://doi.org/10.3390/met12101674
Submission received: 5 September 2022 / Revised: 23 September 2022 / Accepted: 29 September 2022 / Published: 6 October 2022

Abstract

:
In small volume fractions, the bcc phase plays an important role in the properties of FeCoNiCrMnAl0.5 multiple-phase high-entropy alloys (HEAs). Since the small volume fraction of the bcc phase limits the detection of its texture, its texture evolution during mechanical processing is still unclear. In the current research, high-energy X-ray diffraction was used to investigate the crystallographic textures of cold-rolled and annealed FeCoNiCrMnAl0.5 dual-phase HEA with fcc and bcc phases. During cold-rolling deformation, multi-pass symmetry under isothermal conditions leads to asymmetric {200}bcc and {211}bcc peaks; the asymmetry disappears after annealing treatment, with the evolution of prominent texture components and the release of internal residual stress. The Goss texture component and {112}<110> and {111}<112> texture components were intensified after cold-rolling in the fcc and bcc phases, respectively, with orientation relationships of {110}bcc<111>bcc//{111}fcc<110>fcc recognized in the cold-rolled HEA. Based on this relationship, the yield strength (YS) and engineering ultimate tensile strength (UTS) of the sample reached 570 MPa and 920 MPa, respectively, which shows a fracture elongation of 27%. The study provides deeper insight into the anisotropic mechanical characteristics of the investigated HEA and demonstrates the great potential of dual-phase HEAs for mechanical applications in industry.

1. Introduction

The mechanical properties of materials are chiefly dependent on their texture. Texture analysis can provide crucial information on the correlation of deformation and/or recrystallization in the metallurgical processing of materials, e.g., Mg alloys, steel, and multi-element alloys [1,2,3,4,5,6,7]. The crystallographic texture is also an effective indicator to justify a product orientation that is related to particular chemical and mechanical properties. The evolution of texture during the industrial processing of products is a common phenomenon [8]. The physical mechanisms of the materials can be controlled by tailoring the texture in the manufacturing processing stages. The deformation texture, recrystallization texture, and allotropic phase transformation texture are three important textures in solid transformation processes [9]. In particular, the texture of thermo-mechanically processed materials is an interesting and crucial aspect that has been researched intensively for different materials. Annealing texture research on HEAs has gained considerable attention and the unique properties of the HEAs have been reported. However, the relevant reported literature concentrating on the fcc single phase, the texture of the bcc, or dual-structured HEAs makes little contribution to the research [10,11,12,13,14].
The initial orientation is known to play an important role in the development of recrystallization textures, which are crucial in industrial applications. Generally, the evolution of rolling and shear deformation textures is understood in terms of the local misorientations [15,16]. The fully constrained Taylor model presents a rational description of the transformation of the deformed texture that could proceed between the fcc and bcc phases, due to certain constraints [15]. Thus, it is important to explore the texture for studying mechanisms in polycrystalline alloys under the metallurgical process. The FeCoNiCrMnAl0.5 alloy containing the bcc phase, with nickel and aluminum elements, is a potential candidate structural material, due to its excellent properties at high temperatures. FeCoNiCrMnAl alloy [17,18] is also one of the most studied HEAs and is associated with special mechanical behaviors. The mechanical behavior of the alloy after heat treatment was reported in our previous work [17]. However, there are few studies on the texture of the alloy since the bcc phase occupies a small volume fraction in the alloy, and common detection technology cannot accurately collect information on the texture evolution of the bcc phase. The study of the texture of the bcc phase is often neglected, although the bcc phase plays an important role in developing the mechanical properties of the alloy. At the same time, the physical origin of the texture is still an issue worthy of discussion and can contribute to the understanding of texture-related mechanical behavior and, thus, improve the capabilities of structural materials. Due to the limitations of the ex-situ methods and the particularity of HEAs, the precise mechanism of the recrystallization process in HEAs is still unclear. High-energy X-ray diffraction is a powerful tool for studying crystallographic texture and can nondestructively trace the structure evolution with high precision, compared with other techniques, even in small volume fractions. Here, the current study is conducted from the perspective of texture evolution and heat treatment, to understand the correlation between texture and stress behavior in the fcc and bcc phases in the FeCoNiCrMnAl0.5 alloy.

2. Experimental

An as-cast FeCoNiCrMnAl0.5 HEA was fabricated by an arc-melting technique. The samples were subsequently cold-rolled to a 75% reduction in thickness, followed by annealing at 900 °C, 1000 °C, and 1100 °C for one hour; this was followed by air cooling. To explore the local recrystallized texture of the deformed HEA along the three dimensions (i.e., the radial direction (RD), the normal direction (ND), and the transverse direction (TD)) with increasing shear strain from the middle to the edge of the sample, a texture experiment employing the dimensional high-energy X-ray diffraction (HE-XRD) synchrotron technique was performed using the 11-ID-C beamline of an advanced photon source (Argonne National Laboratory, Chicago, IL, USA) [19]. The schematic setup is shown in Figure 1a. A monochromatic X-ray beam with an energy of 105 keV was used; the cross-section of the incident beam was 0.5 × 0.5 rnm2. The specimen rotated continuously, 180° (ω) around the z-axis, at an interval of 5°. A two-dimensional (2D) detector was used to collect the diffraction patterns simultaneously. The low-index Debye–Scherrer rings for the fcc and bcc phases were observed with an angular step size of 5° in the azimuth (β) and rotated angle (ω), as shown in Figure 1a. The transverse and rolling directions of the sheets were parallel to the incident beam.

3. Results

The reduced one-dimensional HE-XRD patterns are shown in Figure 1b–f as a function of the diffraction angle 2θ, which shows fcc and bcc phases with increasing annealing temperature, integrated at 90° ± 5°. The dominant phases throughout the experiment were the fcc and bcc phases (Figure 1b–f). The volume fractions of the two phases are 83% and 17%, respectively. The changes in peak intensities were weak in the cold-rolled state. Interestingly, it can be seen that with an increase in the annealing temperature, the intensity of the diffraction peaks increases, while the intensity decreases at 1100 °C/1 h, indicating the dissolution of the partial bcc phase in the alloy with an annealing temperature of 1100 °C/1 h. In addition, some σ phases (2 theta value = 3.2°~3.7°, 5.3°~5.7°, 6.35°) could be observed during annealing at 900 °C/1 h. Furthermore, these σ phases disappeared after annealing at 1000 °C/1 h and 1100 °C/1 h. For the bcc phase, the intensity of the peaks became stronger. These variations in peak height could be the result of the variation in the texture of the alloy due to the recrystallization process. The Debye ring profiles from the detector were obtained for the alloy acquired, as shown in Figure 1c–f. High-intensity diffraction spots at the X-ray Debye rings of the {111}fcc, {200}fcc, {220}fcc, and {311}fcc and {100}bcc, {110}bcc, {200}bcc, and {220}bcc planes (Figure 1c–f) clearly demonstrate the existence of texture components, especially in the cold-rolled state (Figure 1c), which exhibited strong texture.
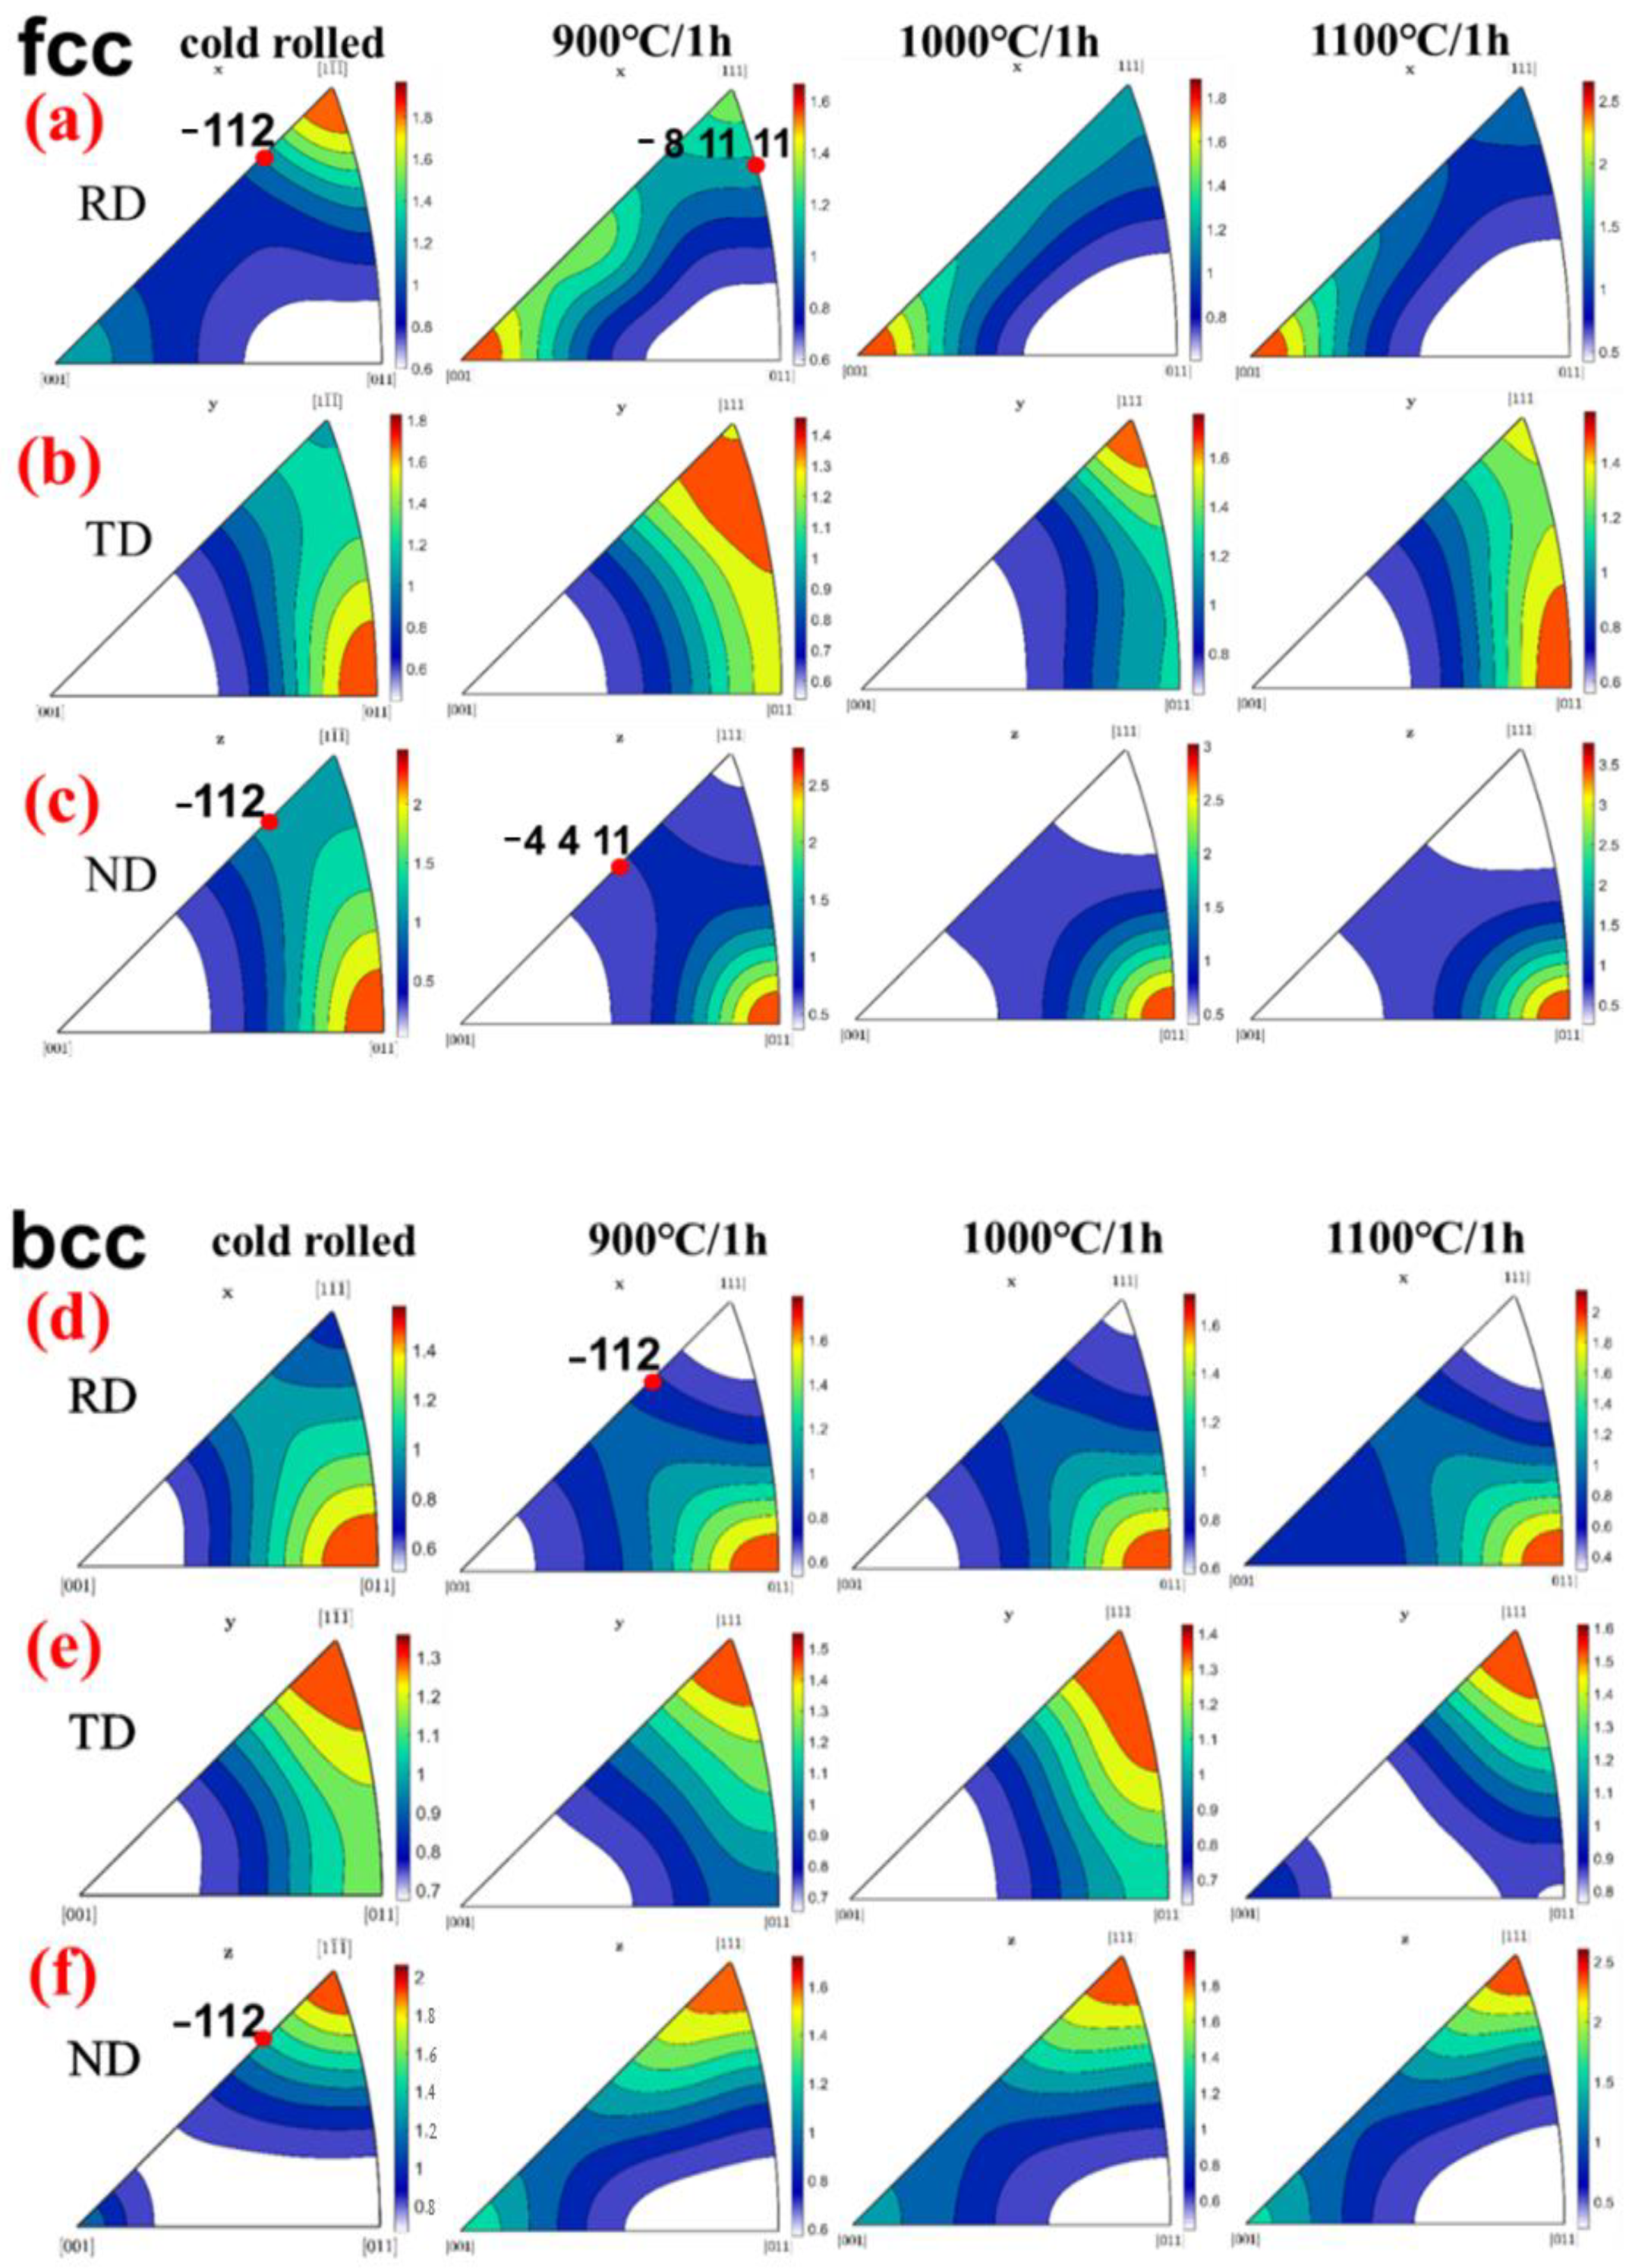
Figure 2a–c shows the inverse pole figures of the fcc phase corresponding to three directions along the rolling plane, subjected to heat treatment at 900 °C~1100 °C for 1 h. The Goss texture {110}<001> and brass texture {110}<112> were found in the fcc phase. The fcc phase also exhibited high axis densities at {1-1-1} in the RD (Figure 2a). The inverse pole figures show that the {011} high axis density distribution transforms to a combination of {-1-1} and {011} in the TD (Figure 2b). Furthermore, {1-1-1} and {011} transform to the {011} axis density from the cold-rolled state and annealed states in the ND. Figure 2c shows a much stronger <011>//ND intensity in the fcc phase. The <001>//ND remains the dominant orientation in the annealed states. The intensities increased with the annealing temperature, while the <1-1-1>//ND intensity decreased (Figure 2c) until it disappeared at 1000 °C/1 h and 1100 °C/1 h. The {001}//RD intensity of the fcc phase and {011}//RD intensity of the bcc phase are distinctly strengthened with the increasing annealing temperature. Furthermore, the {1-1-1}//RD orientation decreased and then rotated toward {100}//RD with increasing annealing temperature, as shown in Figure 2. The orientation distributions of the bcc phase, subjected to the cold-rolled state and the other three different heat treatments, are quite different from those of the fcc phase, as shown in Figure 2d–f. High axis densities at {011} in the RD, [1-1-1] in the TD, and the ND were observed for the cold-rolled and other annealed conditions, respectively, as shown in Figure 2d–f. The bcc phase exhibits a different texture [1-1-1]<011> component when compared with the fcc phase, resulting from the different active slips in the two crystal structures. Interestingly, the typical diffuse and significant fiber component textures of the two phases, defined by the RD and ND fibers, are strongly developed (Figure 2a,c,d,f), which results from the micromechanical debris of the HEA after 75% cold-rolling. The orientation relationships of {111}fcc//{110}bcc and <110>fcc//<111>bcc were observed in the HEA. This result is consistent with the Kurdjumov and Sachs (K–S) relationship [16].
The recrystallization is accompanied by annealing twinning in the fcc phase [4].
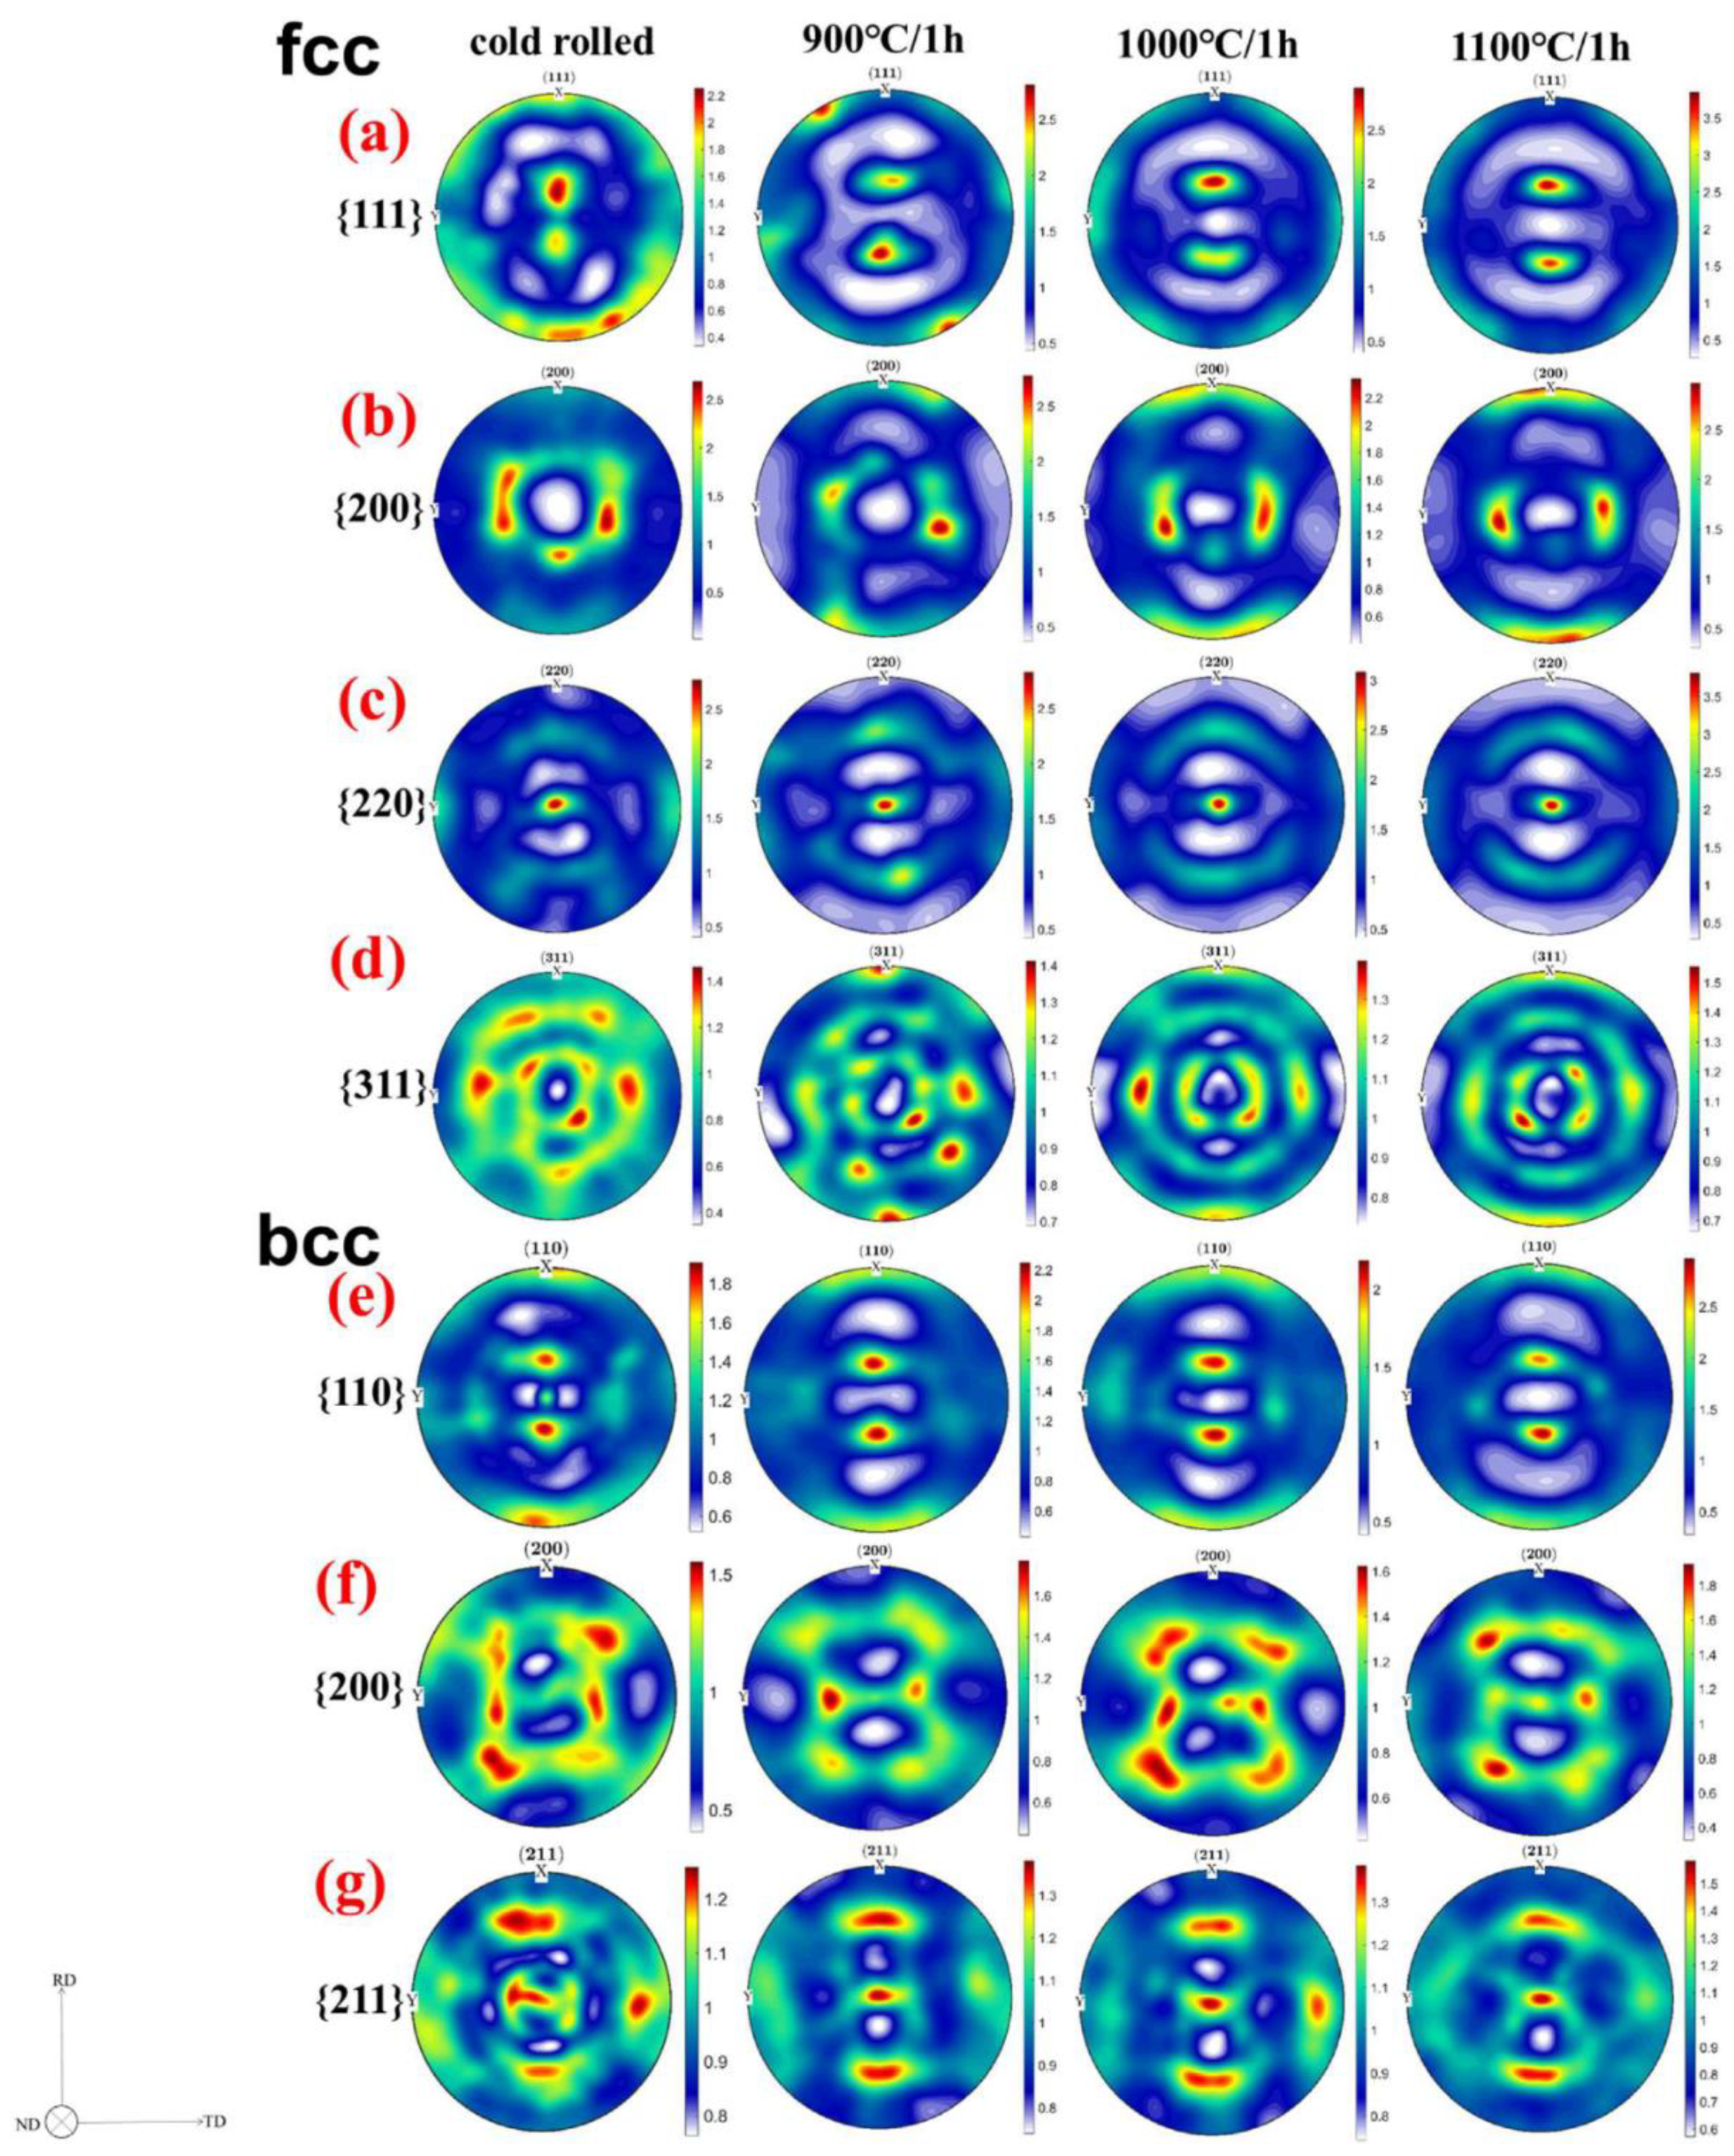
All texture components in different positions can be detected from the Debye-Scherrer rings by moving the X-ray beam on the sample. The measured {111}, {200}, {220}, {311} complete pole figures corresponding to the different states, i.e., the initial cold-rolled states annealed at (900~1100) °C, are shown in Figure 3a–d. The light and dense parts distributed in the pole figures suggested that the intensity of the diffracted high-energy X-ray was higher than that of the other parts. It is noted that the fiber textures with {hkl} directions perpendicular to the normal direction along the transverse direction (Y) exhibited little asymmetry in the orthorhombic orientation distribution. The asymmetry exhibited in the {111}, {200}, {220}, and {311} complete pole figures, i.e., Figure 3a–d, deviated from the general rule of orthorhombic symmetry. The asymmetry was induced by the large shear deformation during processing. Shear deformation is formed during cold rolling and plays a crucial role in activating the deformation mode and the related recrystallization mechanism [20]. Generally, multipass symmetry with isothermal conditions and asymmetric rolling, i.e., differential speed rolling, would induce shear deformation. The shear texture produced due to the large shear deformation resulted from inhomogeneous cold-rolling processing. In addition, an inhomogeneous stress change caused by this asymmetry during cold rolling with lateral flow became stronger in the softer grain direction.
Asymmetry was also exhibited in the {110}, {200}, and {211} complete pole figures, as shown in Figure 3e–g; this asymmetry was also induced by the large shear deformation during processing. The grains from randomly oriented texture components rotated toward the ideal rolling texture components after cold rolling. The texture seen in {110} developed in the bcc phase, as shown in Figure 3e. The dominant {110} fiber texture component was strengthened by annealing. The weak {110}<100> slip systems were active, introducing {111} fibers. Additionally, relaxation will occur during the recrystallization process [21]. The strength-ductility mechanical behavior of the Fe22Co20Ni19Cr20Mn12Al7 alloy is a function of the thermomechanical treatment, as shown in our previous research [17]. The texture components became stronger, which is not due to the brittle to ductile transition temperature but is instead due to relaxation recrystallization occurring at a higher temperature. In the current alloy, the temperature point is more than 900 °C. This depends on the diffusion dissociation of the {110} dislocations before 900 °C [22].
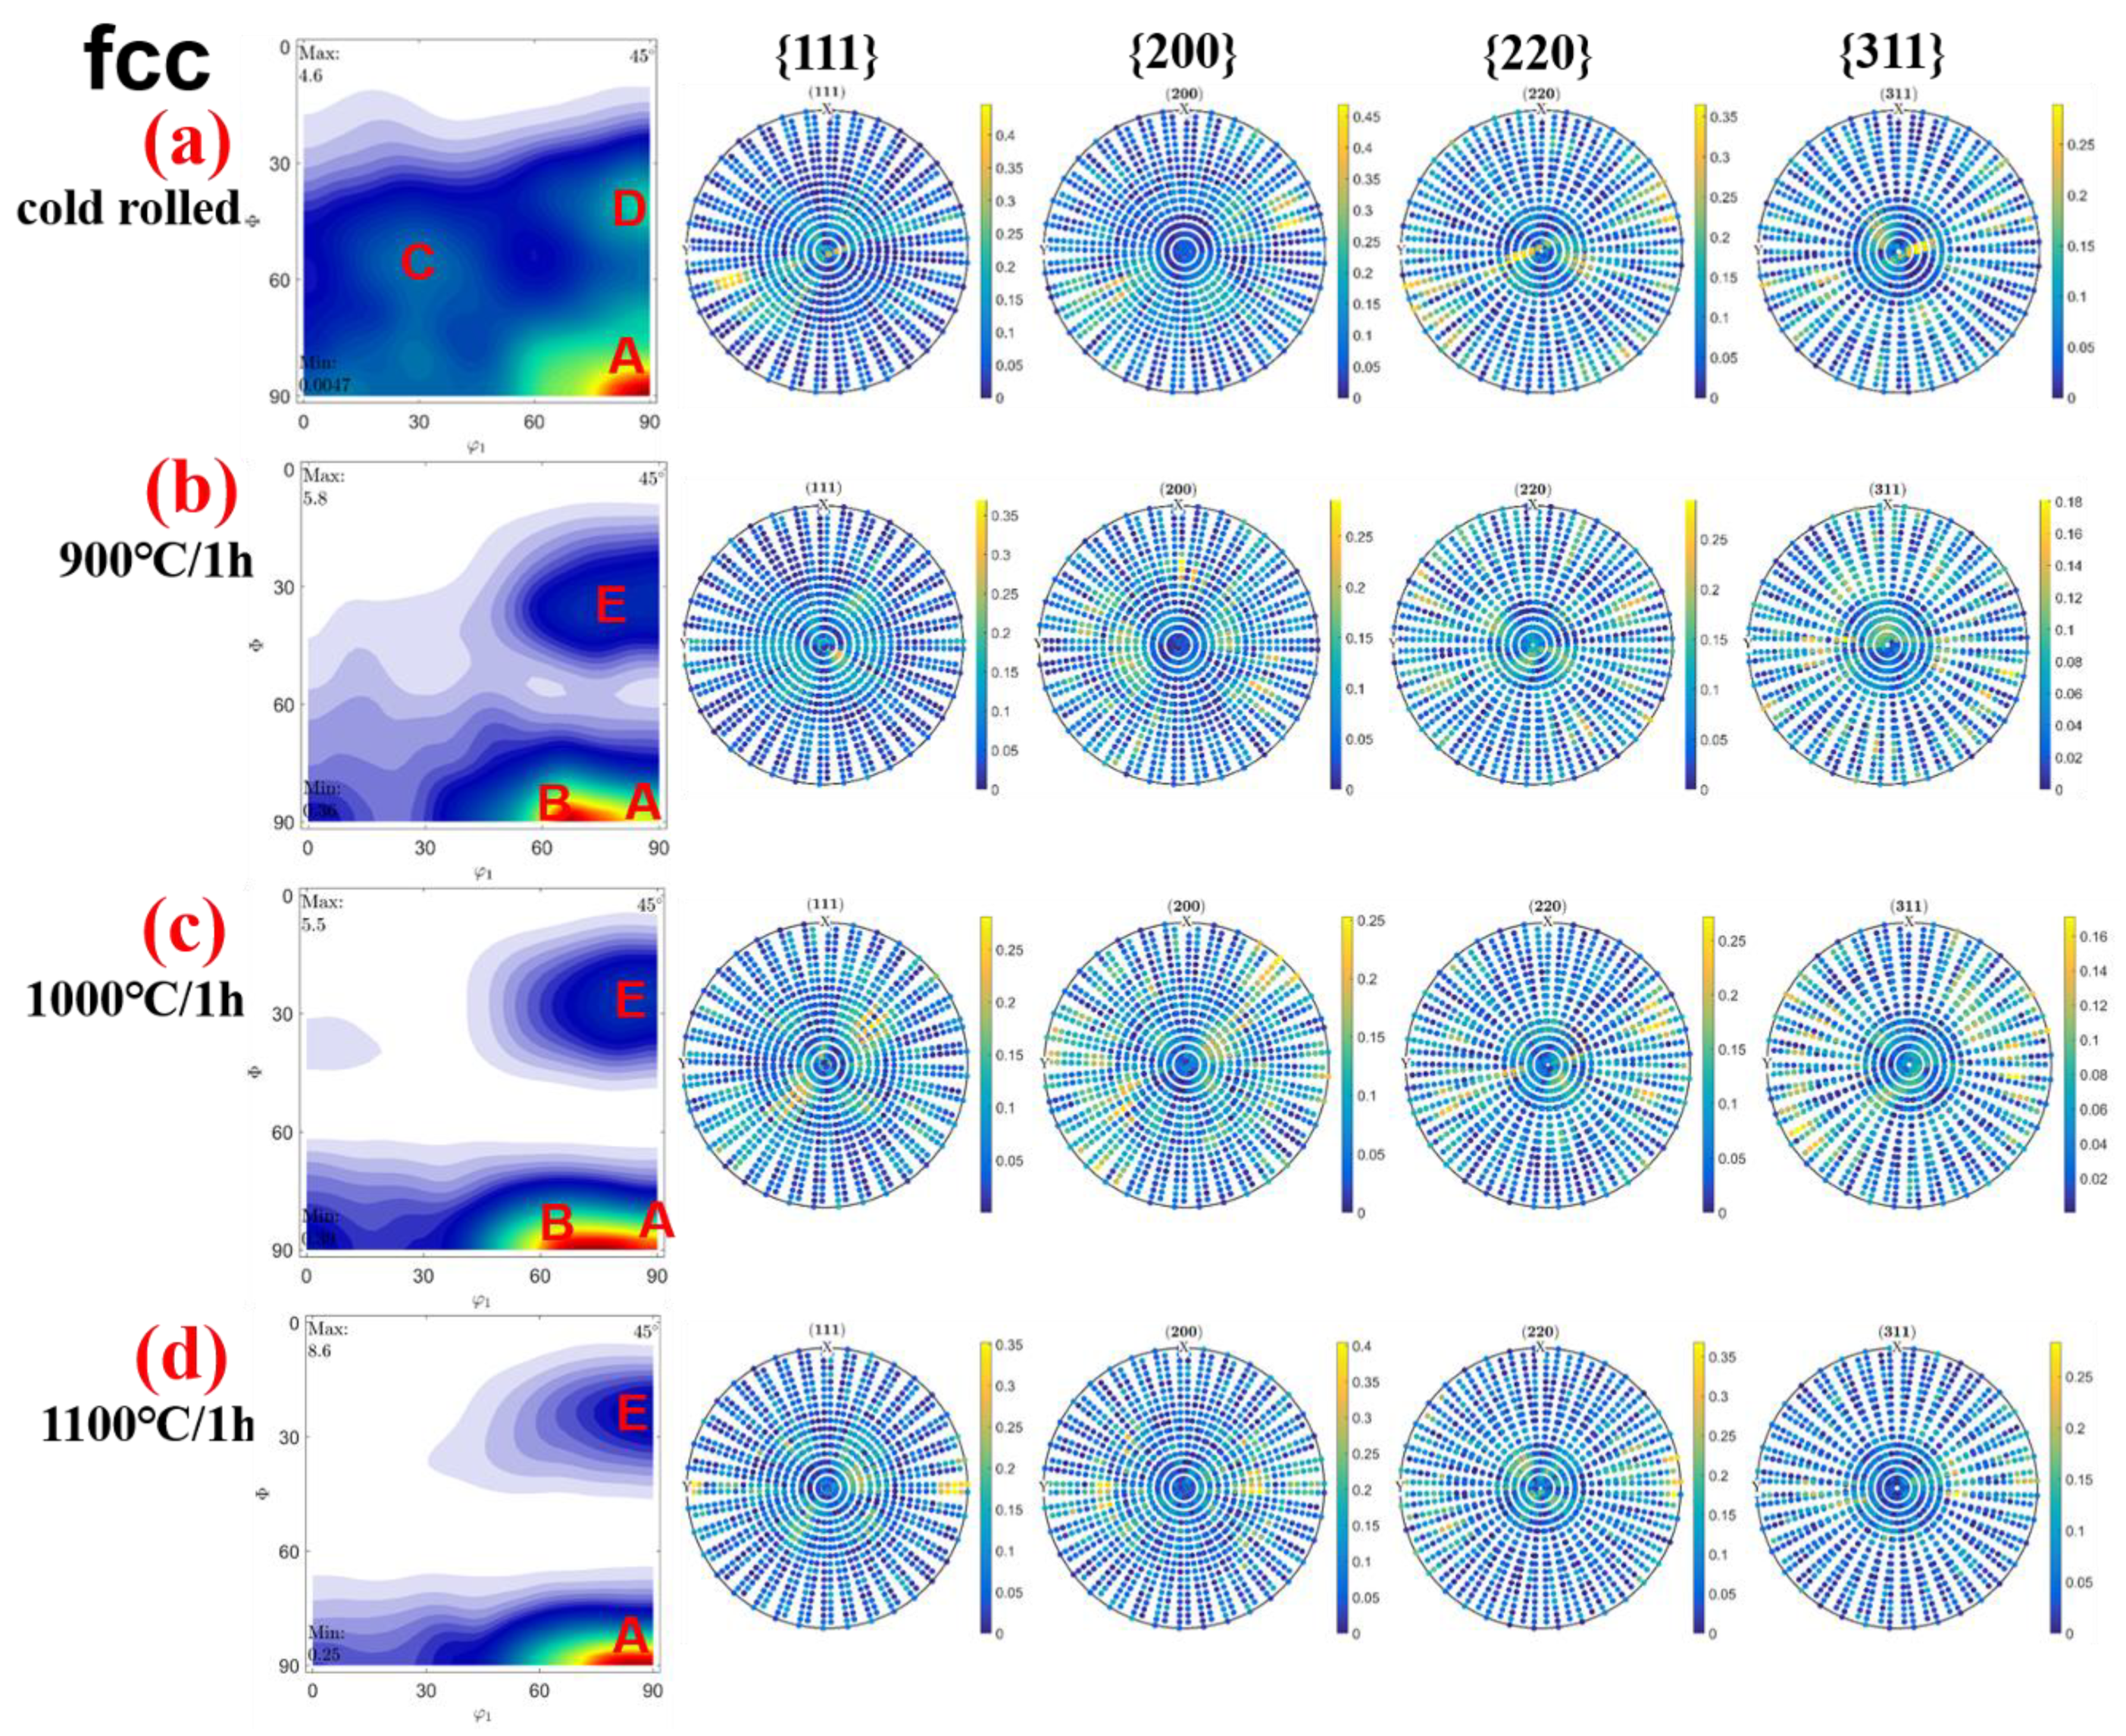
To better understand the recrystallized texture evolution within three dimensions, we present the fcc and bcc phase texture components and fiber characterization, which were found when φ2 = 45° in the orientation distribution function (ODF) section of the Euler space (φ1, Φ, φ2), as shown in Figure 4. The main texture components of the fcc and bcc phases in the rolling and other annealing states are described by the Miller indices and Euler angles in Table 1. In the fcc phase, the components are {110}<100> ζ (labeled as A, i.e., the Goss texture) and a low intensity for {111}<112> ε (labeled as C, i.e., the brass texture) in the cold-rolled state. As seen in Figure 4b–d, a new texture component {4 4 11}<-11 -11 8> (labeled as E, i.e., the Dillamore texture) replaced the brass texture components (Figure 4a) after the annealing treatment due to the driving force for nuclei formation of a particular orientation, as well as the sluggish diffusion that occurs during recrystallization. Abundant annealing twinning will be produced in the recrystallization process [10,23]. The {110}<112> ζ texture component (labeled as B, i.e., the brass texture) existed at 900 °C/1 h and 1000 °C/1 h, then it disappeared at 1100 °C/1 h. It has previously been reported that the brass-type texture was formed after substantial deformation in an fcc HEA [22,24]. It is noted that the Goss texture is almost the main texture component, which is equivalent to the φ1, Φ, and φ2 values of 90°, 90°, and 45°, respectively (as shown in Figure 4a–d). Furthermore, the right part of Figure 4a–d shows the difference observed from a comparison between the raw data of the pole figures and the recalculated ODFs in the fcc phase, indicating that the difference is less than 0.5.
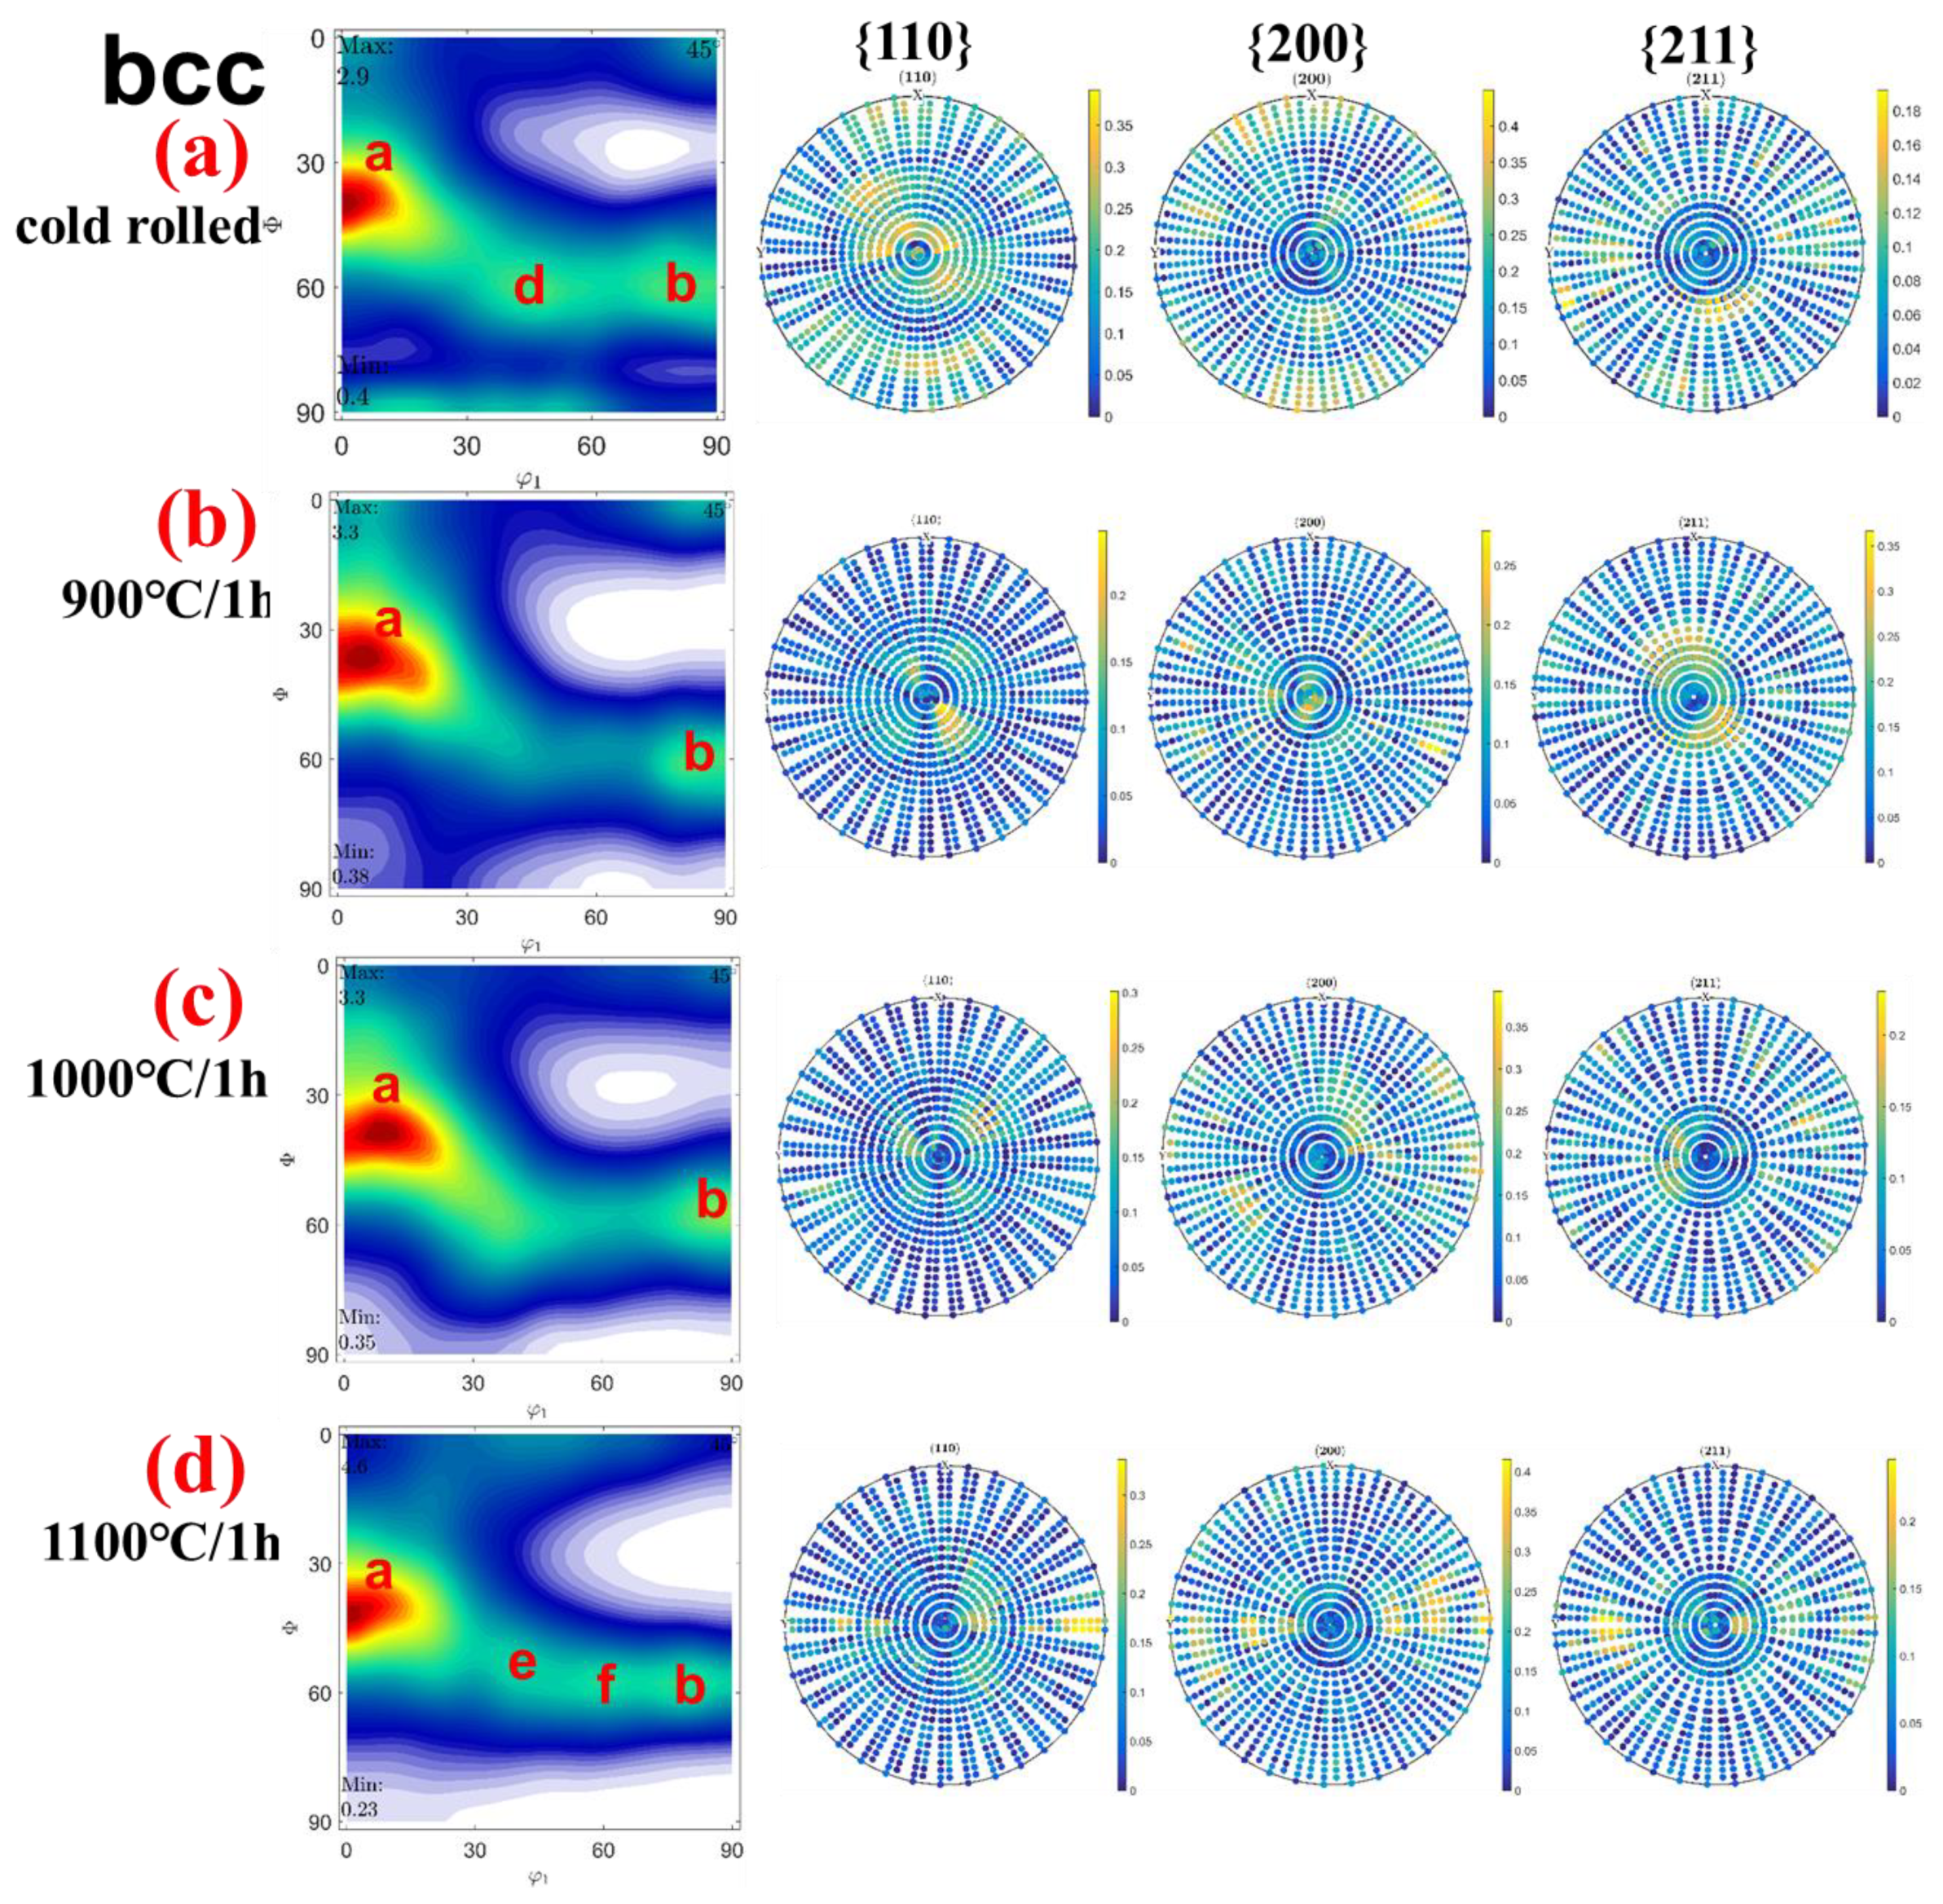
The major texture components in the bcc phase are characterized as {112}<110> α (labeled as a) and {111}<112> γ (labeled as b), as presented in Figure 5a–d. The subsequent annealing obviously intensified the textures. This shows that the increasing annealing temperature, especially at 1100 °C, promoted an intensity enhancement in the {112}<110> main component texture. The maximum intensity values reached 7.9 times random in the fcc phase and 4.5 times random in the bcc phase at 1100 °C/1 h. In cold rolling, the {111}<1-32> γ (d) texture disappeared after annealing, whereas the {111}<1-21> γ (e) and {111}<0-11> γ (f) textures were observed after 1100 °C/1 h, which indicated that the martensitic texture components were reformed. The change in the texture of the bcc phase from the cold-rolled to the annealed states was caused by the occurrence of new (101)bcc martensite in the deformation, as shown in our previous study [17]. Furthermore, the right part of Figure 5a–c shows the difference observed from the comparison between the raw data of the pole figures and the recalculated ODFs in the bcc phase. This suggests that the difference values are all less than 0.5, which is within the margin of error.
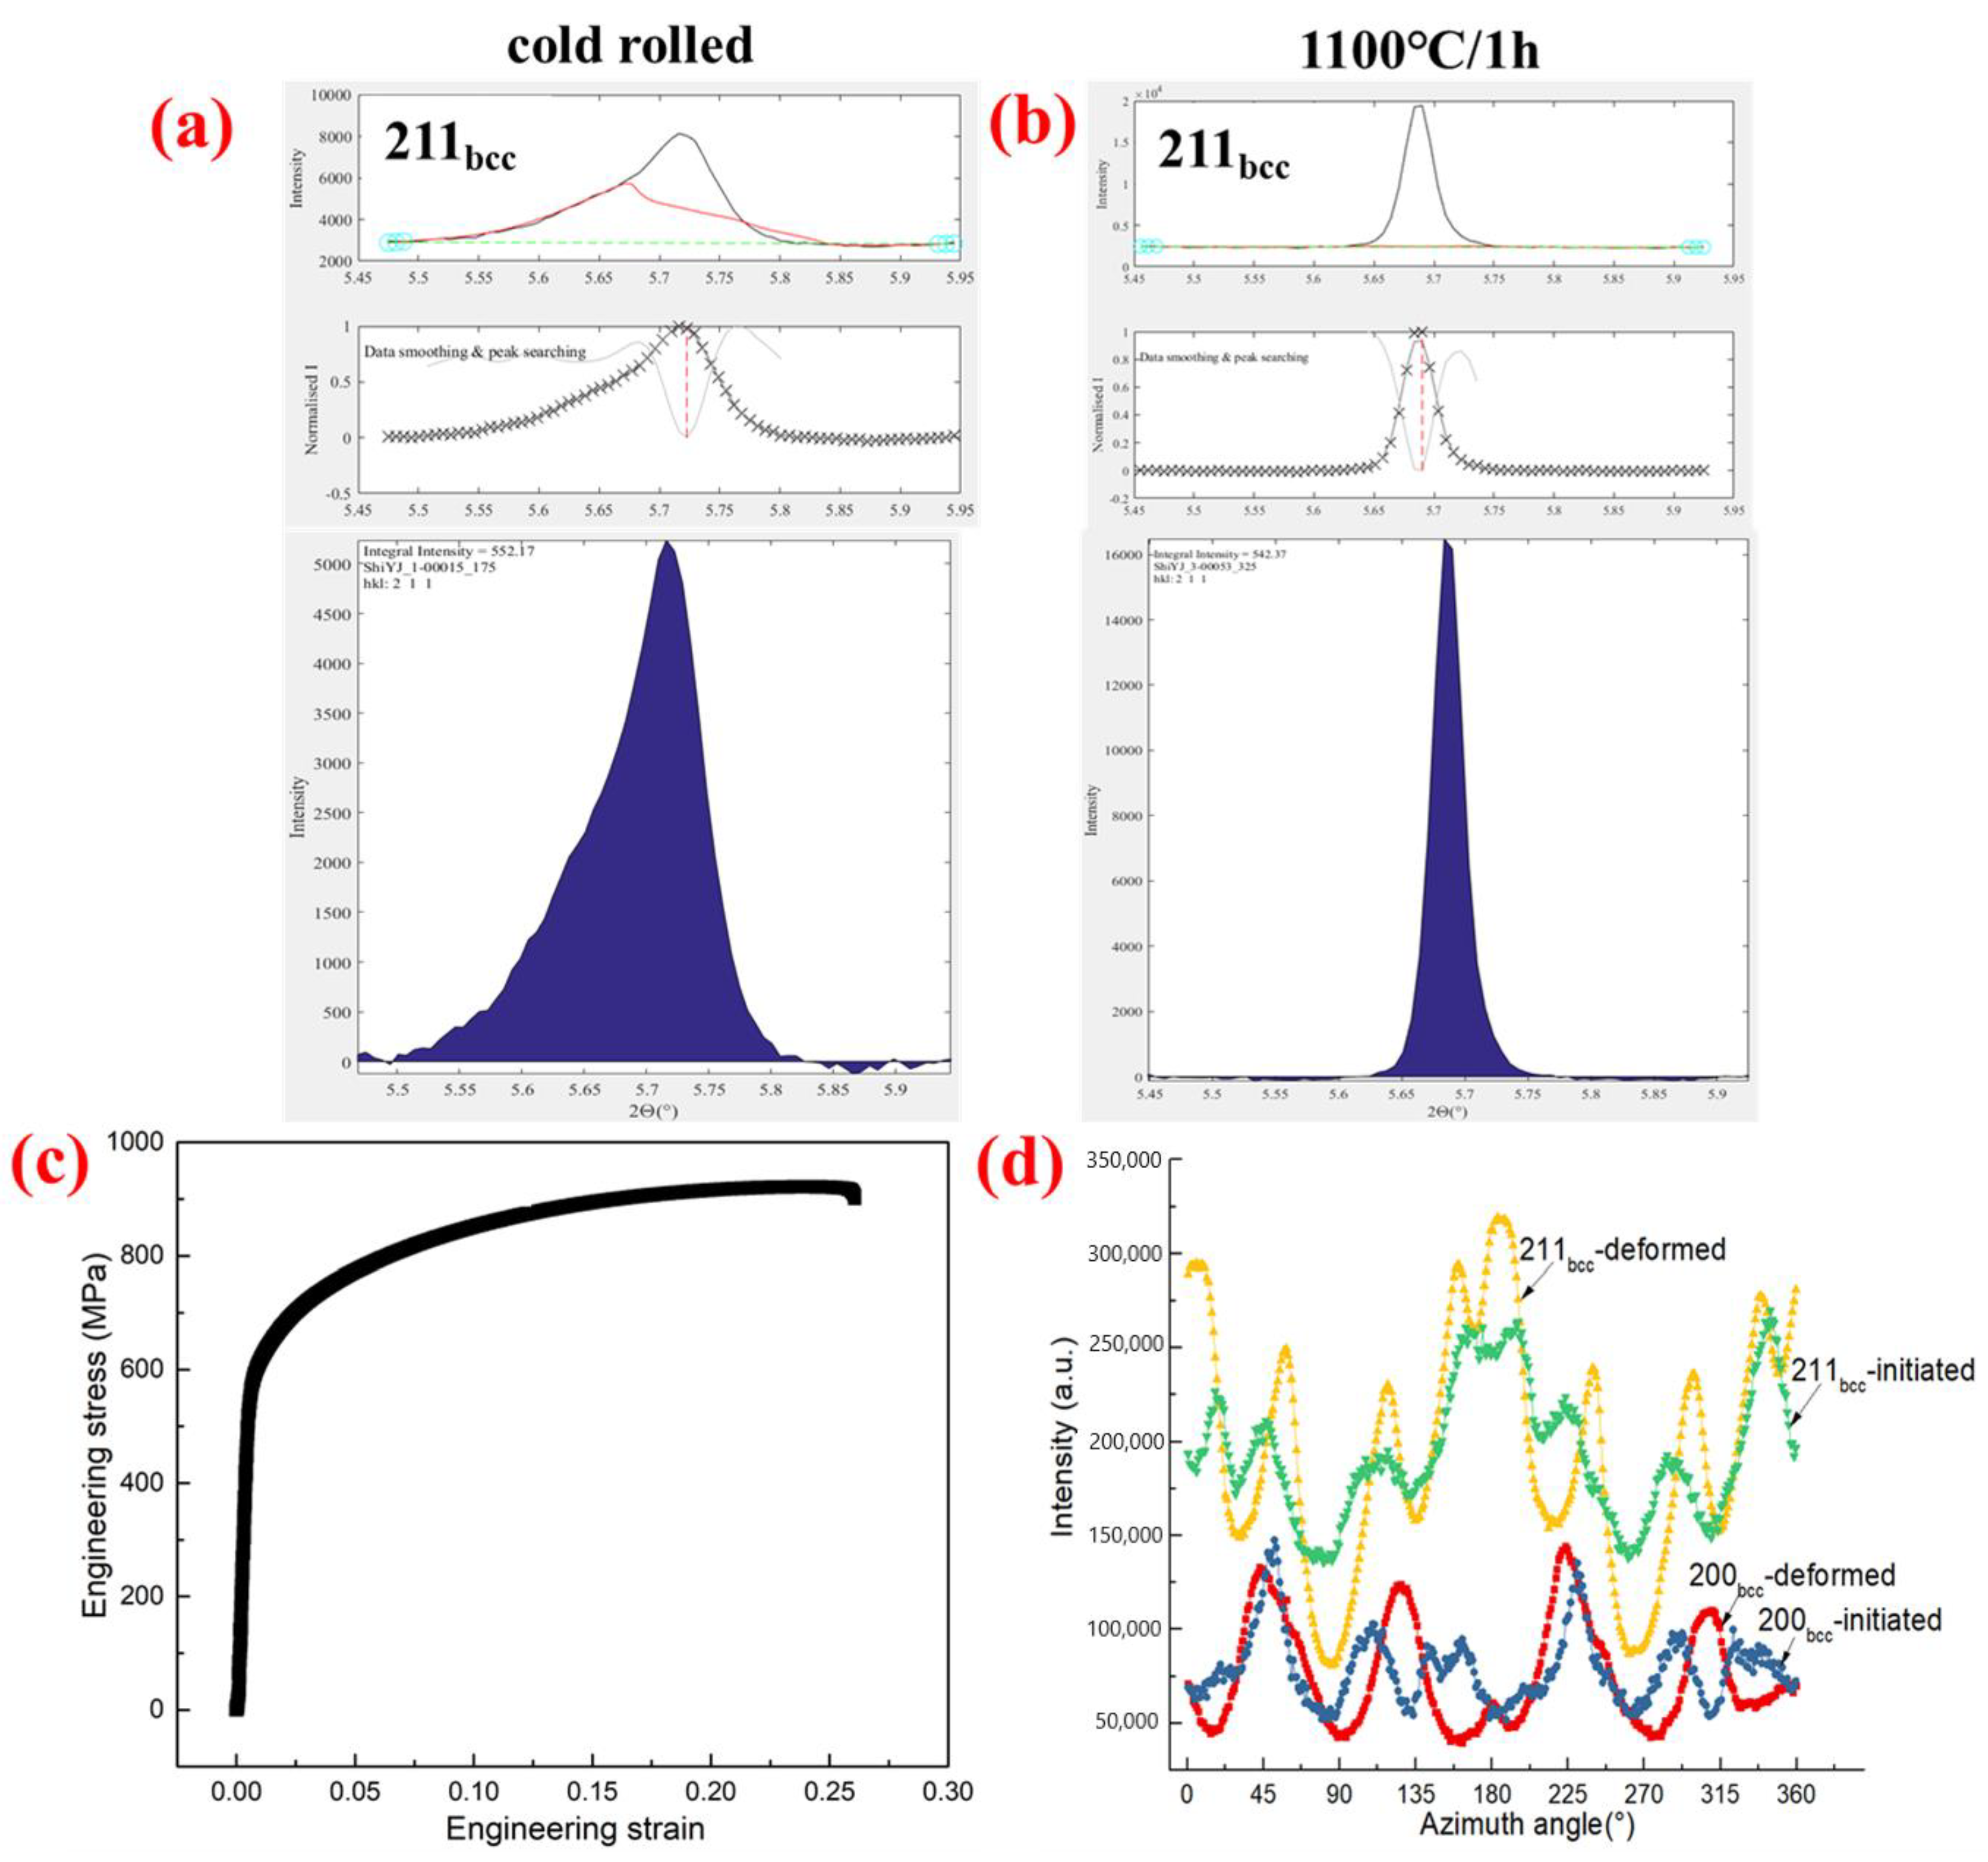
The fitting of the {200} and {211} peaks revealed an obvious asymmetrical character in the bcc phase, as seen in Figure 6a,b. Initially, it is inferred that this resulted from chemical inhomogeneity or residual stress. This result suggested that the asymmetry belongs to the latter condition, as the asymmetry disappears in other annealing fitting states. The effect related to the fraction of dynamically recrystallized grains on the bcc phase of the Al0.5CoCrFeMnNi alloy was pronounced from 1173 K to 1223 K, even at a high strain rate of 10 s−1 [25].
Thus, to study the evolution of texture during tensile deformation and the effect of the texture characteristics on the mechanical properties, in situ tensile experiments with specimens annealed at 1000 °C/h were performed by high-energy X-ray diffraction. The room temperature tension curve of the annealed sheet is shown in Figure 6c. The yield strength (YS) and ultimate tensile strength (UTS) of the sample were 570 MPa and 920 MPa, respectively, which shows a fracture elongation of 27%. The integral intensities of the diffraction peaks of each azimuthal angle were calculated from the collected Debye-Scherrer rings, and they were exhibited by the curve of the diffraction intensity and the azimuthal angle. To quantitatively analyze the texture evolution, the integral intensities of each azimuthal angle of the diffraction peaks in the bcc phase are plotted in Figure 6d. It shows the {211}bcc and {200}bcc Bragg peaks recorded on the undeformed and deformed samples. The results show integrated intensities of {211}bcc and {200}bcc Bragg peaks, corresponding to the {112}<110> α and {111}<112> γ fiber textures component along the azimuthal angle, respectively. The diffraction intensity along the azimuthal angle was heterogeneous, which represents the texture component. The results show low integral intensities due to the broadening of the peaks by large plastic deformation along the loading direction. The broader peaks of the two fiber components could be an indication of a higher dislocation content. The texture component <110>//LD developed when plastic deformation occurred in the bcc phase. It has been reported that the bcc phase in the FeCoNiCrMnAl HEA provides dynamic nucleation sites for recrystallized grains in the fcc phase in uniaxial tensile tests and hot compressive deformation [17,25].

4. Discussion

4.1. Orientation Correlation between the fcc and bcc Phases

In the present HEA, the brass and Goss texture components in the fcc phase constitute the original rolling texture, which is stable and does not favor martensitic transformation; they are further stabilized by shear banding. However, in the bcc phase, the {110} texture changed, which is related to the specific stress-induced confined martensitic phase transformation [17]. In the current HEA, as the rolling reduction increases, a mixture of {112}<110> α fiber texture and {111}<112> γ fiber textures forms in the bcc phase. The {112}<110> α fiber texture and {111}<112> γ fiber texture mainly originate from the intensified {001}<100> and {110}<001> components, respectively. This is consistent with the grain orientation rotation paths in low-carbon steel after cold rolling [26]. In the present alloy, the {111}<112> γ component is the phase transformation texture, and the {112}<110> α component texture is the deformation texture. The {111}<112> component is characterized by limited stability and tends to rotate to {111}<110> about the <111> axis upon further rolling [27,28,29]. The {110}<001> component is unstable and shows a rotation toward {111}<112>, about the <110> axis.

4.2. Annealing Effects on the Cold-Rolled Texture

In the alloy, the {200}fcc and {220}fcc planes exhibited strong texture from the high-intensity diffraction spots at the X-ray Debye rings, especially in the cold-rolled state. The content of the bcc phase increased and reached its highest value with increasing annealing temperature, then decreased at 1100 °C. In the fcc phase, the components are the Goss texture component and a low-intensity brass texture in the cold-rolled state. The stacking fault energy (SFE), rolling reduction, and deformation temperature are important factors affecting the rolling texture [12,30,31]. The major texture components are characterized as {112}<110> α and {111}<112> γ at four states in the bcc phase. The {200} and {211} peaks exhibited asymmetry in the bcc phase after cold rolling. The asymmetry was eliminated after annealing at temperatures of 900 °C/h~1100 °C/h, with recrystallization and relaxation of the stress. The oriented nucleation and initial texture depend on the texture transition. The deformation texture is characterized by the {110}//RD and <111>//ND components in the bcc phase. In the bcc phase, the recrystallization texture primarily retained the deformation texture since the slip in the phase occurred primarily on the {011}<100> and {010}<100> systems, providing only three independent slip systems. This is consistent with the NiAl alloy [15,32]. The {110} fiber texture was formed in the cold-rolled state and continued in the recrystallized states between 900 °C/1 h and 1100 °C/1 h, which is consistent with the NiA1 alloy. These observations suggest that tuning the final texture of the recrystallization to obtain superior mechanical properties will become possible [33]. We expect that it will be possible to obtain an optimized texture component by tuning the annealing treatment to synthesize the corresponding HEA, combined with fcc and bcc textures, to satisfy the special requirements due to industrial importance in the future.

5. Conclusions

In this investigation, the effect of annealed temperature (900 °C~1100 °C) on the recrystallized texture of FeCoNiCrMnAl0.5 HEA has been systematically studied, based on the cold rolled microstructure at a reduction of 75%. These meaningful findings can be summarized as follows:
  • In the fcc phase, the {1-1-1}//RD orientation decreased and then rotated toward {100}//RD with increasing annealing temperature. Here, <001>//ND is the dominant orientation in the cold-rolled and annealed states. A new texture component, {4 4 11}<-11 -11 8>, replaced {112}<111> after the annealing treatment.
  • The orientation relationships between {111}fcc//{110}bcc and <110>fcc//<111>bcc are observed in the FeCoNiCrMnAl0.5 HEA.
  • The Goss texture component in the fcc phase and α{112}<110> texture component in the bcc phase exhibited similar trends. The major texture components in the bcc phase are confirmed as {112}<110> α and {111}<112> γ in four annealed states.
  • The {200} and {211} peaks exhibited asymmetry in the bcc phase, resulting from the residual stress during cold rolling. The asymmetry was eliminated after annealing at temperatures of 900 °C/h~1100 °C/h with recrystallization and relaxation of the stress.

Author Contributions

Conceptualization, Y.S. and Y.-D.W.; methodology, Y.S., S.L. and R.L.; software, Y.S., Y.W.; validation, Y.S., R.L., Y.C. and Y.-D.W.; formal analysis, R.L., Y.C. and Y.S; investigation, Y.S., Y.W., S.L., R.L., Y.C. and Y.-D.W. All authors have read and agreed to the published version of the manuscript.

Funding

This work was supported by the National Key Research and Development Program of China (Grant No. 2017YFA0403804), the National Natural Science Foundation of China (NSFC) (Grant Nos. 51471032 and 51527801), the Fundamental Research Funds for the Central Universities (Grant No. 06111020), the State Key Laboratory for Advanced Metals and Materials (Grant No. 2016Z-19), the Tianshan Innovation Team Program of Xinjiang Uygur Autonomous Region (Grant No. 2020D14038), the Natural Science Foundation of Xinjiang Uygur Autonomous Region of China (Grant No. 2022D01C70), and the Xinjiang Tianchi Doctoral Project (Grant No. TCBS202129). The use of the Advanced Photon Source was supported by the US Department of Energy, Office of Science, Office of Basic Energy Sciences, under Contract No. DE-AC02-06CH11357.

Institutional Review Board Statement

Not applicable.

Informed Consent Statement

Not applicable.

Data Availability Statement

Not applicable.

Conflicts of Interest

The authors declare no conflict of interest.

References

  1. Hoseini-Athar, M.M.; Mahmudi, R.; Prasath Babu, R.; Hedström, P. Tailoring the texture of an extruded Mg sheet through constrained groove pressing for achieving low mechanical anisotropy and high yield strength. Scr. Mater. 2020, 186, 253–258. [Google Scholar] [CrossRef]
  2. Hamad, K.; Chung, B.K.; Ko, Y.G. Effect of deformation path on microstructure, microhardness and texture evolution of interstitial free steel fabricated by differential speed rolling. Mater. Charact. 2014, 94, 203–214. [Google Scholar] [CrossRef]
  3. Lobanov, M.L.; Loginov, Y.N.; Danilov, S.V.; Golovin, M.A.; Karabanalov, M.S. Effect of Hot Rolling Rate on the Structure and Texture Condition of Plates of the Al–Si–Mg Alloy System. Met. Sci. Heat Treat. 2018, 60, 322–328. [Google Scholar] [CrossRef]
  4. Sathiaraj, G.D.; Pukenas, A.; Skrotzki, W. Texture formation in face-centered cubic high-entropy alloys. J. Alloy. Compd. 2020, 826, 154183. [Google Scholar] [CrossRef]
  5. Tazuddin; Biswas, K.; Gurao, N.P. Deciphering micro-mechanisms of plastic deformation in a novel single phase fcc-based MnFeCoNiCu high entropy alloy using crystallographic texture. Mat. Sci. Eng. A Struct. 2016, 657, 224–233. [Google Scholar] [CrossRef]
  6. Madhavan, R.; Ray, R.K.; Suwas, S. New insights into the development of microstructure and deformation texture in nickel–60 wt.% cobalt alloy. Acta Mater. 2014, 78, 222–235. [Google Scholar] [CrossRef]
  7. Kalsar, R.; Ray, R.K.; Suwas, S. Effects of alloying addition on deformation mechanisms, microstructure, texture and mechanical properties in Fe-12Mn-0.5C austenitic steel. Mater. Sci. Eng. A 2018, 729, 385–397. [Google Scholar] [CrossRef]
  8. Gottstein, G. Physical Foundations of Materials Science. Mater. Today 2004, 7, 197–302. [Google Scholar]
  9. Kestens, L.A.I.; Pirgazi, H. Texture formation in metal alloys with cubic crystal structures. Mater. Sci. Tech. Lond. 2016, 32, 1303–1315. [Google Scholar] [CrossRef] [Green Version]
  10. Sathiaraj, G.D.; Bhattacharjee, P.P.; Tsai, C.W.; Yeh, J.W. Effect of heavy cryo-rolling on the evolution of microstructure and texture during annealing of equiatomic CoCrFeMnNi high entropy alloy. Intermetallics 2016, 69, 1–9. [Google Scholar] [CrossRef]
  11. Shafiei, E.; Dehghani, K.; Ostovan, F.; Toozandehjani, M. Effect of Microstructure and Texture Evolution During Variable Gauge Rolling on Mechanical Properties of Tailor Rolled Blanks. Met. Mater. Int. 2019, 25, 1378–1387. [Google Scholar] [CrossRef]
  12. Bhattacharjee, P.P.; Sathiaraj, G.D.; Zaid, M.; Gatti, J.R.; Lee, C.; Tsai, C.W.; Yeh, J.W. Microstructure and texture evolution during annealing of equiatomic CoCrFeMnNi high-entropy alloy. J. Alloy. Compd. 2014, 587, 544–552. [Google Scholar] [CrossRef]
  13. Kalidindi, S.R. modeling anisotropic strain hardening and deformation textures in low stacking fault enegy fcc metals. Int. J. Plast. 2001, 17, 837–860. [Google Scholar] [CrossRef]
  14. Skrotzki, W.; Pukenas, A.; Odor, E.; Joni, B.; Ungar, T.; Völker, B.; Hohenwarter, A.; Pippan, R.; George, E.P. Microstructure, Texture, and Strength Development during High-Pressure Torsion of CrMnFeCoNi High-Entropy Alloy. Crystals 2020, 10, 336. [Google Scholar] [CrossRef]
  15. Bonis, L.J.; Duga, J.J.; Gilman, J.J. Fracture of Metals, Polymers, and Glasses: Proceedings. Fundam. Phenom. Mater. Sci. 1967, 10, 139–146. [Google Scholar]
  16. He, Y.; Godet, S.; Jacques, P.J.; Jonas, J.J. Crystallographic relations between face- and body-centred cubic crystals formed under near-equilibrium conditions: Observations from the Gibeon meteorite. Acta Mater. 2006, 54, 1323–1334. [Google Scholar] [CrossRef]
  17. Shi, Y.J.; Li, S.L.; Tung, L.L.; Hui, X.D.; Zhang, Z.; Li, R.; Zhang, M.; Kabra, S.; Wang, Y.-D. In situ neutron diffraction study of a new type of stress-induced confined martensitic transformation in Fe22Co20Ni19Cr20Mn12Al7 high-entropy alloy. Mater. Sci. Eng. A 2020, 771, 138555. [Google Scholar] [CrossRef]
  18. He, J.Y.; Liu, W.H.; Wang, H.; Wu, Y.; Liu, X.J.; Nieh, T.G.; Lu, Z.P. Effects of Al addition on structural evolution and tensile properties of the FeCoNiCrMn high-entropy alloy system. Acta Mater. 2014, 62, 105–113. [Google Scholar] [CrossRef]
  19. McChesney, J.L.; Reininger, R.; Ramanathan, M.; Benson, C.; Srajer, G.; Abbamonte, P.; Campuzano, J.C. The intermediate energy X-ray beamline at the APS. Nucl. Instrum. Meth. A 2014, 746, 98–105. [Google Scholar] [CrossRef]
  20. Chen, S.F.; Song, H.W.; Zhang, S.H.; Cheng, M.; Lee, M.G. Effect of shear deformation on plasticity, recrystallization mechanism and texture evolution of Mg–3Al–1Zn alloy sheet: Experiment and coupled finite element-VPSC simulation. J. Alloy. Compd. 2019, 805, 138–152. [Google Scholar] [CrossRef]
  21. Harris, K.E.; Ebrahimi, F.; Garmestani, H. Texture evolution in NiAl. Mater. Sci. Eng. A 1998, 247, 187–194. [Google Scholar] [CrossRef]
  22. Sathiaraj, G.D.; Ahmed, M.Z.; Bhattacharjee, P.P. Microstructure and texture of heavily cold-rolled and annealed fcc equiatomic medium to high entropy alloys. J. Alloy. Compd. 2016, 664, 109–119. [Google Scholar] [CrossRef]
  23. Haase, C.; Barrales-Mora, L.A. Influence of deformation and annealing twinning on the microstructure and texture evolution of face-centered cubic high-entropy alloys. Acta Mater. 2018, 150, 88–103. [Google Scholar] [CrossRef] [Green Version]
  24. Reddy, S.R.; Ahmed, M.Z.; Sathiaraj, G.D.; Bhattacharjee, P.P. Effect of strain path on microstructure and texture formation in cold-rolled and annealed fcc equiatomic CoCrFeMnNi high entropy alloy. Intermetallics 2017, 87, 94–103. [Google Scholar] [CrossRef]
  25. Kim, W.J.; Jeong, H.T.; Park, H.K.; Park, K.; Na, T.W.; Choi, E. The effect of Al to high-temperature deformation mechanisms and processing maps of Al0.5CoCrFeMnNi high entropy alloy. J. Alloy. Compd. 2019, 802, 152–165. [Google Scholar] [CrossRef]
  26. Inagak, H. Fundamental aspect of texture formation in Low carbon steel. ISIJ Int. 1994, 34, 313–321. [Google Scholar] [CrossRef] [Green Version]
  27. Lucke, R.K. Rabbe Texture and microstructure of hot rolled steel. Scr. Metal. 1992, 26, 1221–1226. [Google Scholar]
  28. Tóth, L.S.; Jonas, J.J.; Daniei, D.; Ray, R.K. Development of ferrite rolling textures in low- and extra low-carbon steels. Met. Trans. A 1990, 21, 2985–3000. [Google Scholar] [CrossRef]
  29. Inagaki, H.; Suda, T. The development of rolling textures in low-carbon steels. Texture Stress Microstruct. 1972, 1, 129–140. [Google Scholar] [CrossRef] [Green Version]
  30. El-Danaf, E.; Kalidindi, S.R.; Doherty, R.D.; Necker, C. Deformation texture transition in brass: Critical role of micro-scale shear bands. Acta Mater. 2000, 48, 2665–2673. [Google Scholar] [CrossRef]
  31. Haase, C.; Chowdhury, S.G.; Barrales-Mora, L.A.; Molodov, D.A.; Gottstein, G. On the Relation of Microstructure and Texture Evolution in an Austenitic Fe-28Mn-0.28C TWIP Steel During Cold Rolling. Metall. Mater. Trans. A 2012, 44, 911–922. [Google Scholar] [CrossRef]
  32. Sakata, T.; Yasuda, H.Y.; Umakoshi, Y. Control of microstructure and orientation distribution in Ni-Al-based β/γ’two phase alloys by thermomechanical processing. Acta Mater. 2001, 49, 4231–4239. [Google Scholar] [CrossRef]
  33. Moravcik, I.; Cizek, J.; Zapletal, J.; Kovacova, Z.; Vesely, J.; Minarik, P.; Kitzmantel, M.; Neubauer, E.; Dlouhy, I. Microstructure and mechanical properties of Ni1,5Co1,5CrFeTi0,5 high entropy alloy fabricated by mechanical alloying and spark plasma sintering. Mater. Des. 2017, 119, 141–150. [Google Scholar] [CrossRef]
Figure 1. (a) Schematic of the in situ HE-XRD texture experiment setup. Note that rotation (ω): 0–180°, and the rotated angle with the z-axis, azimuth (β): 0–360°. (b) One-dimensional (1D) HE–XRD patterns; (cf) two-dimensional (2D) Debye ring patterns of the alloy in different annealed states.
Metals 12 01674 g001
Figure 2. Experimental inverse pole figures (IPFs) in the RD, TD, and ND of the fcc phase (ac) and bcc phase (df), at an annealing temperature of 900 °C/1 h~1100 °C/1 h.
Metals 12 01674 g002
Figure 3. The complete pole figures indicate the intensities of (a) {111}, (b) {200}, (c) {220}, (d) {311}, (e) {110}, (f) {200}, and (g) {211} in the cold-rolled state and the annealed states at 900 °C, 1000 °C, and 1100 °C in the fcc phase and bcc phase. Note that x and y represent RD and TD, respectively.
Metals 12 01674 g003
Figure 4. The orientation distribution functions (ODFs) and the difference between the calculated ODFs and the raw data in the pole figure of the fcc phase in the HEA, annealed at (a) cold-rolled, (b) 900 °C/1 h, (c) 1000 °C/1 h, and (d) 1100 °C/1 h. Note that φ2 = 45°.
Metals 12 01674 g004
Figure 5. The orientation distribution functions (ODFs) and the difference between the calculated ODFs and the raw data in the pole figure of the bcc phase in the HEA, annealed at (a) cold-rolled, (b) 900 °C/1 h, (c) 1000 °C/1 h, and (d) 1100 °C/1 h. Note that φ2 = 45°.
Metals 12 01674 g005
Figure 6. (a) Symmetry and (b) asymmetry of {211}bcc under cold rolling and at 1100 °C/1 h. (c) Tensile engineering stress-strain curve of the FeCoNiCrMnAl0.5 alloy at room temperature. (d) Integral intensity of the {211}bcc and {200}bcc Debye–Scherrer rings along the entire azimuthal angle when the incident beam was parallel to the rolling direction.
Metals 12 01674 g006
Table 1. Designation of the main cold rolling and recrystallizing texture components, and the corresponding Miller indices and Euler angles (Bunge notation).
ComponentMiller IndicesEuler Angles (φ1, Φ, φ2)Symbol
Goss{110}<001>90°, 90°, 45°ζ (A)
Brass{110}<1-12>60°, 90°, 45°(B)
Brass{111}<1-21>30°, 60°, 45°ε (C)
Copper{112}<-1-11>90°, 45°, 45°(D)
Dillamore{4 4 11}<-11 -11 8>90°, 30°, 45°(E)
Cube{112}<1-10>0°, 30°, 45°α(a)
Cube{111}<112>90°, 60°, 45°γ(b)
Cube{111}<0-11>60°, 60°, 45°γ(f)
Cube{111}<1-21>30°, 60°, 45°γ(e)
Cube{111}<1-32>45°, 60°, 45°Γ(d)
Publisher’s Note: MDPI stays neutral with regard to jurisdictional claims in published maps and institutional affiliations.