Article

Microstructure, Mechanical and Superelastic Properties of Ti-Zr-Nb Alloy for Biomedical Application Subjected to Equal Channel Angular Pressing and Annealing

1
Metal Forming Department, National University of Science and Technology MISIS, 119049 Moscow, Russia
2
Laboratory of Nanostructured Materials Physics, Institute of Molecule and Crystal Physics, Ufa Federal Research Center RAS, 450075 Ufa, Russia
3
Institute of Physics of Advanced Materials, Ufa State Aviation Technical University, 12 K. Marx Str., 450008 Ufa, Russia
4
Laboratory of Hybrid Nanostructured Materials, National University of Science and Technology “MISiS”, 119049 Moscow, Russia
5
Department of Physical Metallurgy of Non-Ferrous Metals, National University of Science and Technology “MISiS”, 119049 Moscow, Russia
6
Department of Mechanical Engineering, École de Technologie Supérieure, 1100 Notre-Dame Street West, Montreal, QC H3C 1K3, Canada
*
Author to whom correspondence should be addressed.
Metals 2022, 12(10), 1672; https://doi.org/10.3390/met12101672
Submission received: 22 August 2022 / Revised: 1 October 2022 / Accepted: 3 October 2022 / Published: 5 October 2022
(This article belongs to the Special Issue Microstructure and Mechanical Behaviour of Shape Memory Alloys)

Abstract

:
Biomedical Ti-18Zr-15Nb (at.%) shape memory alloy was subjected to a low-temperature equal channel angular pressing (ECAP) at 200 °C for three passes and post-deformation annealing (PDA) in the 400–650 °C temperature range for 1 to 60 min. It was observed that ECAP led to the formation of an inhomogeneous highly dislocated substructure of β-phase with a large number of differently oriented deformation bands containing nanograined and nano-subgrained areas. In this state, the alloy strength increased significantly, as compared to the undeformed state, but its ductility and superelasticity deteriorated appreciably. As a result of a short-term (5 min) PDA at 550–600 °C, the processes of polygonization of an entire volume of the material and recrystallization inside the deformation bands were observed. After PDA at 600 °C for 5 min, the alloy manifested a relatively high strength (UTS = 650 MPa), a satisfactory ductility (δ = 15%) and a superior superelastic behavior with a maximum superelastic recovery strain of εrsemax = 3.4%.

1. Introduction

Currently, titanium and titanium alloys are the most commonly used metallic materials for bone implants due to their high specific strength, excellent biocompatibility and good corrosion resistance [1,2,3]. However, to satisfy the ever-present need for continuous improvement of modern surgery practices, the functional requirements for these materials in terms of their biological and biomechanical compatibility are becoming ever more restrictive. New opportunities to increase the biomechanical compatibility of bone implants have been opened with the inception of shape memory alloys (SMA), which mimic the low-stiffness superelastic behavior of bone tissues [4,5]. The major disadvantage of traditional titanium-nickel SMAs is that they contain toxic nickel, which may cause allergic reactions [5,6,7]. In this context, Ni-free Ti-based SMAs (such as Ti-Zr-Nb for example) have attracted considerable interest, especially over the last fifteen years [6,7,8,9,10,11,12,13]. The mechanical and functional properties of these alloys can be controlled by subjecting the cast alloy to various thermomechanical treatments (TMT) to form appropriate microstructures and substructures in parent high-temperature BCC β-phase [14,15,16,17]. For example, to increase the dislocation yield stress, and, consequently, the difference between dislocation and transformation yield stresses, the grain/subgrain microstructure of the alloy has to be refined [17,18]. However, structural refinement under a certain critical grain/subgrain size can lead to the deterioration of functional properties [19]. It is known in this context that a critical average grain size in severely cold-rolled and annealed Ti-18Zr-15Nb alloy (at.%) for stress-induced β→α″ transformation at room temperature is 36 ± 13 nm, while for cooling-induced β→α″ transformation, it is ~250 nm [17].
In addition to severe cold-rolling, high-pressure torsion (HPT) and equal-channel angular pressing (ECAP) are considered among the most effective severe plastic deformation (SPD) techniques for titanium and titanium alloys [20,21,22,23,24,25,26,27,28]. It was shown in [29] that HPT allows the formation of nanocrystalline structures in Ti-18Zr-15Nb alloy with a significant increase in the material microhardness. However, final HPT products in the form of thin disks limit any practical application of this technique, thus making ECAP a better alternative for the formation of ultrafine structures in bulk titanium alloys. To explore this possibility, in [30], Ti-35Nb-3Zr-2Ta alloy bulk specimens were subjected to ECAP at 500, 600 and 700 °C for one, two and four passes, and pressing at 500 °C for four passes resulted in the formation of ultrafine-grained β-phase microstructures with equiaxed grains approximately 300 nm in size. In this structural state, the alloy exhibited the following combination of mechanical and functional properties: ultimate tensile strength UTS = 765 MPa, Young’s modulus E = 60 GPa, relative elongation to failure δ = 16%, and maximum superelastic recovery strain εrsemax = 1.4%.
Furthermore, since a combination of severe cold deformation by rolling (e = 3) with post-deformation annealing (500–600 °C) allowed a promising improvement of the mechanical and functional properties of Ti-Zr-Nb SMA [17,31], it was decided to study the potential of a low-temperature ECAP of these alloys [32]. The study showed that ECAP at 250 °C (n = 7) results in the formation of a predominantly nanocrystalline structure of β-phase composed of equiaxed 20–100 nm-sized structure elements (grains and subgrains) and some amounts of α″-and ω-phases. As compared to the initial recrystallized state, this microstructure increased the mechanical resistance from UTS = 632 to 990 MPa, while decreasing the ductility from δ = 22.2 to 5.4%. When the as-ECAP material was subjected to post-deformation annealing (PDA) at 525 °C for 5 min, the nanocrystalline structure transformed into a submicrocrystalline structure (100–400 nm grains), thus promoting ductility (δ increased from 5.4 to 13.8%) at the expense of strength (UTS decreased from 990 to 835 MPa).
Note that this previous study on Ti-18Zr-15Nb microstructure refinement [32] was realized using ECAP with a relatively small channel diameter of 10 mm and applying a limited number of processing and post-processing conditions. Since the larger the ECAP product, the wider the range of its industrial application, this work focuses on a 20 mm-diameter Ti-18Zr-15Nb workpiece and includes a comprehensive study of the microstructure formation at different stages of the ECAP-PDA process in order to establish the relationship between the microstructure, the mechanical behavior and the functional characteristics of such a workpiece.

2. Materials and Methods

2.1. Material and Processing

A Ti-18Zr-15Nb (at.%) alloy ingot was produced by vacuum arc melting. To eliminate the cast microstructure, the ingot was subjected to hot forging (HF) at a temperature of 800–1050 °C. Specimens with a length of 100 mm and a diameter of 20 mm were then cut from the ingot by electrical discharge machining. Before ECAP, the specimens were annealed for 30 min at 700 °C and water cooled to obtain the recrystallized β-phase state of the alloy. ECAP was carried out using graphite grease according to the BC mode (specimens were subjected to pressing always in the same direction, with 90° rotations around their longitudinal axes between passes [33]). Before ECAP, the specimens were heated at 200 °C for 20 min and then placed in the ECAP tooling with a channel intersection angle of 120° and pressed continuously in n = 3 passes (the process took about 3 min). (Note that a further increase in the number of passes to n = 4 led to the formation of deep cracks and/or specimen destruction.) To ensure precise control of the microstructure and phase state after ECAP and allow a comparison of the results obtained with previous work, three sets of the PDA conditions were applied to the ECAP specimens (Table 1). First, a medium-time (30 min) annealing was carried out at 400, 500, 550 and 600 °C, with these conditions previously being used for the formation of submicrocrystalline structures in β-phase of Ti-Zr-Nb alloy [31]. Secondly, a short-term (5 min) annealing was realized at 500, 525, 550 and 600 °C, with these conditions having previously been used for the formation of nanocrystalline structures in β-phase of Ti-Zr-Nb alloy [17]. Thirdly, the PDA temperature was fixed at 550 °C (midrange between 400 and 650 °C), but the PDA time was varied from 1 to 60 min (1, 2.5, 5, 10, 30 and 60 min). All the PDA conditions were implemented under argon atmosphere and were followed by water cooling.

2.2. Experimental Procedure

Several research techniques have been applied to study the microstructure formation and to understand the relationship between the microstructure and mechanical behavior. First, to characterize the mechanical and functional properties, Vickers hardness (HV) measurements and tensile static (TS) and tensile cyclic (TC) tests were carried out. Then, to study the evolution of structure and phase states as a result of processing, X-ray diffraction (XRD), optical microscopy (OM), electron backscatter diffraction (EBSD), and transmission electron microscopy (TEM) techniques were consistently applied. In order to provide a concise, consistent, but sufficient description of the results obtained in this study, some selected processing conditions were studied in more detail (see Table 1). The choice of a more detailed study of certain states of the alloy is due to the need to describe the evolution of the microstructure depending on time or temperature for those PDA modes that provide the best set of mechanical and functional properties.
For microstructure investigations, 1 mm × 10 mm × 15 mm specimens were cut by electrical discharge machining. The longitudinal sections of the specimens were ground on emery paper with a grain size ranging from 320 to 4000. Polishing was carried out for 20 min under 30 N of load using a “SAPHIR 560” polishing machine (Fendt, Marktoberdorf, Germany) and Eposil F suspension containing 0.1 μm SiO2 particles. During polishing, ammonia, hydrogen peroxide 3% and liquid soap were added to the suspension. After polishing, the specimens were cleaned in an ultrasonic bath with isopropyl alcohol for 10 min. To reveal grain boundaries, surface etching was performed in 1HF:3HNO3:6H2O solution for 20–40 s.
The alloy phase composition and crystal lattice defectness were studied using X-ray diffraction analysis (“Rigaku Ultima IV”, Tokyo, Japan) diffractometer with Cu radiation) in the 29 to 80 deg 2θ range. The β-phase lattice parameter was calculated from the angular coordinates of the centers of gravity of the β-phase XRD line profiles. The evolution of the lattice defectness in different states was estimated through the changes in the half-width (Bhkl) of β-phase diffraction lines. The grain structure was studied using a “Versamet-2 Union”, Tokyo, Japan) optical microscope. The average grain size was measured using the random linear intercept method according to ASTM E112–13. For microstructure and texture investigations, a TESCAN VEGA LMH (Brno, Check Republic) scanning electron microscope (SEM) equipped with an electron backscatter diffraction unit was used. The texture evolution was characterized using the Oxford Instruments’ AZtecv3.1 EBSD software (Abingdon, UK). Specimens were scanned at 20 kV, with a 0.5 μm step. The microstructure and substructure of the specimens were studied at room temperature by transmission electron microscopy using a JEOL-2100 electron microscope at an accelerating voltage of 200 kV (Tokyo, Japan). Thin foils for TEM were prepared from 0.1 mm-thick plates by electropolishing at −38 °C, using a 15% HNO3 solution and a “TENUPOL-5” system (Struers LLC, Cleveland, OH, USA).
The Vickers hardness was measured using a “Metkon Metallography hardness tester” (Bursa, Turkey). The tests were carried out at room temperature with an applied load of 1 kg and a loading time of 10 s. At least ten measurements were performed for each specimen, the results were averaged, and the mean square deviations calculated for each experimental point. To characterize the mechanical and functional properties, monotonic static and cyclic tensile tests were carried out at room temperature at a strain rate of 2 mm/min using 1 mm × 1.5 mm × 60 mm specimens and an “Instron 5966” testing machine (Instron, Norwood, MA, USA). Using the “stress–strain” diagrams obtained from the static tensile testing to failure, the transformation yield stress σtr, the dislocation yield stress σdis, the ultimate tensile strength UTS, and the relative elongation to failure δ were determined (Figure 1a); their values were averaged, and confidence error ranges calculated. If no “double yielding” phenomenon appeared in the stress–strain diagram, the apparent yield stress σ0,2 was calculated. Next, superelastic loading–unloading cyclic testing to failure was carried out by incrementally increasing the strain by 1% in each subsequent cycle. To determine the superelastic properties quantitatively, the superelastic recovery strain εrse (after separation of the elastic recovery strain εrel), the residual strain in a cycle εf, and the accumulated residual strain εacc were measured for each cycle (Figure 1b).

3. Results and Discussion

3.1. Effect of ECAP and PDA on the Microstructure and Phase States

X-ray diffraction analysis revealed that in all the cases, the main phase constituent is BCC β-phase (Figure 2a,c,e). After ECAP, α″-martensite phase is also visible (Figure 2a). PDA at 400 °C for 30 min leads to the formation of low amounts of secondary α-, α″- and ω-phases. Increasing the annealing temperature up to 500 °C (30 min annealing) increases the amount of α-phase, while this amount decreases with a subsequent increase of the PDA temperature to 600 °C (Figure 2a). Short-terms annealing (5 min) at temperatures of 500 and 525 °C brings the material into a two-phase state (α-phase is observed together with basic β-phase) (Figure 2c). Increasing the short-term PDA temperature up to 550–600 °C results in pure β-phase state, while increasing the holding time at 550 °C to 10 min and higher promotes the formation of α-phase (Figure 2e), but at a much less extent than it is done after PDA at 500 °C. These results agree with the high-temperature branch of the C-curve of an isothermal β→α transformation above 500–525 °C. It should be noted that in the same alloy, but subjected to moderate or severe plastic deformation by cold rolling, the formation of α-phase during PDA at 550 °C was not observed [17,31]. It can be assumed that ECAP leads to an increase in the temperature and/or to changes in the kinetics of the β→α transformation in this alloy.
Immediately after ECAP, the β-phase X-ray diffraction lines are significantly broadened, thus reflecting an increased concentration of lattice defects and substructural hardening of the material (Figure 2b,d,f). PDA at 400 °C leads to additional broadening of the X-ray lines (Figure 2b), which can be caused by microstresses accompanying the formation of secondary ω-phase [34]. Note that the β-phase lattice parameter (aβ) after all the applied treatments does not change and amounts to 0.3344  ±  0.0002 nm, which correlates well with previous data for the same alloy [17]. With an increase in the PDA temperature from 400 to 600 °C, the width of β-phase X-ray lines decreases, first rapidly, and then gradually, which corresponds to the softening processes (recovery, polygonization, and recrystallization) occurring in the matrix. The width of the β-phase lines at 550 °C monotonically decreases during annealing for 1 and 2.5 min. A further increase in the annealing time does not lead to significant changes in the X-ray line width (Figure 2e).
Metallography observations (optical microcopy) show that a combination of hot forging and PDA at 700 °C results in an equiaxed grain structure, with an average grain size of 30–40 µm (Figure 3a). Then, ECAP leads to the formation of a mixture of deformation bands: “wide” 10–20 µm-width bands crossing the entire field of view in the images and oriented at ~60° to the pressing direction, “intermediate” 5–8 µm-width bands parallel to the pressing direction and “narrow” 3–5 µm-width bands parallel to the wide bands (Figure 3b). PDA at 550 °C for 5 min (Figure 3c) does not change the microstructure significantly. Increasing the 550 °C PDA time up to 30 min leads to significant structural changes (Figure 3d,e) consisting in the formation of new fine 1–3 μm grains (recrystallization) occurring primarily in the wide deformation bands. Note that 5-min annealing at 600 °C (Figure 3f) promotes the recrystallization process inside the wide and narrow deformation bands to a greater extent than does 30-min annealing at 550 °C. When PDA is realized at 600 °C for 30 min, recrystallization spreads almost throughout the entire volume of the material, forming a uniform grain structure with an average grain size of 5–10 μm (Figure 3g). A further increase in the PDA temperature to 650 °C leads to the development of recrystallization and an increase in the average grain size to 10–20 µm (Figure 3h).
More detailed analyses of the microstructure and crystallographic texture evolutions were undertaken by comparing the as-ECAP specimens with those subjected to the 30-min PDA at 550 °C and 5-min PDA at 600 °C (see Figure 4). The SEM and EBSD images taken from the same area allowed to study the microstructure features in the deformation bands. Figure 4a,b shows that the body of one initial large grain is “cut” by many deformation bands, and the low-angle boundaries areas neighbor with the high-angle boundaries recrystallized areas, the latter coinciding with the deformation bands. PDA at 550 °C (30 min) leads to the development of recrystallization inside the wide deformation bands (Figure 4d,e). Narrow deformation bands coincide with the low-angle boundaries (see Figure 4d,e and the misorientation diagram, Figure 4f). It should be noted that a significant number of unresolved areas (10–20% white color zones) present in the EBSD images are caused by a high density of lattice defects and distortions. Increasing the PDA temperature to 600 °C leads to the enlargement of recrystallization zones in wide and narrow deformation bands (Figure 4g,h). Note that a significant variability in the crystallographic texture observed from the EBSD-maps reflects the material structural heterogeneity, with no preferential crystallographic orientation of the PDA-recrystallized grains (Figure 3b,d–f and Figure 4b,d,f).
Results of the TEM study presented in Figure 5 show details of the thin microstructure evolution after ECAP. An inhomogeneous microstructure of β-phase with a large number of deformation bands is formed as a result of ECAP (Figure 5a,b). Some amounts of stress-induced α″-martensite are present as well (Figure 5a,b). The β-phase and α″-phase reflexes in the corresponding SAED patterns (Figure 5a,b) manifest a low-angle azimuthal broadening caused by increased orientation imperfections of their crystal lattices due to a very high dislocation density. Figure 5a shows a 300–350 nm-width deformation band. Inside this deformation band, elongated nanosized structural elements with a high dislocation density, as well as equiaxed grains of a nanocrystalline structure, are observed (Figure 5a). Figure 5b shows a ~2 µm-width deformation band, within which the nanosubgrained structure (NSS) and nanograined structure (NGS) areas can be observed, the latter being caused by the dynamic recrystallization in the course of ECAP.
Figure 6 shows the microstructure evolution during PDA at 550 °C with different holding times (2.5–60 min). As a result of annealing at 550 °C for 2.5 min, the heterogeneous ECAP microstructure containing a certain quantity of α″-martensite remains (Figure 6a,b). A polygonized subgrained β-phase structure is formed inside the initial grain bodies as a result of the polygonization of an initial highly-dislocated substructure. However, the random dislocation substructure with a high dislocation density is preserved as well (Figure 6a). The recrystallization and nanograin/subgrain growth processes occur inside the deformation bands (Figure 6b). As a result, a nanocrystalline structure with a β-phase grain/subgrain size up to 100 nm is formed (Figure 6b). Increasing the annealing time to 10 min leads to the formation of some amounts of α-phase in the form of elongated plates not thicker than 50 nm (Figure 6c). A structural heterogeneity persists and areas with initially coarse grains are still present. The size of recrystallized grains formed inside the deformation bands increases, but does not exceed 150 nm (Figure 6c,d). After PDA for 60 min, the nanograined and nano-subgrained structures of β-phase with globular 50–100 nm α-phase grains appear inside the deformation bands (Figure 6e). Thus, with an increase in the PDA duration from 10 to 60 min at 550 °C, the shape of precipitated α-phase particles changes from elongated plates to globular.

3.2. Effect of ECAP and PDA on the Mechanical and Functional Properties

Results of the hardness measurements are presented in Figure 7. It can be seen that ECAP leads to a significant increase in hardness as compared to the undeformed recrystallized alloy: from 177 to 283 HV (Figure 7a). After PDA at 400 °C, hardness additionally increases to 325 HV due to the precipitation hardening resulting from the α-phase and, probably, ω-phase nanoparticles formation. An increase in the PDA temperature to 500–550 °C (30 min) leads to a slight decrease in the HV values indicating that hardening caused by the formation of α-phase is still preserved. After PDA at 600–650 °C (30 min), the level of HV returns to its initial undeformed value (Figure 7a). After a short-term annealing, the hardness decreases first (from 283 to 225 HV after PDA at 500 °C, 5 min), and then increases (245 HV after PDA at 525 °C, 5 min); it then continues to decrease with increasing annealing temperatures (550–600 °C) (Figure 7b). An increase in the HV value after PDA at 525 °C (5 min) can be explained by precipitation hardening which confirms the changes in the α-phase formation kinetics. Increasing the PDA duration at 550 °C (Figure 7c) causes the HV values to first decrease (220–240 HV after PDA at 550 °C, 1–5 min), and then increase to 250–270 HV after PDA at 550 °C, 10–60 min). Thus, it can be assumed that hardening caused by the α-phase formation is more significant than softening caused by the polygonization and recrystallization processes.
Figure 8 shows typical stress-strain tensile diagrams, and the corresponding values of the transformation yield stress, dislocation yield stress, ultimate tensile stress, and relative elongation to failure (raw data used to build Figure 8 can be found in the Appendix A, Table A1).
The strength characteristics globally correlate well with the hardness measurements (Figure 8). As compared to the undeformed state, ECAP significantly increases the UTS, from 580 to 760 MPa (Figure 8d). After annealing at 400 °C (30 min), the alloy is in its most hardened state (~980 MPa), but becomes brittle (δ < 3%) (Figure 8a,d) due to changes in the phase composition. A further increase in the PDA temperature leads to a decrease in strength and an increase in ductility. A full recovery of the pre-ECAP ductility (δ > 20%) after annealing at 600 °C is related to the recrystallization of an entire volume of the alloy. It should be noted that visual difference between the apparent transformation yield stress and the dislocation yield stress related to the pronounced superelasticity is observed after PDA in the 550–650 °C range (Figure 8d compare with Figure 9b–f).
After short-term (5 min) annealing at 500 °C, the strength of the material is comparable to that after ECAP, but the ductility is higher (Figure 8b,e). With the temperature increasing to 550 °C, the strength decreases monotonically and the ductility increases (δ = 9.8%). A slight decrease in strength and a significant increase in ductility after PDA at 600 °C, as compared to PDA at 550 °C, is due to an increase in the number of high-angle boundaries as a consequence of the recrystallization process.
Changes in the holding time during PDA at a constant temperature (550 °C) clearly illustrate the concurrence of the polygonization/recrystallization-induced softening and α-phase precipitation-induced hardening. After a very short-term (1 min) PDA at 550 °C, the UTS decreases slightly as compared to ECAP: from 760 to 695 MPa (Figure 8e). Increase in the PDA time to 2.5 min does not lead to a decrease in strength, but rather, to appearance of the difference between the transformation yield stress and the dislocation yield stress (Δσ). The value of Δσ achieves its maximum (~240 MPa) after PDA at 550 °C (5 min), and then drops with an increase in the PDA time (Figure 8e), and becomes undetectable after PDA at 550 °C (60 min). As the annealing time increases from 10 to 60 min, the UTS value also increases, thus reflecting the dominant effect of α-phase precipitation hardening (Figure 8c,f). It is seen that changes in tensile strength (UTS and σdis) does not correlate well with the hardness. This discrepancy can be related with the different response of the superelastic alloy to different stress-strain states under the tension and hardness measurements. This phenomenon must be studied in future work.
Figure 9 shows selected loading-unloading diagrams with incremented strains in each cycle. The evolutions of the transformation σtr and dislocation σdis yield stresses, accumulated residual strains εacc, and superelastic εrse recovery strains measured from these diagrams are presented in Figure 10a–f.
During cyclic testing, the alloy in its most hardened states (ECAP and ECAP + PDA at 400 °C) almost does not exhibit superelasticity (Figure 9a and Figure 10g,j). In all other cases, the superelastic behavior can be observed from the first cycle, and the shape of the “superelastic loop” improves as the induced strain increases (Figure 9). The value of the dislocation yield stress increases significantly during the first 10 cycles (Figure 10a–c). At the same time, the transformation yield stress decreases, accompanied by an improvement in the superelastic behavior [11,35]. An increase in the difference of the dislocation and transformation yield stresses Δσ is due to the plastic deformation hardening phenomenon. After all the treatments resulting in the clearly visible superelastic behavior, this difference reaches approximately the same level of 450–500 MPa.
From an application viewpoint, values of the accumulated strain εacc and the superelastic recovery strain εrse are the main quantitative characteristics of the SMA functional behavior. It can be seen that after ECAP + PDA at 600–650 °C (30 min) and at 550 °C (1–5 min), the alloy exhibits a rapid increase of the superelastic recovery strain and a slow accumulation of the residual strain (Figure 10d–f). It is worth noting that in all these cases, the alloy is in a single β-phase state; no traces of α-alpha phase, which is detrimental for the superelastic behavior, can be detected. After these PDA routes, the superelastic recovery strain reaches its maximum values at the 7th–9th cycles (εrsemax ≥ 2.8%). These values are twice as large as those of the superelastic Ti-35Nb-3Zr-2Ta alloy after ECAP at 500 °C [22], and at the same level as that of the TMT-processed Ti-19Zr-14Nb SMA [36]. The highest maximum superelastic recovery strains of εrsemax ≈ 3.4% is obtained after a short-term (5 min) annealing at 600 °C (Figure 10k).

4. General Discussion

Different conditions of PDA were applied to superelastic Ti-18Zr-15Nb alloy subjected to a low-temperature ECAP in a bid to achieve a balance between the mechanical and functional superelastic properties of the alloy via the precise control of microstructure formation. It was shown that ECAP at 200 °C (three passes) leads to the formation of heterogeneous microstructures composed of initially coarse grains with high dislocation densities crossed by numerous wide and narrow deformation bands. Inside the deformation bands, nanograined and nano-subgrained structures with elongated structural elements were formed. In this structural state, the alloy exhibits high strength (UTS ≈ 760 MPa) but low ductility (δ ≈ 5%) and almost zero superelasticity (εrsemax ≈ 0.2%). Increasing the number of passes led to the formation of deep cracks and/or specimen destruction due to strain localization in the wide deformation bands.
A short-term PDA at 550–600 °C led to the polygonization of the main volume of the material and recrystallization inside the deformation bands, thus preserving the structural heterogeneity. After this treatment, the superelastic behavior was found to be significantly improved (εrsemax ≥ 3%) and the strength properties remained relatively high (UTS ≥ 600 MPa), but the remaining structural heterogeneity could be considered as the major hindrance from a fatigue resistance point of view. Longer annealing at 600 °C (30 min) led to generalized recrystallization in an entire volume of the material and the formation of a uniform fine-grained structure with an average grain size of 5–10 μm. While in this case the superelastic strain remained relatively high (εrsemax ≥ 3%), the strength characteristics returned to their undeformed values (UTS ≈ 550 MPa). Considering that this level of properties is achievable using traditional TMT [31,36], the use of a low-temperature (200 °C) ECAP becomes irrelevant. In this context, increasing the ECAP temperature to the range of 400–500 °C could offer the possibility of forming homogenous nano- or ultrafinegrained β-phase structures in Ti-Zr-Nb SMA, thus providing a better combination of mechanical strength and superelasticity. The validity of this hypothesis must be verified in future work.

5. Conclusions

In this study, a biomedical Ti-18Zr-15Nb (at.%) shape memory alloy was subjected to a combination of low-temperature equal channel angular pressing (ECAP) and post-deformation annealing (PDA). Evolutions of the phase composition, microstructure, mechanical and functional properties were studied. The following conclusions can be drawn:
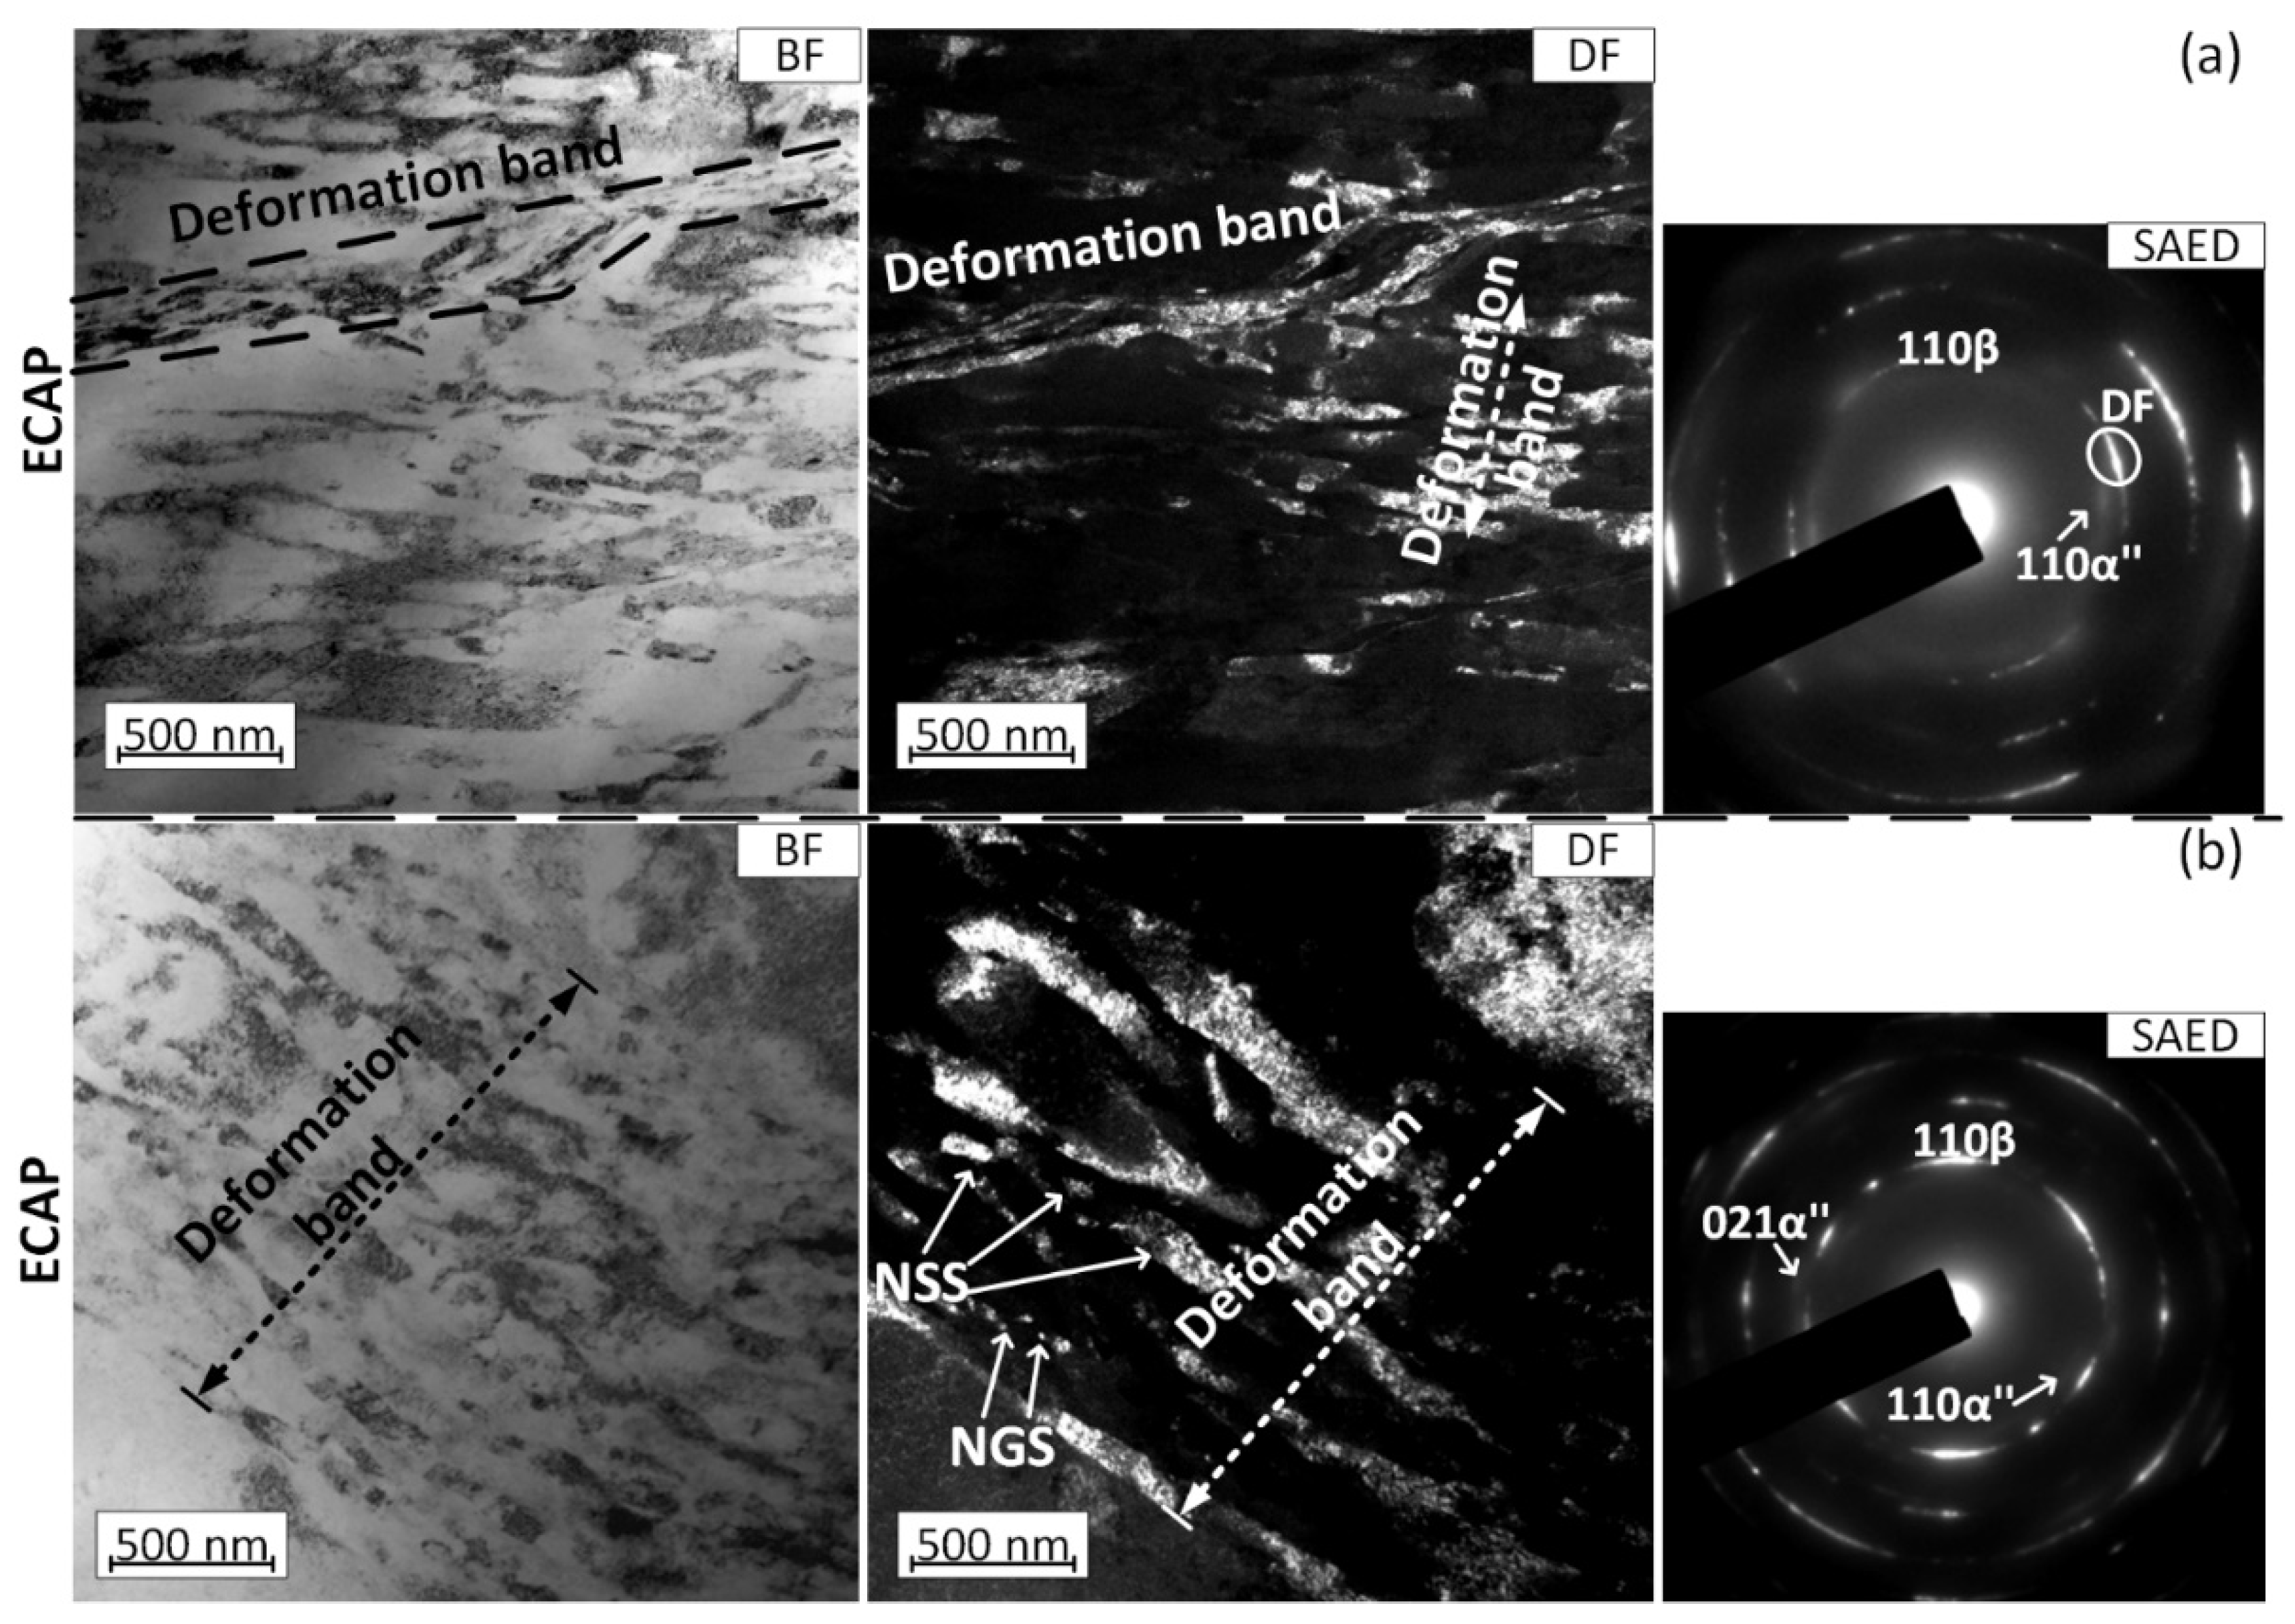
  • ECAP leads to the formation of an inhomogeneous β-phase microstructure with a large number of differently oriented deformation bands inside deformed grains. Some amounts of stress-induced α″-martensite are present as well. Inside the deformation bands, nanograined structure and nano-subgrained substructure areas are observed. The interiors of grains outside the deformation bands are characterized by a high dislocation density.
  • As a result of a short-term (5 min) PDA at 550–600 °C, the polygonization of a main volume of the material and the recrystallization inside the deformation bands are observed. Increasing the PDA duration at 550 °C to 10 min and higher promotes the formation of α-phase which indicates that ECAP leads to an increase in the temperature and/or to changes in the kinetic of β→α transformation, as compared to the alloy subjected to moderate or severe plastic deformation by cold rolling. After PDA at 600 °C (30 min), the recrystallization spreads almost across an entire volume of the material, thus forming a uniform grain structure with an average grain size of 5–10 μm.
  • After ECAP, the alloy strength increases significantly, as compared to the undeformed recrystallized state, from UTS = 580 to 760 MPa. After PDA at 400 °C (30 min), the alloy is in its most hardened state (UTS ≈ 980 MPa), but becomes brittle (δ < 3%) due to the formation of low amounts of secondary α-, α″-, and ω-phases. A further increase in the PDA temperature leads to a decrease in strength and an increase in ductility. After PDA at 600 °C (30 min), a sharp increase in ductility and a full recovery to the pre-ECAP mechanical properties (UTS ≈ 550 MPa, δ > 20%) were observed. A short-term (5 min) PDA at 550–600 °C contributes to maintaining a relatively high strength (UTS ≥ 600 MPa), with a satisfactory ductility (δ ≥ 10%).
  • The alloy in its most hardened states (ECAP and ECAP + PDA 400 °C) almost does not exhibit superelasticity. During cycling after ECAP + PDA at 600–650 °C (30 min) and 550 °C (1–5 min), the alloy exhibits a rapid increase in superelastic recovery strains and a slow accumulation of residual strains. After these PDA routes, the superelastic recovery strains reach their maximums at the 7th–9th cycles (εrsemax ≥ 2.8%). The alloy exhibits the highest maximum superelastic recovery strain of εrsemax ≈ 3.4% after a short-term (5 min) annealing at 600 °C.

Author Contributions

Conceptualization, V.S. and S.P.; methodology, M.D.; validation, A.C., D.G. and M.D.; formal analysis, D.G.; investigation, A.K., M.D. and V.C.; resources, G.R.; writing—original draft preparation, V.S.; writing—review and editing, D.G., S.P. and V.B.; visualization, M.D.; supervision, S.P. All authors have read and agreed to the published version of the manuscript.

Funding

The present work has been carried out with the financial support of the Russian Science Foundation (project No. 20-63-47063). Part of this work (SEM analyzes) was carried out during the implementation of the strategic project, “Biomedical materials and bioengineering”, within the framework of the Strategic Academic Leadership Program “Priority 2030” at NUST «MISiS».

Informed Consent Statement

Not applicable.

Data Availability Statement

Not applicable.

Conflicts of Interest

The authors declare no conflict of interest.

Appendix A

Table A1. The mechanical and functional properties of the Ti-18Zr-15Nb alloy after ECAP and PDA.
TMTσtr, MPaσdis, MPaΔσ, MPaUTS, MPaδ, %εrsemax, %HV
quenching345 ± 13510 ± 15195 ± 14547 ± 1115.0 ± 2.02.3 ± 0.3177 ± 4
ECAP n = 3* 525 ± 13-757 ± 95.1 ± 0.20.2 ± 0.1283 ± 4
400 °C, 30 min* 705 ± 4-967 ± 83.2 ± 0.50.1 ± 0.1325 ± 12
500 °C, 5 min* 464 ± 14-733 ± 138.1 ± 0.41.4 ± 0.2234 ± 12
500 °C, 30 min * 446 ± 9-636 ± 28.1 ± 0.10.3 ± 0.1250 ± 10
525 °C, 5 min* 412 ± 8-688 ± 39.4 ± 0.31.3 ± 0.2244 ± 14
550 °C,1 min_* 394 ± 8-695 ± 319.0 ± 0.92.4 ± 0.2230 ± 8
550 °C, 2.5 min365 ± 13569 ± 12205 ± 5585 ± 118.7 ± 1.02.8 ± 0.3222 ± 13
550 °C, 5 min330 ± 33568 ± 25238 ± 30599 ± 20 9.8 ± 0.52.8 ± 0.4228 ± 16
550 °C, 10 min331 ± 31554 ± 25223 ± 30573 ± 379.4 ± 0.92.4 ± 0.1255 ± 8
550 °C, 30 min362 ± 8532 ± 7157 ± 4563 ± 1210.0 ± 0.11.3 ± 0.4275 ± 11
550 °C, 60 min* 359 ± 13-618 ± 249.8 ± 0.61.5 ± 0.4263 ± 8
600 °C, 5 min370 ± 34593 ± 19223 ± 18614 ± 1914.0 ± 1.03.4 ± 0.2183 ± 3
600 °C, 30 min388 ± 40521 ± 34133 ± 20555 ± 2423.6 ± 5.23.1 ± 0.3182 ± 8
650 °C, 30 min350 ± 9473 ± 7133 ± 3507 ± 815.1 ± 2.12.9 ± 0.4184 ± 7
*—σ0.2, MPa.

References

  1. Niinomi, M. Metals for Biomedical Devices; Elsevier: Amsterdam, The Netherlands, 2019. [Google Scholar]
  2. Geetha, M.; Singh, A.K.; Asokamani, R.; Gogia, A.K. Ti Based Biomaterials, the Ultimate Choice for Orthopaedic Implants—A Review. Prog. Mater. Sci. 2009, 54, 397–425. [Google Scholar] [CrossRef]
  3. Chen, Q.; Thouas, G.A. Metallic Implant Biomaterials. Mater. Sci. Eng. R Rep. 2015, 87, 1–57. [Google Scholar] [CrossRef]
  4. Weng, W.; Biesiekierski, A.; Li, Y.; Wen, C. Effects of Selected Metallic and Interstitial Elements on the Microstructure and Mechanical Properties of Beta Titanium Alloys for Orthopedic Applications. Materialia 2019, 6, 100323. [Google Scholar] [CrossRef]
  5. Biesiekierski, A.; Wang, J.; Abdel-Hady Gepreel, M.; Wen, C. A New Look at Biomedical Ti-Based Shape Memory Alloys. Acta Biomater. 2012, 8, 1661–1669. [Google Scholar] [CrossRef] [PubMed]
  6. Miyazaki, S.; Kim, H.Y.; Hosoda, H. Development and Characterization of Ni-Free Ti-Base Shape Memory and Superelastic Alloys. Mater. Sci. Eng. A 2006, 438–440, 18–24. [Google Scholar] [CrossRef]
  7. Kim, H.Y.; Miyazaki, S. Ni-Free Ti-Based Shape Memory Alloys; Elsevier: Amsterdam, The Netherlands, 2018. [Google Scholar]
  8. Sheremetyev, V.; Petrzhik, M.; Zhukova, Y.; Kazakbiev, A.; Arkhipova, A.; Moisenovich, M.; Prokoshkin, S.; Brailovski, V. Structural, Physical, Chemical, and Biological Surface Characterization of Thermomechanically Treated Ti-Nb-Based Alloys for Bone Implants. J. Biomed. Mater. Res.—Part B Appl. Biomater. 2020, 108, 647–662. [Google Scholar] [CrossRef] [PubMed]
  9. Ijaz, M.F.; Kim, H.Y.; Hosoda, H.; Miyazaki, S. Superelastic Properties of Biomedical (Ti-Zr)-Mo-Sn Alloys. Mater. Sci. Eng. C 2015, 48, 11–20. [Google Scholar] [CrossRef]
  10. Gao, J.J.; Thibon, I.; Castany, P.; Gloriant, T. Effect of Grain Size on the Recovery Strain in a New Ti–20Zr–12Nb–2Sn Superelastic Alloy. Mater. Sci. Eng. A 2020, 793, 139878. [Google Scholar] [CrossRef]
  11. Konopatsky, A.; Sheremetyev, V.; Dubinskiy, S.; Zhukova, Y.; Firestein, K.; Golberg, D.; Filonov, M.; Prokoshkin, S.; Brailovski, V. Structure and Superelasticity of Novel Zr-Rich Ti-Zr–Nb Shape Memory Alloys. Shape Mem. Superelasticity 2021, 7, 304–313. [Google Scholar] [CrossRef]
  12. Li, Q.; Onuki, Y.; Sun, Q. Tailoring Thermal Expansion of Shape Memory Alloys through Designed Reorientation Deformation. Acta Mater. 2021, 218, 117201. [Google Scholar] [CrossRef]
  13. Xiong, C.; Li, Y.; Zhang, J.; Wang, Y.; Qu, W.; Ji, Y.; Cui, L.; Ren, X. Superelasticity over a Wide Temperature Range in Metastable β-Ti Shape Memory Alloys. J. Alloys Compd. 2021, 853, 157090. [Google Scholar] [CrossRef]
  14. Elmay, W.; Prima, F.; Gloriant, T.; Bolle, B.; Zhong, Y.; Patoor, E.; Laheurte, P. Effects of Thermomechanical Process on the Microstructure and Mechanical Properties of a Fully Martensitic Titanium-Based Biomedical Alloy. J. Mech. Behav. Biomed. Mater. 2013, 18, 47–56. [Google Scholar] [CrossRef] [PubMed]
  15. Prokoshkin, S.; Brailovski, V.; Dubinskiy, S.; Zhukova, Y.; Sheremetyev, V.; Konopatsky, A.; Inaekyan, K. Manufacturing, Structure Control, and Functional Testing of Ti–Nb-Based SMA for Medical Application. Shape Mem. Superelasticity 2016, 2, 130–144. [Google Scholar] [CrossRef] [Green Version]
  16. Zhang, D.C.; Tan, C.G.; Tang, D.M.; Zhang, Y.; Lin, J.G.; Wen, C.E. Effect of Thermomechanical Treatment on the Superelasticity of Ti-7.5Nb-4Mo-2Sn Biomedical Alloy. Mater. Sci. Eng. C 2014, 44, 76–86. [Google Scholar] [CrossRef] [PubMed]
  17. Sheremetyev, V.; Dubinskiy, S.; Kudryashova, A.; Prokoshkin, S.; Brailovski, V. In Situ XRD Study of Stress- and Cooling-Induced Martensitic Transformations in Ultrafine- and Nano-Grained Superelastic Ti-18Zr-14Nb Alloy. J. Alloys Compd. 2022, 902, 163704. [Google Scholar] [CrossRef]
  18. Prokoshkin, S.; Brailovski, V.; Korotitskiy, A.; Inaekyan, K.; Dubinskiy, S.; Filonov, M.; Petrzhik, M. Formation of Nanostructures in Thermomechanically-Treated Ti-Ni and Ti-Nb-(Zr, Ta) SMAs and Their Roles in Martensite Crystal Lattice Changes and Mechanical Behavior. J. Alloys Compd. 2013, 577, S418–S422. [Google Scholar] [CrossRef]
  19. Dubinskiy, S.; Prokoshkin, S.; Sheremetyev, V.; Konopatsky, A.; Korotitskiy, A.; Tabachkova, N.; Blinova, E.; Glezer, A.; Brailovski, V. The Mechanisms of Stress-Induced Transformation in Ultimately Fine-Grained Titanium Nickelide, and Critical Grain Size for This Transformation. J. Alloys Compd. 2021, 858, 157733. [Google Scholar] [CrossRef]
  20. Stolyarov, V.V.; Theodore Zhu, Y.; Alexandrov, I.V.; Lowe, T.C.; Valiev, R.Z. Influence of ECAP Routes on the Microstructure and Properties of Pure Ti. Mater. Sci. Eng. A 2001, 299, 59–67. [Google Scholar] [CrossRef]
  21. Xu, W.; Wu, X.; Calin, M.; Stoica, M.; Eckert, J.; Xia, K. Formation of an Ultrafine-Grained Structure during Equal-Channel Angular Pressing of a β-Titanium Alloy with Low Phase Stability. Scr. Mater. 2009, 60, 1012–1015. [Google Scholar] [CrossRef]
  22. Lin, Z.; Wang, L.; Xue, X.; Lu, W.; Qin, J.; Zhang, D. Microstructure Evolution and Mechanical Properties of a Ti-35Nb-3Zr-2Ta Biomedical Alloy Processed by Equal Channel Angular Pressing (ECAP). Mater. Sci. Eng. C 2013, 33, 4551–4561. [Google Scholar] [CrossRef] [PubMed]
  23. Zafari, A.; Xia, K. Grain Refinement in a Metastable Beta Ti Alloy Deformed to Large Strains at High Strain Rates. Acta Mater. 2018, 157, 174–185. [Google Scholar] [CrossRef]
  24. Panigrahi, A.; Bönisch, M.; Waitz, T.; Schafler, E.; Calin, M.; Eckert, J.; Skrotzki, W.; Zehetbauer, M. Phase Transformations and Mechanical Properties of Biocompatible Ti-16.1Nb Processed by Severe Plastic Deformation. J. Alloys Compd. 2015, 628, 434–441. [Google Scholar] [CrossRef]
  25. Panigrahi, A.; Sulkowski, B.; Waitz, T.; Ozaltin, K.; Chrominski, W.; Pukenas, A.; Horky, J.; Lewandowska, M.; Skrotzki, W.; Zehetbauer, M. Mechanical Properties, Structural and Texture Evolution of Biocompatible Ti–45Nb Alloy Processed by Severe Plastic Deformation. J. Mech. Behav. Biomed. Mater. 2016, 62, 93–105. [Google Scholar] [CrossRef] [PubMed]
  26. Valiev, R. Nanostructuring of Metals by Severe Plastic Deformation for Advanced Properties. Nat. Mater. 2004, 3, 511–516. [Google Scholar] [CrossRef] [PubMed]
  27. Li, H.; Wang, P.; Wen, C. Recent Progress on Nanocrystalline Metallic Materials for Biomedical Applications. Nanomaterials 2022, 12, 2111. [Google Scholar] [CrossRef] [PubMed]
  28. Bartha, K.; Veverková, A.; Stráský, J.; Veselý, J.; Minárik, P.; Corrêa, C.A.; Polyakova, V.; Semenova, I.; Janeček, M. Effect of the Severe Plastic Deformation by ECAP on Microstructure and Phase Transformations in Ti-15Mo Alloy. Mater. Today Commun. 2020, 22, 100811. [Google Scholar] [CrossRef]
  29. Gunderov, D.; Prokoshkin, S.; Churakova, A.; Sheremetyev, V.; Ramazanov, I. Effect of HPT and Accumulative HPT on Structure Formation and Microhardness of the Novel Ti18Zr15Nb Alloy. Mater. Lett. 2021, 283, 128819. [Google Scholar] [CrossRef]
  30. Xiong, C.; Xue, P.; Sun, B.; Li, Y. Effect of Annealing Temperature on the Microstructure and Superelasticity of Ti-19Zr-10Nb-1Fe Alloy. Mater. Sci. Eng. A 2017, 688, 464–469. [Google Scholar] [CrossRef]
  31. Sheremetyev, V.; Kudryashova, A.; Dubinskiy, S.; Galkin, S.; Prokoshkin, S.; Brailovski, V. Structure and Functional Properties of Metastable Beta Ti-18Zr-14Nb (at.%) Alloy for Biomedical Applications Subjected to Radial Shear Rolling and Thermomechanical Treatment. J. Alloys Compd. 2018, 737, 678–683. [Google Scholar] [CrossRef]
  32. Sheremetyev, V.; Churakova, A.; Derkach, M.; Gunderov, D.; Raab, G.; Prokoshkin, S. Effect of ECAP and Annealing on Structure and Mechanical Properties of Metastable Beta Ti-18Zr-15Nb (at.%) Alloy. Mater. Lett. 2021, 305, 130760. [Google Scholar] [CrossRef]
  33. Valiev, R.Z.; Langdon, T.G. Principles of Equal-Channel Angular Pressing as a Processing Tool for Grain Refinement. Prog. Mater. Sci. 2006, 51, 881–981. [Google Scholar] [CrossRef]
  34. Kim, H.Y.; Ikehara, Y.; Kim, J.I.; Hosoda, H.; Miyazaki, S. Martensitic Transformation, Shape Memory Effect and Superelasticity of Ti-Nb Binary Alloys. Acta Mater. 2006, 54, 2419–2429. [Google Scholar] [CrossRef]
  35. Sheremetyev, V.; Brailovski, V.; Prokoshkin, S.; Inaekyan, K.; Dubinskiy, S. Functional Fatigue Behavior of Superelastic Beta Ti-22Nb-6Zr(At%) Alloy for Load-Bearing Biomedical Applications. Mater. Sci. Eng. C 2016, 58, 935–944. [Google Scholar] [CrossRef]
  36. Lukashevich, K.E.; Sheremetyev, V.A.; Kudryashova, A.A.; Derkach, M.A.; Andreev, V.A.; Galkin, S.P.; Prokoshkin, S.D.; Brailovski, V. Effect of Forging Temperature on the Structure, Mechanical and Functional Properties of Superelastic Ti-Zr-Nb Bar Stock for Biomedical Applications. Lett. Mater. 2022, 12, 54–58. [Google Scholar] [CrossRef]
Figure 1. Schematic representation of the different metrics derived from the stress–strain diagrams obtained during: (a) static tensile testing to failure and (b) cyclic loading–unloading testing with incrementally increased strain.
Metals 12 01672 g001
Figure 2. Results of the XRD analysis of Ti-18Zr-15Nb alloy after: ((a,b) ECAP + PDA 30 min; (c,d)) ECAP + PDA 5 min; (e,f) ECAP + PDA 550 °C; (a,c,e) X-ray diffractograms; (b,d,f) changes in the {110} β-phase X-ray line width.
Metals 12 01672 g002
Figure 3. Microstructure of the Ti-18Zr-15Nb alloy after: (a) HF + 700 °C, 30 min; (b) ECAP; (c) ECAP + PDA 550 °C, 5 min; (d) ECAP + PDA 550 °C, 30 min; (e) ECAP + PDA 550 °C, 30 min (image with greater magnification); (f) ECAP + PDA 600 °C, 5 min; (g) ECAP + PDA 600 °C, 30 min; (h) ECAP + PDA 650 °C, 30 min.
Metals 12 01672 g003
Figure 4. Results of microstructure and texture analyses of Ti-18Zr-15Nb: (a,b) ECAP, (c,d) ECAP + PDA 550 °C, 30 min, and (e,f) ECAP + PDA 600 °C, 5 min; SEM images (a,c,e), EBSD images (b,d,f). Black lines correspond to high-angle boundaries (>15°), white lines, to low-angle boundaries (2–15°). PD—pressing direction.
Metals 12 01672 g004
Figure 5. TEM images of selected typical zones (a,b) of Ti-18Zr-15Nb alloy after ECAP. Bright field (BF) and dark field (DF) images, and SAED patterns.
Metals 12 01672 g005
Figure 6. TEM images of the Ti-18Zr-15Nb alloy after: (a,b) ECAP + PDA 550 °C, 2.5 min; (c,d) ECAP + PDA 550 °C, 10 min; (e) ECAP + PDA 550 °C, 60 min. Bright field (BF) and dark field (DF) images, and SAED patterns.
Metals 12 01672 g006
Figure 7. Hardness of the Ti-18Zr-15Nb alloy after: (a) ECAP + PDA 30 min; (b) ECAP + PDA 5 min; (c) ECAP + PDA 550 °C.
Metals 12 01672 g007
Figure 8. Mechanical characteristics of the Ti–18Zr–15Nb alloy: (ac) stress–strain diagrams; (df) histograms of the mechanical properties after: (a,d) ECAP + PDA (30 min); (b,e) ECAP + PDA (5 min); (c,f) ECAP + PDA at 550 °C.
Metals 12 01672 g008
Figure 9. Selected loading-unloading diagrams of the Ti–18Zr–15Nb alloy after: (a) ECAP; (b) ECAP + PDA 550 °C, 2.5 min; (c) ECAP + PDA 550 °C, 5 min; (d) ECAP + PDA 550 °C, 10 min; (e) ECAP + PDA 600 °C, 5 min; (f) ECAP + PDA 600 °C, 30 min.
Metals 12 01672 g009
Figure 10. Evolutions of the (ac) transformation and dislocation yield stresses, (df) accumulated strains, (gi) superelastic recovery strains as functions of the induced strain; (jl) values of the maximum superelastic recovery strain (εrsemax) of the Ti–18Zr–15Nb alloy; (a,d,g,j) ECAP + PDA, 30 min; (b,e,h,k) ECAP + PDA, 5 min; (c,f,i,l) ECAP + PDA 550 °C.
Metals 12 01672 g010
Table 1. Microstructure analysis and mechanical characterization techniques applied to the ECAP-PDA Ti-Zr-Nb alloy specimens.
Temp./Time1 min2.5 min5 min10 min30 min60 min
400 °C----XRD-
HV, TS, TC
500 °C--XRD-XRD-
HV, TS, TCHV, TS, TC
525 °C--XRD---
HV, TS, TC
550 °CXRDXRD, TEMXRD, OMXRD, TEMXRD, OM, SEM, EBSDXRD, TEM
HV, TS, TCHV, TS, TCHV, TS, TCHV, TS, TCHV, TS, TCHV, TS, TC
600 °C--XRD, OM, SEM, EBSD-XRD, OM-
HV, TS, TCHV, TS, TC
650 °C----OM, HV, TS, TC-
Microstructure characterization: XRD, OM, EBSD, TEM; Mechanical and functional testing: HV, TS, TC.
Publisher’s Note: MDPI stays neutral with regard to jurisdictional claims in published maps and institutional affiliations.

