Article

Computational Investigation on Cracking Behaviors of AerMet 100

1
Department of Aircraft Airworthiness Engineering, School of Transportation Science and Engineering, Beihang University, Beijing 100191, China
2
Aircraft/Engine Integrated System Safety Beijing Key Laboratory, Beijing 100191, China
3
Department of Mechanical Engineering, Ningbo University of Technology, Ningbo 315336, China
*
Author to whom correspondence should be addressed.
Metals 2022, 12(10), 1650; https://doi.org/10.3390/met12101650
Submission received: 8 September 2022 / Revised: 26 September 2022 / Accepted: 27 September 2022 / Published: 30 September 2022
(This article belongs to the Special Issue Fracture Mechanics of Metals)

Abstract

:
AerMet 100 exhibits excellent mechanical properties, proven in previous studies; however, defects may greatly influence the mechanical behavior during the service of the material, which serves as one of the major challenges in the wider application of the material. To quantify the crack evolution process, the in-plane type I crack propagation behavior is comprehensively investigated based on the extended finite element method (XFEM). The crack growth is characterized in terms of the extracted crack propagation angle, stress intensity factor (SIF) in the crack tip, and stress field profiles during the crack propagation process. An extrapolation method is adopted to calculate the SIF, followed by a series of parametric studies on the influence of the governing factors, i.e., initial crack length, initial crack location, initial crack angle, and the crack number through numerical investigation. It is found that the crack propagation angle enlarges monotonously with the increase of the initial crack location, the initial crack length, and the crack number, increases slowly with the growth of initial crack angle, and rapidly enlarges in reverse at about 45°. The SIF in Mode I, KId, gradually decreases with the increase of the initial crack location and the crack number, and nearly keeps steady when the initial crack length and initial crack angle varies. Results provide further understanding of the failure and fracture behavior of AerMet 100 and guide the future application and design of the structures.

1. Introduction

With the impressing need for ultra-high strength with high fracture strain metallic materials in both civil and national defense applications, AerMet 100 steel proves to be an excellent and promising candidate, with a fracture toughness 130 MPa m [1], ultimate strength~2 GPa [2] and corrosion-fatigue fracture resistance 50 MPa m [3], to substitute 300 M steel for landing gears for aircraft in astronautics engineering to the framework of bicycles in the sports industry [4]. The excellent mechanical behaviors of AerMet 100 were comprehensively investigated through its microscopic property [5], micro-component [6], and microstructure [7]. Recently, due to the dynamic mechanical loading during the engineering application in nature, the dynamic mechanical behaviors of AerMet 100 were explored by using the SHPB (Split Hopkinson Pressure Bar) [8,9,10]. The results showed a significant strain rate-strengthening effect in which the yield strength increased by 30%, and the ultimate strength had an increase of about 35%, as the strain rate varied from 0.001 s−1 to 4200 s−1. Furthermore, a parameterized Johnson–Cook model based on the SHPB tests was established and discussed. That the strain rate intensifies the mechanism was revealed by the SEM evidence [8]. These pioneering research efforts not only lay a solid foundation to understand the dynamic mechanical behavior of AerMet 100, but further draws interest to revealing the mechanical behavior with initial cracks in the structure made by AerMet 100.
On the other hand, crack initiation and propagation have long been an important issue for the structural material, which may usually cause catastrophic consequences [11]. Successful attempts have been made through elaborately designed experiments such as motors [12], welds [13], and blades [14]. An alternative way to study the cracking problem is numerical simulation. Several new numerical methods are put forward to solve the singularity dilemma within the crack tip. Hu et al. [15] obtained crack growth and debonding development in CFRP-strengthened cracked steel plates through the boundary element method. Thiyahuddin et al. [16] investigated the fluid–structure interaction effect under vehicular impact using the mesh-less method. Recently, a popular simulation method to describe the crack growth behavior is XFEM (extended finite element method), where the simulation results showed satisfactory consistency with experimental values [13,17,18,19,20,21,22]. Jena et al. [17] accurately captured the singularity at the crack tip during semipermeable crack propagation using XFEM. Xiao et al. [18] proposed a B-spline ruled surface algorithm, which was applied to modeling arbitrary 3D crack propagation in the context of the improved XFEM. It had been proved to possess both efficiency and accuracy by comparing with the experimental records. The fracture behavior of human cortical bone was also successfully simulated by Yadav et al. [22]. They reported that the severe stress intensity factor could be attributed to the presence of small microcracks around the major crack tip. To assess the stress intensity in the crack tip, the exploration method was adopted by Kamaya, which showed its accuracy in describing the fracture behavior of the cracked components [23], avoiding the re-meshing problem [24]. In fact, XFEM has become an effective tool to study the interfacial cracking problem in the bi-material as well as multi-crack stress mode, which are highly complicated in theoretical analysis [25,26,27].
However, investigations about the crack initiation and propagation problem in AerMet 100, an ultra-strong and tough metallic material with strain-rate dependency, are still lacking, which hinders the material’s further application in critical mechanical parts. To fill in this gap, in this paper, a 3D plate model is established with XFEM to quantitatively study cracking behaviors. The strain rate-dependent constitutive material description is based on our previous paper [8], and an extrapolation method is adopted to calculate SIF in the crack tip. Under uniaxial tensile loads, the numerical crack growth models with different initial crack length, different initial crack location, different initial crack angle and different crack numbers are developed, while the crack propagation angle and SIF during crack propagation are recorded, respectively. Further, a series of comprehensive parametric studies are conducted to explore the influence of the initial crack length, location, angle, and number on the cracking propagation behavior.

2. Methods

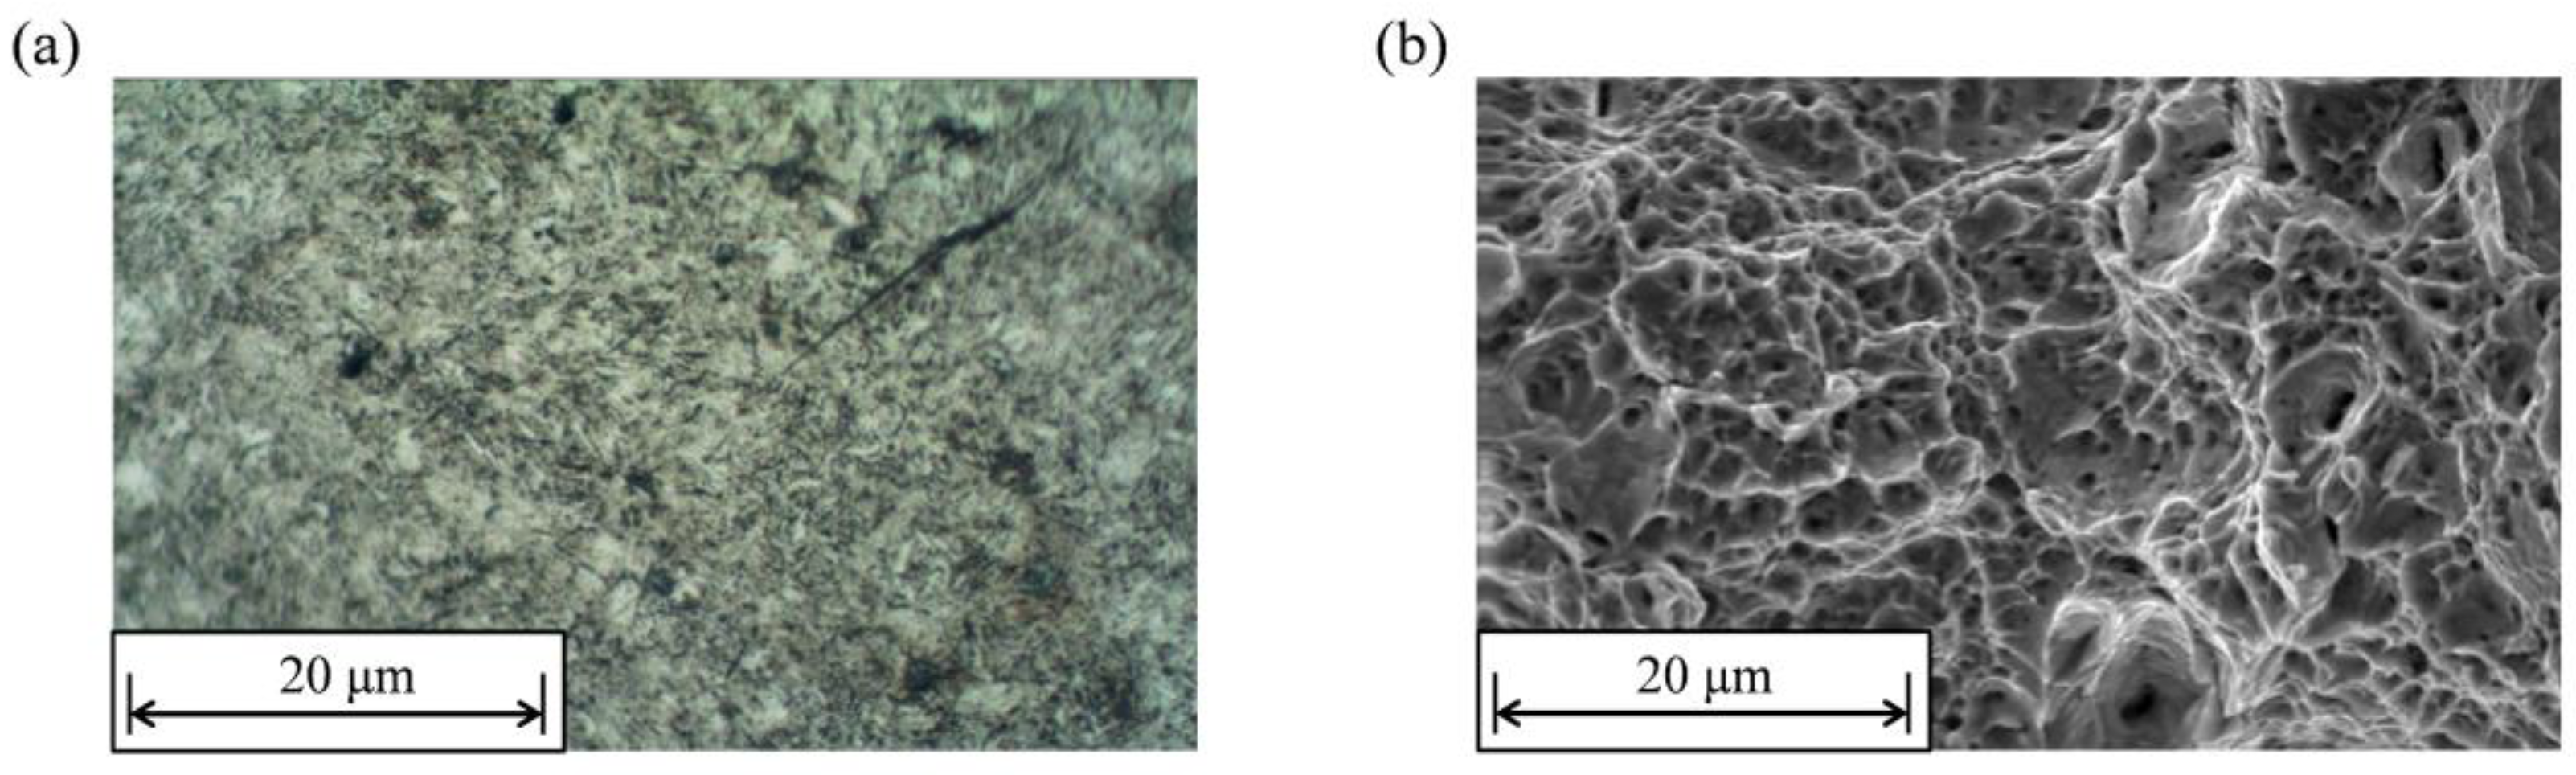
2.1. Microstructure of AerMet 100 Steel
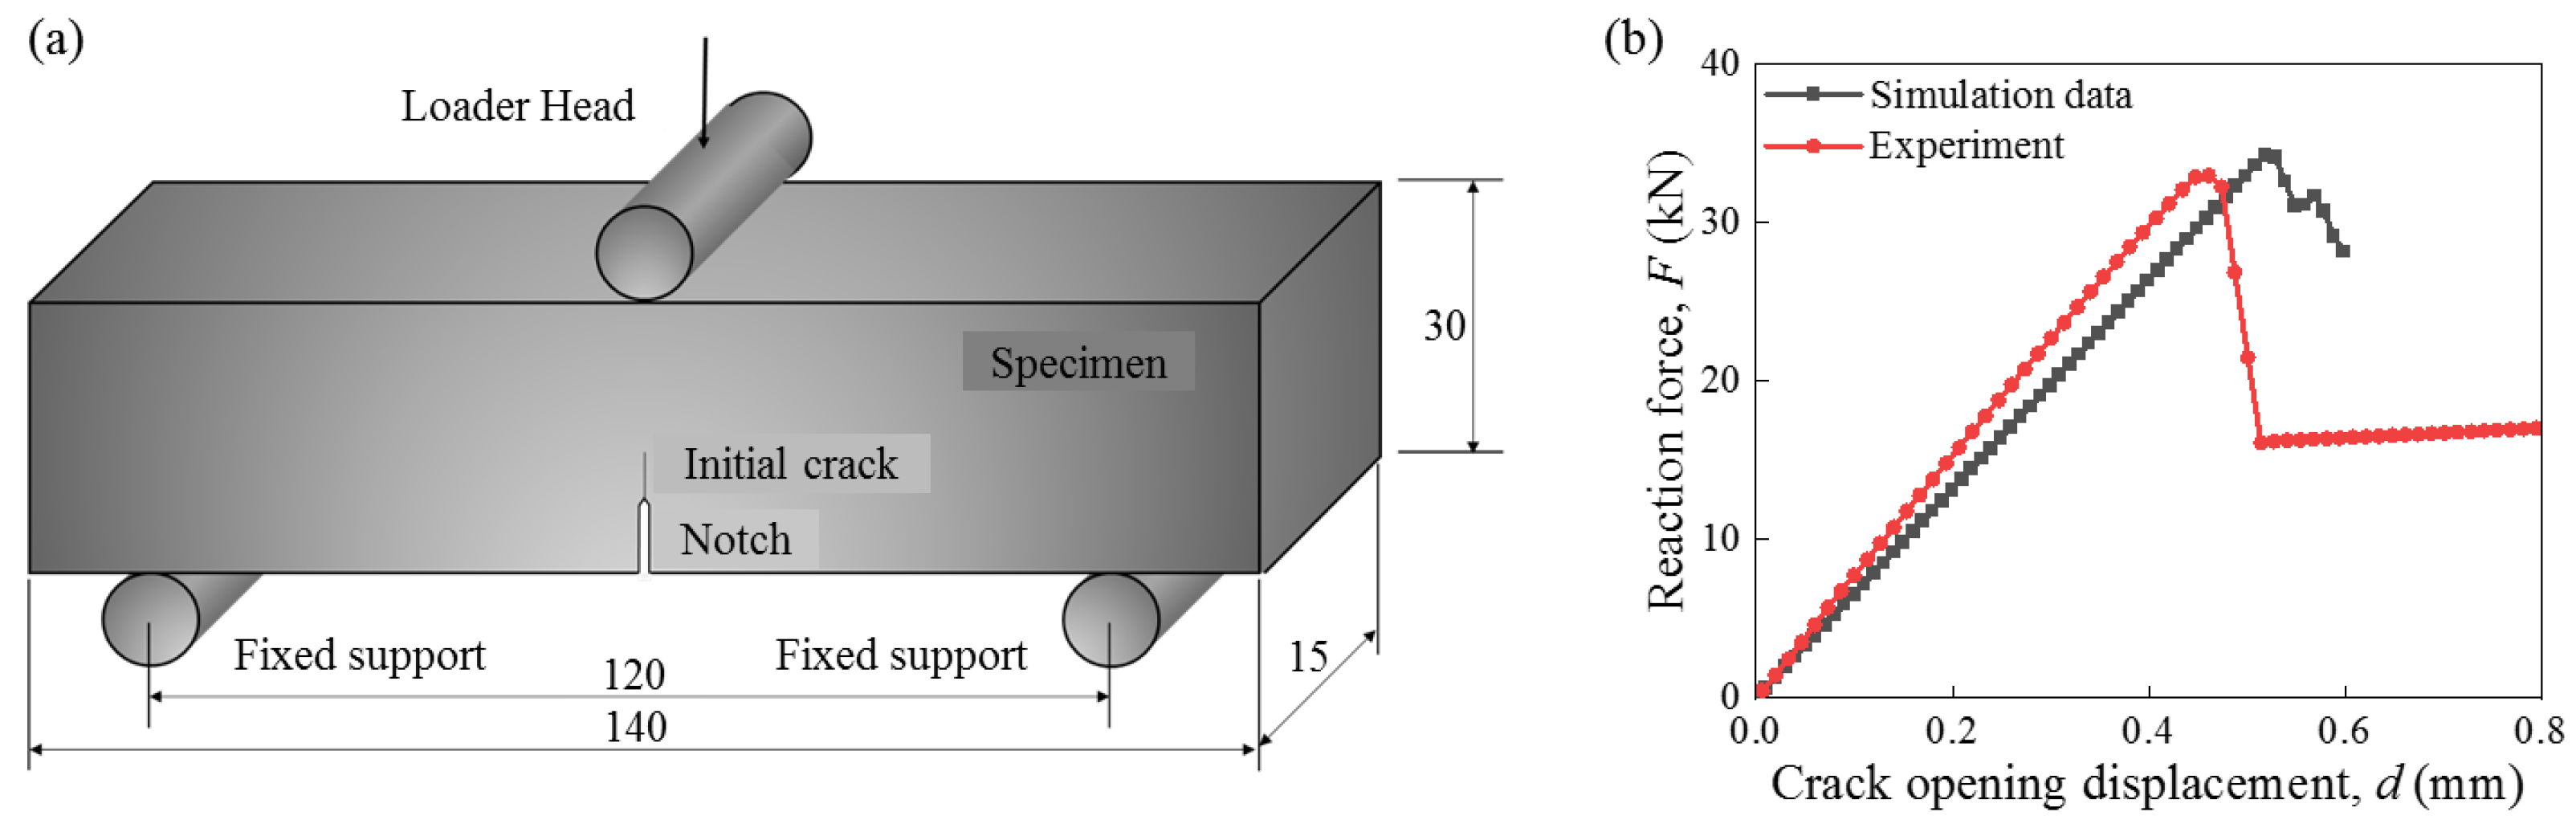
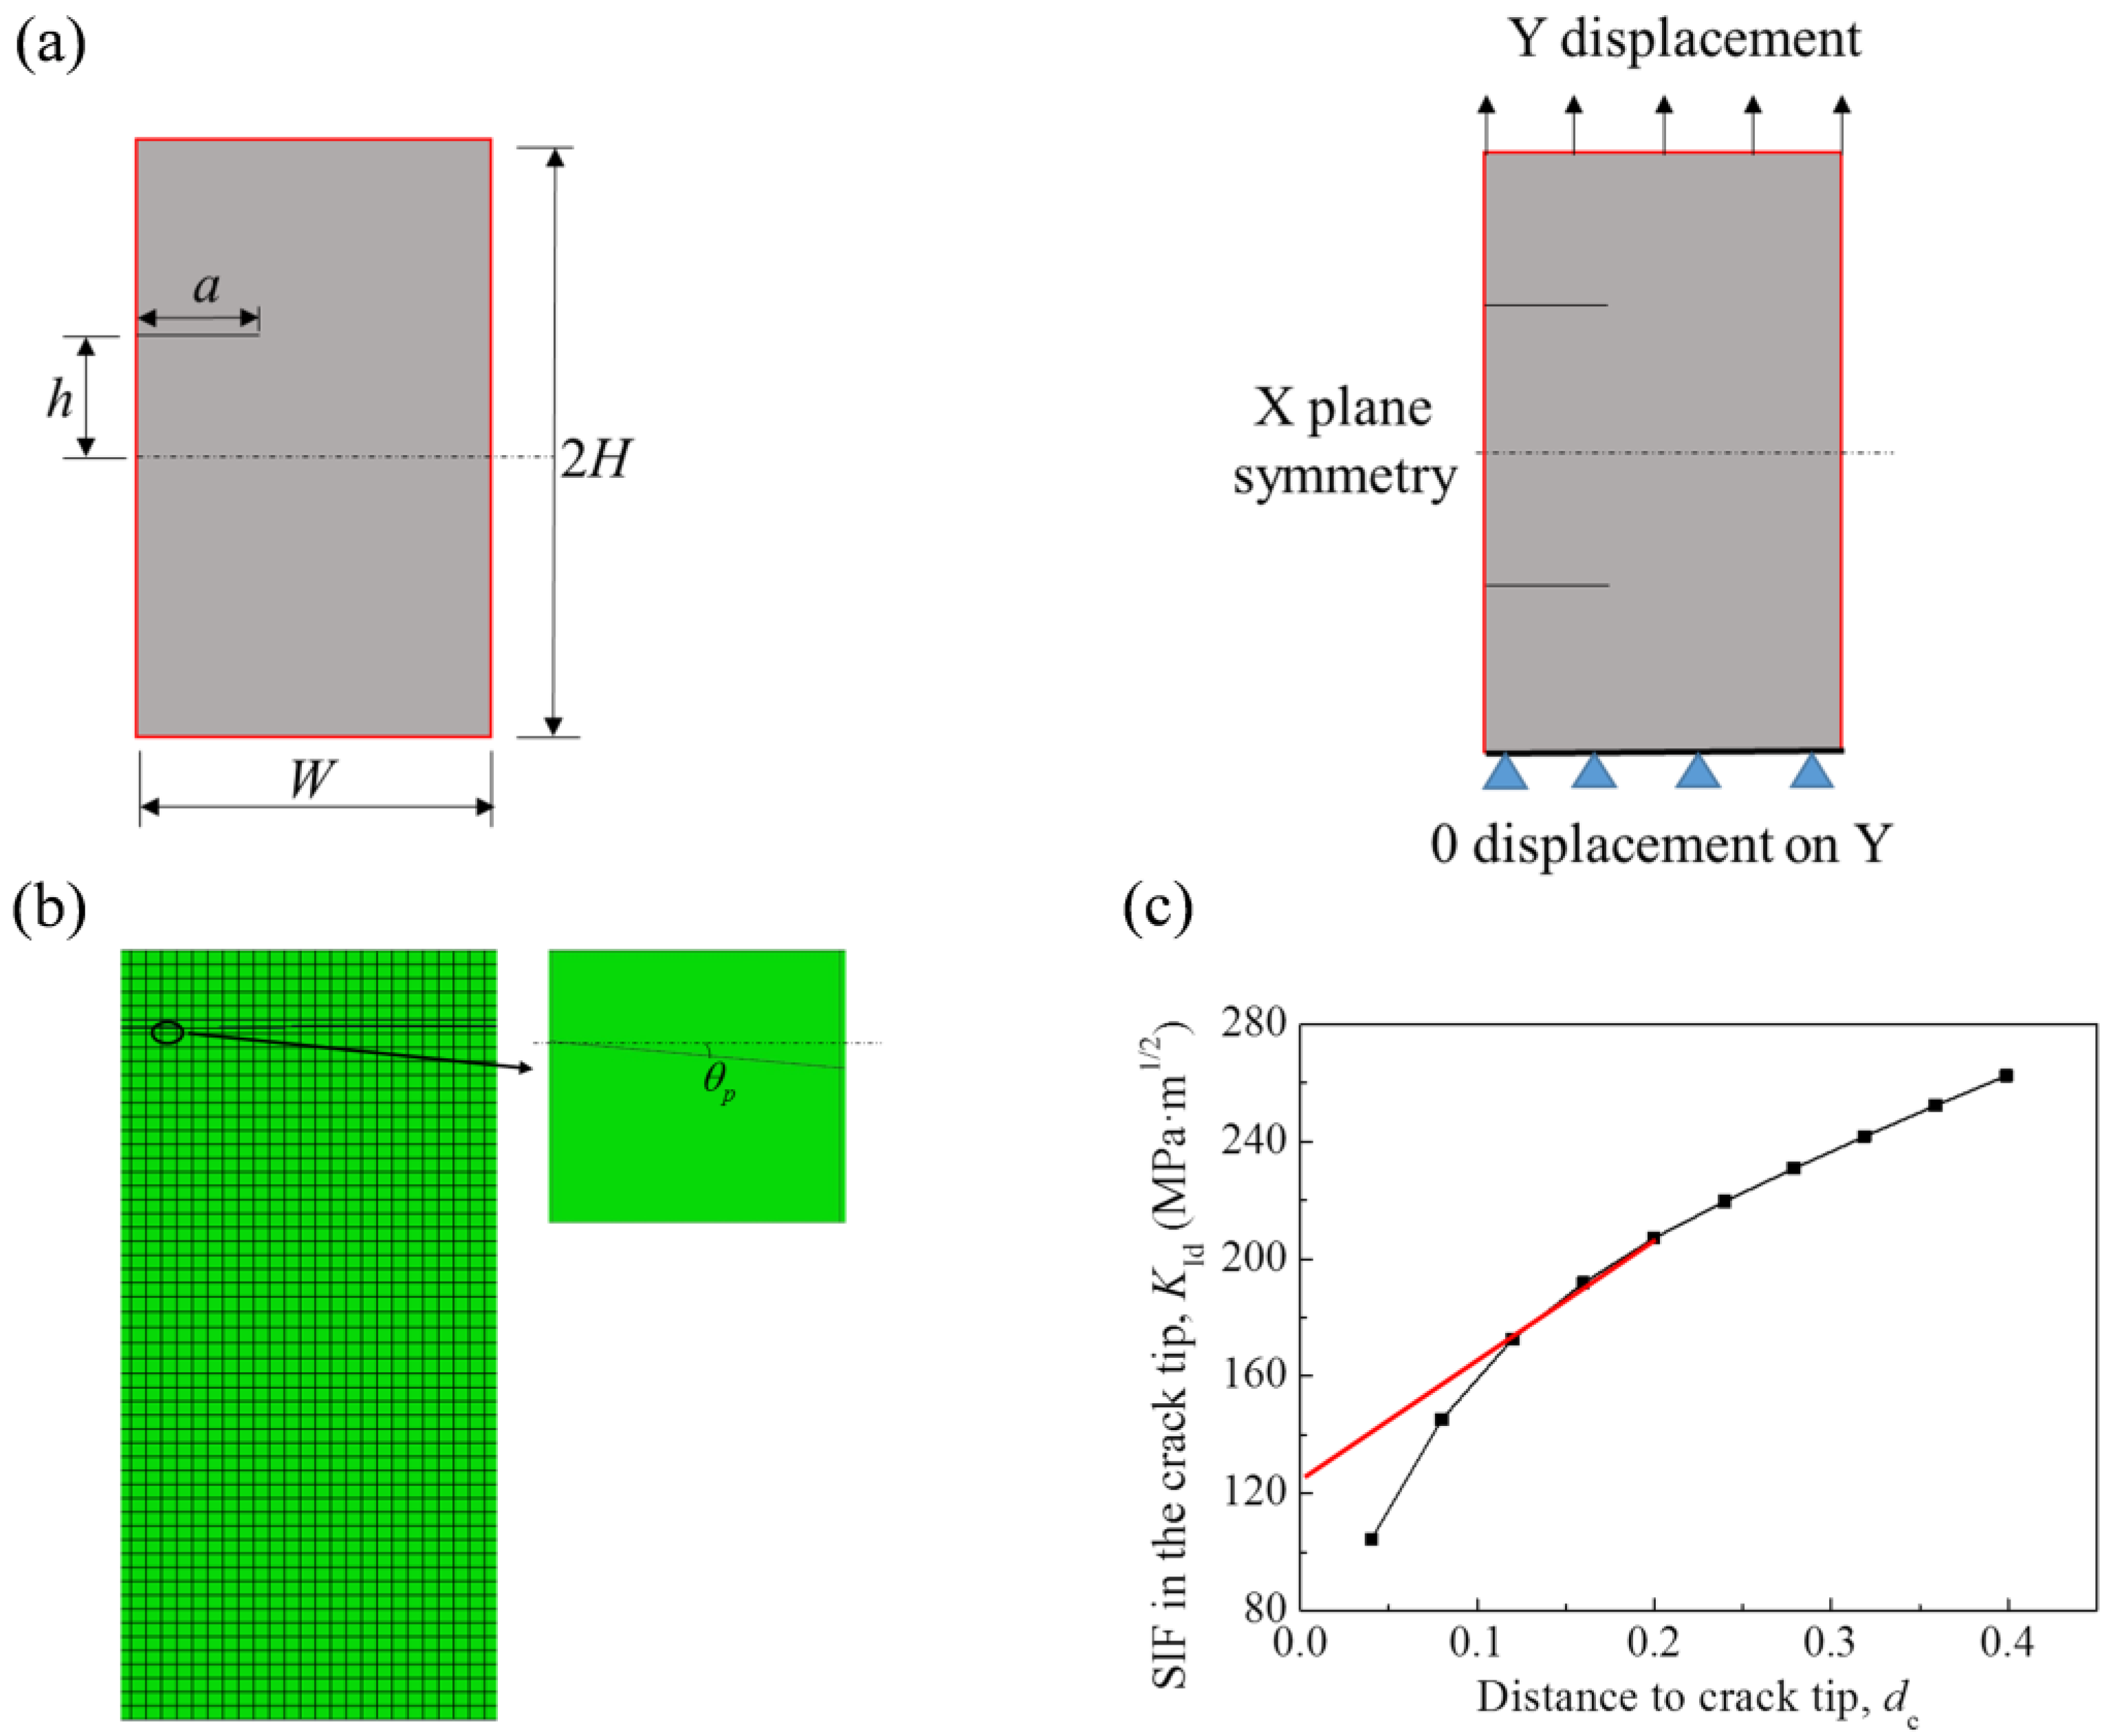
A microscopic photo demonstrating the microstructure of AerMet 100 steel is obtained through the optical microscope. The microstructure of AerMet 100 is typical for ultra-high strength steel, with a large amount of martensite (brighter grains) and tiny amounts of residual austenite (darker grains), as shown in Figure 1a. The martensite demonstrates small and dense laths, which direct differently and distribute uniformly, contributing greatly to the high strength of AerMet 100 steel.
Additionally, the quasi-static tensile fractography of AerMet 100 steel is obtained through SEM (Figure 1b), where a clear necking-down zone could be observed. With the color dark and no metallic luster, the fracture surface is flat and full of fibroid grain, implying the macroscopic ductile fracture. The fracture consists of dimples of various sizes, with sunken bottoms and bulged edges. The deep and uniform dimples suggest the fine plasticity of AerMet 100 steel.

2.2. Modeling

A summary of basic mechanical properties of AerMet 100 is summarized in Ref. [8] and listed in Table 1.
A simplified Johnson–Cook constitutive model of AerMet 100 is fitted based on a series of quasi-static and dynamic experiments. The formula demonstrates as follows:
σ = ( A + B ε n ) ( 1 + C ln ε ˙ * )
where σ represent the stress; A is the yield stress of AerMet 100; B, n, and C are material constants; ε , ε ˙ and ε ˙ * means the equivalent plastic strain, the strain rate and dimensionless plastic strain rate expressed as ε ˙ / ε ˙ 0 for ε ˙ 0 = 0.001   s 1 . The value of A, B, n, and C are presented in Table 2.
To investigate the crack growth in AerMet 100 steel, a standard three-point bending test of AerMet 100 steel is conducted according to ASTM E 1820 [28] to obtain the plane strain fracture toughness, i.e., the critical stress intensity factor KIC for the opening model (model I) of loading.
The specimen, with a length 150 mm, height 30 mm, and thickness 15 mm, is firstly notched through the wire electrical discharge machining and then cracked by using the fatigue testing machine (Figure 2a). The notch is 2 mm wide and 10 mm high with a triangle-shaped top. The initial crack in the specimen is 5 mm long. Both the notch and crack are in the middle of the specimen in terms of the transverse direction.
The specimen is placed horizontally on two fixed supports with a distance 120 mm, and then deforms under the pressure of the loader head, which gradually lowers down at the speed of 5 mm/sec, regarded as the quasi-static loading [8]. The reaction force on the loader head and the crack opening displacement are recorded (Figure 2b).
The critical stress intensity factor in the mode I fracture type KIC can be obtained through the following calculation [28]:
K Ι C = F Q S ( B B N ) 1 2 D 3 2 × f a D
f a D = 3 ( a D ) 1 2 [ 1.99 ( a D ) ( 1 a D ) ] × [ 2.15 3.93 ( a D ) + 2.70 ( a D ) 2 ] 2 ( 1 + 2 a D ) ( 1 a D ) 3 2
where FQ is the maximum reaction force on the loader head; S is the support span; B and BN are the specimen thickness and the effective specimen thickness, respectively, and BN = B if there are no side grooves; a represents the length of the initial crack and D indicates the specimen height.
The test result shows KIC = 150 MPa m . The critical fracture energy GIC could be calculated according to the Irwin relationship for plane strain case [29]:
G Ι C = K Ι C E ( 1 μ 2 )
where E is Young’s modulus, and μ is the Poisson ratio.
In XFEM computation, a propagation criterion is set as the crack propagation occurs with the maximum principal strain of 0.01. The damage evolution method based on the energy with linear softening is adopted in the simulation. To avoid the errors that may happen in the calculation based on the 2D elements and simulate the real-world processes in engineering in a more accurate method, a 3D finite element plate model is established with a width of 10 mm, height of 20 mm, and thickness of 0.1 mm in Cartesian coordinates (Figure 3a), where W represents the width and 2H represent the height, respectively. For simplicity, dimensionless initial crack location and initial crack length are adopted, i.e., h i = h H and l i = a W , respectively. Note that adequate plate area should be given to ensure the propagation of cracks and to avoid the boundary effect. In this study, the maximum li is taken as 0.3, and the maximum hi is taken as 0.8.
Mesh sensitivity analysis is first carried out prior to the parametric calculation, due to the correct size of the elements as well as the type of element, and its numerical formulation is used to ensure good results and the lowest computational cost [30,31]. The liner shape of elements is preferred in this study [32]. The element size has been determined as 0.25 mm × 0.25 mm × 0.1 mm after a sensitivity analysis was conducted. The maximum aspect ratio in this XFE model is 2.50, and the Jacobian rate of all the elements is 1.00. An 8-node linear brick, reduced integration, hourglass control (C3D8R) and small-deformation Lagrangian formulation are adopted in this research.
The crack initiation problem can be described and simplified as a half model of a thin plate with an inner crack. In the XFE model with a preset crack, X-plane symmetry boundary condition has been applied on the left side of the XFE model, which makes the displacements of nodes on the left boundary restricted in the X-plane. The displacement in Y direction of nodes in the bottom surface is fixed as 0 and the displacement in Y direction of the top surface gradually reaches 2 mm under tension (Figure 3a).

2.3. Computational Method of Crack Propagation Angle and SIF

The suggested fracture mode is proven to be opening-mode (mode I) dominant such that the crack propagation angle θ p and stress intensity factor (SIF), namely KId, are selected to study the influence of governing parameters in the simulation. The crack propagation angle is defined as between the propagated crack in the first element and horizon line, illustrated in Figure 3b.
According to the fundamentals in elasticity, the stress singularity of r−1/2 is around the crack tip. Thus, the SIF is adopted instead and described as follows [33]:
K Ι = lim r 0 σ 22 ( r , θ = 0 ) 2 π r
K II = lim r 0 σ 12 ( r , θ = 0 ) 2 π r
K III = lim r 0 σ 23 ( r , θ = 0 ) 2 π r
where KI, KII and KIII represent the SIFs in the opening mode (mode I), in-plane shearing mode (mode II), and anti-plane shearing mode (mode III), respectively. σ 22 , σ 12 and σ 23 are the stress components normal to the crack propagation direction, locally perpendicular to the crack edge and tangent to the crack edge, respectively. r means the distance to the crack tip and θ represents the angle between the crack propagation direction and the line connecting the crack tip and the point. Due to the unavailability of the stress in the crack tip, an extrapolation method is adopted to calculate KId, KIId and KIIId in the crack tip and elaborated as follows.
It is straightforward to obtain the stress components σ 22 i , σ 12 i and σ 23 i (i = 1, 2, 3) and coordinates of the points ri in front of the crack tip. Therefore, the SIFs in those points can be obtained as follows:
K Ι d i = σ 22 i 2 π r i
K II d i = σ 12 i 2 π r i
K III d i = σ 23 i 2 π r i
Assume that the relationship between ri and Kjdi, where j represents for I, II and III, can be described in a linear equation. Least square method is adopted to fit the data pair of (ri, Kjdi). Accordingly, the SIFs in the crack tip can be calculated in the following equation:
K Ι d r i r i K Ι d i r i 2 K Ι d i ( r i ) 2 N r i 2
K II d r i r i K II d i r i 2 K II d i ( r i ) 2 N r i 2
K III d r i r i K IIId i r i 2 K IIId i ( r i ) 2 N r i 2
where N is the number of the points selected to calculate KId, KIId and KIIId.
To verify the accuracy of the suggested extrapolation method, a similar finite model under 2000 MPa tensile pressure with the same size as the previous model pressure is established. Figure 3c demonstrates ten selected points in front of the crack tip and the data (ri, KIdi). The calculation results are compared with the typical computation formula as [33]:
K Ι d = σ π a 2 W π a tan π a 2 W
where σ represents the tensile pressure; W denotes the width of the half model, and a is the crack length.
The stresses within the vicinity of the crack tip are extremely high and calculated incorrectly in the FE analysis. Thus, the first two points, whose KIds obviously do not stand in a line with the following points (Figure 3c), are excluded when calculating the stress intensity factor in the crack tip; similar methods are adopted in Refs. [34,35].
To obtain an accurate calculation, 4 different methods to select the extrapolation are compared to calculate the KId.
  • Method 1: 10 points in front of the crack tip are selected;
  • Method 2: the first 2 points are excluded, but the remaining 8 points are selected;
  • Method 3: the first 3 points are selected;
  • Method 4: the first 2 points are excluded, but the consecutive 3 points are selected.
The computational results are listed in Table 3. In comparison, Method 4 obviously possesses a better accuracy than other methods; thus, it is adopted in the later discussion.

3. Results

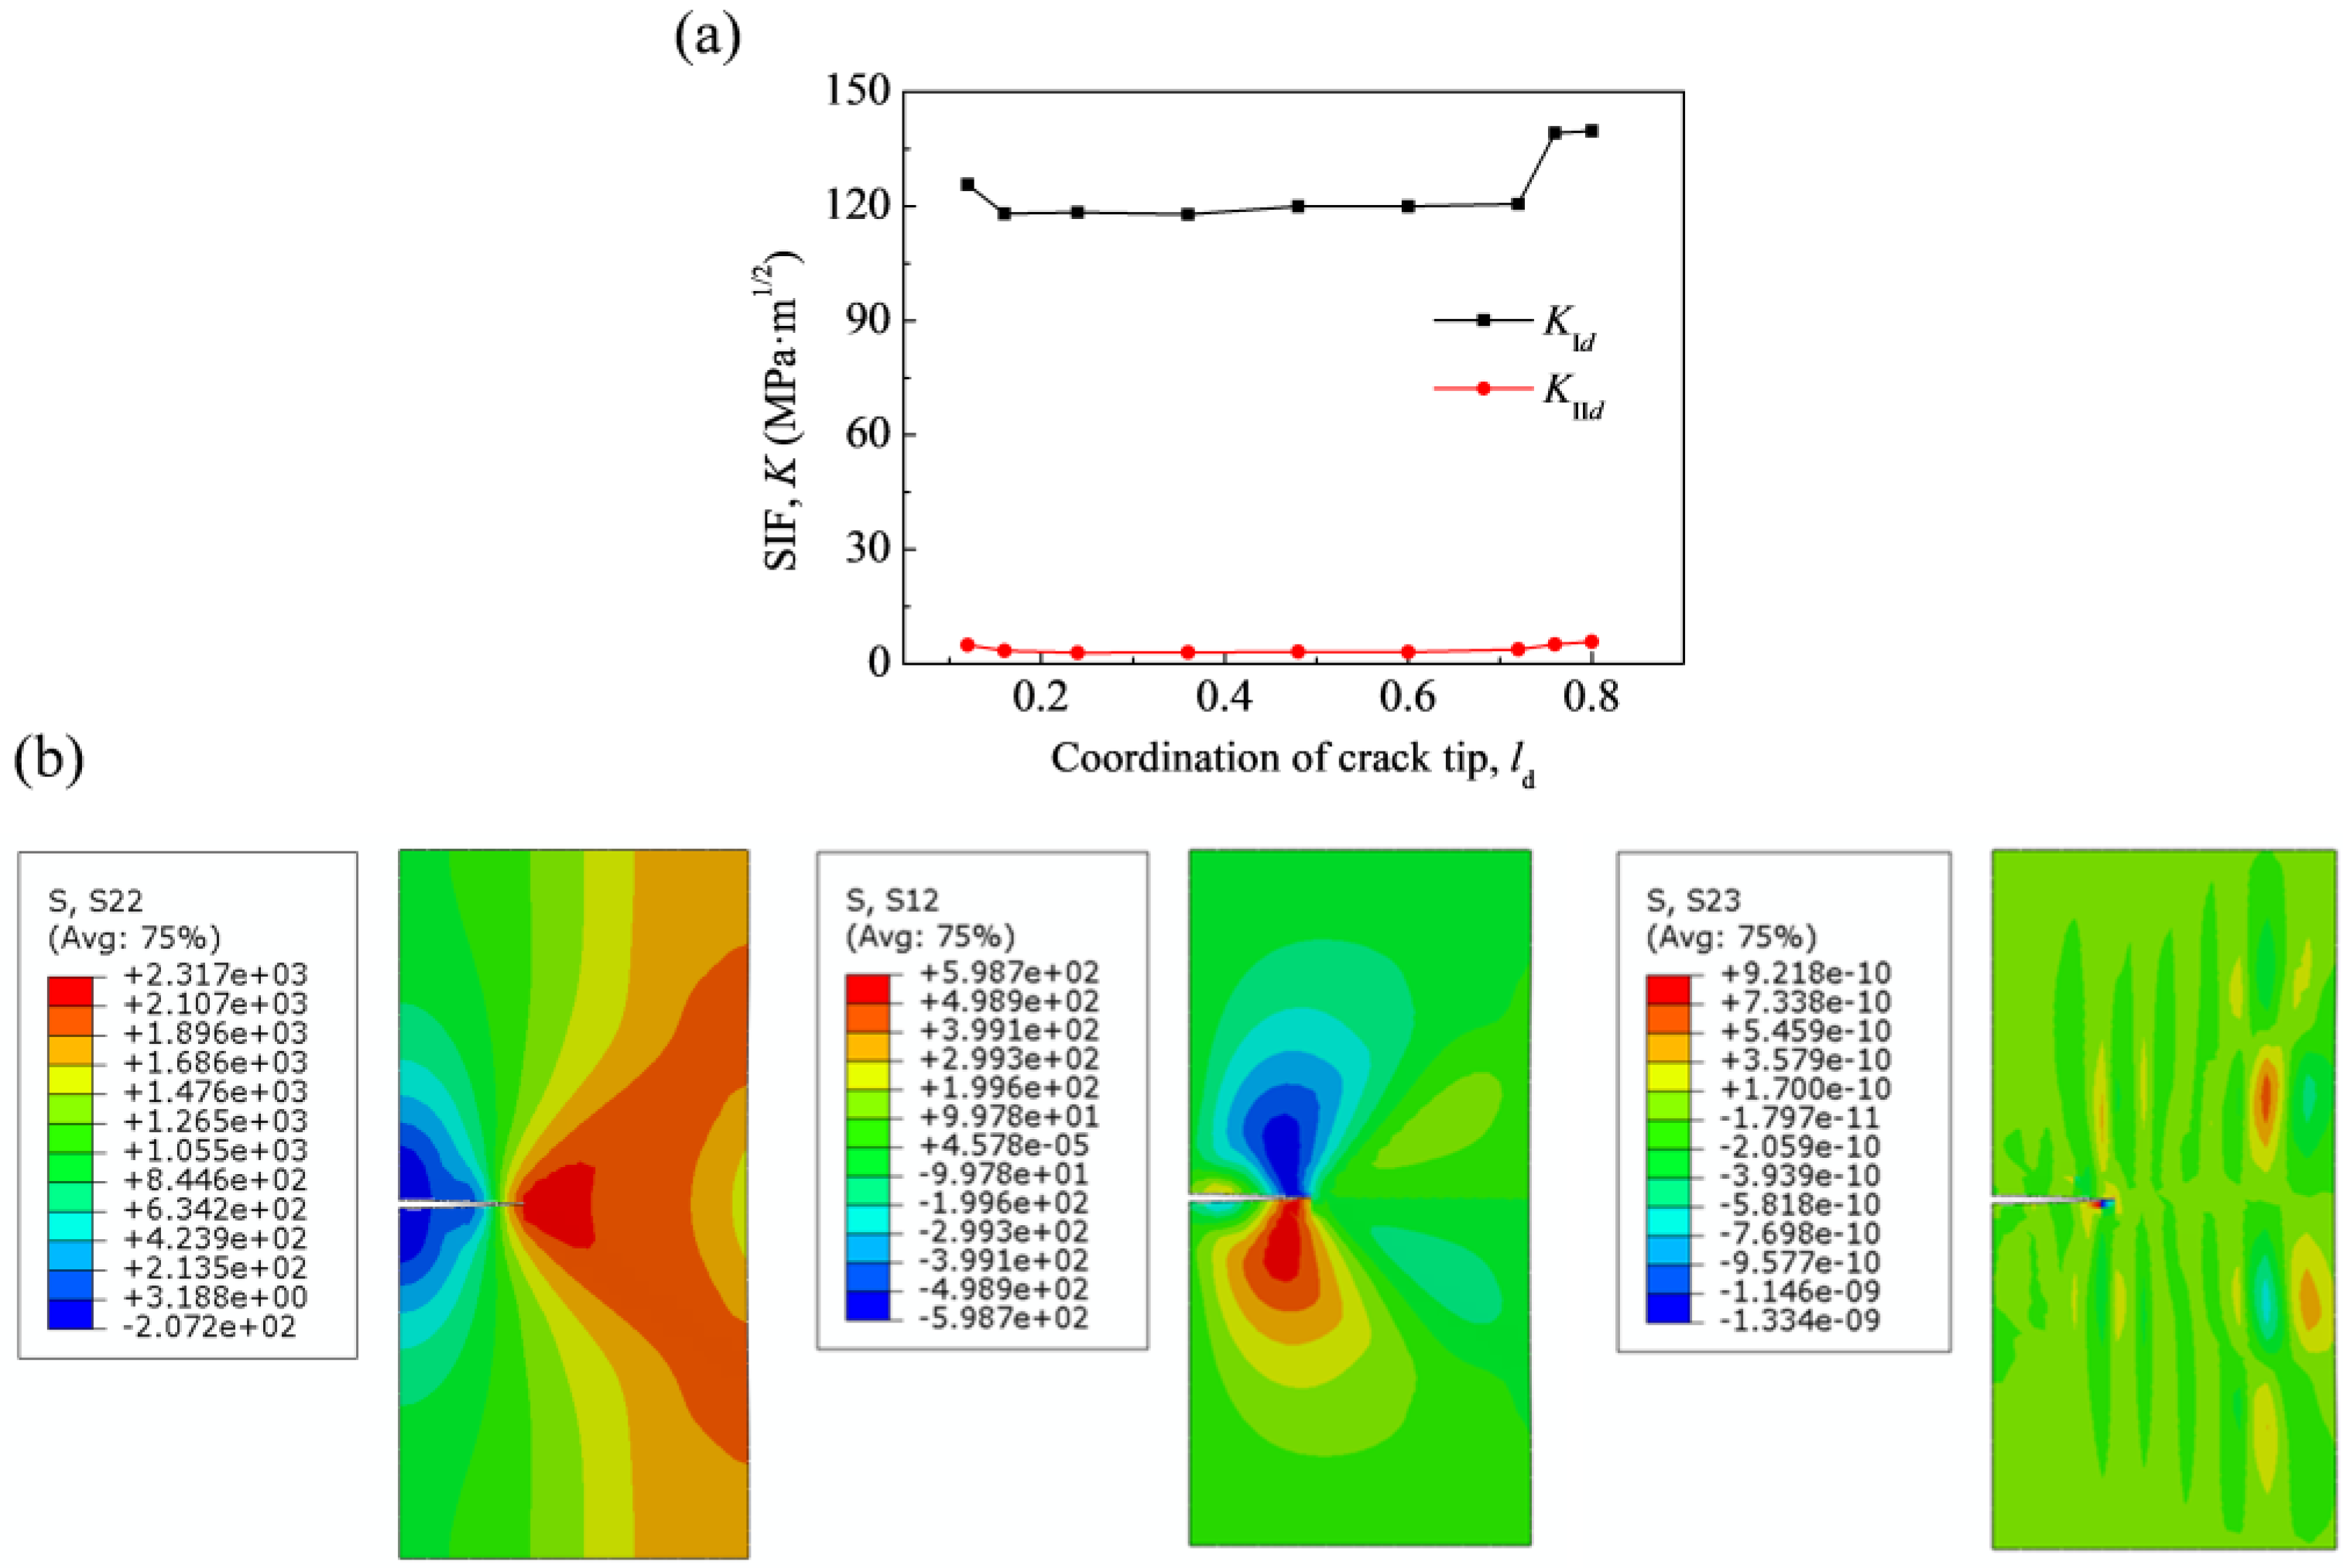
3.1. Propagation Behavior of Typical In-Plane Crack

When the initial crack length li equals 0.1 at hi = 0, the crack grows along the middle line, and there is no deflection in the crack path. Based on the extrapolation method, the SIFs, i.e., KId, KIId, and KIIId in the crack tip in the crack propagation process could be calculated. KIIId stays at zero during the crack propagation (Figure 4a). Obviously, KId is larger than KIId and KIIId, evidenced by the stress contours of S22, S12, and S23 in the crack propagation process, with S22 much bigger than S12 and S23 (Figure 4b), where S22, S12 and S23 correspond to σ 22 , σ 12 and σ 23 . The result implies that the fracture mode in this process could be regarded as the opening mode such that only KId would be discussed in the following study. In addition, KId shows a bigger value at the beginning and approaching the end while staying stable in the propagation process due to the boundary effect.

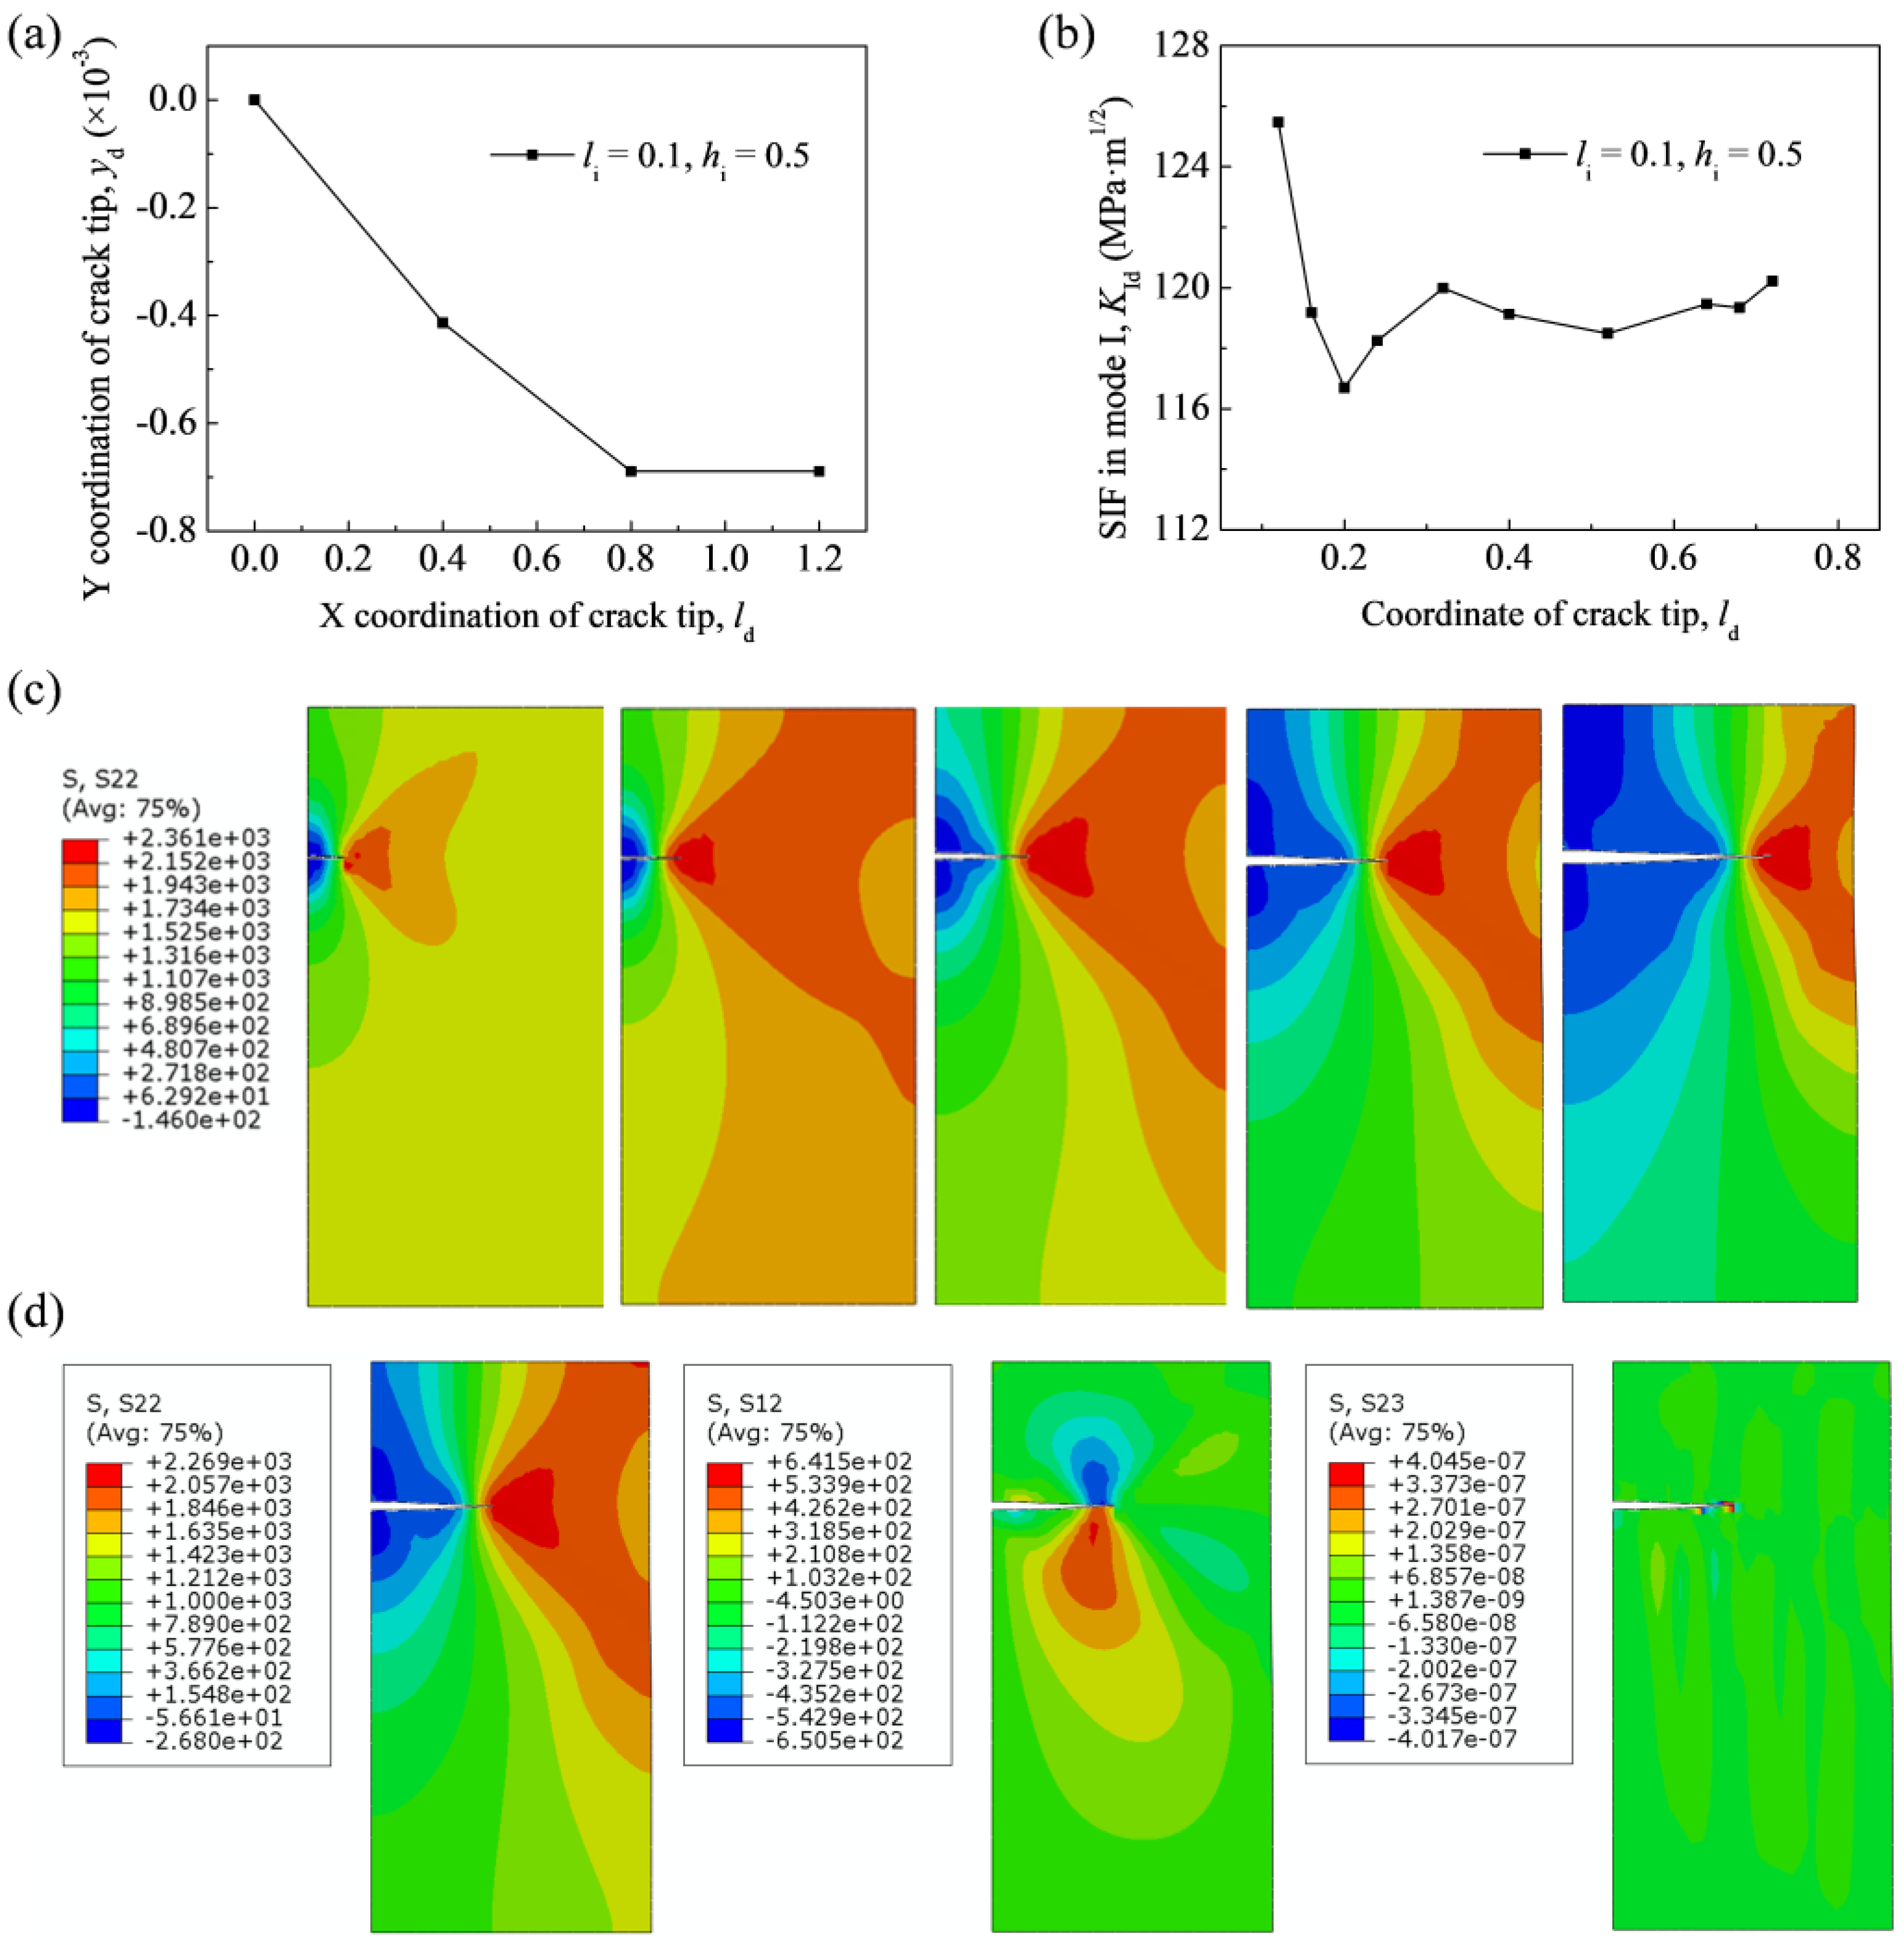
3.2. Propagation Behavior of Crack with an Offset

If the crack is offset, namely hi > 0, there is a turning in the crack path and the crack propagation angle shows an inward tendency. The crack propagation path shows an exponential decline from the beginning of the crack propagation process when hi = 0.5 and li = 0.1 (Figure 5a). The stress contours in the crack propagation process are presented in Figure 5c, where the stress distribution in front of the crack tip shows more severe asymmetry at the beginning of the crack propagation caused by the offset of the crack location. Additionally, the fracture mode could be regarded as mode I, since S22 is much larger than S12 and S23 (Figure 5d). The boundary effect also exerts a nontrivial influence on KId in the propagation process of the crack with an offset recorded (Figure 5b).

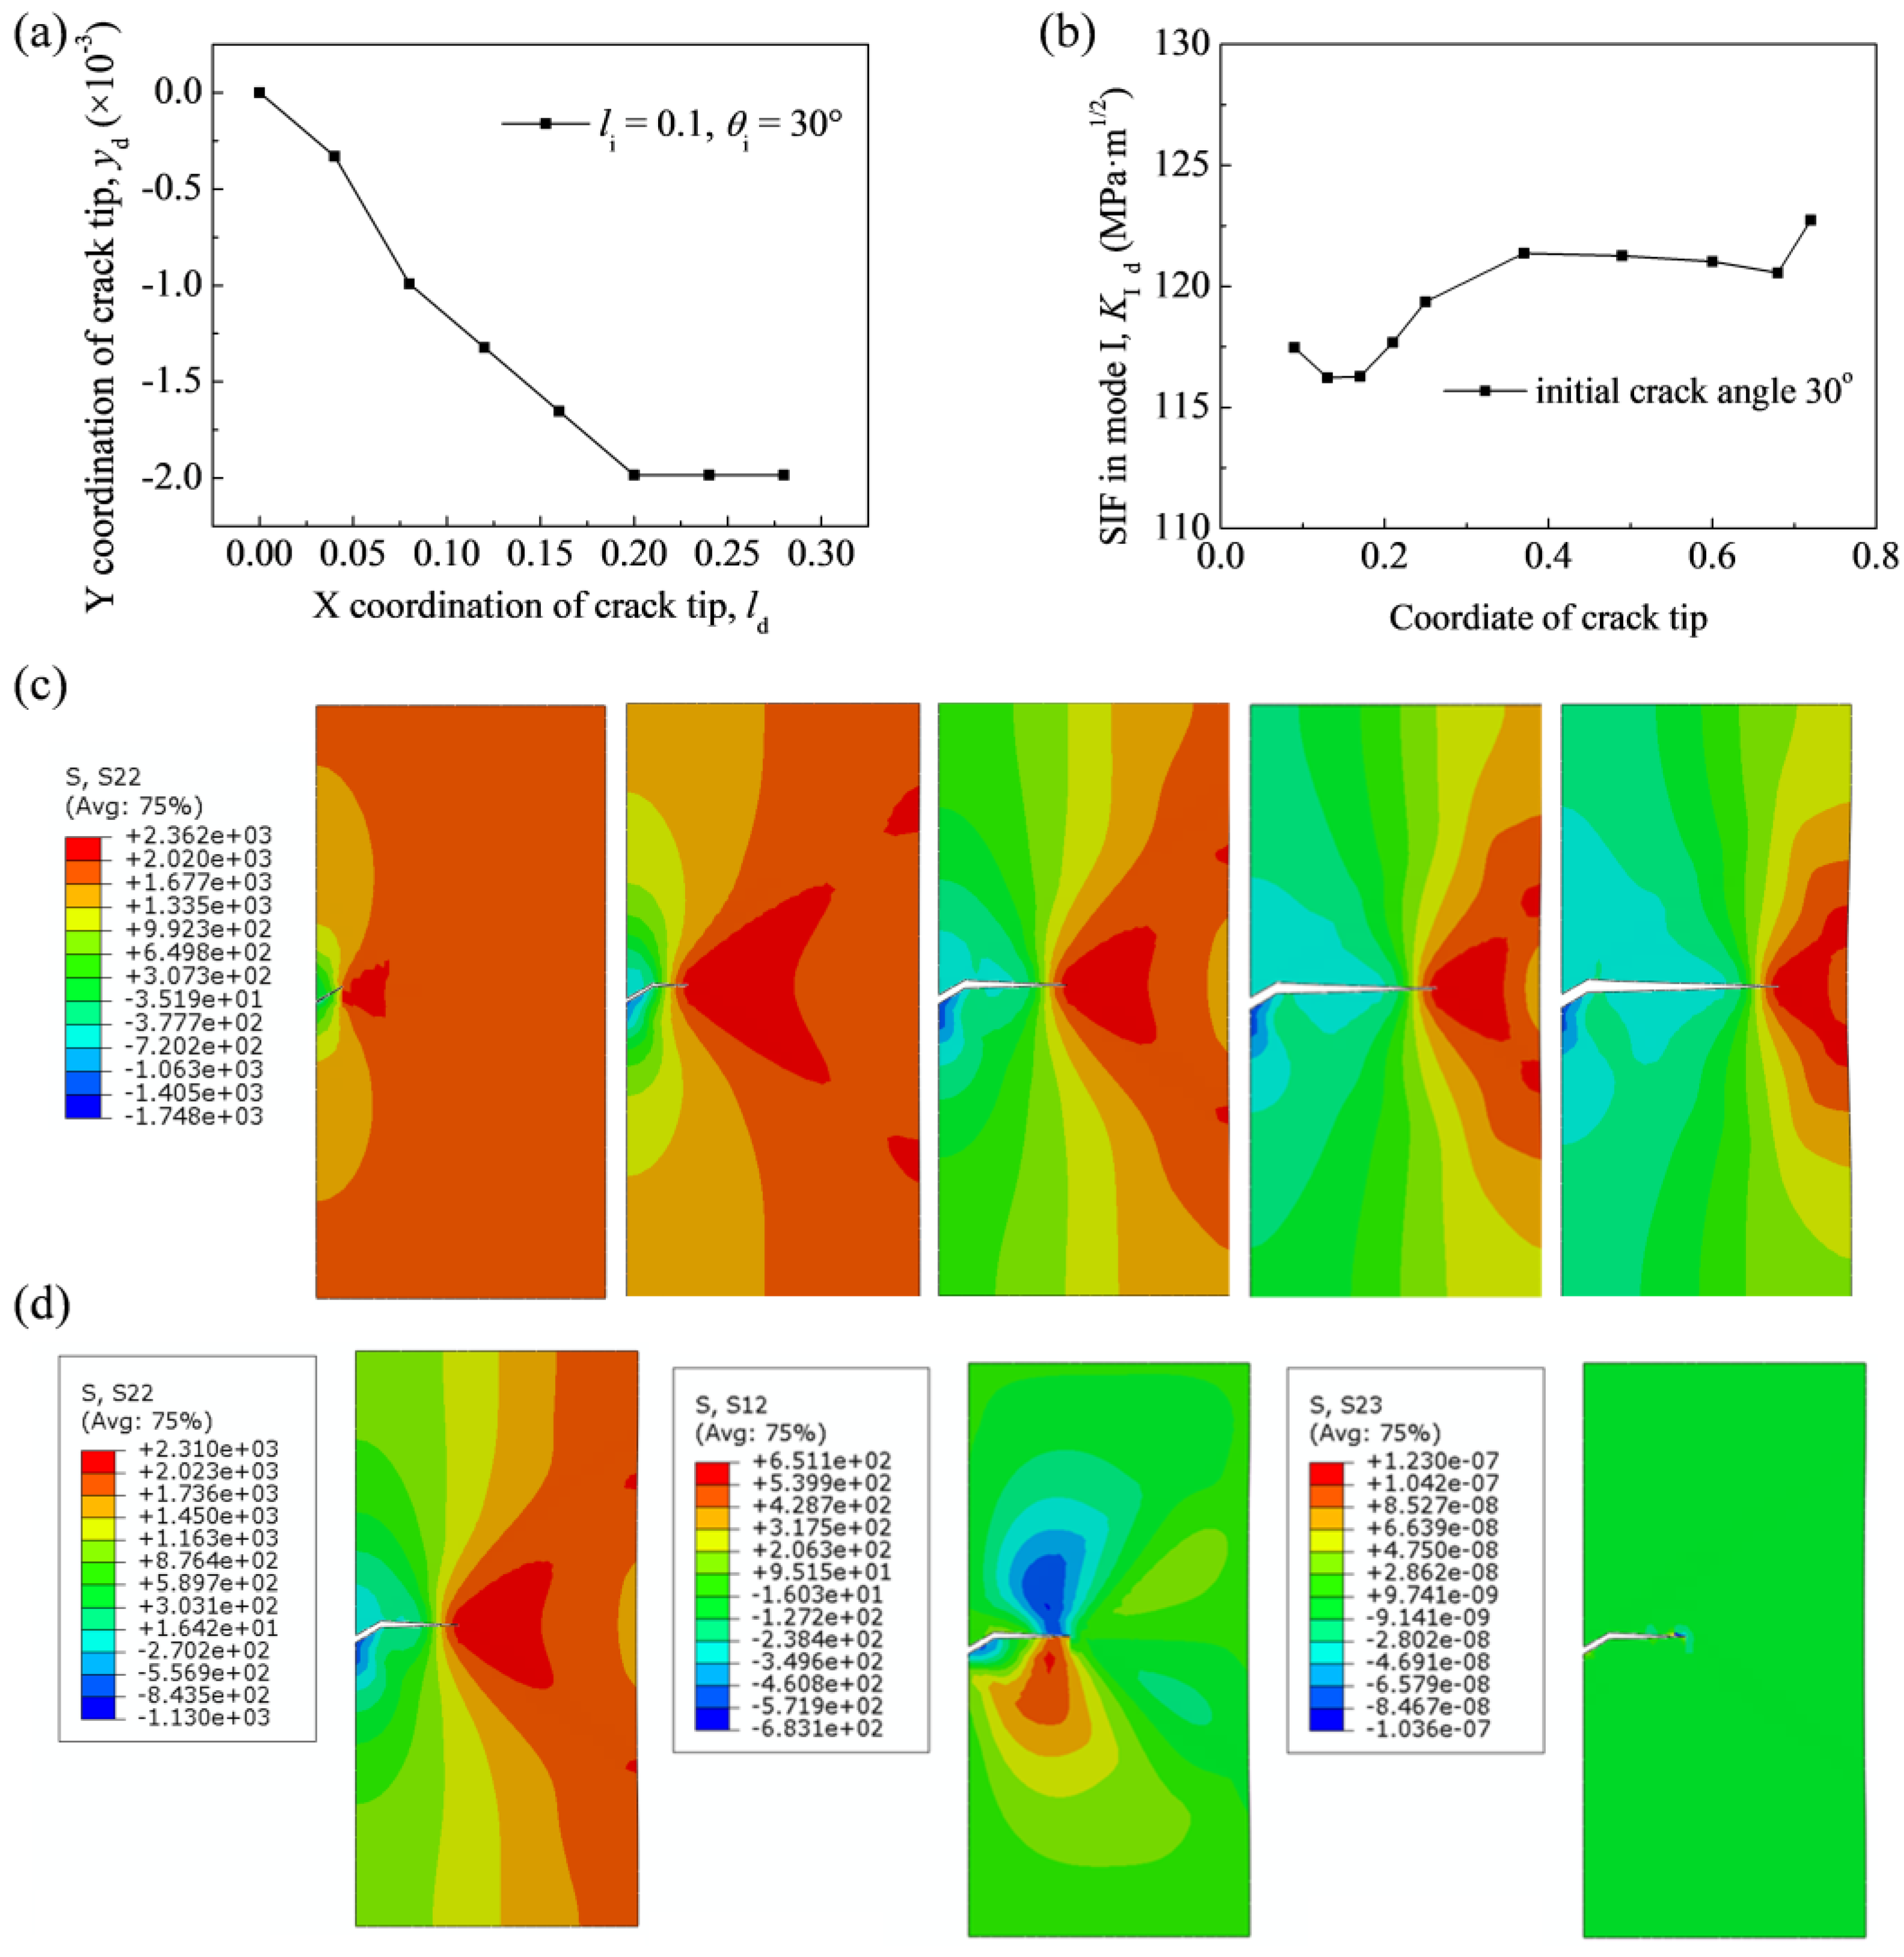
3.3. Propagation Behavior of Crack with an Initial Angle

It is possible that the crack is not always parallel to the plate boundary in real engineering applications. When the crack starts to propagate, its path deflects inward, and the Y coordinate of the crack tip gradually declines in an exponent shape (Figure 6a). The stress contour in front of the crack tip is more asymmetric in the beginning (Figure 6c). One may observe that S22 is far larger than S12 and S23 (Figure 6d), indicating a mode I fracture. KId in the propagation process exhibits a plateau stage in the whole process, without the beginning and the end section (Figure 6b).

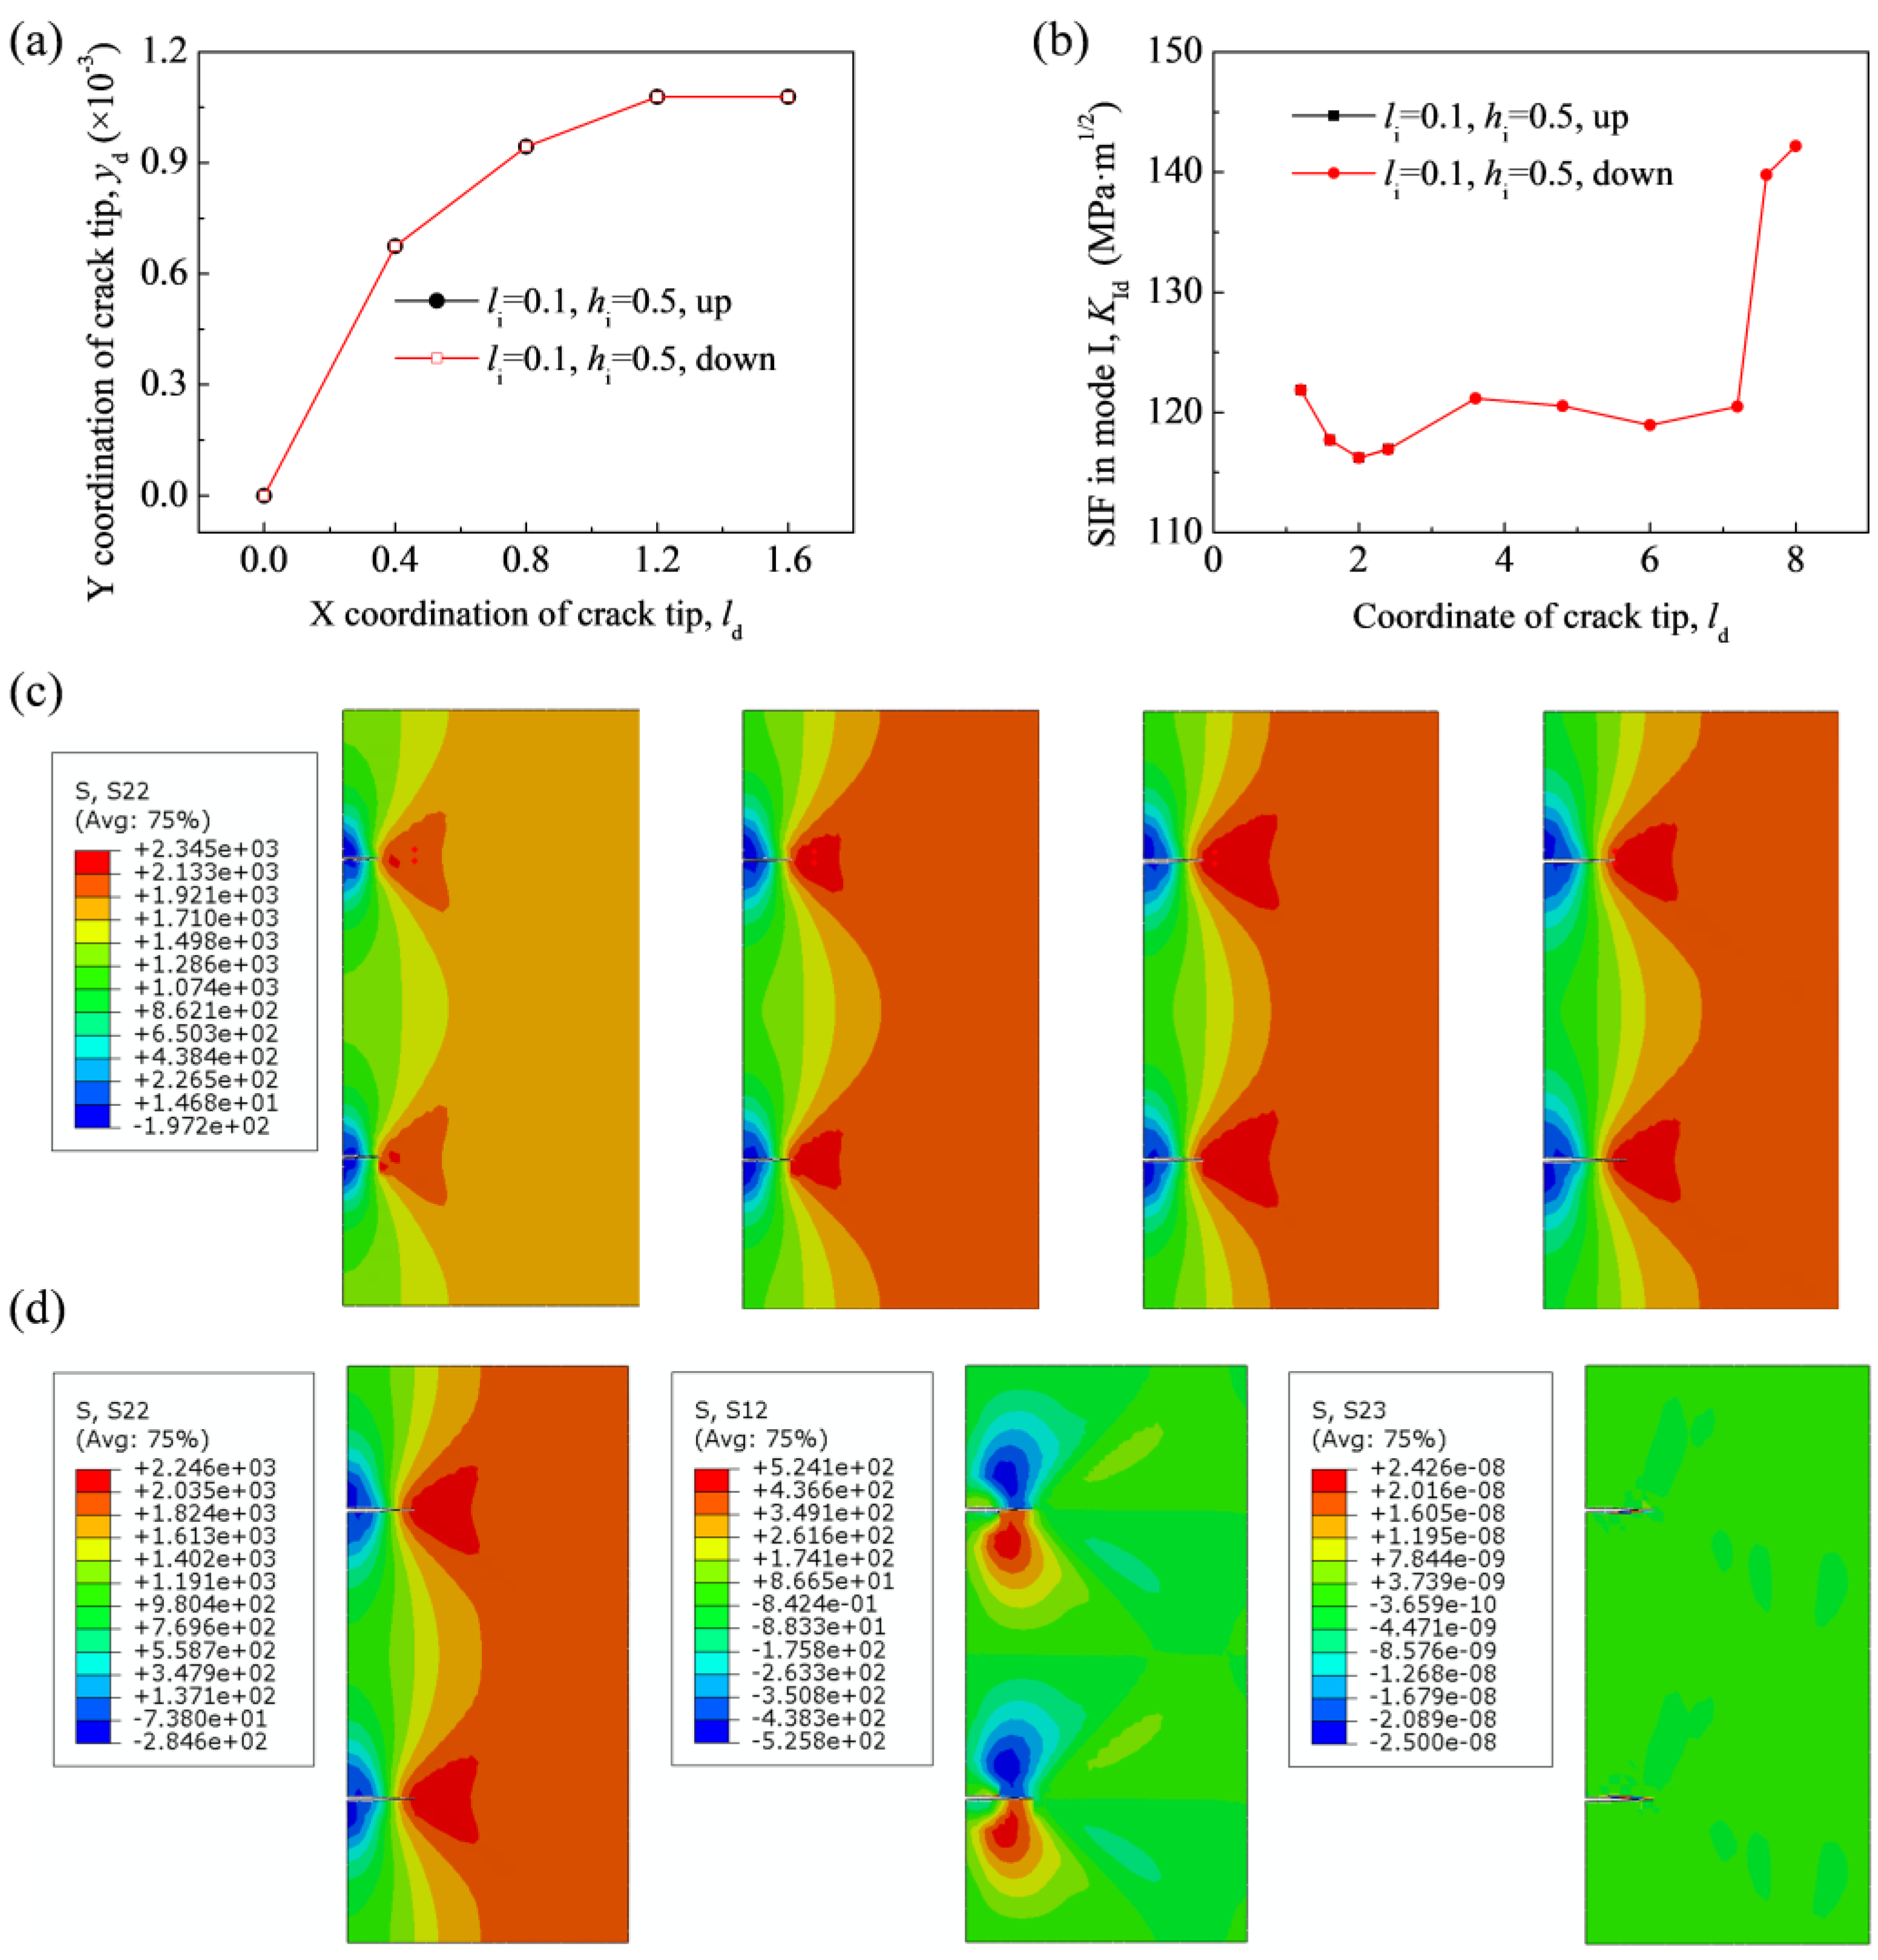
3.4. Propagation Behavior of Multi-Crack

The existence of multi-cracks imposes significant influence on the crack propagation process. In the two-crack model with li = 0.1 and hi = 0.5, two cracks would not propagate simultaneously after some time due to the residual numerical error accumulation during the propagation process. Thus, only the beginning section is taken into consideration when two cracks propagate simultaneously. An outward deflection is observed and the Y coordinate of the crack tip shows a gradual increase (Figure 7a). The decrease of the deflection angle could also be explained based on the stress distribution in the stress contour, which is more asymmetric in the beginning than in the later propagation process (Figure 7c). Mode I fracture is observed since S22 is larger than S12 and S23 (Figure 7d). A steady plateau of KId is observed in the beginning, followed by a sharp increase in the end of the crack propagation procedure (Figure 7b). The sharp surge of KId in the end may be attributed to the influence of the boundary effect.

4. Discussion

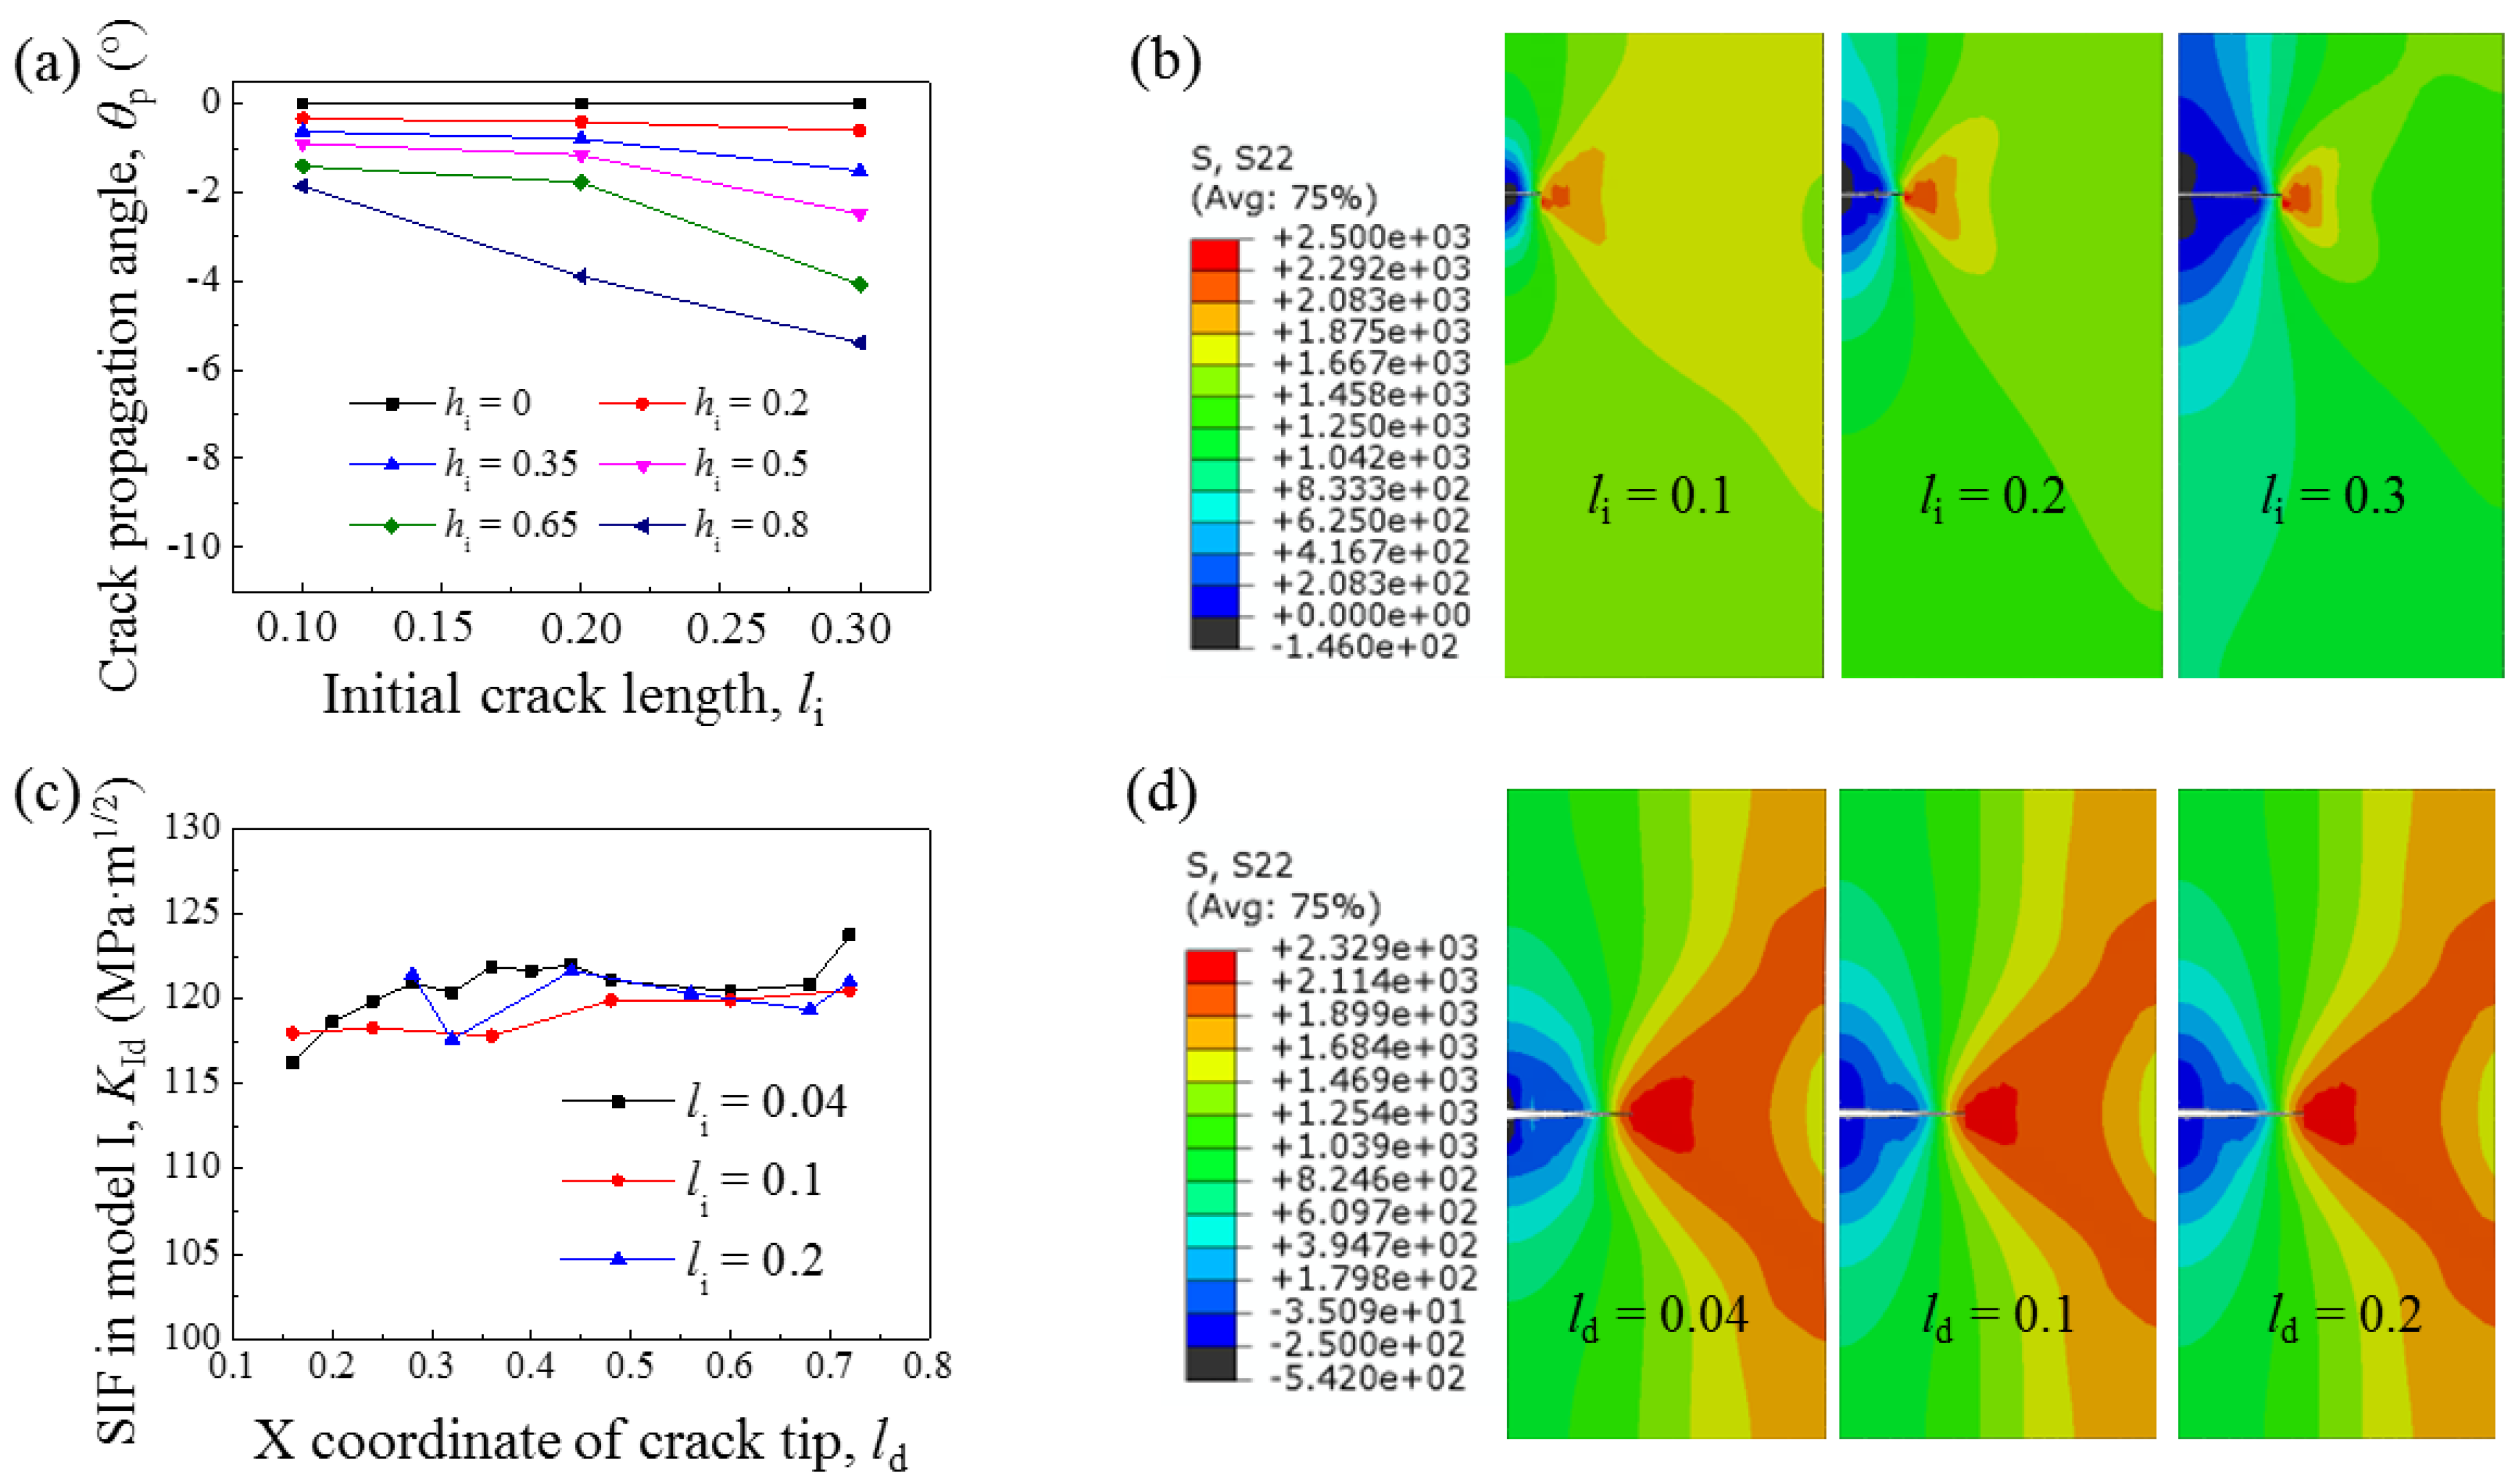
4.1. Influence of Initial Crack Length

The crack propagation angle of the initial crack length in the range from 0.1 to 0.3 shows a significant increase trend when the crack location hi increases from 0 to 0.8 (Figure 8a). All cracks show an inward tendency, becoming closer to the middle line when hi > 0 (Figure 8a). Straightforwardly, the line with a shorter initial crack length stays consistently higher, which means a smaller crack propagation angle than that of a longer initial crack length. The influence of li can be attributed to the change in the stress field. When the initial crack starts to propagate when li equals 0.1, 0.2, and 0.3 at crack location 0.5, the asymmetry of the stress contour in front of the crack tip on the plate determines the value of the crack propagation direction (Figure 8b). This also changes with the increase in initial crack length and the crack location.
For a brief comparison, only the plateau stage in the line describing KIds in the crack propagation process is selected, and all stress contours are normalized. KId in the crack tip nearly keeps steady in the crack propagation process when the initial crack length ranges from 0.04 to 0.2 (Figure 8c), indicating the initial crack length has little influence on KId, which could also be verified through the stress contour (Figure 8d). The distribution stress contour and KIds calculated at the first and the last two points change dramatically because of the boundary effect and may result in a comparatively large error in reflecting the real stress state at the crack tip. If the first two points are excluded, KIds in Figure 4a, Figure 5d, Figure 6c and Figure 8d fluctuate around an average value, with the difference less than 4%, which is within the error tolerance of the FE method and KIds could be regarded as remaining stable in the propagation process.

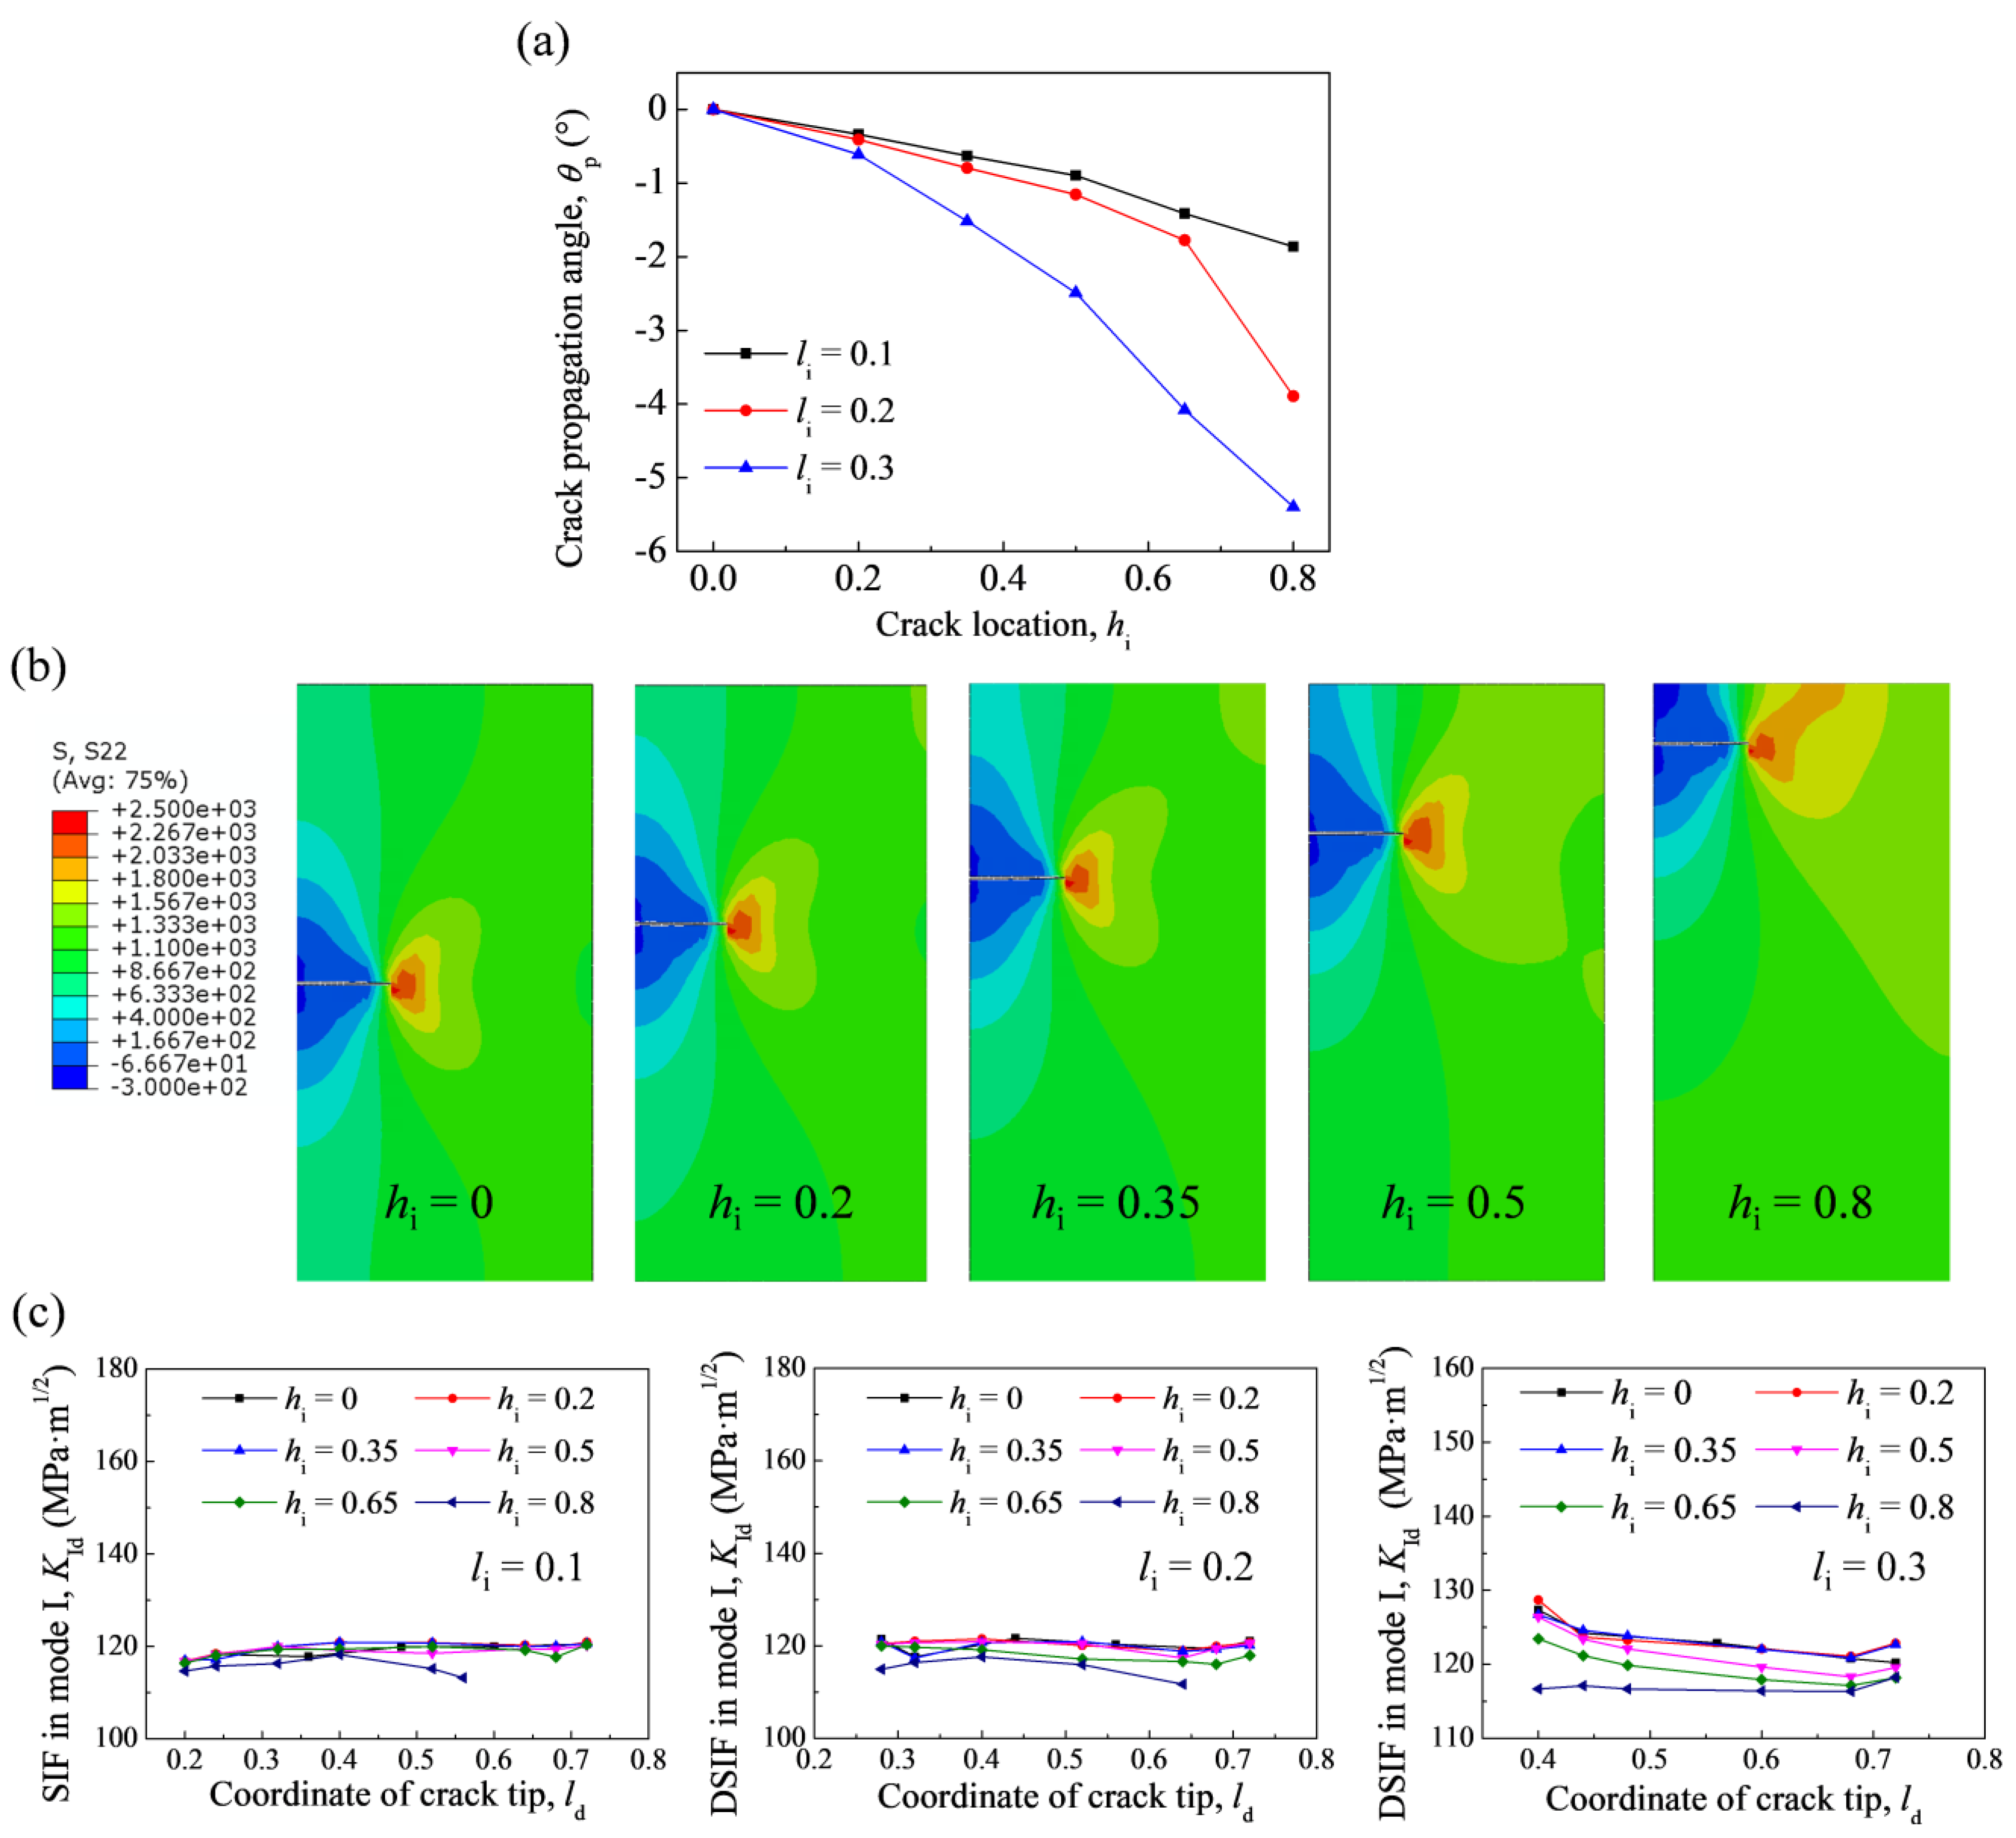
4.2. Influence of Crack Location

The crack propagation angle gradually becomes larger as the crack location changes from 0 to 0.8 in the crack length range li from 0.1 to 0.3 (Figure 9a). The crack propagation stays zero when hi = 0. The crack propagation angles increase from 0 to 1.86°, 3.89°, and 5.39°, respectively, in three lines of different crack lengths as hi increases from 0 to 0.8. The responsible reason should be the influence of hi on the change of stress distribution. Clearly, the asymmetry of the stress contour in front of the crack tip shows an increase with the increase of the crack location, namely the value of hi (Figure 9b).
As hi increases, KId exhibits a smaller value consistently than that of a smaller crack location (Figure 9c), which could be attributed to the change of the stress distribution in front of the crack tip. The observed high stress region in red color declines gradually as the crack location increases, leading to a smaller value of KId.

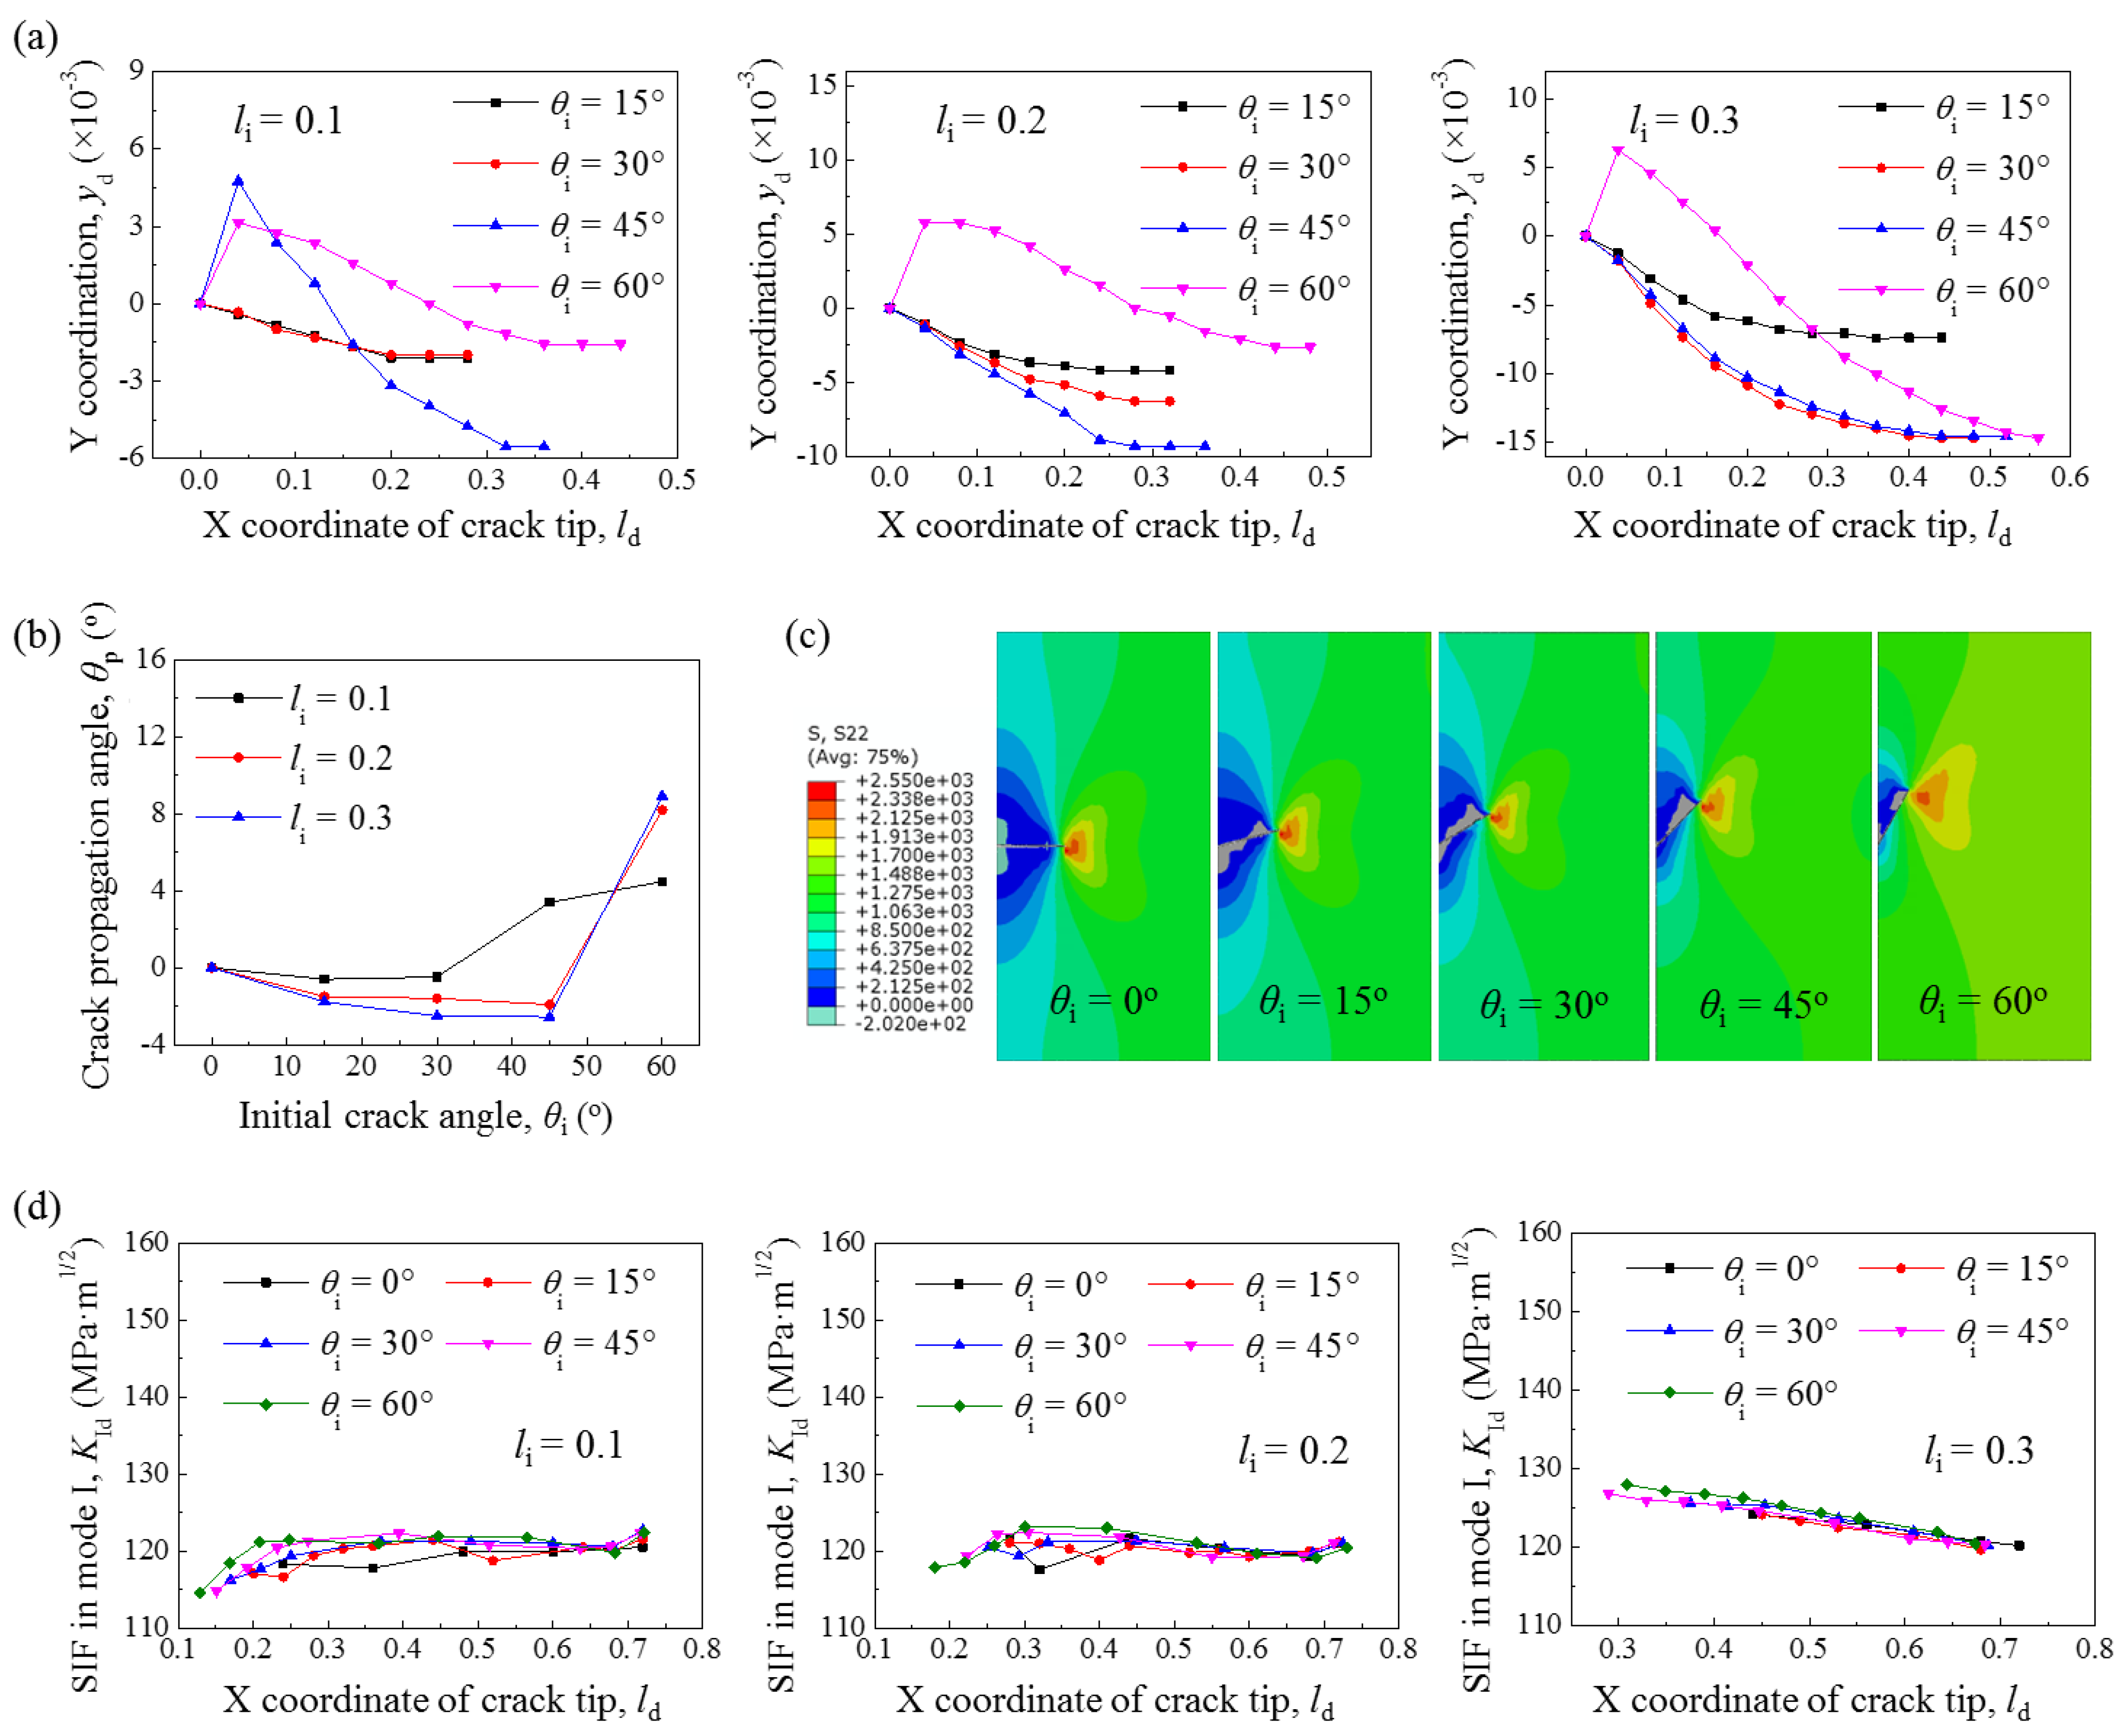
4.3. Influence of Initial Crack Angle

In the FE model with different initial crack angles, the locations of all cracks tip experience an exponential decline and finally stay steady at a certain value (Figure 10a). The crack inclines inward gradually with the initial angle, while after reaching its lowest point, the inward crack propagation angle starts to increase and finally changes to an outward angle (Figure 10b). The combination of the change of the X and Y coordinates of the initial crack tip and the stress field in the plate model dominate the crack path, further evidenced by stress contour change (Figure 10c) with the initial crack angle ranging from 0° to 60° when li = 0.3. In general, KId of different initial crack angles is seldom influenced by the initial angle since the stress field does not change much (Figure 10d).

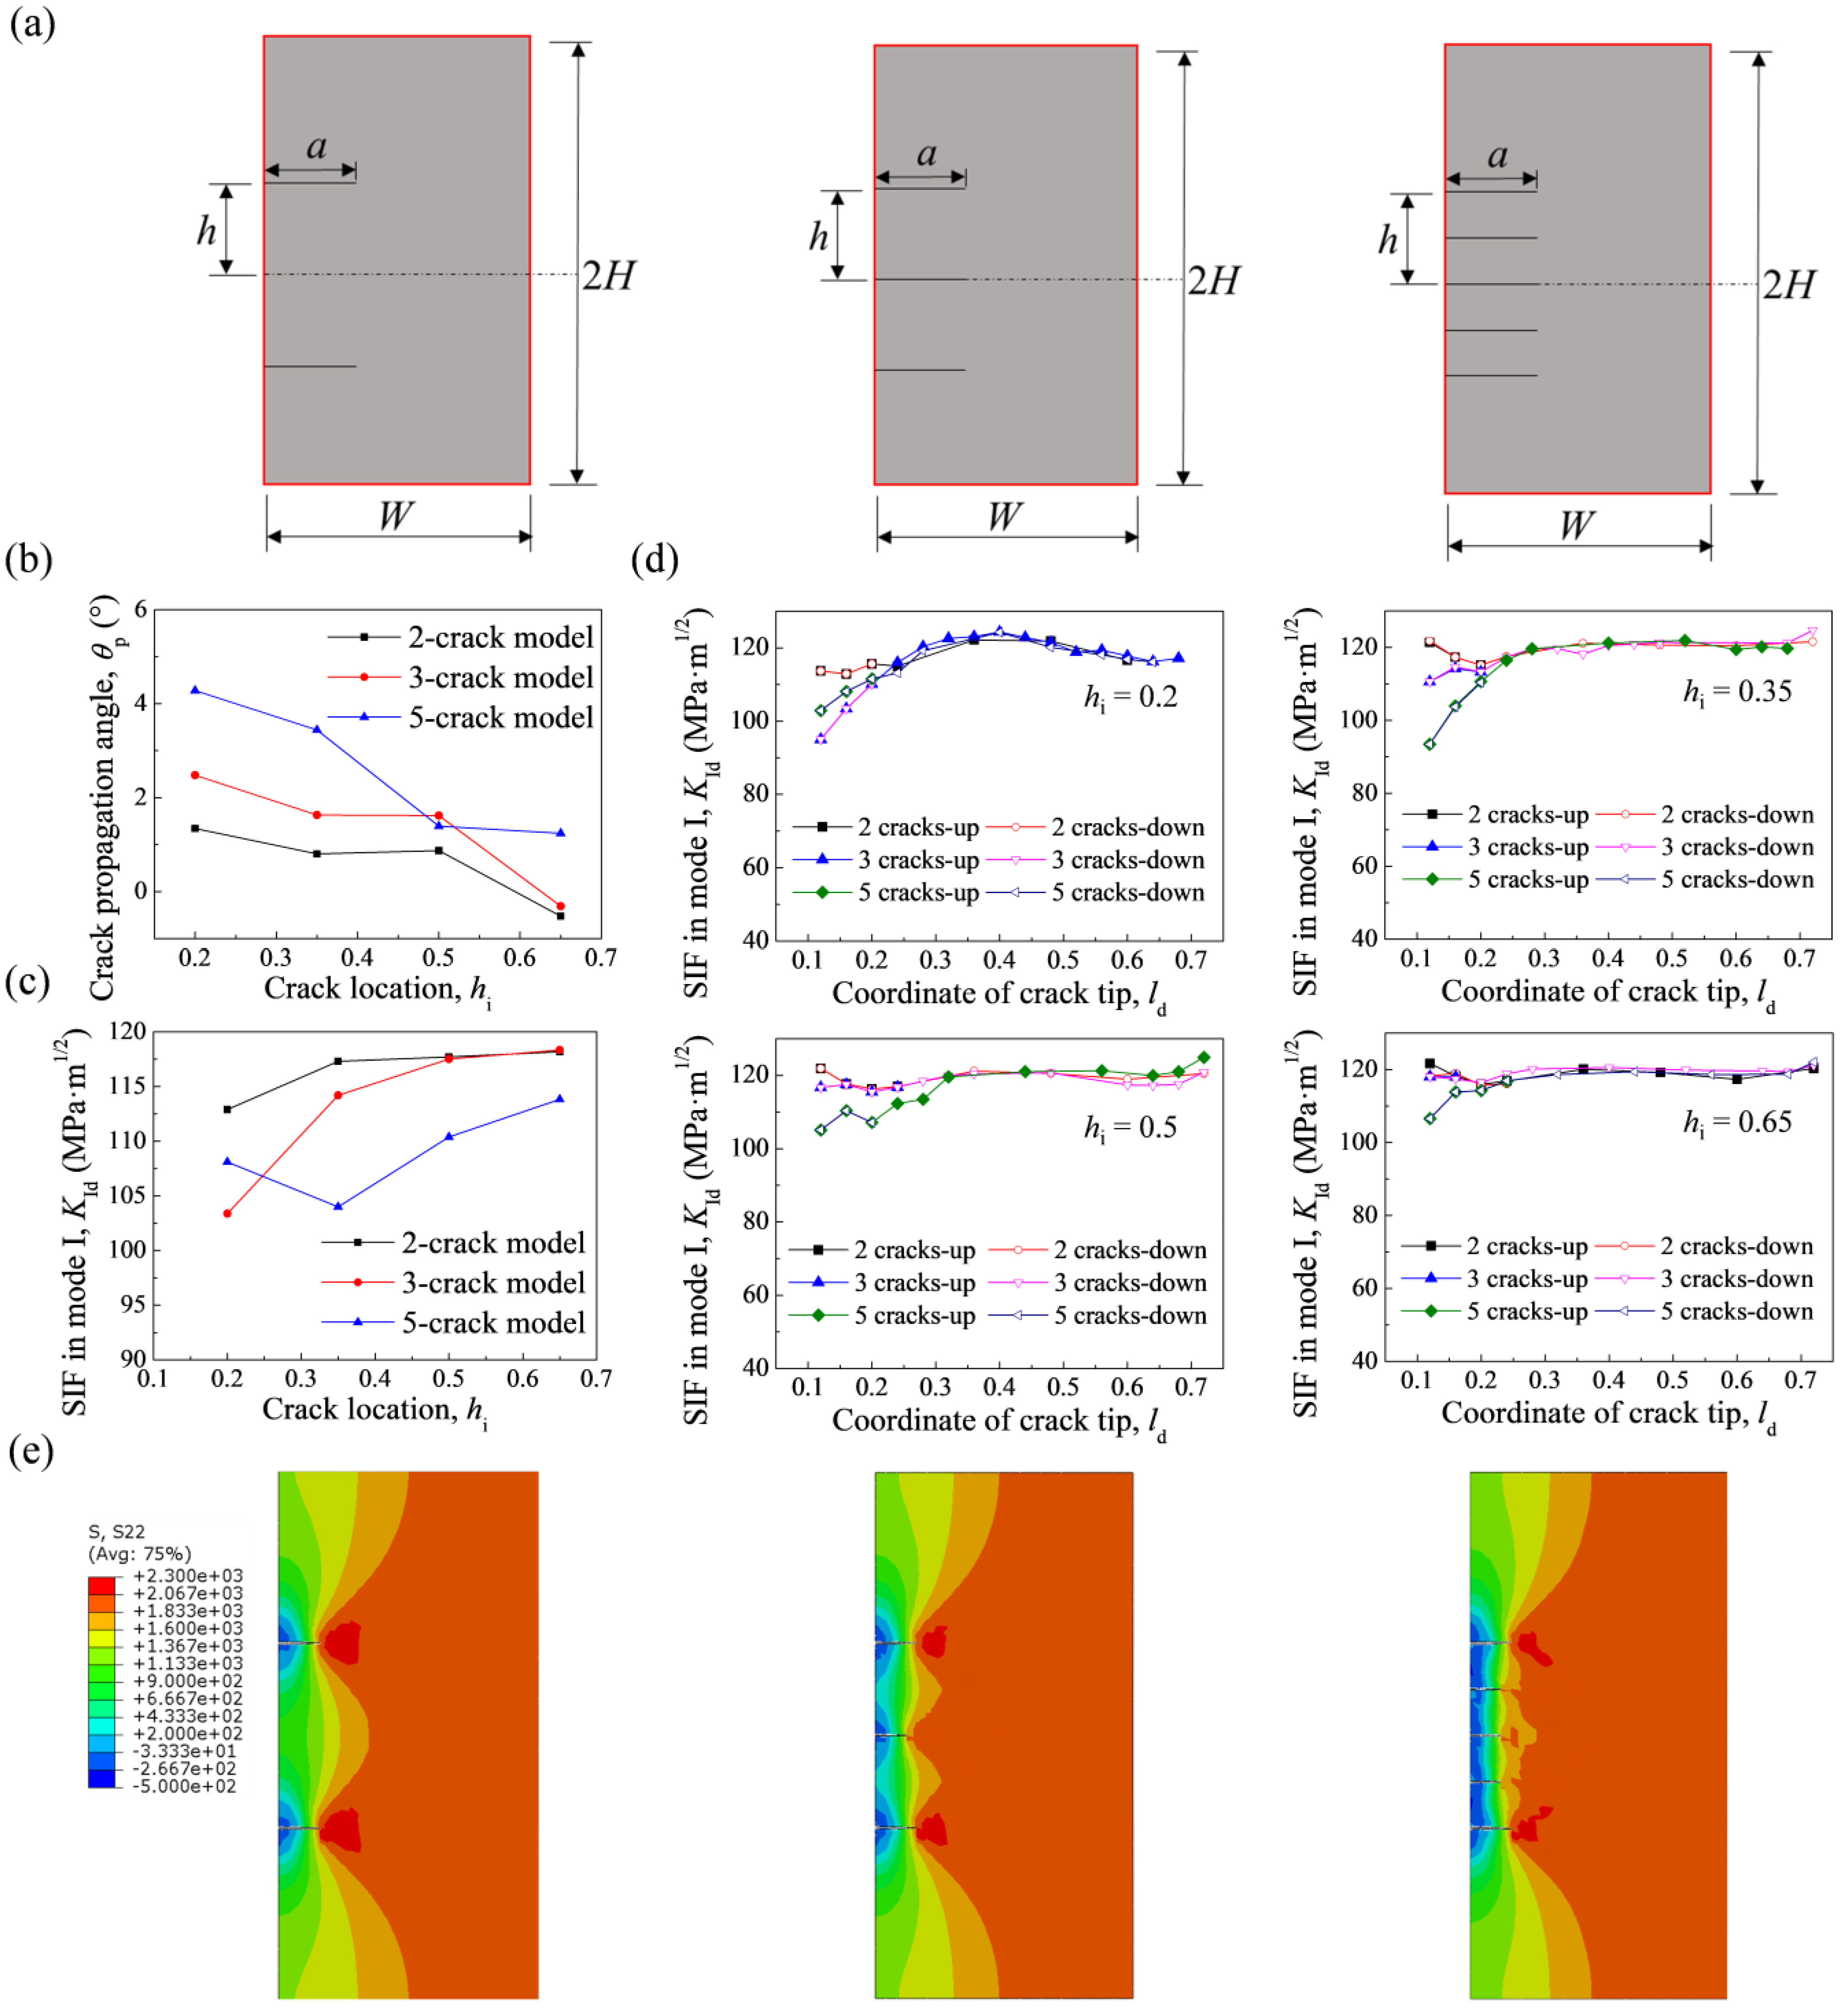
4.4. Influence of Crack Number

To investigate the crack propagation behavior in AerMet 100 plate model, models with two cracks, three cracks or five cracks are established (Figure 11a). Cracks distribute systematically about the middle line of the model. The initial crack length li = 0.1 for all models, and the outer crack location hi ranges from 0.2 to 0.65. The crack propagation angle increases with the number of cracks at each hi (Figure 11b). The KIds in two outer cracks in all models, namely the upper and the lower, are calculated and compared to figure out the influence of the crack number (Figure 11c). As KIds in the upper and lower cracks stay nearly the same; for a brief comparison, the second points in all lines are selected out. Generally, when the crack tip propagates to the same location, the KId in the model with fewer cracks expresses a higher value (Figure 11d). Both the effects on the crack propagation angle and the KId can be explained through the change of stress contours (Figure 11e) when the crack tip propagates to 0.16 at crack location 0.35. The stress distribution exhibits a more severe asymmetry in front of the upper and the lower cracks, leading to a bigger crack propagation angle. On the other hand, the high-stress region shows an obvious decrease as the crack number increases, which contributes to the declination of KId.

5. Conclusions

The crack propagation behavior of AerMet 100 plays a critical role in the engineering application of the material in heavy load-bearing structures and mechanical parts, and single-crack problems, with or without inclination, and multi-crack problems are constant threats in practical engineering. In this paper, a 1/2 model of AerMet 100 plate with in-plane crack was established, and its typical crack propagation behavior was obtained through XFEM. Correspondingly, the physical variables were summarized and extracted based on the suggested extrapolation method. Then, the crack propagation behaviors in the AerMet 100 plate model with varied initial crack lengths, locations, angles, and numbers were investigated. Some conclusions about the research content of this paper were obtained:
  • The crack propagation angle showed a significant increasing trend when the initial crack length and the initial crack location increased, which could be attributed to the asymmetry of the stress contour in front of the crack tip.
  • The initial crack length had little influence on KId, while KId exhibited a smaller value as the crack location increased casing the declined of the stress level.
  • The inward crack propagation angle slowly increased and finally turned into an outward angle until the initial crack angle reached about 45°, while KId rarely changed.
  • More cracks in the model would enhance the deflection in the propagation process and lead to a smaller KId value in the crack tip.
The results may lay a solid foundation for the study of the crack propagation behavior of AerMet 100, subject to mechanical loadings, and enable theoretical predictions for the mode I cracking behaviors of the AerMet 100 plate.

Author Contributions

Conceptualization, K.M.; methodology, K.M.; software, K.M.; validation, D.H. and H.Z.; resources, D.H.; data curation, H.Z.; writing—original draft preparation, K.M. and H.Z.; writing—review and editing, H.Z.; visualization, H.Z.; supervision, D.H.; funding acquisition, D.H. All authors have read and agreed to the published version of the manuscript.

Funding

This work is supported by the National Natural Science Foundation of China (Grant No. 11872100 and 52075020) and Defense Industrial Technology Development Program (No. JCKY2021601B021).

Data Availability Statement

The data presented in this study are available on request from the corresponding author.

Conflicts of Interest

The authors declare no conflict of interest.

Nomenclature

KICCritical stress intensity factor for opening mode
GICCritical fracture energy for opening mode
EAEnergy absorption
SIFStress intensity factor
EYoung’s modulus
μPoisson ratio
σeYield strength
σuUltimate strength
ρMass density
ηBreaking elongation
WWidth of the model
HHalf of the model height
aInitial crack length
hDistance between the crack and the middle line of the plate
liDimensionless initial crack length
hiDimensionless crack location
ldDimensionless crack location in X coordinate
ydCrack location in Y coordinate
θ p Crack propagation angle
θ i Initial crack angle
KIdDynamic stress intensity factor for opening mode
KIIdDynamic stress intensity factor for in-plane shearing mode
KIIIdDynamic stress intensity factor for anti-plane shearing mode
σ 22 /S22Stress component normal to the crack propagation direction
σ 12 /S12Stress component locally perpendicular to the crack edge
σ 23 /S23Stress component tangent to the crack edge
rthe distance of points to the crack tip
dcDimensionless distance to the crack tip
FQThe peak reaction force in the three-bending test

References

  1. Wang, C.; Gao, Y.; Li, Y.; Han, S.; Liu, S.; Zhang, P. Effects of solid-solution temperature on microstructure and mechanical properties of a novel 2000 MPa grade ultra-high-strength steel. J. Iron Steel Res. Int. 2020, 27, 710–718. [Google Scholar] [CrossRef]
  2. Gibbons, S.; Abrahams, R.; Vaughan, M.; Barber, R.; Harris, R.; Arroyave, R.; Karaman, I. Microstructural refinement in an ultra-high strength martensitic steel via equal channel angular pressing. Mater. Sci. Eng. A 2018, 725, 57–64. [Google Scholar] [CrossRef]
  3. Oehlert, A.; Atrens, A. Stress corrosion crack propagation in AerMet 100. J. Mater. Sci. 1998, 33, 775–781. [Google Scholar] [CrossRef]
  4. Zhong, J.; Yu, M.; Li, S.; Macdonald, D.D.; Xiao, B.; Liu, J. Theoretical and experimental studies of passivity breakdown of Aermet 100 ultra-high stainless steel in chloride ion medium. Mater. Corros. 2019, 70, 2020–2032. [Google Scholar] [CrossRef]
  5. Shi, X.; Zeng, W.; Zhao, Q.; Peng, W.; Kang, C. Study on the microstructure and mechanical properties of Aermet 100 steel at the tempering temperature around 482 °C. J. Alloys Compd. 2016, 679, 184–190. [Google Scholar] [CrossRef]
  6. Wei, R.; Benn, R.C.; Cooper, C.V. High Intensity plasma ion nitriding of AerMet 100 martensitic steel. Plasma Process. Polym. 2007, 4, S700–S706. [Google Scholar] [CrossRef]
  7. Manigandan, K.; Srivatsan, T.S.; Tammana, D.; Poorganji, B.; Vasudevan, V.K. Influence of microstructure on strain-controlled fatigue and fracture behavior of ultra high strength alloy steel AerMet 100. Mater. Sci. Eng. A 2014, 601, 29–39. [Google Scholar] [CrossRef]
  8. Hu, D.Y.; Meng, K.P.; Jiang, H.L.; Xu, J.; Liu, R.R. Strain rate dependent constitutive behavior investigation of AerMet 100 steel. Mater. Des. 2015, 87, 759–772. [Google Scholar] [CrossRef]
  9. Lu, T.; Li, Y.; Zhao, H.; Wang, C.; Han, S. Dynamic constitutive behavior investigation of a novel low alloy ultra-high strength steel. Mater. Res. Express 2021, 8, 016508. [Google Scholar] [CrossRef]
  10. Sun, X.; Yao, P.; Qu, S.; Yu, S.; Zhang, X.; Wang, W.; Huang, C.; Chu, D. Material properties and machining characteristics under high strain rate in ultra-precision and ultra-high-speed machining process: A review. Int. J. Adv. Manuf. Technol. 2022, 120, 7011–7042. [Google Scholar] [CrossRef]
  11. Hirobe, S.; Imakita, K.; Aizawa, H.; Kato, Y.; Urata, S.; Oguni, K. Simulation of catastrophic failure in a residual stress field. Phys. Rev. Lett. 2021, 127, 064301. [Google Scholar] [CrossRef] [PubMed]
  12. Mao, L.; Wang, W.; Liu, Z.; Yang, G.; Song, C.; Qu, S. Research on causes of fatigue cracking in the motor hangers of high-speed trains induced by current fluctuation. Eng. Fail. Anal. 2021, 127, 105508. [Google Scholar] [CrossRef]
  13. Wen, M.; Sun, Y.; Yu, J.; Yang, S.; Hou, X.; Yang, Y.; Sun, X.; Zhou, Y. Amelioration of weld-crack resistance of the M951 superalloy by engineering grain boundaries. J. Mater. Sci. Technol. 2021, 78, 260–267. [Google Scholar] [CrossRef]
  14. Liu, Y.; Cong, P.; Wu, Y.; Li, J.; Wang, X. Failure analysis and design optimization of shrouded fan blade. Eng. Fail. Anal. 2021, 122, 105208. [Google Scholar] [CrossRef]
  15. Hu, L.; Wang, Y.; Feng, P.; Wang, H.; Qiang, H. Debonding development in cracked steel plates strengthened by CFRP laminates under fatigue loading: Experimental and boundary element method analysis. Thin-Walled Struct. 2021, 166, 108038. [Google Scholar] [CrossRef]
  16. Thiyahuddin, M.; Gu, Y.; Gover, R.; Thambiratnam, D. Fluid–structure interaction analysis of full scale vehicle-barrier impact using coupled SPH–FEA. Eng. Anal. Bound. Elem. 2014, 42, 26–36. [Google Scholar] [CrossRef]
  17. Jena, J.; Singh, S.; Gaur, V.; Singh, I.V.; Natarajan, S. A new framework based on XFEM for cracked semipermeable piezoelectric material. Eng. Fract. Mech. 2021, 253, 107874. [Google Scholar] [CrossRef]
  18. Xiao, G.; Wen, L.; Tian, R. Arbitrary 3D crack propagation with Improved XFEM: Accurate and efficient crack geometries. Comput. Methods Appl. Mech. Eng. 2021, 377, 113659. [Google Scholar] [CrossRef]
  19. Muixí, A.; Marco, O.; Rodríguez-Ferran, A.; Fernández-Méndez, S. A combined XFEM phase-field computational model for crack growth without remeshing. Comput. Mech. 2021, 67, 231–249. [Google Scholar] [CrossRef]
  20. Nikfam, M.; Zeinoddini, M.; Aghebati, F.; Arghaei, A. Experimental and XFEM modelling of high cycle fatigue crack growth in steel welded T-joints. Int. J. Mech. Sci. 2019, 153, 178–193. [Google Scholar] [CrossRef]
  21. Gee, B.; Parchei-Esfahani, M.; Gracie, R. XFEM simulation of a mixed-mode fracture experiment in PMMA. Eng. Fract. Mech. 2020, 229, 106945. [Google Scholar] [CrossRef]
  22. Yadav, R.N.; Uniyal, P.; Sihota, P.; Kumar, S.; Dhiman, V.; Goni, V.G.; Sahni, D.; Bhadada, S.K.; Kumar, N. Effect of ageing on microstructure and fracture behavior of cortical bone as determined by experiment and Extended Finite Element Method (XFEM). Med. Eng. Phys. 2021, 93, 100–112. [Google Scholar] [CrossRef] [PubMed]
  23. Kamaya, M. Estimation of elastic–plastic fracture toughness by numerical simulation based on a stress-based criterion for ductile crack initiation. Int. J. Press. Vessels Pip. 2014, 117, 2–8. [Google Scholar] [CrossRef]
  24. Safdar, A.; Alizada, A.; Fries, T.-P. Model-independent approaches for the XFEM in fracture mechanics. Int. J. Numer. Methods Eng. 2010, 1, 0–10. [Google Scholar]
  25. Rezanezhad, M.; Lajevardi, S.A.; Karimpouli, S. Crack growth in porous media using XFEM: Comparison of modeling strategies on the abaqus. J. Anal. Numer. Methods Min. Eng. 2020, 10, 27–40. [Google Scholar]
  26. Sutula, D.; Kerfriden, P.; Van Dam, T.; Bordas, S.P. Minimum energy multiple crack propagation. Part-II: Discrete solution with XFEM. Eng. Fract. Mech. 2018, 191, 225–256. [Google Scholar] [CrossRef]
  27. Lal, A.; Mishra, K. Stochastic MMSIF of multiple edge cracks FGMs plates subjected to combined loading using XFEM. Curved Layer Struct. 2020, 7, 35–47. [Google Scholar] [CrossRef]
  28. ASTM. Standard test method for measurement of fracture toughness. In Annual Book of ASTM Standards; ASTM International (ASTM): Philadelphia, PA, USA, 2006. [Google Scholar]
  29. Burlayenko, V.N.; Altenbach, H.; Sadowski, T.; Dimitrova, S.D. Computational simulations of thermal shock cracking by the virtual crack closure technique in a functionally graded plate. Comput. Mater. Sci. 2016, 116, 11–21. [Google Scholar] [CrossRef]
  30. Fernandez Martinez, R.; Lostado Lorza, R.; Santos Delgado, A.A.; Piedra Pullaguari, N.O. Optimizing presetting attributes by softcomputing techniques to improve tapered roller bearings working conditions. Adv. Eng. Softw. 2018, 123, 13–24. [Google Scholar] [CrossRef]
  31. Iniguez-Macedo, S.; Lostado-Lorza, R.; Escribano-Garcia, R.; Martinez-Calvo, M.A. Finite element model updating combined with multi-response optimization for hyper-elastic materials characterization. Materials 2019, 12, 1019. [Google Scholar] [CrossRef]
  32. Lostado Lorza, R.; Escribano García, R.; Fernandez Martinez, R.; Martínez Calvo, M. Using genetic algorithms with multi-objective optimization to adjust finite element models of welded joints. Metals 2018, 8, 230. [Google Scholar] [CrossRef]
  33. Tada, H.; Paris, P.C.; Irwin, G.R. The Analysis of Cracks Handbook; ASME Press: New York, NY, USA, 2000. [Google Scholar]
  34. Zhu, X.K.; Leis, B.N. Effective methods to determine stress intensity factors for 2D and 3D cracks. In Proceedings of the 2014 10th International Pipeline Conference, Calgary, AB, Canada, 29 September–3 October 2014. [Google Scholar]
  35. Han, Q.; Wang, Y.; Yin, Y.; Wang, D. Determination of stress intensity factor for mode I fatigue crack based on finite element analysis. Eng. Fract. Mech. 2015, 138, 118–126. [Google Scholar] [CrossRef]
Figure 1. (a) Microstructure of AerMet 100 steel under optical microscope; (b) Fractography of AerMet 100 steel at magnification rates of 1000 under quasi-static tensile.
Metals 12 01650 g001
Figure 2. (a) Three-point bending test setups; (b) Comparison of the reaction force versus crack opening displacement between experiment and simulation.
Metals 12 01650 g002
Figure 3. (a) Model with in-plane crack and boundary condition; (b) Calculation method of crack propagation angle; (c) Calculation method of SIF based on the extrapolation method.
Metals 12 01650 g003
Figure 4. Comparison of (a) SIFs, (b) stress contours when the crack propagates to 0.4 with the initial crack length 0.1.
Metals 12 01650 g004
Figure 5. (a) Crack propagation path; (b) KId in the propagation process for an in-plane model when the initial crack length is 0.1 and the crack location is 0.5; (c) S22 stress contours in the crack propagation process; (d) Comparison of stress contours in three orientations when the crack propagates to 0.4.
Metals 12 01650 g005
Figure 6. (a) Crack propagation path; (b) KId in the propagation process; (c) S22 stress contours in the crack propagation process (d) Comparison of stress contours in three orientations when the crack propagates to 0.4 for an in-plane model with an initial angle 30° and initial length 0.1.
Metals 12 01650 g006
Figure 7. (a) Crack propagation path; (b) KId in the propagation process for a 2-crack model with an initial length 0.1; (c) S22 stress contours in the crack propagation process; (d) Comparison of stress contours in three orientations when the crack propagates to 0.4.
Metals 12 01650 g007
Figure 8. Comparison of (a) crack propagation angles when the initial crack lengths range from 0.1 to 0.3 and (b) stress contours with initial crack length 0.3; Comparison of (c) KId and (d) stress contours when the initial crack lengths range from 0.04 to 0.2 at 0 crack location.
Metals 12 01650 g008
Figure 9. Comparison of (a) crack propagation angles when the crack locations range from 0 to 0.8 and (b) stress contours with initial crack length 0.3; (c) Comparison of KId at the initial crack locations ranging from 0 to 0.8 and the initial crack lengths ranging from 0.1 to 0.3.
Metals 12 01650 g009
Figure 10. (a) Comparison of crack paths when the initial crack angle ranges from 15° to 60° with the initial crack lengths 0.1, 0.2 and 0.3. (b) Comparison of crack propagation angles when the initial crack angle ranges from 0° to 60°. (c) Comparison of stress contours when the crack with ld = 0.1 starts to propagate with the initial crack angles ranging from 0° to 60° and (d) KId with initial crack lengths ranging from 0.1 to 0.3.
Metals 12 01650 g010
Figure 11. (a) Model with multi pre-cracks in an AerMet 100 plate 2-crack model, 3-crack model and 5-crack model; (b) Comparison of crack propagation angles in models with 2, 3 and 5 cracks; (c) Comparison of KId in the crack propagation process and (d) KId in the selected points when the initial crack number increase from 2 to 5 with the crack locations ranging from 0.2 to 0.65; (e) Comparison of stress contours when the crack with crack length 0.1 and crack location 0.35 propagates to 0.16 in 2-crack model, 3-crack model and 5-crack model.
Metals 12 01650 g011
Table 1. A summary of basic mechanical properties of AerMet 100 steel.
Material Parameter Young’s Modulus,
E (GPa)
Yield Strength,
σe (MPa)
Ultimate Strength,
σu (MPa)
Density, ρ (kg/m3)Poisson’s Ratio,
μ
Elongation, η
Value187.201724.511986.97.8 × 1030.350.166
Table 2. The value of material constants in Johnson-Cook model.
Material ParametersABnC ε ˙ 0 (s−1)
Value1724.5190.920.0020.0180.001
Table 3. Comparison of the calculation results for four different methods.
Method1234Computation Formula
Result Value (MPa·m1/2)114.41141.1672.39121.77123.5
Publisher’s Note: MDPI stays neutral with regard to jurisdictional claims in published maps and institutional affiliations.

