Article

Study on Hot Deformation Behavior and Texture Evolution of Aluminum Alloy 7075 Based on Visco-Plastic Self-Consistent Model

1
School of Mechanical and Automotive Engineering, Shanghai University of Engineering Science, Shanghai 201620, China
2
School of Mechanical Engineering, Georgia Institute of Technology, North Ave NW, Atlanta, GA 30332, USA
*
Author to whom correspondence should be addressed.
Metals 2022, 12(10), 1648; https://doi.org/10.3390/met12101648
Submission received: 14 September 2022 / Revised: 23 September 2022 / Accepted: 25 September 2022 / Published: 30 September 2022
(This article belongs to the Section Metal Casting, Forming and Heat Treatment)

Abstract

:
In this paper, the VPSC (visco-plastic self-consistent) model was improved by considering the effect of heating rate. The hot compression deformation behavior and texture evolution of AA7075 were studied based on the improved VPSC model and EBSD (electron back-scattering diffraction). The stress–strain curves, inverse pole figure (IPF), and orientation distribution function (ODF) of the material were analyzed by combining TSL-OIM-Analysis, MTEX, and other analysis software. By observing the changes in grain structure and micro-texture of the material before and after hot compression deformation, the influence of macro-deformation conditions on the microstructure evolution of the material was studied, and the evolution law of grain structure and micro-texture was analyzed. It was found that the hot deformation parameters have significant effects on the stress–strain curve characteristics and micro-texture evolution of AA7075 during hot deformation. Copper {112} <111> and {011} <1 1 ¯ 1> are the main textures, and the strength and distribution of typical textures such as Copper {112} <111>, Cube {001} <100>, and Goss {011} <100> show regularity with the change in deformation conditions. Through comparing the predicted results of the improved VPSC model and experimental data, it is distinct that the improved VPSC model is suitable to predict the micro-texture evolution of AA7075 during hot compression. Finally, the sensitivity of micro-texture evolution to hot compression parameters such as heating rate was analyzed.

1. Introduction

In recent years, the prediction and control of the microstructure and properties of metals during deformation have been an important research direction in the field of materials science around the world, based on the study of the evolution of metal deformation texture [1,2,3,4,5]. As a typical high-strength superhard aluminum alloy of the Al-Zn-Mg-Cu series, AA7075 has a strength of 500~700 MPa. It has the advantages of low density, high strength, high fracture toughness, and good processability. Nowadays, AA7075 can replace traditional steel materials in automobiles, high-speed trains, and aerospace.
A number of researchers have focused on the metal deformation process and used various models to analyze the evolution of the microstructure of materials qualitatively. Bunge [6] points out that the texture distribution of the material affects 20 to 50% of the material properties. Therefore, the study of texture distribution and evolution during thermal deformation is crucial for analyzing the mechanism of the microstructure evolution of materials. Crystal plasticity models show a competitive advantage in predicting the extrusion texture of aluminum alloys. The theory of crystal plasticity is based on the materials’ macroscopic deformation behavior and micro-texture parameters. It takes the dislocation mechanism of crystal deformation as the starting point to describe the elastoplastic deformation process of materials from the essence of physics. The study of the plastic deformation of materials at the grain level is an essential theory for the simulation of the plastic deformation behavior of materials at the micro level.
Surya et al. [7] studied the texture evolution of the face-centered cubic metal OFHC Copper during simple deformation using the improved Taylor model and realized the elastic-visco-plastic constitutive single crystal model in the finite element framework. It is found that there are some differences between the simulation results and the experimental results because the Taylor model itself does not consider the grain interaction in the material. Kumar et al. [8] studied the effects of strain rate on the yield strength and flow stress of aluminum alloy 5754 under uniaxial (tension and compression) and simple shear loading and used the VPSC model to simulate the evolution of the initial fabric composition of aluminum alloy 5754 during uniaxial tension and simple shear loading. The results show that the VPSC model can adequately simulate the deformation of aluminum alloy 5754 under simple loading. However, the author does not further consider the influence of factors such as the amount of deformation and deformation temperature in the loading process. Guo [9] predicted the significant deformation behavior of OFHC copper, 316 austenitic stainless steel, and AZ31 magnesium alloy under different loading modes based on the E-VPSC (elastic-viscoplastic self-consistent) model and analyzed the texture evolution using different linearization models and strain hardening parameters. The results show that the Secant, Tangent, Affine, and Meff linearization models can better predict the significant deformation behavior of FCC materials.
Currently, research on the hot deformation behavior of aluminum alloys focuses mainly on the constitutive equation and micro-texture after hot deformation. To our knowledge, there are few studies on the texture development process and prediction by the VPSC model. Raja [10] has studied the isothermal compression deformation behavior of Al-7068 alloy in the T6 state. The results show that the microstructure evolution during hot compression is carried out through the CDRX mechanism. The analysis of transmission electron microscopy confirmed that the precipitates became coarsening with the increase in processing temperature and the decrease in deformation rate. Yuan [11] investigated the influence of hot extrusion temperature on the mechanical properties and micro-texture evolution of aluminum alloy 1060 based on the VPSC model. The results show that the micro-texture has a more significant influence on the anisotropy of mechanical properties under the condition of high-temperature hot extrusion. Dong [12] investigated the effects of deformation before compression in different directions and degrees on the anisotropic mechanical properties of 6061 aluminum alloy sheets based on the VPSC model. The authors found that the primary deformation mechanism of aluminum alloy in the plastic deformation phase is slip, and the texture gradually evolves from Cube texture to rotational Cube texture with increasing deformation. Fan [13] established the VPSC model for 6014 aluminum alloy based on the texture and mechanical properties data. The effects of tensile deformation on the mechanical properties and R-value of 6014 aluminum alloy under different conditions were investigated. The results show that the VPSC model can reasonably predict the texture of aluminum alloy 6014 under different deformation conditions and that the Cube texture significantly affects the R-value in different directions. However, the effects of heating rate and the amount of deformation on the micro-texture evolution of materials after hot compression have not been taken into account in the above studies.
This paper improved the VPSC model by considering the heating rate. Furthermore, the micro-texture evolution of AA7075 under different hot compression conditions was predicted based on the improved VPSC model. While the orthogonal experiments considering the hot compression parameters such as heating rate and the amount of deformation were conducted. The hot deformation behavior and microstructure evolution of AA7075 during hot compression deformation were studied by means of microstructure observed by EBSD and stress–strain curve measured by hot compression experiment. Then, the improved VPSC model was validated. Finally, the sensitivity of the micro-texture evolution of AA7075 to hot compression deformation parameters was analyzed.

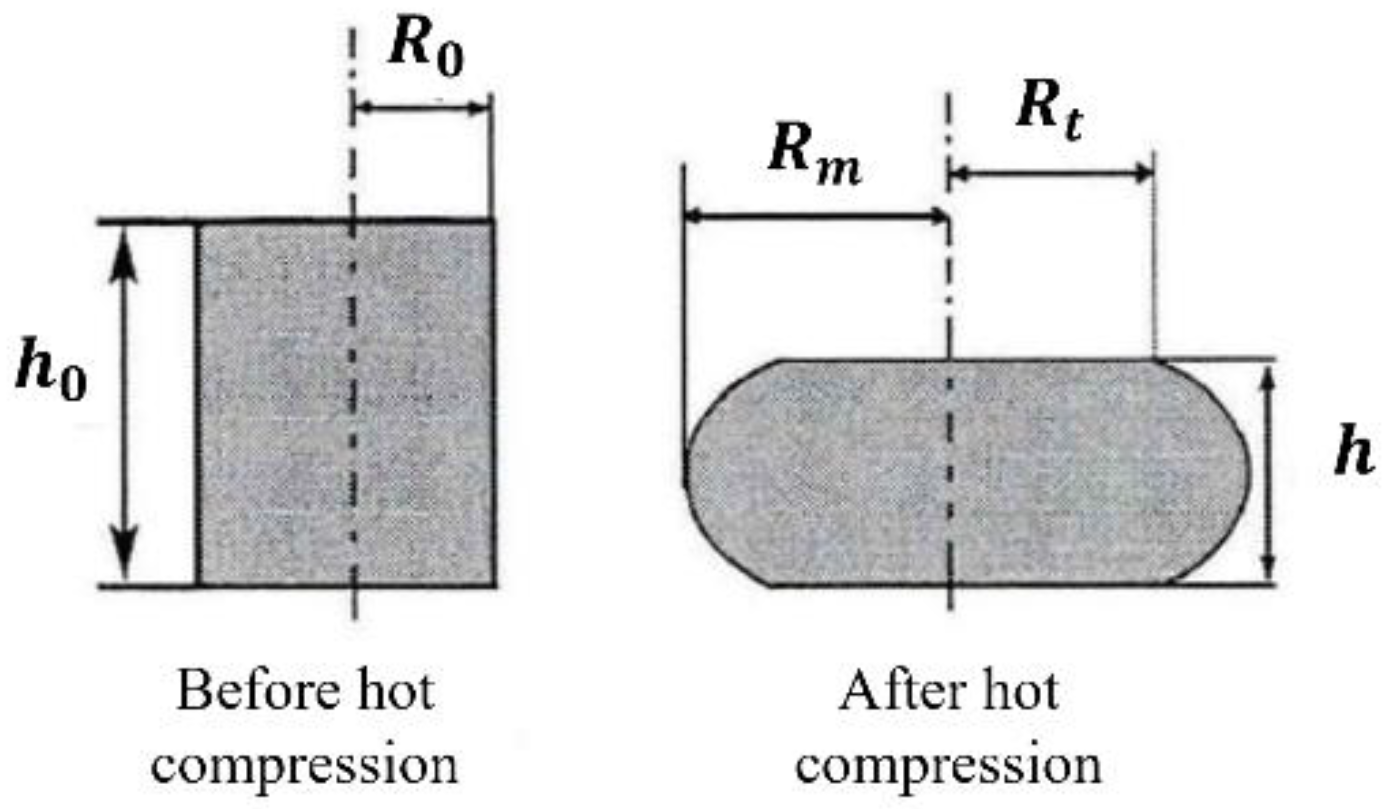
2. Materials and Methods

The AA7075 used in this study is a tensile bar, its chemical composition is shown in Table 1, and the sample with the size of φ 8 × 12   mm is made by wire cutting. In order to improve the inhomogeneity of the AA7075 tensile bar, it is necessary to homogenize the material. The homogenization temperature is 460 °C, holding time is 24 h, and the homogenized microstructure is retained by water quenching.
The Gleeble-3800 thermal simulation testing machine (DSI, St. Paul, MN, USA) performed the isothermal hot compression test. During hot compression, the contact surface between the two ends of the sample and the indenter was coated with a lubricant and a graphite plate to reduce the influence of friction on the test results. At the same time, thermocouples were welded to the center of the sample to measure the temperature, as shown in Figure 1. The Gleeble-3800 thermal simulator automatically collects the stress, strain, and temperature data.
In the hot compression experiment, lubricants and graphite plates are used to minimize the influence of friction, but the influence of friction on the deformation of the sample cannot be eliminated in the actual compression process. The friction force causes the sample to deform unevenly during hot compression, and the cylindrical sample is usually a drum-shaped cylinder with a larger diameter after hot compression, as shown in Figure 2.
The acquired displacement data are modified and combined with Equation (1) to calculate the actual stress and strain of the sample.
σ = σ 0 C 2 2 exp C C 1 ε = ln h h 0 C = 2 m R 0 h 0 h h  
Here, σ 0 and σ represent the stress before correction and the actual stress after correction, ε represents the actual strain, and C represents the friction correction coefficient. The physical meaning of h ,   h 0 ,   R 0 ,   R m ,   and   R t is shown in Figure 2. The scheme for the hot compression experiment provides an orthogonal experiment with four factors and three levels. The individual factors and the levels are listed in Table 2.
In order to investigate the evolution of micro-texture after a hot compression experiment, EBSD samples of AA7075 were prepared after mechanical. In mechanical polishing, the sample surface is polished with 120 μ m sandpaper, 3 μ m , and 0.3 μ m polishing cloth until several shallow scratches are formed. EBSD analysis is based on the Kikuchi band. The electron beam is emitted onto the sample with the scanning electron microscope and diffracted at the lattice plane of the irradiated crystal or grain. By analyzing the diffraction pattern with TSL-OIM7 software, the grain size and crystal orientation in the specified region can be determined. The basic principle is shown in Figure 3. In the analysis, we use the MTEX toolbox in MATLAB to display the EBSD data to process the texture information and finally compare it with the results predicted by the improved VPSC model.

3. VPSC Model with Considering Heating Rate

The polycrystalline plastic mode is the key for the investigation of the plastic deformation behavior of materials. Benefiting from nearly a century of development, the visco-plastic constitutive model of single crystal has a systematic theoretical basis [14,15,16]. Due to the influence of different grain orientations and grain boundaries in the plastic deformation process of polycrystalline metal materials, the degree of freedom of boundaries in the deformation process is extremely high, and the plastic deformation of any grain in the polycrystalline structure is the result of the interaction of all grains. Therefore, it is complicated to describe the plastic deformation behavior of polycrystalline materials based on the visco-plastic constitutive relationship of the single crystal. Scholars have proposed several plastic models for polycrystals using various simplified methods based on the theory of single crystal plasticity to better study the plastic deformation process of polycrystalline materials. The most representative of these models are the Taylor model [17], the Sachs model, the self-consistent visco-plastic model [18], and the elastic-plastic self-consistent model [19]. The Taylor and Sachs models do not consider the internal relationships between the grains and therefore have significant limitations. In this work, the self-consistent visco-plastic model is used for the analysis. The VPSC was first proposed by Kroner [20]. Hill [21] proposed the Hill model by improving the existing polycrystalline model. Although the model is based on the visco-plastic polycrystal theory of large deformation and is limited by the loading conditions, the Hill model provides a basis for numerical simulation of plastic deformation of polycrystals. Based on the Hill model, Molinari et al. [22] gradually generalize the deformation mechanisms such as twinning, dislocation, and slip. C.N. Tome and R.A. Lebensohn have extended this model so that the self-consistent visco-plastic model can be applied to the plasticity of various materials, the plasticity of multiphase metals, and the process of texture evolution can be further studied.
The improved VPSC model considers the effect of temperature rise rate. On the basis of the MTS (mechanical threshold stress) model, Fourier law and Newton cooling equation are introduced to describe the heat exchange and heat flux density in the heating process. The change of temperature field is affected by many factors, in this study, the following assumptions are made to the model: (1) First, the mode of contact between material and air is free convection. (2) Secondly, the material is regarded as isotropic in the process of heat conduction, and the density of the material, thermal expansion coefficient, and thermal conductivity do not change with temperature. (3) Finally, the heat conduction between the material and the instrument is not considered. Based on the above assumptions, the density of heat flux in heat conduction can be expressed by the following formula:
q = λ T n = λ · g r a d T q = h f T s T 0
q is the heat flux, λ is the thermal conductivity of 7075 aluminum alloy (usually 10 W / m · K ), grad T is the temperature gradient (represents the temperature change rate), h f is the heat exchange coefficient, T s is the material temperature, and T 0 is the ambient temperature (usually 25 ° C ).

3.1. Crystal Kinematics

The deformation of a single crystal can be described by the deformation gradient tensor F i j c and the velocity gradient tensor L i j c .
F i j c = x i X j L i j c = u ˙ i c x j
Here, X represents the initial coordinates of a point in the undeformed crystal, x X represents the final coordinates of a point in the deformed crystal, and u = x X X represents the displacement of the point.

3.2. Constitutive Behavior and Homogenization of Single Crystals

Nonlinear rate-sensitive equations can describe the local visco-plastic constitutive behavior of polycrystals.
ε i j x ¯ = s m i j s   γ s x ¯   = γ o   s m i j s ( m k l s   σ k l x ¯ τ o s ) n γ x ¯ s = γ 0 m k l s   σ k l x ¯ τ o s n  
In the above formula, ε i j x ¯ is the deviatoric strain-rate, γ x ¯ s is the local shear rate, γ o is the normalization factor, and n is the rate-sensitivity exponent.

3.3. Self-Consistent Equation

Each crystal is an ellipsoid embedded in an effective medium representing polycrystals. Since the properties of the medium are unknown, it is necessary to construct a polycrystal model by iterative self-consistency. In order to achieve self-consistency, the weighted average strain rate of polycrystals must be consistent with the macroscopic state, as follows: (the parentheses < > denote the average value on the particles obtained by weighting the respective volume fraction.)
E i j = ε i j r  
The local constitutive equation and self-consistent equation are as follows:
ε i j r = M i j k l r   σ k l r + ε i j o r = M i j k l r B k l m n r Σ m n + M i j k l r b k l r + ε i j o r  
M ¯ i j k l = M r : B r E i j o = M r : b r + ε o r  

3.4. Linearization Method

VPSC uses a self-consistent model to describe the relationship between grains and their surrounding media (Equation (6)). Different linearization methods can be used to solve M i j k l r and ε i j o r . There are mainly four kinds of linearization methods (Secant, Affine, Tangent, and Meff), as follows:
Secant :   M i j k l r , s e c = γ o   s m i j s m k l s τ o s ( m p q s σ p q r τ o s ) n 1 ε i j o r , s e c = 0  
Affine :   M i j k l r , a f f = m · γ o   s m i j s m k l s τ o s ( m p q s σ p q r τ o s ) n 1 ε i j o r , a f f = 1 n ε r
Tan gent :   M i j k l r , t g = m · γ o   s m i j s m k l s τ o s ( m p q s σ p q r τ o s ) n 1 ε i j o r , t g = 0
Meff :   M i j k l r , m e f f = m e f f · γ o   s m i j s m k l s τ o s ( m p q s σ p q r τ o s ) n 1 ε i j o r , t g = 0
In the Meff linearization method, the parameter m e f f is used to express the interaction strength between the grain and the medium (usually, m e f f = 10 ).
As stated earlier, different choices are possible for the linearized behavior at the grain level, the results of the self-consistent scheme depend on this choice. Guo et al. [9,23,24] have proved that different linearization methods in the VPSC model have an influence on the prediction results, and pointed out that the Secant linearization method and Tangent linearization method are better than other linearization methods. The difference caused by the linearization method is mainly reflected in the treatment of the interaction tensor, and the self-consistent results obtained by different linearization methods are different.

3.5. Voce Hardening and MTS Type Hardening

In the VPSC model, Voce law or MTS model is used to describe the effect of threshold stress τ s on deformation.
The characteristic of Voce hardening is that the threshold stress changes with the cumulative shear strain in each grain.
τ ^ s = τ o s + τ 1 s + θ 1 s Γ · 1 exp Γ θ 0 s τ 1 s  
Here, Γ = s Δ γ s is the cumulative shear in the grain; τ o is the initial critical shear stress; θ o is the initial hardening rate; θ 1 is the asymptotic hardening rate; τ o + τ 1 is the inverse extrapolated critical shear stress; the geometric significance of τ o , τ 1 ,   θ o ,   and   θ 1 is shown in Figure 4.
The MTS model is characterized by a dependence of the threshold stress with strain rate, accumulated strain, and temperature in each grain of the form. Rate and temperature effects are accounted for by τ s , given by the MTS model.
τ μ = τ a μ + S i ε ˙ , T τ i ^ μ 0 + S ε ε ˙ , T τ ε ^ μ 0  
The temperature T is expressed by the equation with the heating rate as a variable:
T = T 0 + λ · grad T h f  

4. Discussion

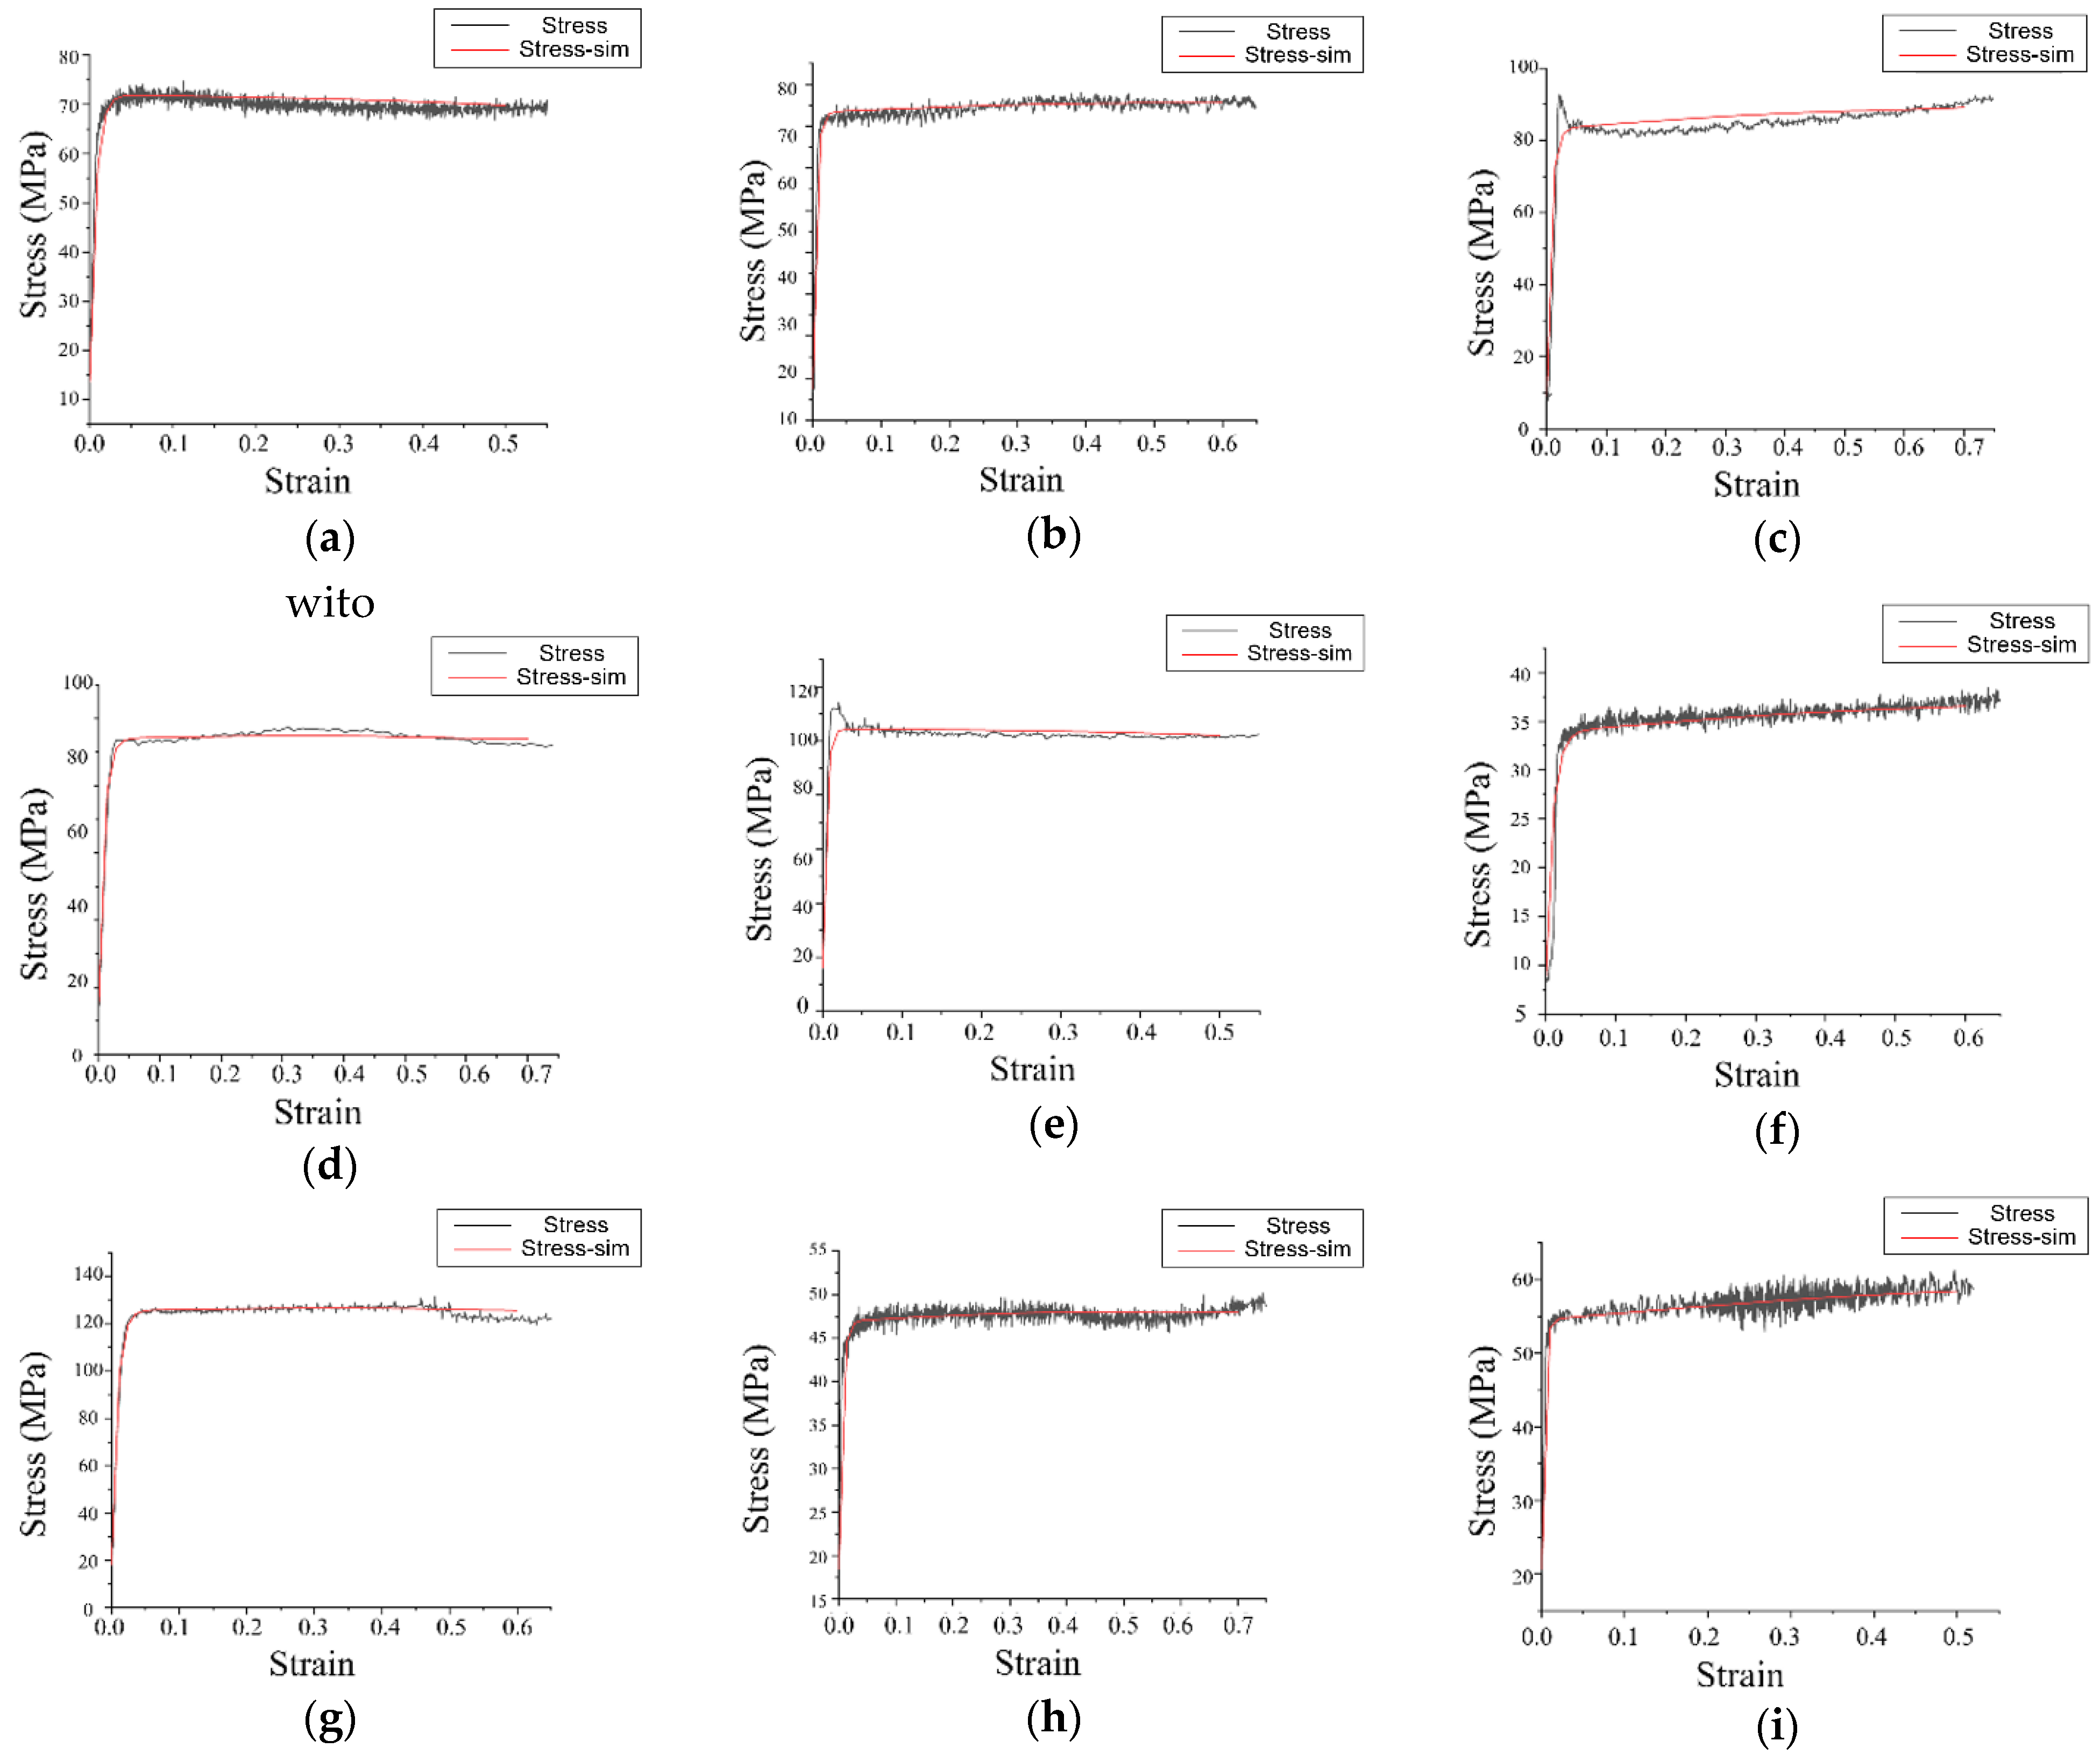
4.1. Fitting and Analysis of Stress-Strain Curve

In this study, the elastic stiffness matrix (Equation (15)) is used as the initial input parameter of the VPSC model. The VPSC model can only operate on the determined elastic stiffness matrix and does not support the operation of the elastic stiffness matrix as a variable. Moreover, at present, the exact functional expression of the elastic stiffness matrix with temperature is not clear. This part can refer to the works of Lebensohn [18] and the VPSC specification written by their team in detail. The elastic tensor matrix (Equation (15)) used in this paper was obtained by consulting the relevant literature of AA7075. The elastic tensor L of AA7075 used in this work is as follows:
L = 108.2 61.3 61.3 61.3 108.2 61.3 61.3 61.3 108.2 0 0 0 0 0 0 0 0 0 0 0 0 0 0 0 0 0 0 28.5 0 0 0 28.5 0 0 0 28.5 G P a  
AA7075 is a standard face-centered cubic (FCC) material, and its slip plane is 111 with the slip direction of 1 1 ¯ 0 . When using the VPSC program for calculation, it is necessary to take all slip systems as input parameters and specify the conditions for adding the beam in the macroscopic coordinate system of the material, usually the macroscopic stress Σ and the macroscopic strain rate D . The loading model used in this work is uniaxial compression, and the corresponding parameters are:
D = ε 11 ˙ 0 0 0 ε 22 ˙ 0 0 0 ε 33 ˙ ; Σ = 0 0 0 0 0 0 0 0 σ 33  
In the macroscopic stress, only σ 33 is unknown, and the sum of the diagonal elements of the macroscopic strain rate should be 0. In this study, different Voce hardening parameters are used to fit the stress–strain curves under different deformation conditions [9,25]. The hardening parameters of the materials used in the simulation are listed in Table 3 below.
Figure 5 shows the experimental results under different deformation conditions and the stress–strain curves simulated by VPSC, where Figure 5a–i corresponds to the experimental number (1)~(9). It is found that the improved VPSC model and the corresponding Voce hardening parameters can well fit the stress–strain curves under different deformation conditions.
At the initial stage of deformation, the stress increases rapidly to the peak value with the increase in strain, at this time, the material does not have enough driving force to dynamically recover, so work hardening plays a dominant role. As the strain continues to increase, the stress curve decreases, which indicates that the material has undergone dynamic softening and the effect of work hardening is partially offset. When the strain increases to a certain extent, the stress–strain curve is close to the horizontal line, which indicates that the material has entered the steady deformation stage, and the work hardening and dynamic softening reach the dynamic equilibrium. At last, part of the stress–strain curve shows an obvious upward trend, which is mainly due to the increasing diameter of the cross-section in the process of hot compression, which leads to the increase in friction. Some of the stress–strain curves show obvious periodic fluctuations, which are usually caused by the alternation of dynamic softening and work hardening.
The results show that the change in deformation conditions will lead to significant changes in flow stress. In the process of hot compression, deformation temperature and strain rate are the main factors affecting the stress–strain curve. Based on the analysis of the stress–strain curve, it is found that the flow stress decreases with the increase in deformation temperature, and the corresponding strain decreases when the flow stress reaches the peak, so the material is easier to enter the steady-state deformation stage. The flow stress increases with the increase in strain rate. The lower the strain rate is, the smaller the corresponding strain is when the flow stress reaches the peak value, and the material is more prone to steady-state deformation. Two reasons are the leading causes of the above trends: (1) When the temperature increases, the thermal motion of the atom increases, the deformation resistance decreases, dislocation climbing and slip are easier to occur, and the dynamic softening effect is enhanced. The flow stress and peak strain decrease, and the material is easier to enter the steady deformation stage. (2) The higher the strain rate is, the shorter the unit strain time is, the dynamic softening can’t be carried out fully, and the work hardening is dominant, which leads to the increase in flow stress. In addition, as the deformation rate increases, the deformation time becomes shorter, the heat loss in the deformation process decreases, and the temperature effect increases.

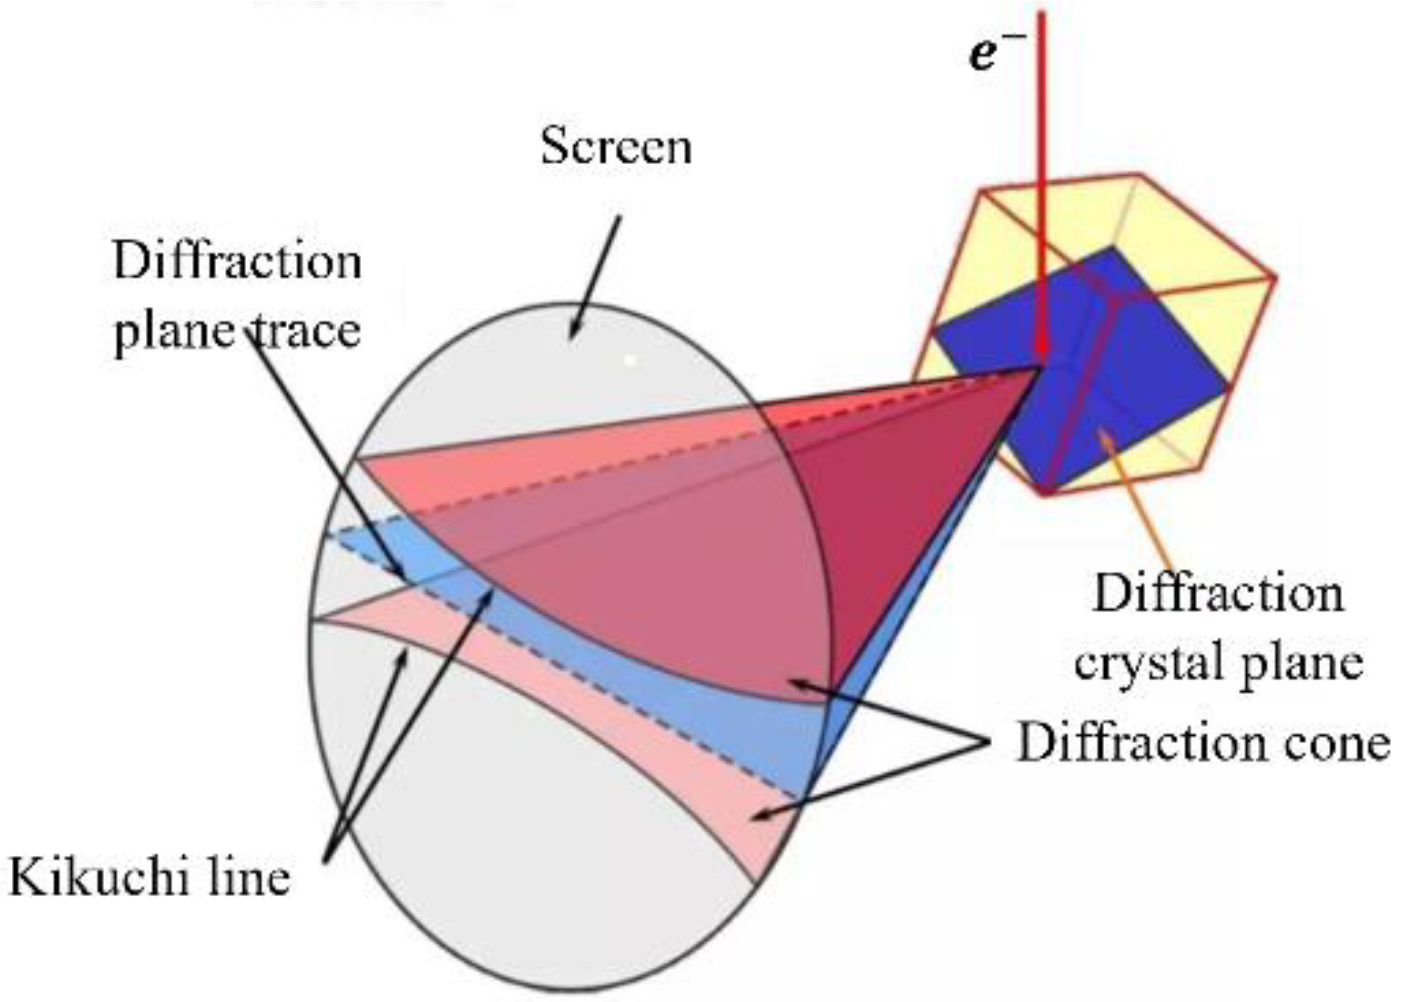
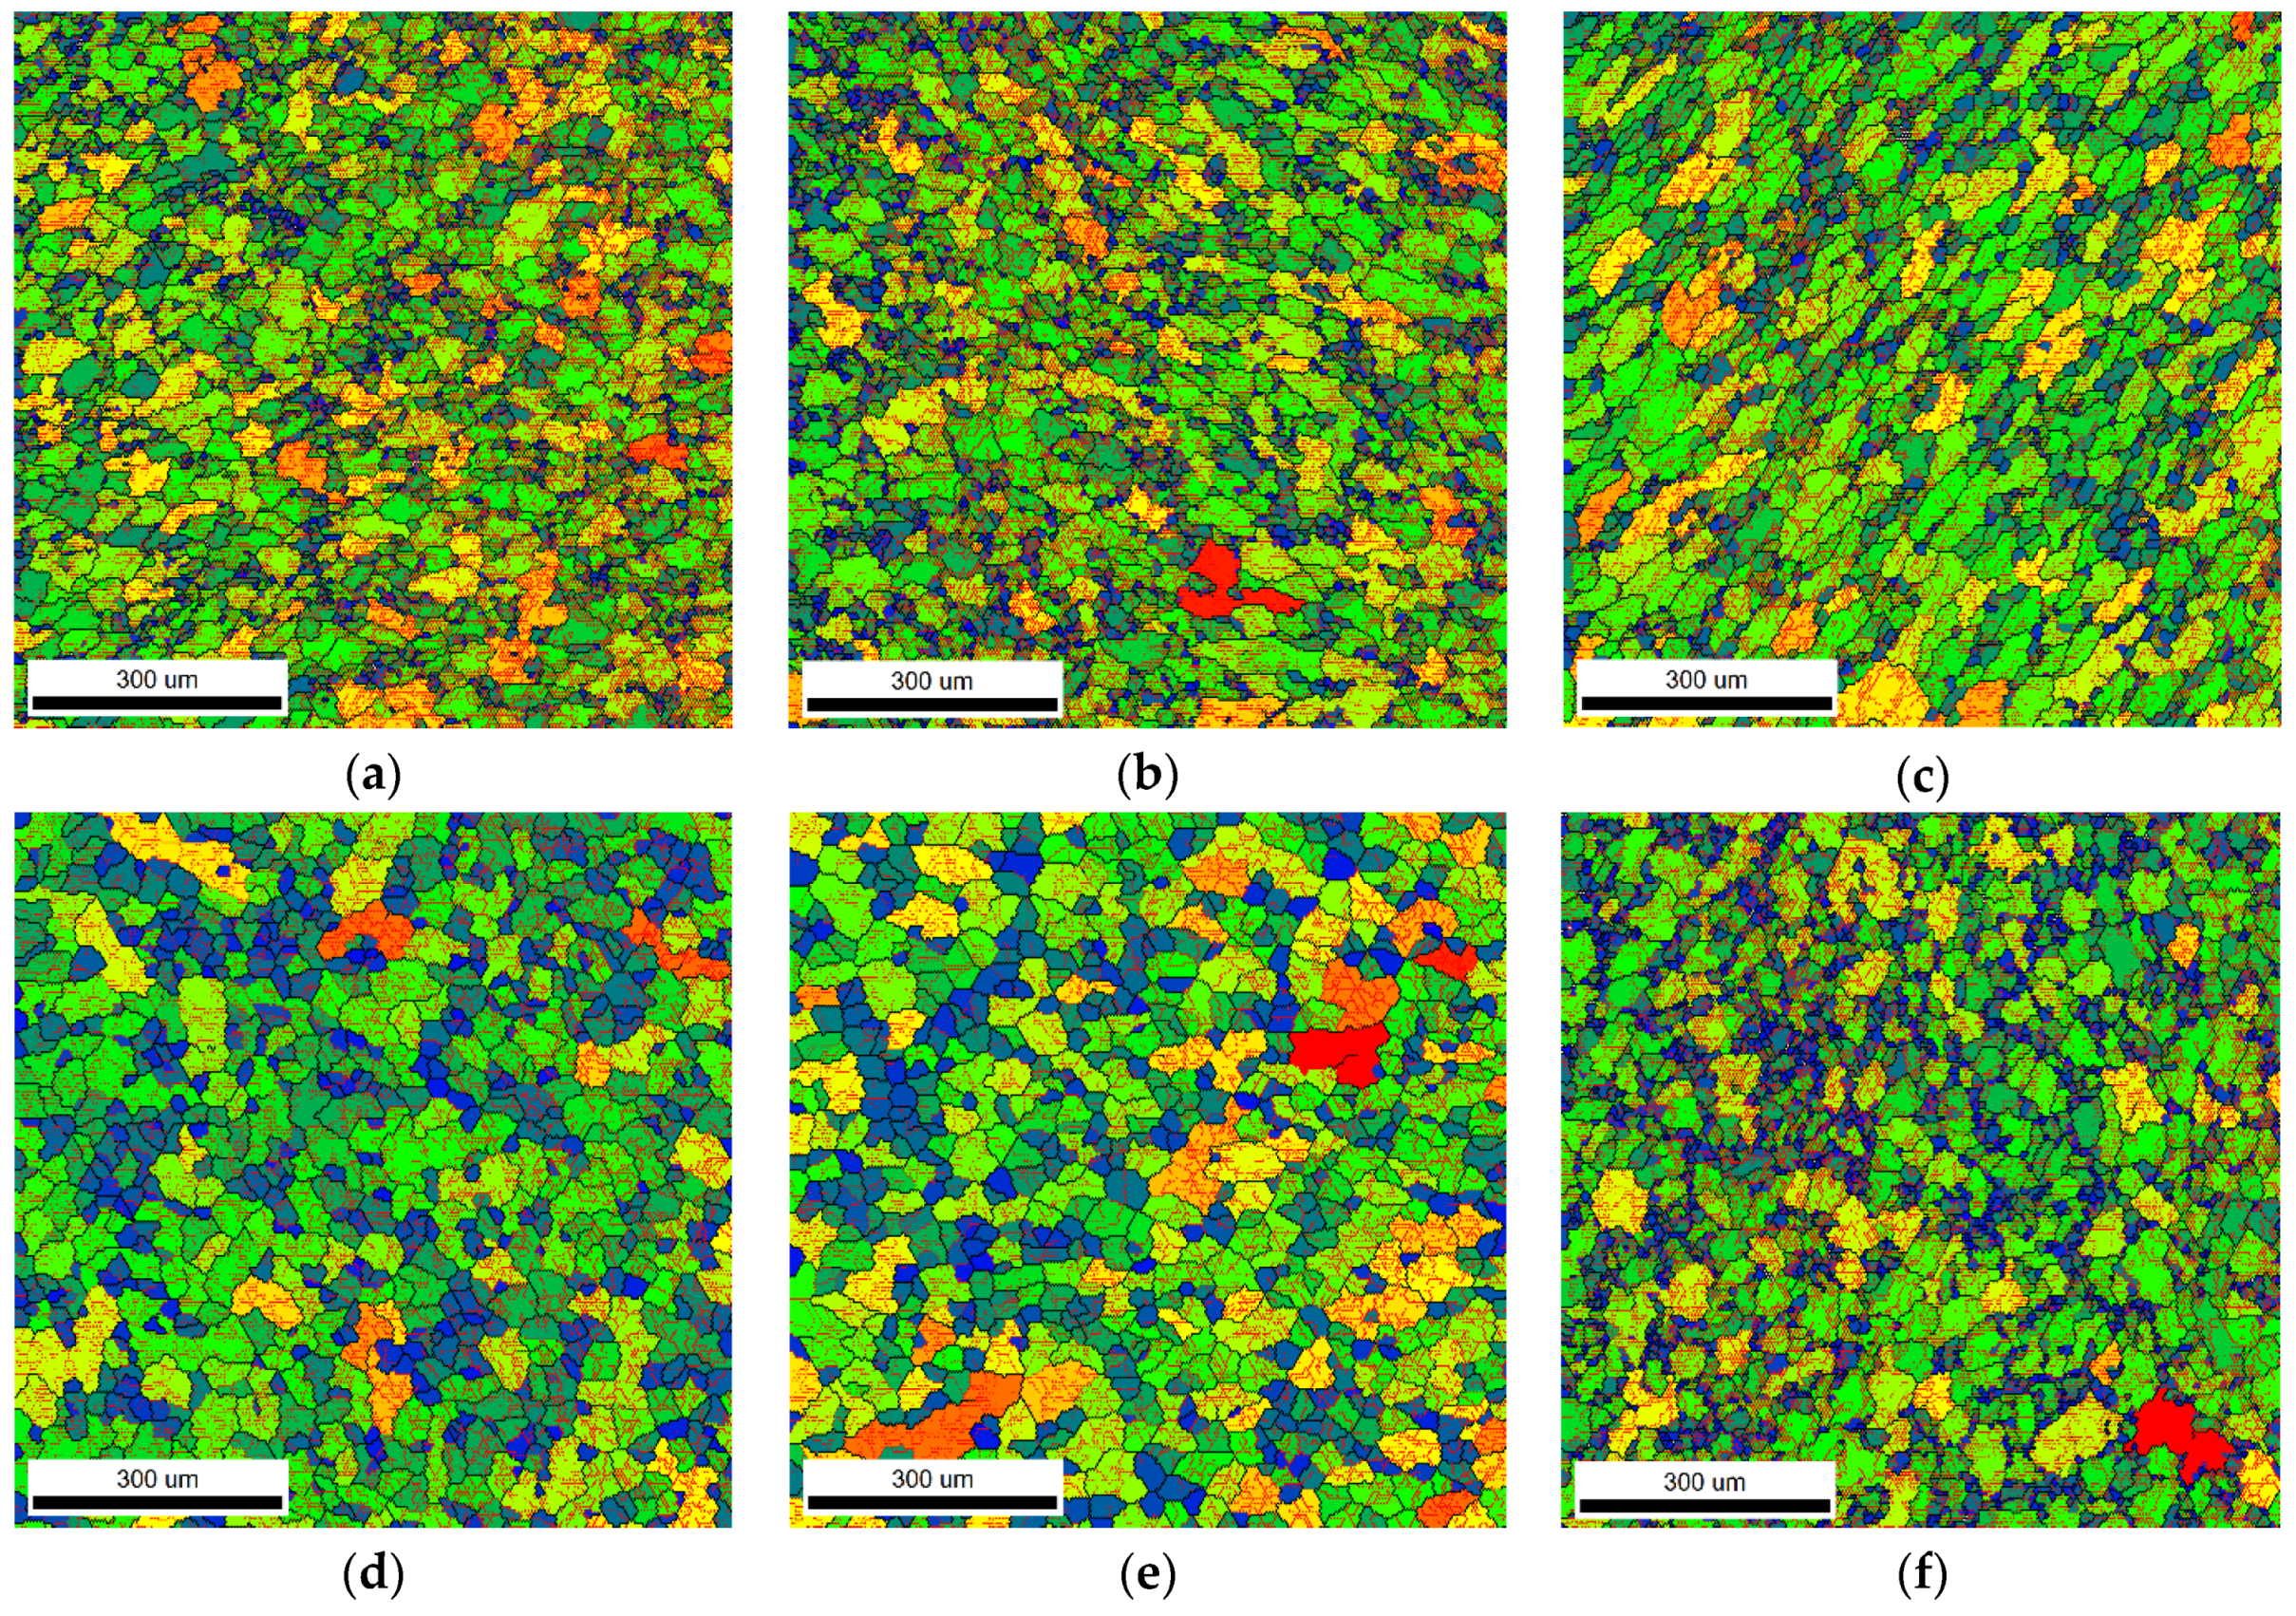
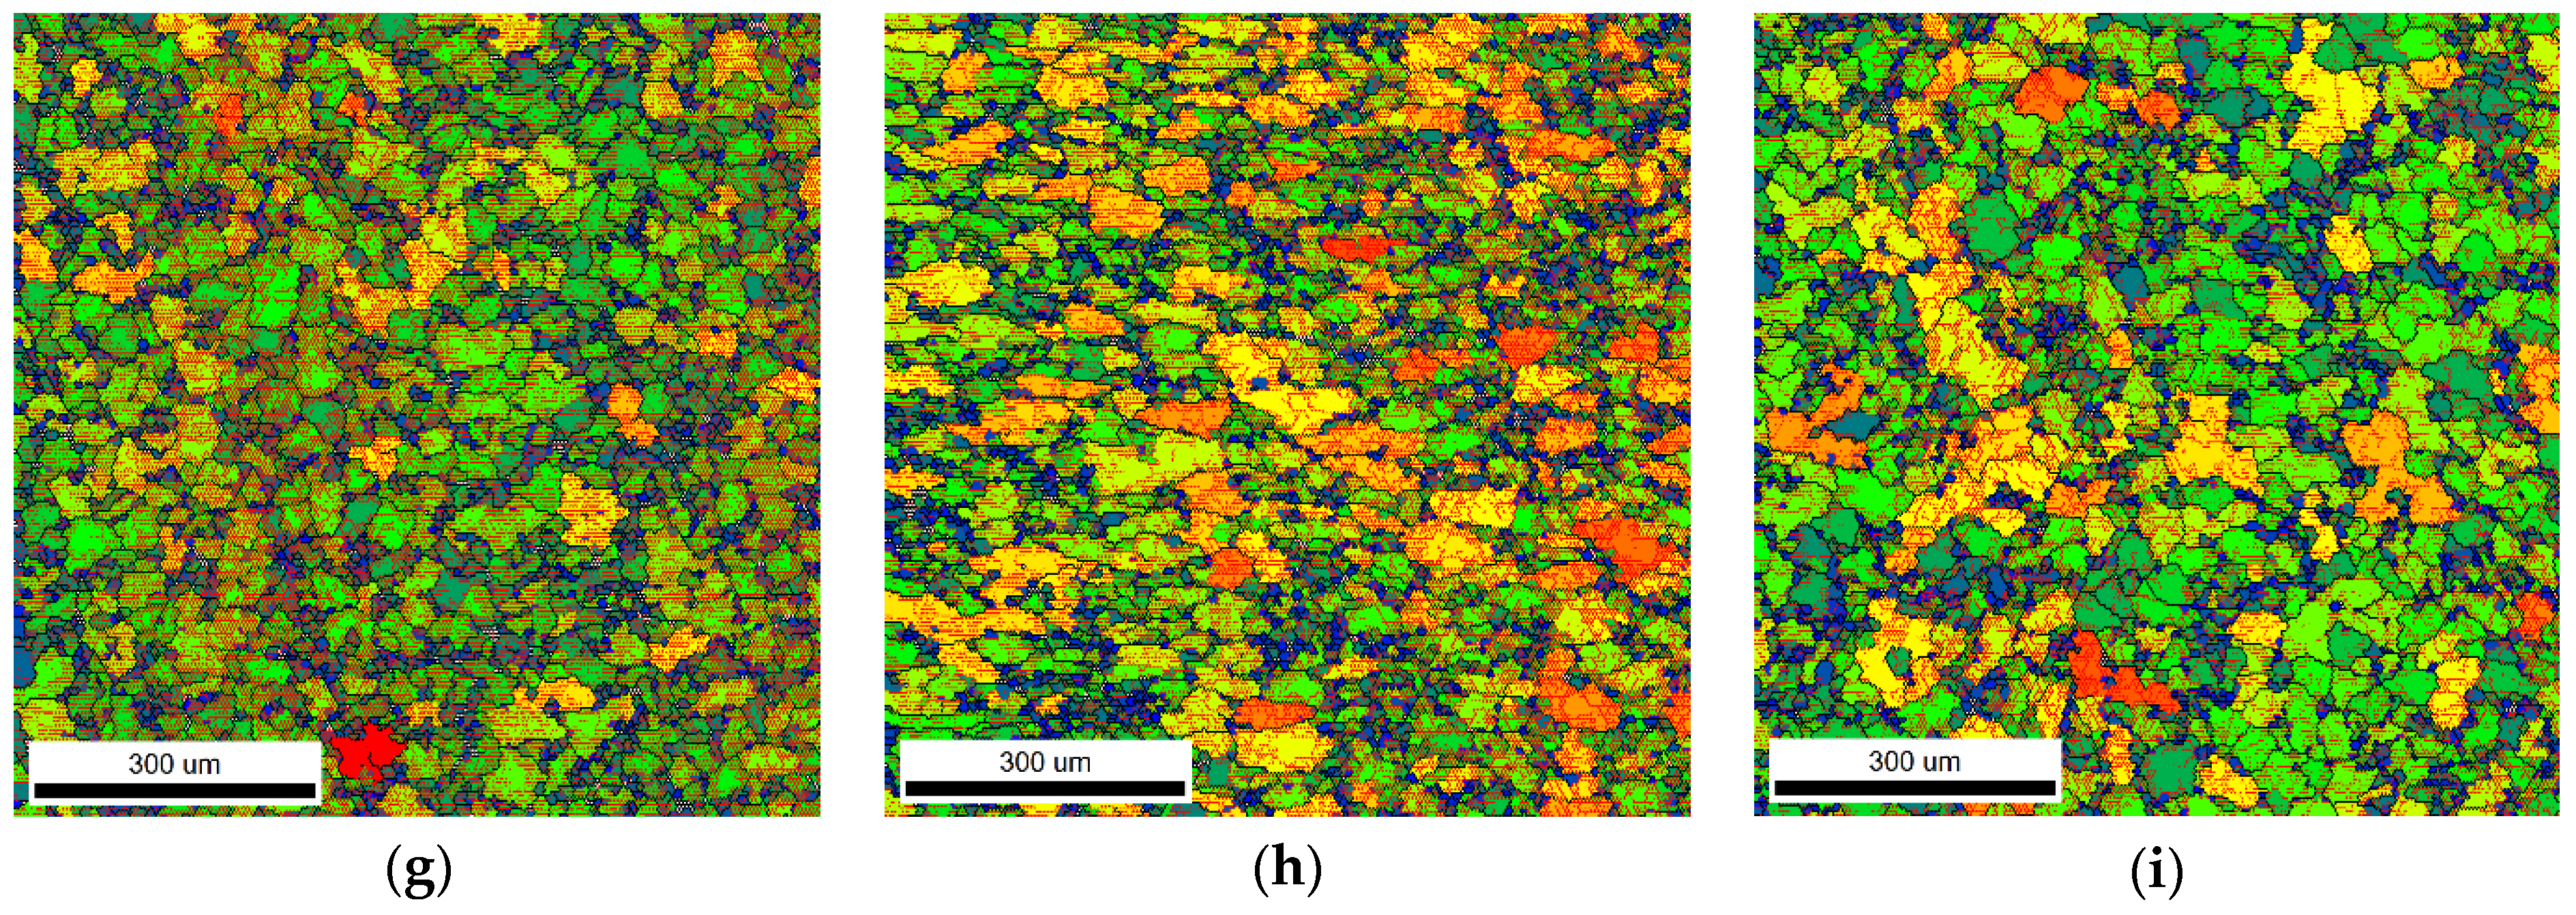
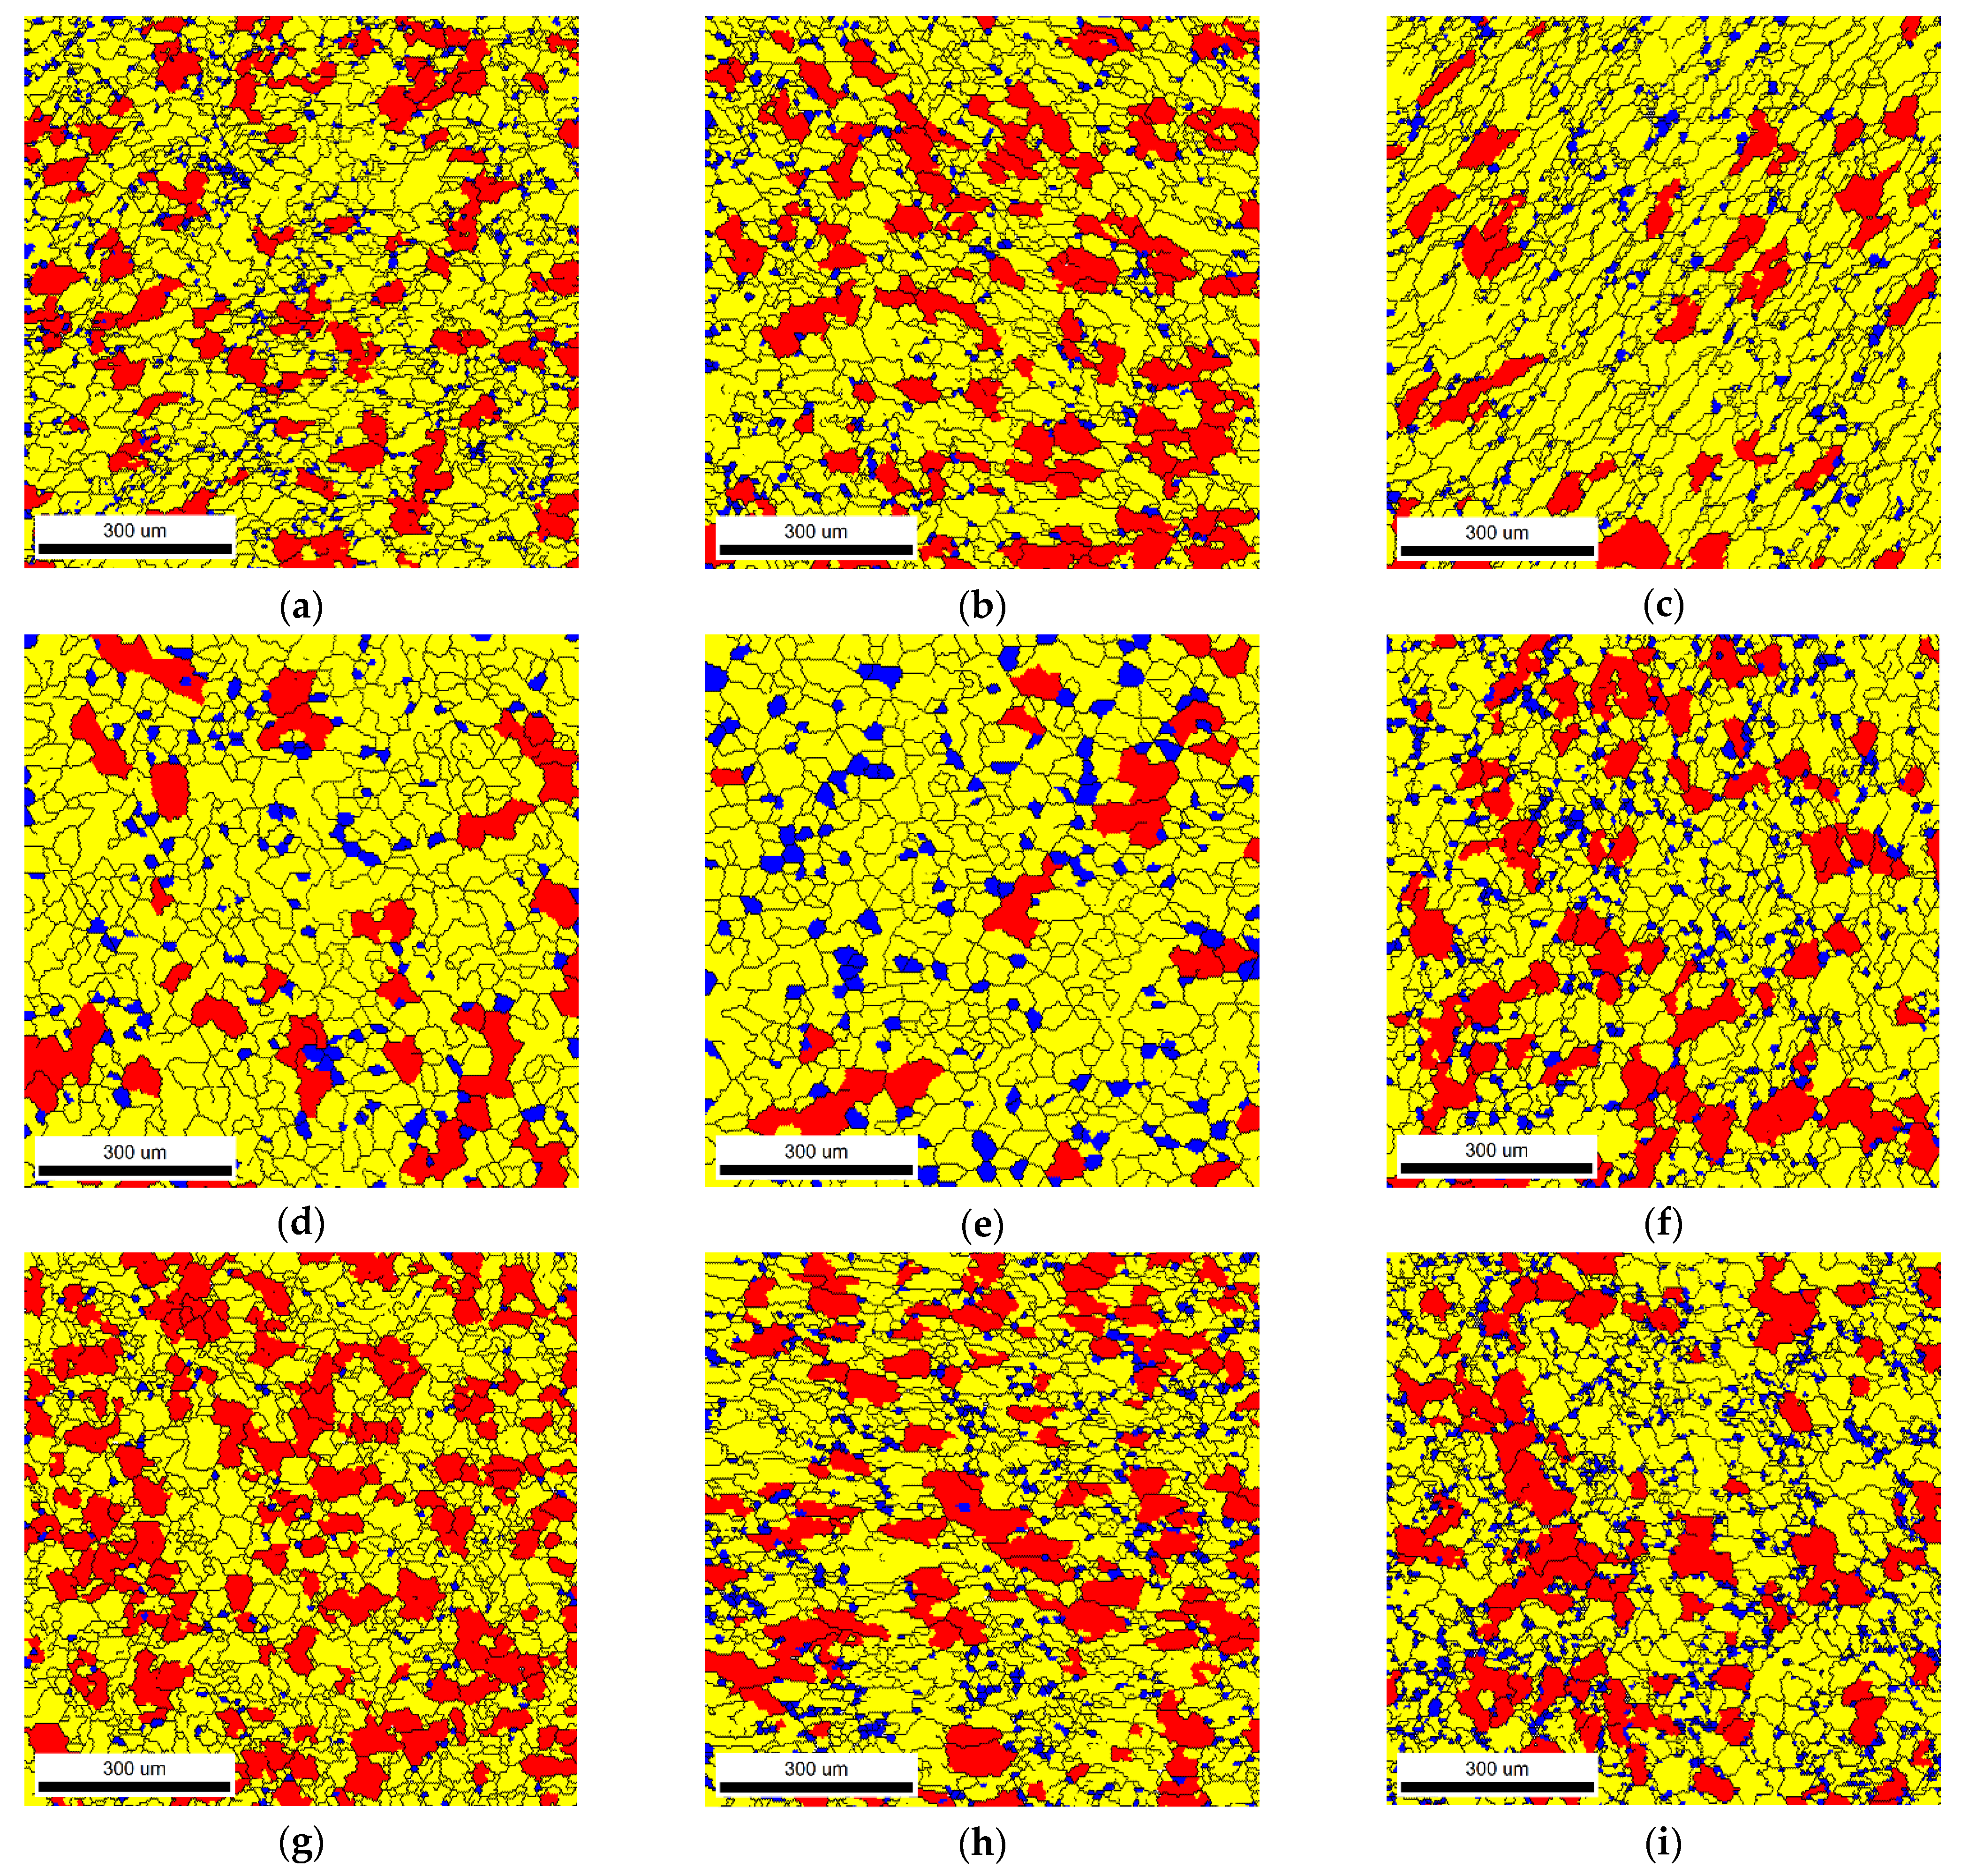
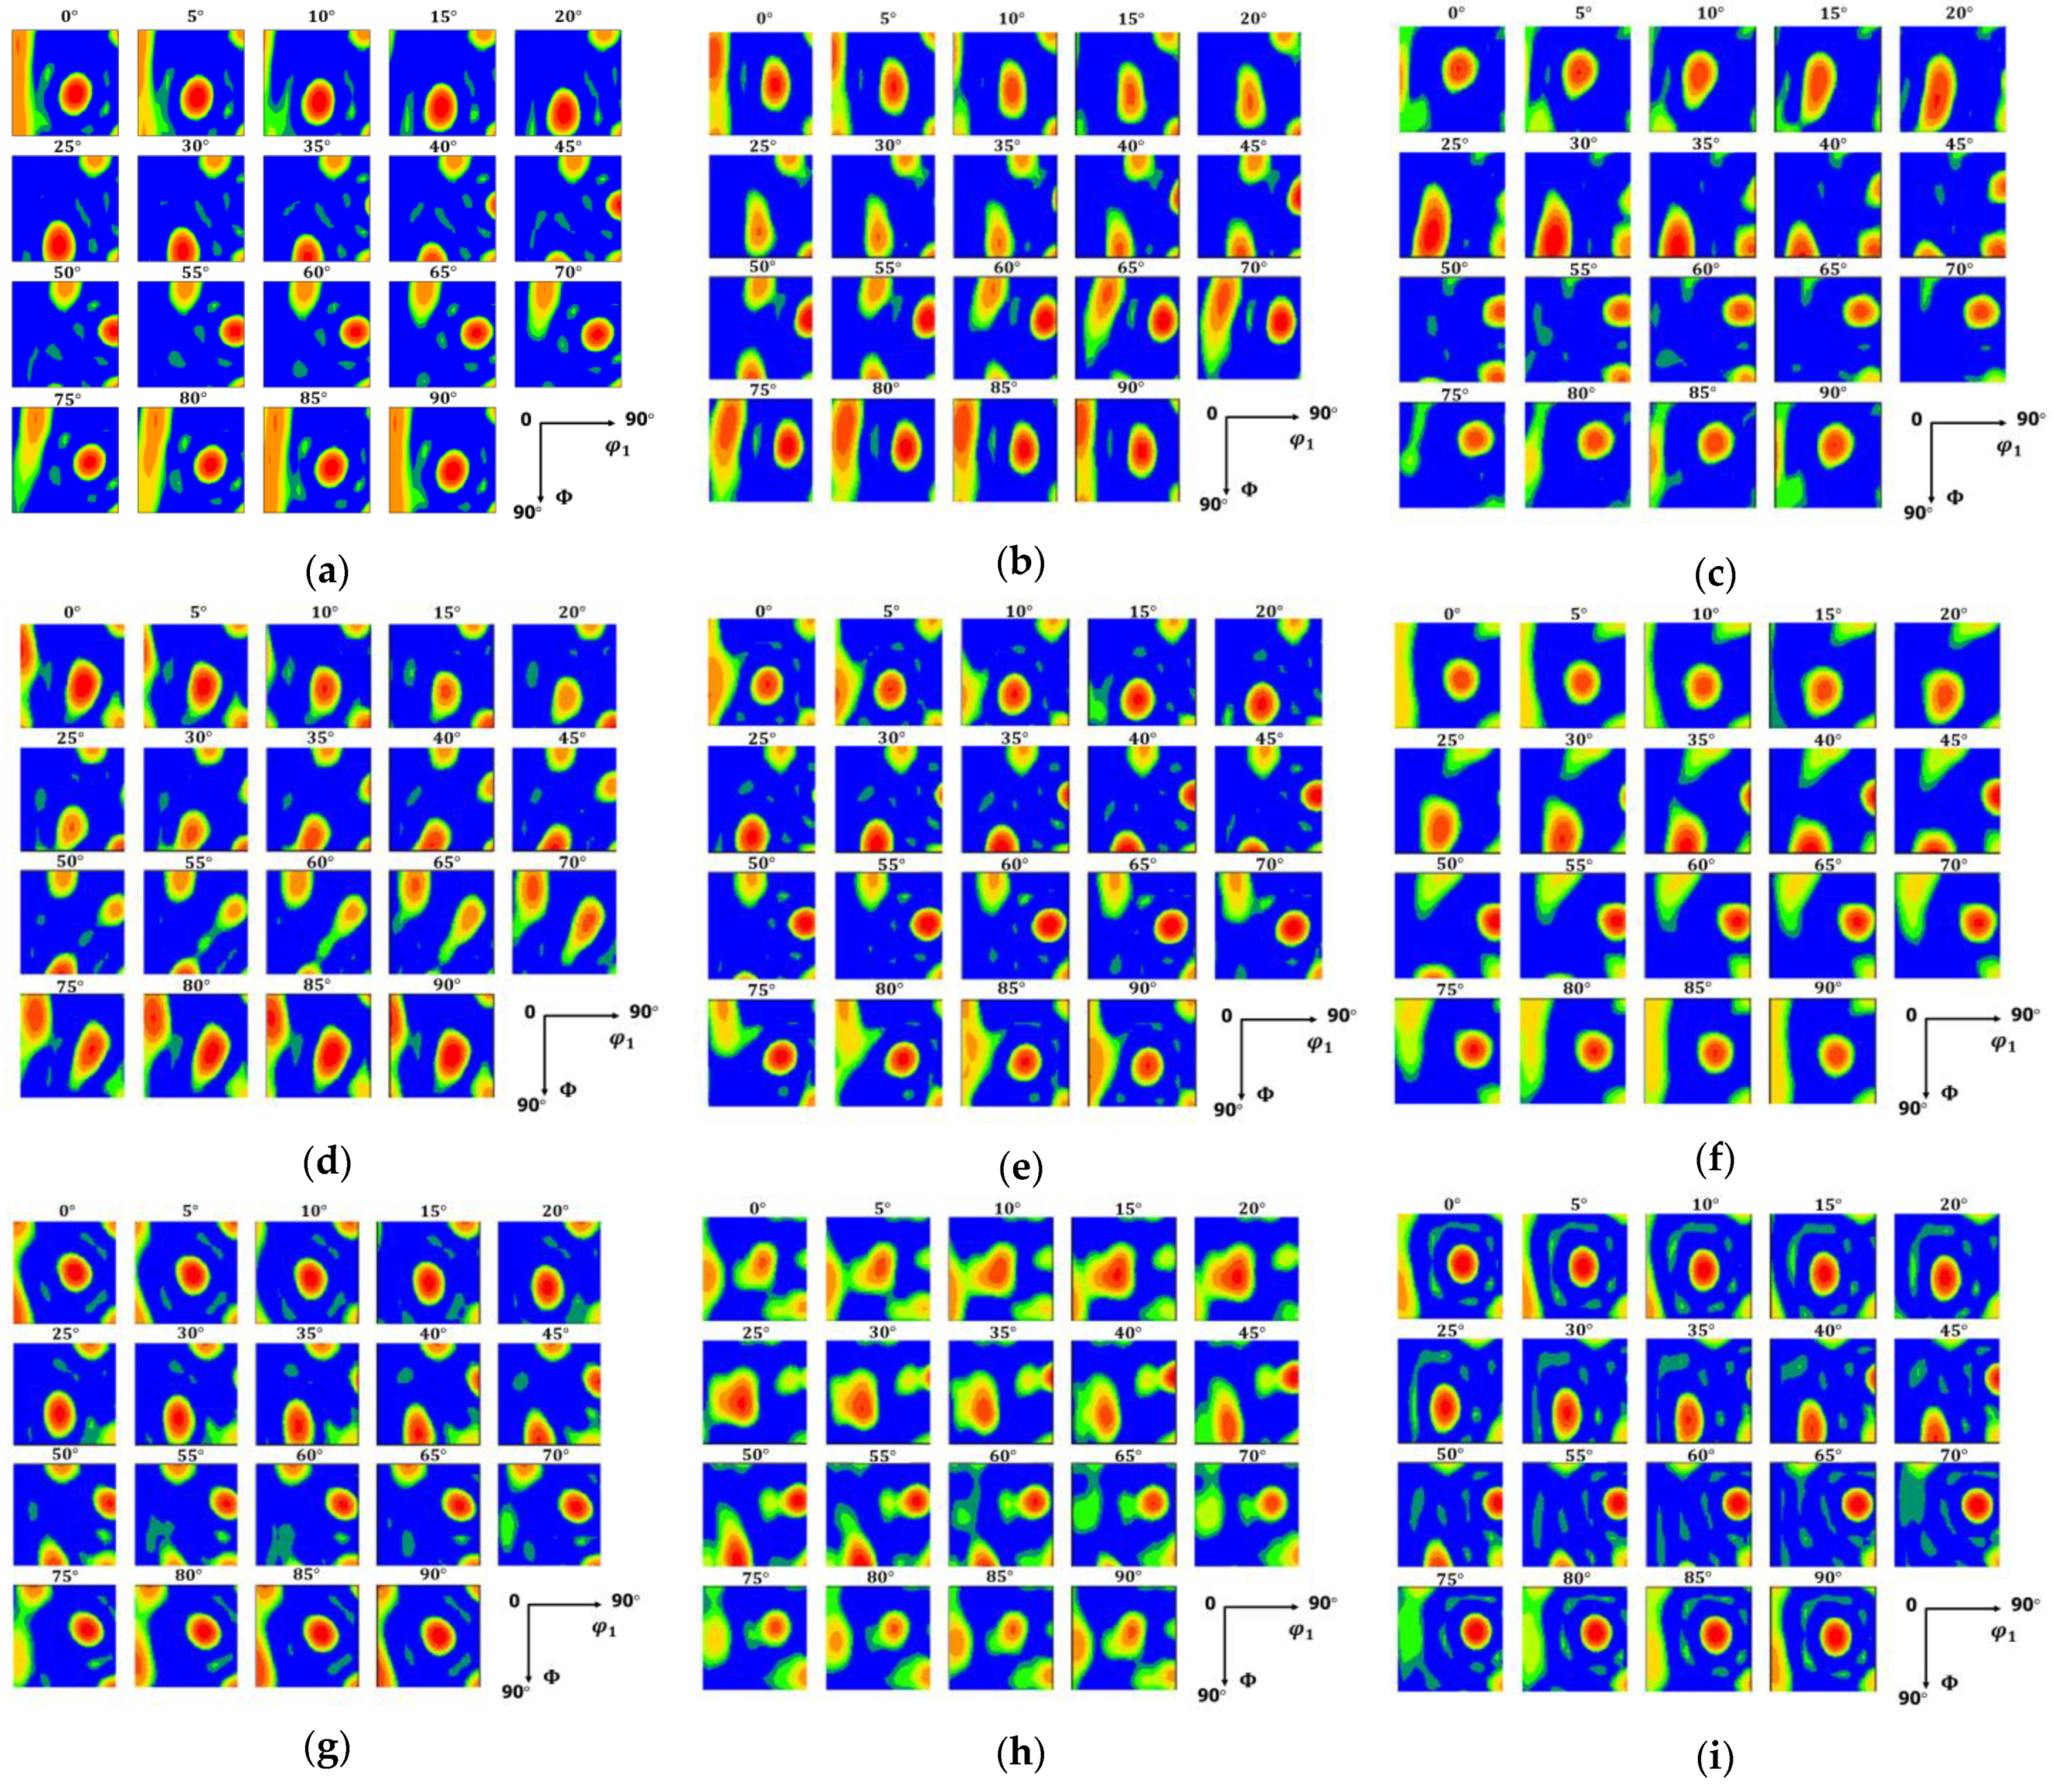
4.2. Anlysis of Microstructure Evolution

The micro-texture of AA7075 was analyzed by EBSD observation. Figure 6 shows the IPF and ODF diagrams of the initial condition of the AA7075 (without heating and hot compression treatment). ODF can show the orientation distribution of the crystal more directly, and the texture information can be described accurately and quantitatively by ODF. The initial texture shown in Figure 6 is used as the starting texture input for the VPSC model. By analyzing the ODF diagram and the crystal orientation distribution maps (Figure 7e), it is found that Goss {011} <100>, Copper {112} < 111 >, Cube {001} <100>, and {011} <1 1 ¯ 1> are the main texture components, and the texture intensity of Copper {112} < 111 > is the highest. There is also a small amount of Brass {011} <211>, R {124} <211>, and Brass-r {111} <112> textures. It can be clearly found from IPF that the materials used in this work mainly show <101> + <112> fiber textures before hot compression deformation, which is probably due to the pretreatment of the bars used in this study. Usually, the as-cast materials without deformation exhibit random textures, while the FCC materials are easy to show fiber texture when subjected to uniaxial tension or compression.
Figure 7 shows the microstructure of the AA7075 sample in the initial state (without heating and hot compression treatment). In the analysis of EBSD data, there are two methods to characterize the local misorientation, one is the KAM (kernel average misorientation) method (kernel based), and the other is the GOS (grain orientation spread) method (grain based). Both the KAM diagram and GOS diagram can directly represent the local strain distribution in the material. From the analysis principle, the conclusion obtained by analyzing GOS should be consistent with that obtained by analyzing KAM. GOS can be used to measure the deformation degree of grain structure. The smaller the GOS value of a single grain is, the smaller the deformation degree of the grain is. In the initial state, the GOS values of samples are concentrated in the range of 1–5. Further analysis of Figure 7 shows that the partition fraction of low-angle grain boundaries (LAGB) is about 61.5% (the misorientation angle is less than 10 ° ), and most of the grain sizes are distributed in the range of less than 30 μ m .
The grain boundary distribution maps and GOS diagrams after thermal deformation were listed in Figure 8 and Figure 9 ((a)–(i) corresponds to the experimental number (1)~(9)), respectively (corresponds to Figure 7c,d). The results show that with the increase in deformation, the grains are refined and elongated perpendicular to the compression direction. The fiber structure and grain breakage occurred under the condition of 70% deformation. When the deformation temperature is 350 °C, the grain shape is continuous and uniform, the grain boundary is smooth, and a large number of LAGB are formed in the grains. With the increase in deformation temperature, the grain size becomes bigger gradually. When the deformation temperature reaches 400 °C, a few fine equiaxed grains are distributed around the grain boundary of large grains, and it is speculated that dynamic recrystallization may have occurred in the process of deformation. When the deformation temperature further increases to 450 °C, some grain boundaries show a zigzag shape, and the proportion of LAGB decreases. The number of fine equiaxed crystals further increases, and the size of equiaxed crystals increases. This may be due to the fact that the formation of dynamic recrystallization is a thermal activation process, when the temperature increases, the atomic motion increases, the dislocation resistance decreases, and dislocation slip and dislocation climbing are more likely to occur. This leads to an increase in recrystallization formation and growth rate, and dynamic recrystallization softening occurs. When the strain rate is 0.01 s 1 , the grain boundaries are clear and the grains are fine and uniform. When the strain rate increases to 1 s 1 , the grain boundary tends to be blurred, and the non-uniformity of grain deformation increases. At higher temperatures (400 °C and 450 °C), fine equiaxed grains appear obviously around the grain boundary when the strain rate is 0.01 s 1 , and the number and size of fine equiaxed grains decrease with the increase in strain rate. The reason for the above behavior may be that during plastic deformation at a high strain rate, the grains do not have enough time to complete dislocation, dynamic recovery and dynamic recrystallization do not occur in time, and work hardening plays a dominant role.
Existing studies have shown that the stacking fault energy is the key factor to determine the occurrence of dynamic recovery and dynamic recrystallization [26,27,28]. In the process of hot deformation, the thermal activation energy increases, the different sign dislocations in the metal counteract, and the subgrain merge with each other, which is called dynamic recovery, which is the mechanism and characteristic of dynamic recovery. When the dynamic recovery cannot completely offset the dislocations produced during the material deformation, the dislocations accumulate gradually, and when the dislocations accumulate to a certain extent, it will lead to recrystallization. Dynamic recovery is easy to occur in metal with high stacking fault energy. The stacking fault energy of aluminum alloy is high, so dynamic recovery plays a dominant role in hot working. Partial dynamic recrystallization occurs under the conditions of large deformation and high temperature. However, under the conditions of large deformation and high temperature, aluminum alloy will also have a certain degree of dynamic recrystallization.
Each group of samples shows different preferred orientations under different deformation parameters. In subsequent sections, the sensitivity of the evolution of the main components of micro-textures (Copper {112} < 111 >, and {011} <1 1 ¯ 1>) to hot compression parameters (heating rate, the amount of deformation, temperature, strain rate) was analyzed. Table 4 shows the typical textures in FCC materials. Table 5 shows the partition fraction of Copper {112} < 111 > and {011} <1 1 ¯ 1> corresponding to each group of experiments.

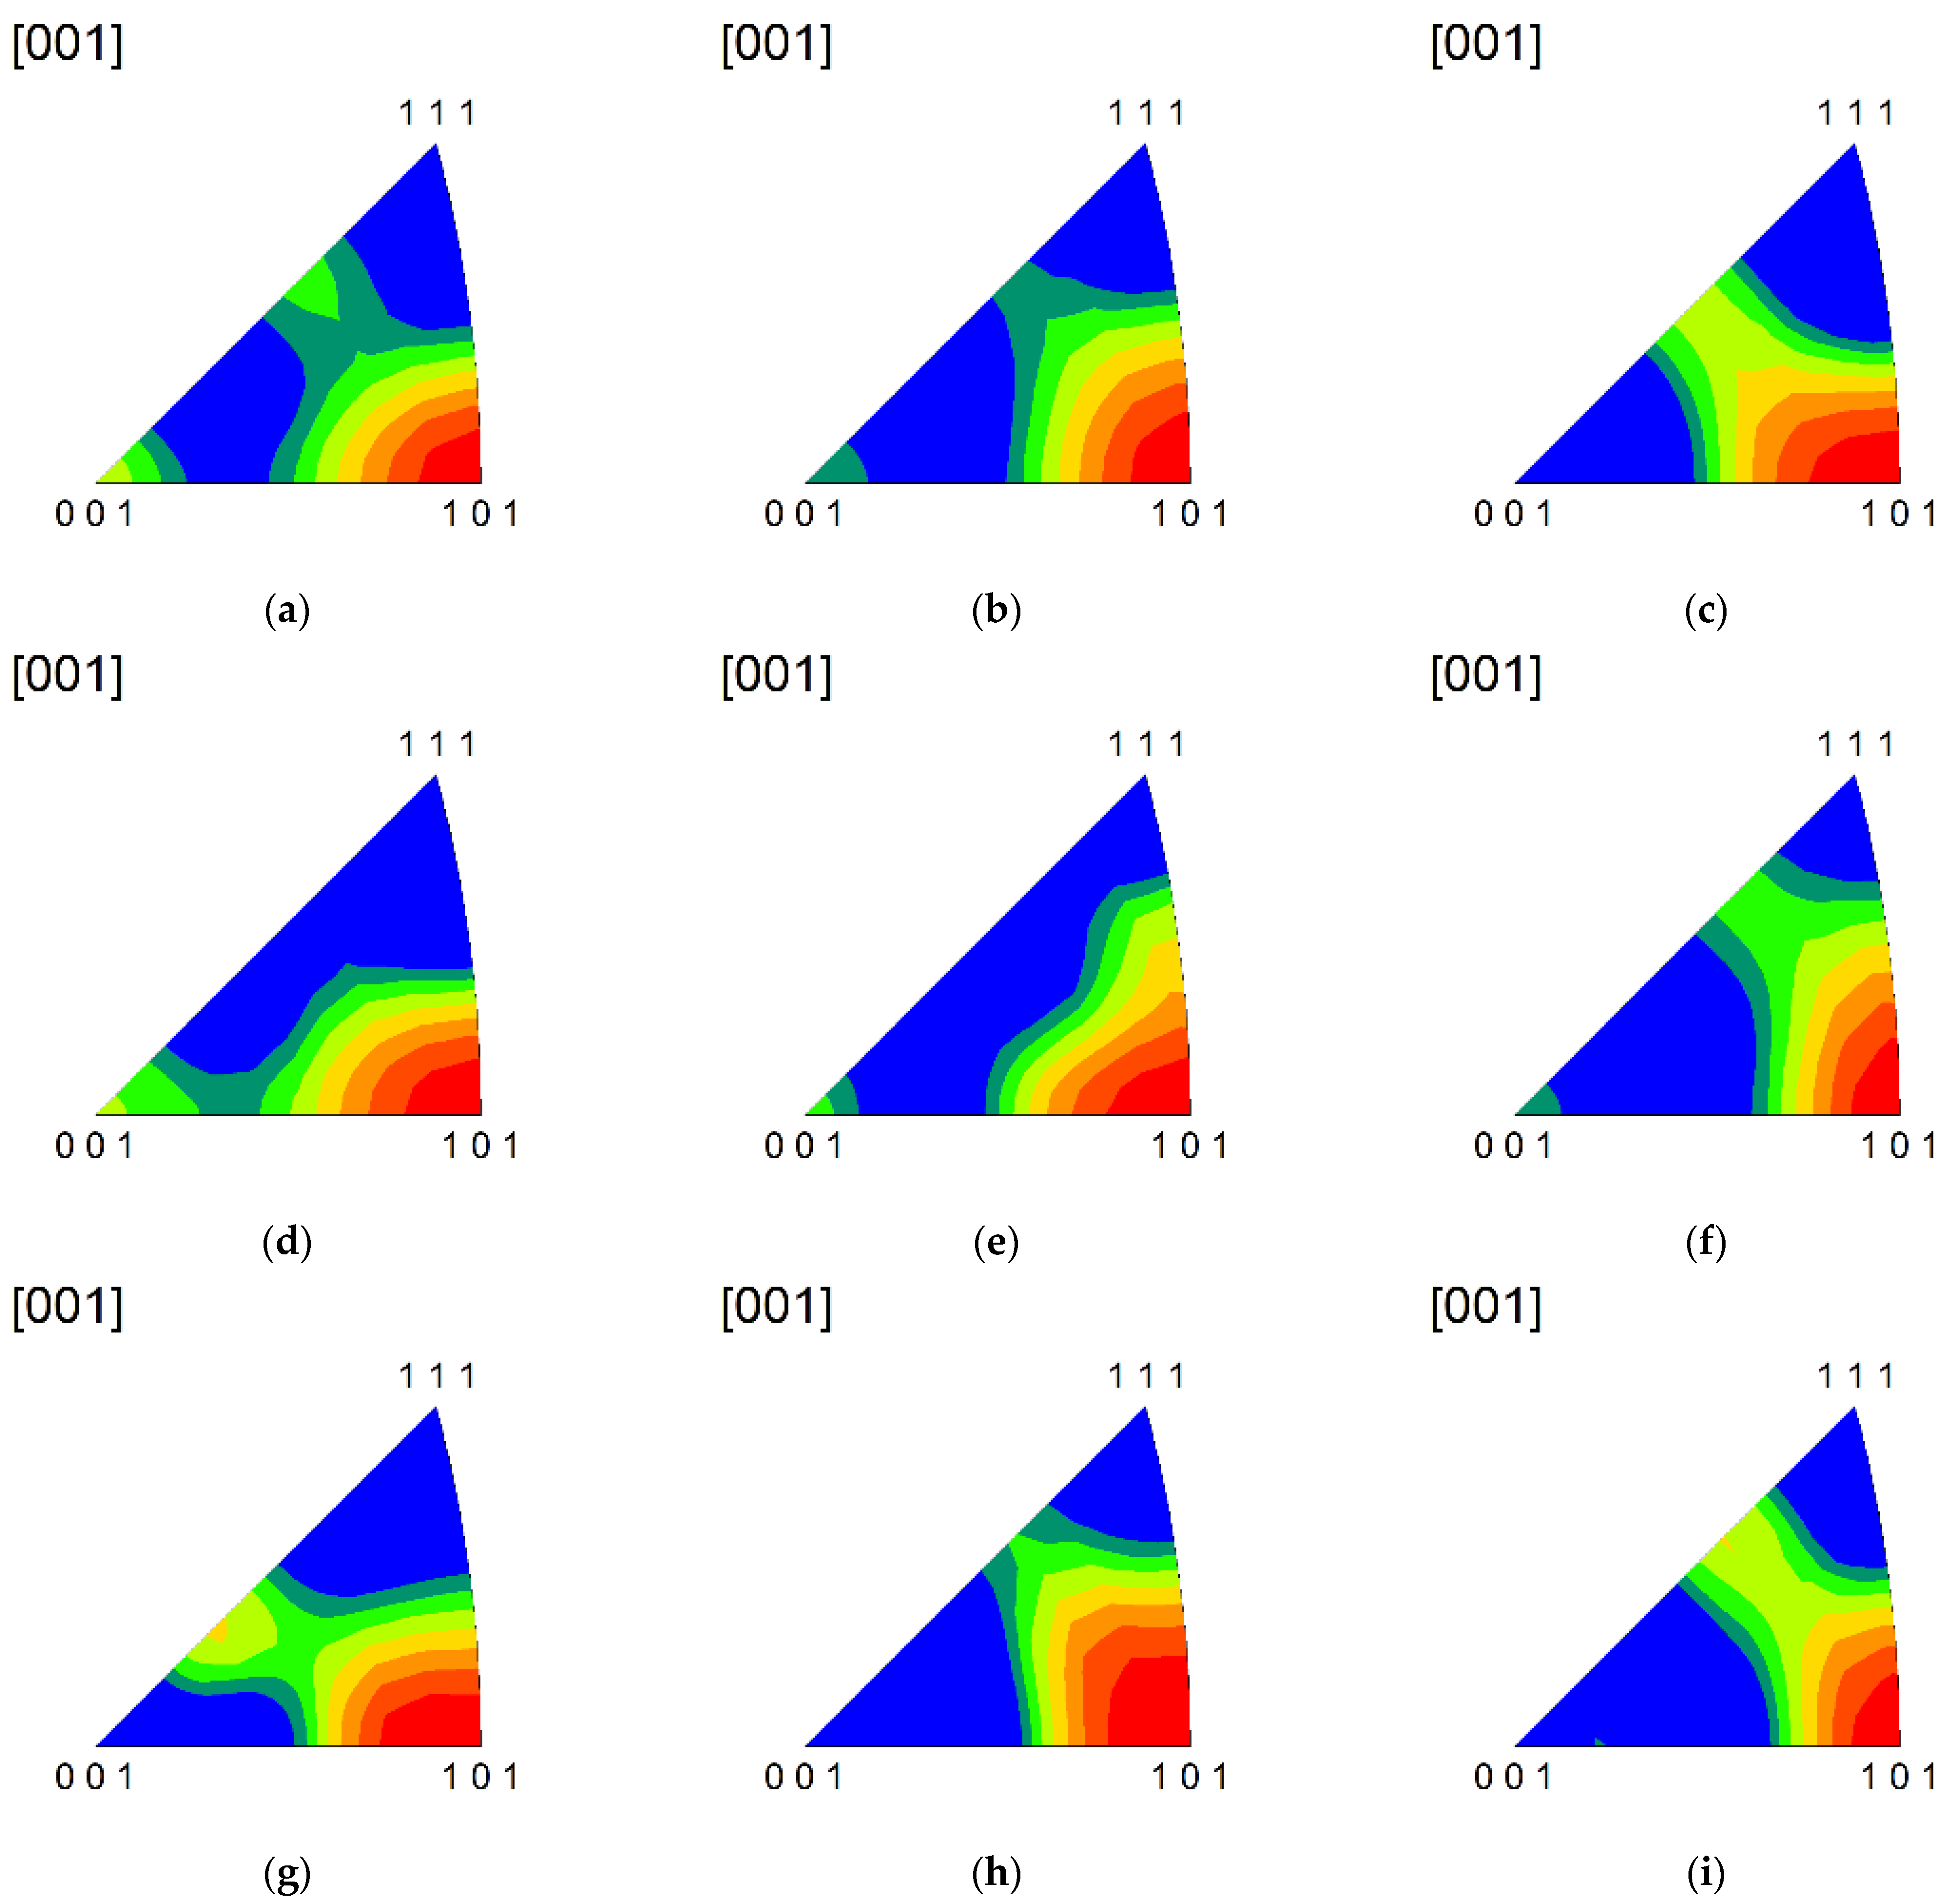
4.3. Effect of Deformation on Microstructure

The sensitivity of Copper {112} <111> and {011} <1 1 ¯ 1> textures to hot compression deformation parameters was analyzed in Figure 10. The results show that with the increase in deformation, the partition fraction of Copper {112} <111> texture decreases significantly, while that of {011} <1 1 ¯ 1> texture decreases at first and then increases.
The IPF and ODF diagrams obtained after EBSD analysis are shown in Figure 11 and Figure 12 ((a)–(i) corresponds to the experimental number (1)~(9)).
With increasing deformation, the maximum intensity of the grain orientation decreases. Comparing the IPF diagram before (Figure 6a) and after (Figure 11) hot compression, it is found that there is no correlation between the amount of deformation and the main components of the fiber texture. As shown in the IPF diagram, the maximum intensity of fiber texture increases slightly with the increase in deformation. Further analysis of the ODF diagram (Figure 12) shows that the intensity of Cube {001} <100> texture increases with increasing deformation, while the intensity of R {124} <211> texture and Goss {011} <100> texture decreases with increasing deformation. The maximum intensity of the Copper {112} <111> texture and {011} <1 1 ¯ 1> texture does not change obviously. In the same deformation conditions, the larger the deformation, the longer the deformation.

4.4. Effect of Deformation Temperature on Microstructure

Based on the analysis of grain structure (Section 4.2), it is found that, with the increase in deformation temperature, the proportion of LAGB gradually decreases, and the proportion of large grain size, which is higher than the average grain size, gradually increases. The above behavior may be attributed to the grains not having enough time to complete dislocation and slip, dynamic recovery and dynamic recrystallization not occurring in time, and work hardening playing a dominant role during plastic deformation at a high strain rate. Furthermore, it is found that the maximum intensity of grain orientation decreases with increasing temperature, and the overall intensity of texture gradually decreases with increasing temperature. The analysis of the IPF diagram shows that the intensity of the whole fiber texture decreases slightly with increasing temperature, the <112> fiber texture almost disappears, and the <100> fiber texture with weak intensity appears in Figure 11g. When the temperature reaches 450C, the primary fiber texture type is still<011> + <112>, but the intensity of <011> + <112> fiber textures decrease. Further analysis of the ODF diagram shows that: (1) The intensity of the Cube {001} <100> texture decreases with increasing temperature; (2) the intensity of the Goss {011} <100> texture first decreases and then increases with increasing temperature, which is probably due to the Cube {001} <100> partly changed to Goss {011} <100>; (3) the partition fraction of R {124} <211> texture increases with increasing temperature, but its maximum intensity decreases; (4) Copper {112} <111> and {011} <1 1 ¯ 1> are still the main components of the texture, but the intensity decreases with increasing temperature. The partition fraction of both Copper {112} <111> and {011} <1 1 ¯ 1> decrease at first and the increase with the increase in temperature.

4.5. Effect of Strain Rate on Microstructure

In the process of hot deformation, the strain rate will directly affect the deformation time of the material. When the strain rate is low, the deformation time of the material is longer, and the dislocation can be fully carried out in the form of climbing and slip. When the strain rate is high, the deformation time is short, the dislocation cannot be fully carried out, and the deformation energy is difficult to be released. According to the analysis of the IPF diagram, it is found that when the strain rate is 0.01 s 1 , the fiber texture of the material is still <101> + <112>. When the strain rate increases to 1 s 1 , the main fiber texture changes to <101> + <115>. The maximum intensity of fiber texture increases with the increase in strain rate. Further analysis of the ODF diagram shows that: (1) The intensity of Cube {001} <100> decreases with increasing strain rate. (2) The intensity of Goss {011} <100> first increases and then decreases with increasing strain rate, which could be due to the fact that the Cube {001} <100> is partially changed to Goss {011} <100> with increasing strain rate, and Goss {011} <100> is changed to other texture types as the strain rate continues to increase. (3) The intensity of Copper {112} <111> changes little with the increase in strain rate. (4) The intensity of {011} <1 1 ¯ 1> increases when the strain rate increases from 0.01 s 1 to 0.1 s 1 , then changes little when the strain rate increases from 0.1 s 1 to 1 s 1 . (5) The partition fraction of Copper {112} <111> increases with the increase in strain rate, while that of {011} <1 1 ¯ 1> increases at first and then decreases.

4.6. Effect of Heating Rate on Microstructure

The effect of heating rate on the micro-textures evolution of AA7075 was considered hot in this study. Combined with the comparative analysis of grain boundary distribution and GOS diagram before and after hot compression deformation, it is found that at the heating rate of 100 ° C / s , the proportion of LAGB in the material after hot compression deformation is higher than 10 ° C / s and 1 ° C / s , and the partition fraction of deformed grains with GOS value greater than 5 also increases. Further analysis of the IPF diagram and ODF diagram before and after hot compression deformation shows that the intensity of Copper {112} <111> and {011} <1 1 ¯ 1> increases with the increase in heating rate, and the partition fraction decreases at first and then increases. The intensity and partition fraction of Cube {001} <100> and Goss {011} <100> do not show obvious regularity with the change of heating rate.
When the material is heated at a low heating rate, the material has enough time for dynamic recovery and dynamic recrystallization during the heating process, which consumes the internal storage energy of the material to a certain extent. When the heating rate increases, the whole heating process is completed in a few seconds, and the material does not have time to release internal storage energy during the heating process. Some studies have also pointed out that the heating rate in the heating process will have an effect on the precipitated phase and dispersed phase of the material [29,30,31], which may also be one of the reasons why the heating rate will affect the micro-texture of the material after hot compression deformation. However, to further explain the cause and mechanism of this change, it is necessary to carry out TEM or in situ analysis of the materials.
Among the three heating rate levels designed in this study, 10 ° C / s and 100 ° C / s are high heating rates. Generally, in the hot compression experiments, the heating rise rate used by researchers is less than 1 ° C / s (usually 0.01 ° C / s or 0.1 ° C / s ). Therefore, the heating rates of 10 ° C / s and 100 ° C / s designed in this case belong to the level of high-temperature rise rate. The accurate threshold of heating rate needs to be verified and analyzed by more in-depth experiments, and the specific threshold value cannot be determined only according to the experimental results in this study.

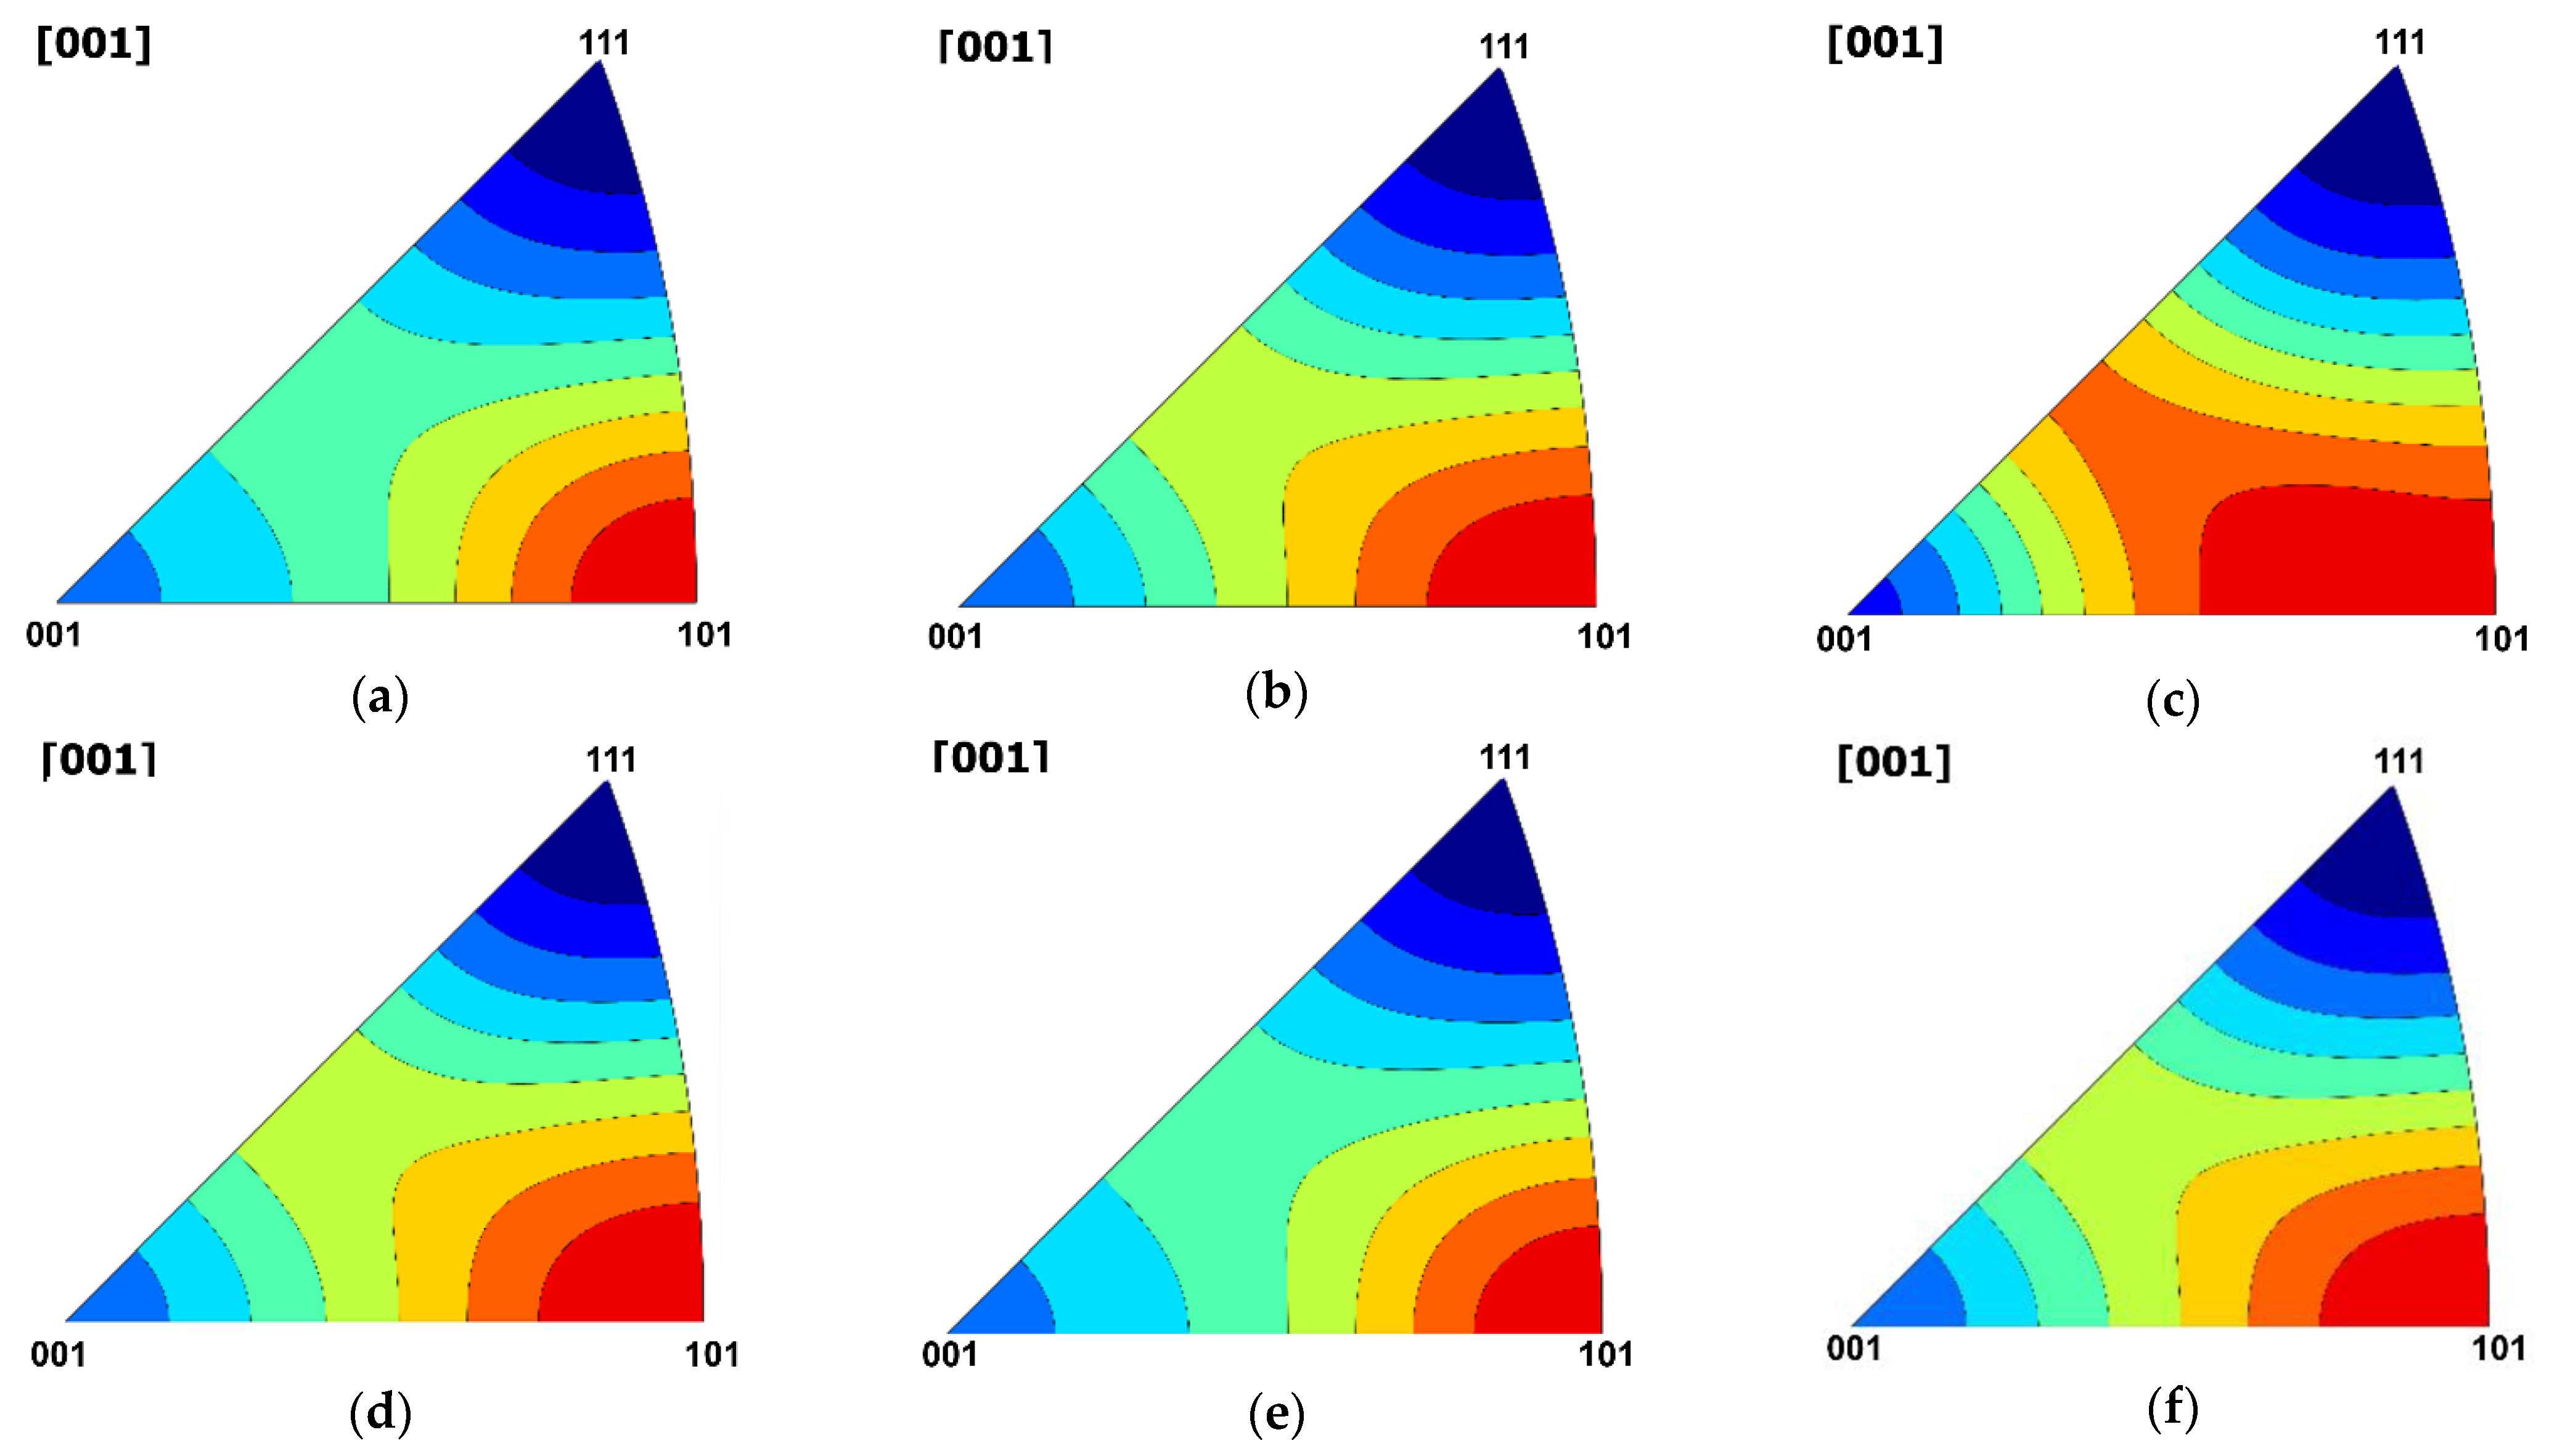
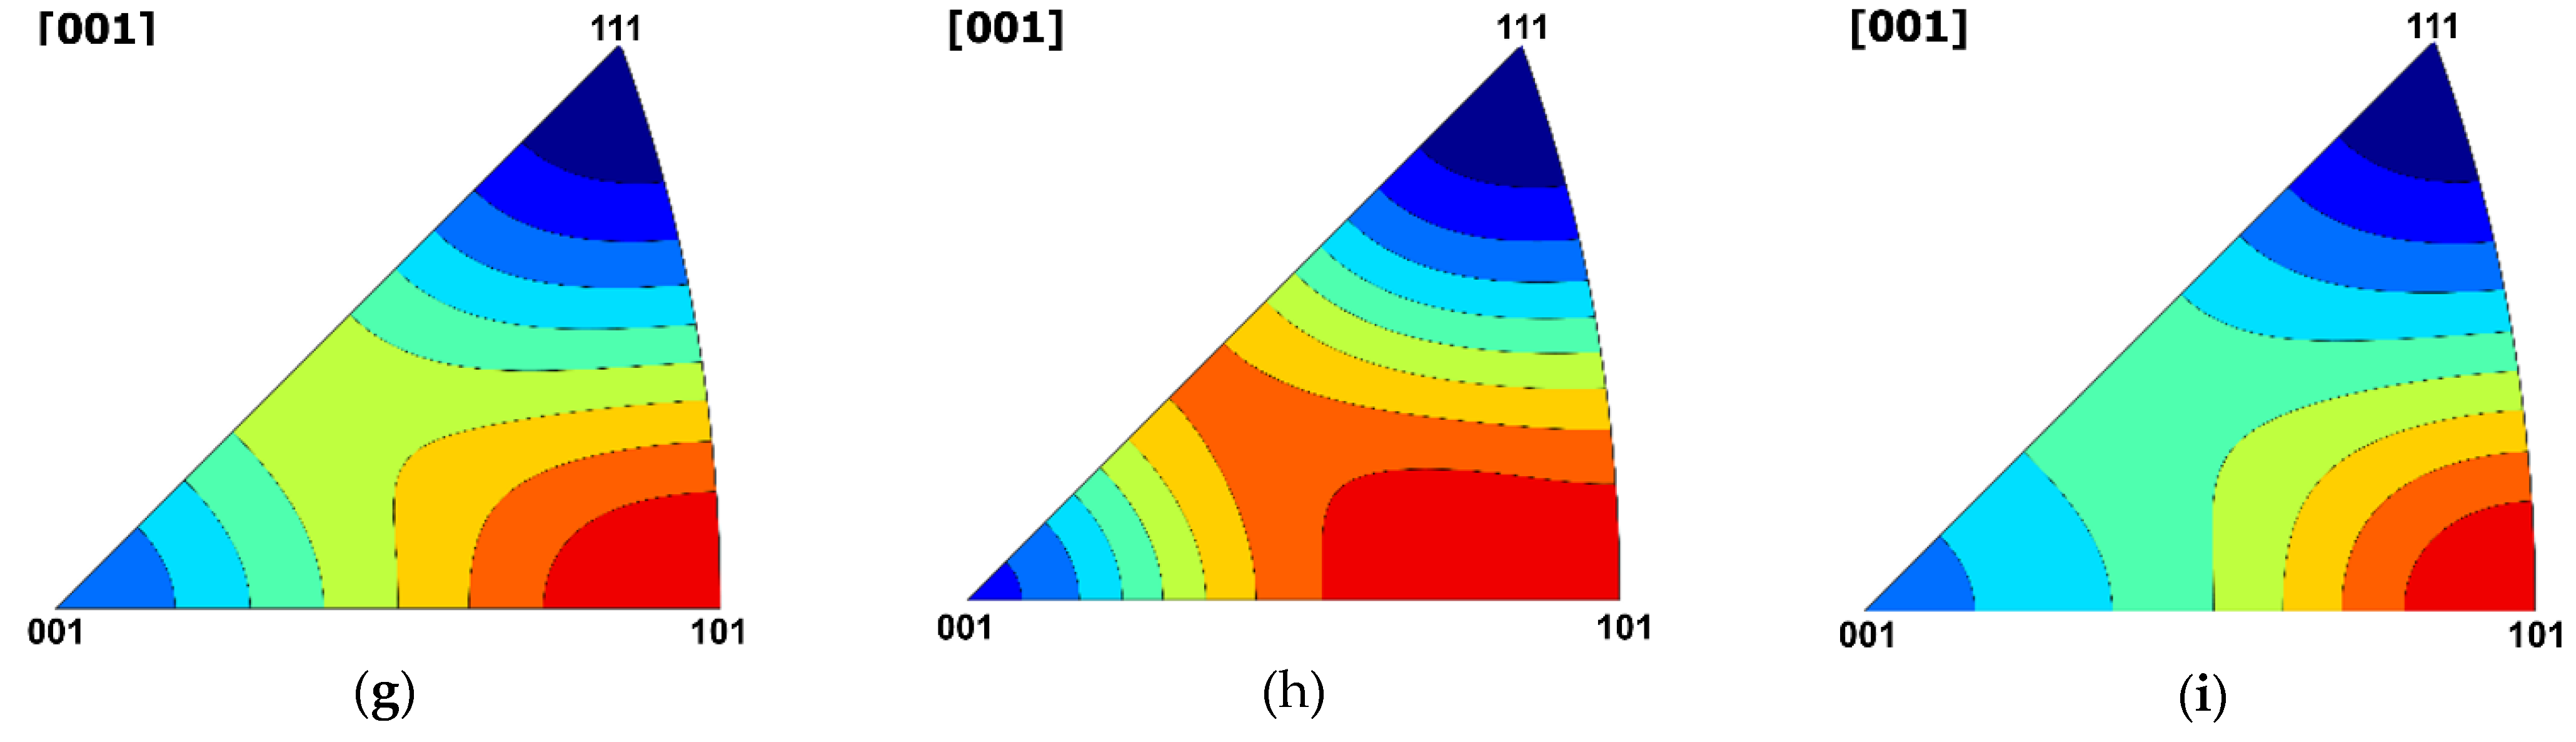
5. Prediction Results and Analysis

5.1. Model Verification

The different states of hot deformation of the AA7075 are predicted using the secant linearization method on the basis of the improved VPSC model. The Voce hardening parameters of the materials used in the simulation are listed in Table 3. Figure 13 and Figure 14 ((a)–(i) corresponds to the experimental number (1)~(9)) are the IPF and ODF of the AA7075 after hot deformation, which were calculated by the improved VPSC model. Compared with the measured IPF and ODF, the micro-texture distribution and maximum intensity of the prediction results were consistent with the experimental results. As mentioned above, the material will undergo non-uniform deformation due to the influence of friction in the actual thermal deformation process (Section 2), and fine recrystallized particles are observed in the thermal deformation process (Section 4.2). At present, the VPSC model cannot fully simulate the non-uniform deformation and recrystallization during the material deformation process, which may also be the main reason for the difference in details between the predicted results and the experimental results. The error of the prediction result of the texture evolution trend of AA7075 during hot compression deformation by the improved VPSC model is allowable in the study. Therefore, the improved VPSC model is validated to predict the texture evolution of AA7075 during hot compression deformation.

5.2. Analysis of Prediction Results of the Improved VPSC Model

Comparing the prediction results of the model with the experimental results show that the IPF predicted by the improved VPSC model is mainly composed of <011> + <113> fiber texture (a few are <011> + <115> fiber textures), while the main fiber textures in the experimental IPF are <011> + <112>, but the maximum intensity of both are close to each other, and both are <011> fiber texture. In the IPF from the experiment, the texture intensity of <011> + <112> fiber first increases and then decreases with the increase in deformation temperature, but there is no certain regularity between the fiber texture intensity and the amount of deformation. The partition fraction of <011> + <113> fiber predicted by the improved VPSC model increases with the deformation amount and temperature increase. These predicted results are consistent with the fiber texture evolution obtained from the experimental results, the improved VPSC model can well predict the fiber texture evolution trend of AA7075.
Further analysis of the texture composition reveals that the ODF predicted by the improved VPSC model mainly contains six types of textures: Copper {112} <111>, R {124} <211>, Cube {001} <100>, Goss {011} <100>, Brass {011} <211>, and {011} <111>. Among them, the intensity of Copper {112} <111> and {011} <111> textures is higher than the other textures, which is consistent with the experimental results of ODF. The intensity and proportion of Cube {001} <100>, R {124} <211>, Goss {011} <100>, and Brass {011} <211> in the ODF predicted by the improved VPSC model are higher than the experimental results, but the maximum intensity distribution of each main texture is consistent with the experimental results. In the predicted results, the texture intensity of Copper {112} <111>, Goss {011} <100>, and {011} <1 1 ¯ 1> increase with the increase in strain rate, which is consistent with the experimental results. According to the prediction, the texture intensity decreases with the increase in deformation temperature and increases with the increase in strain rate. These trends are also consistent with the experimental results.

6. Conclusions

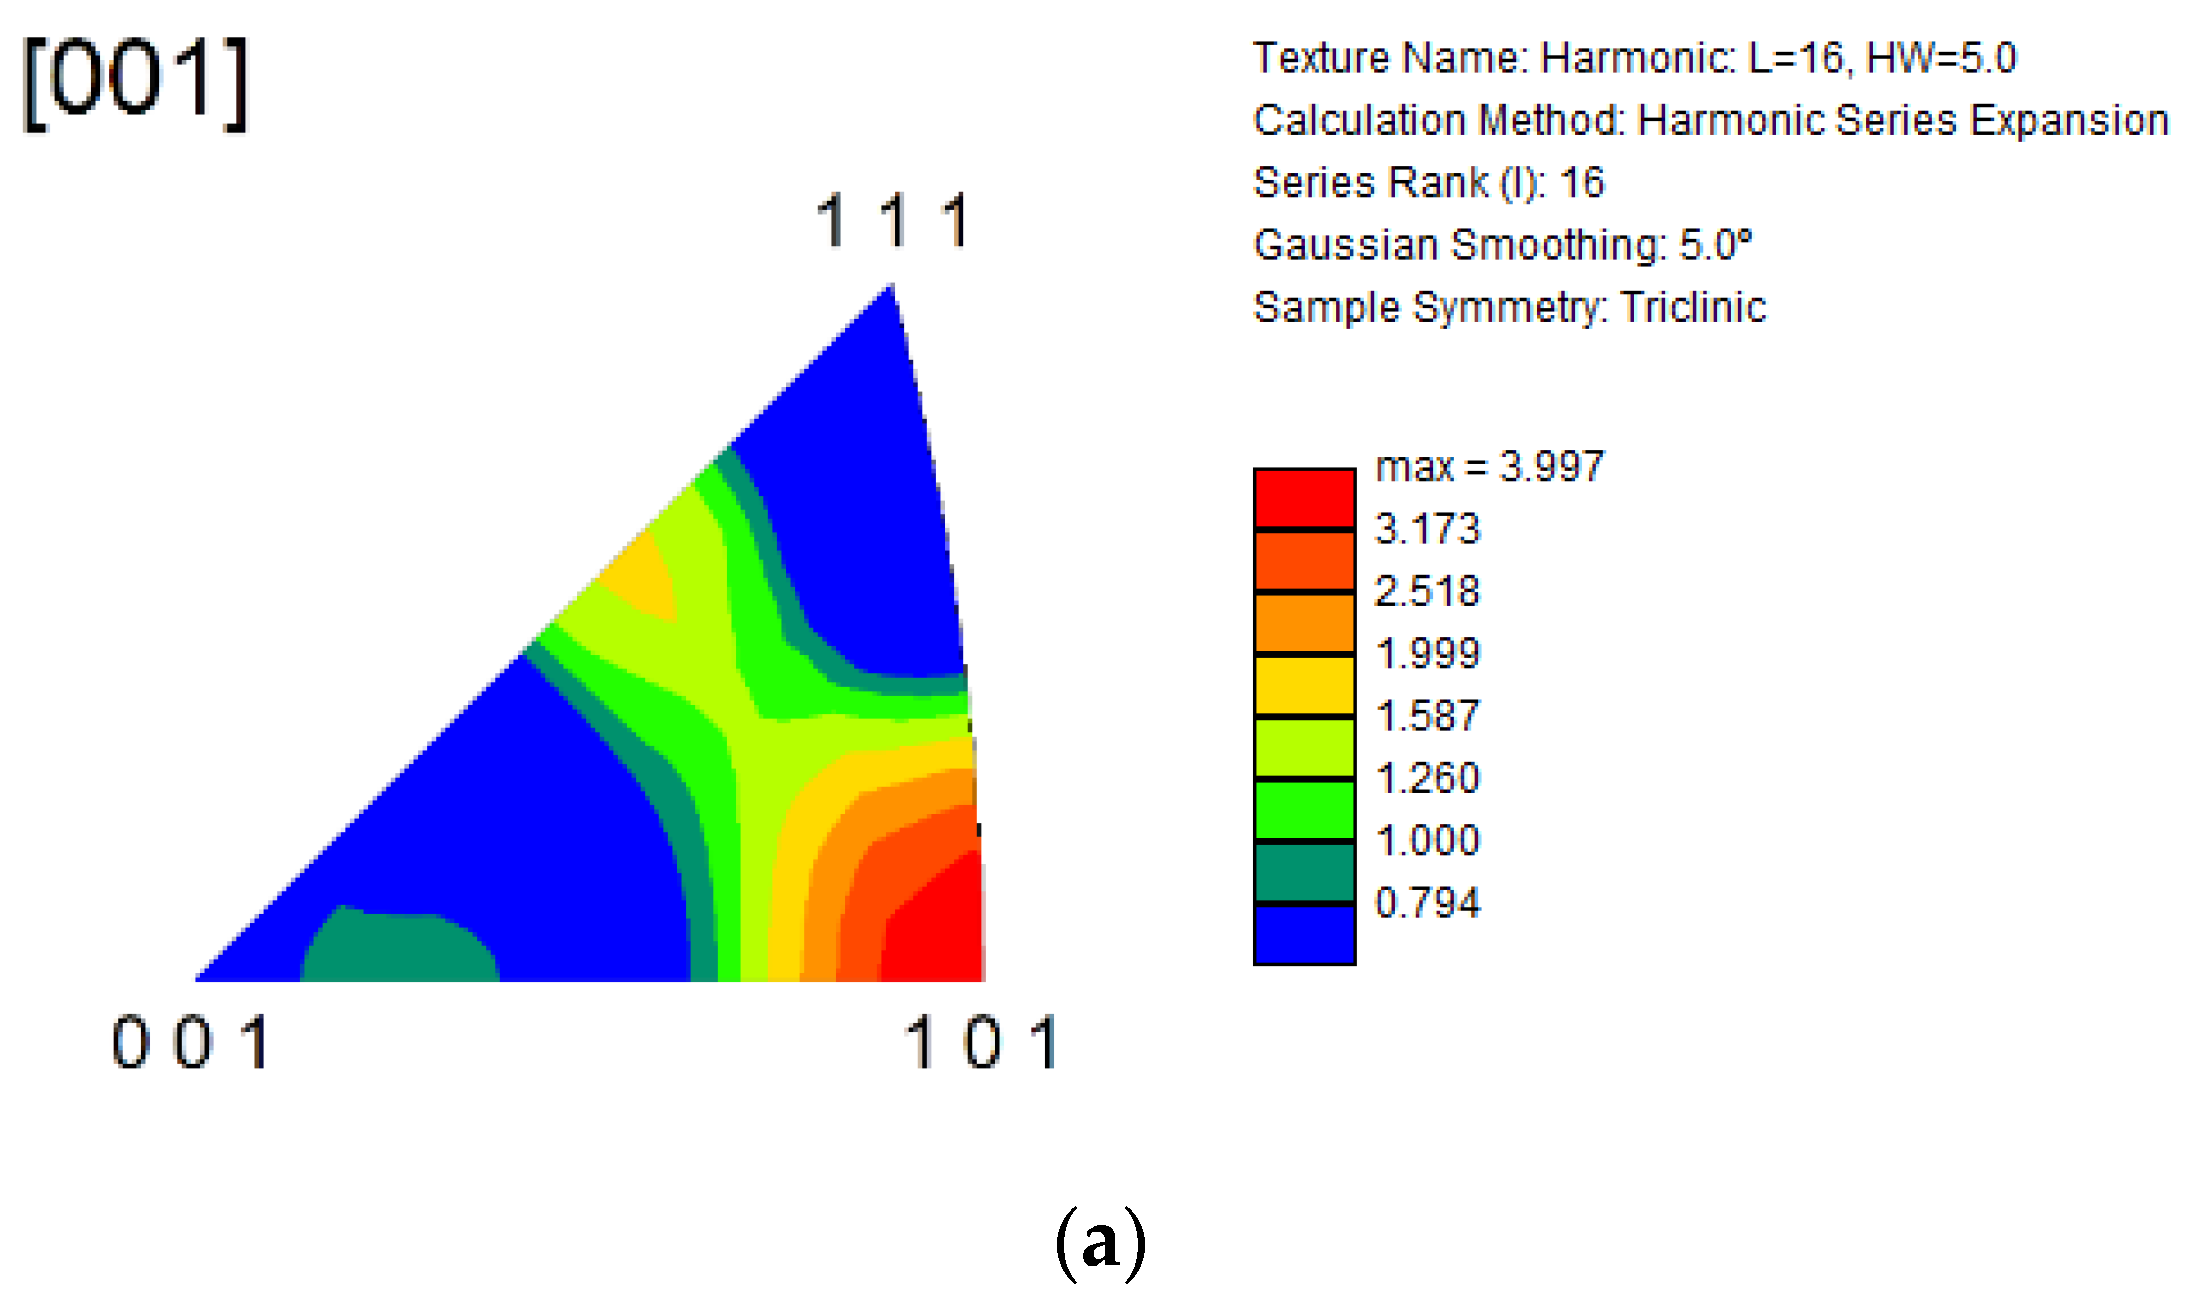
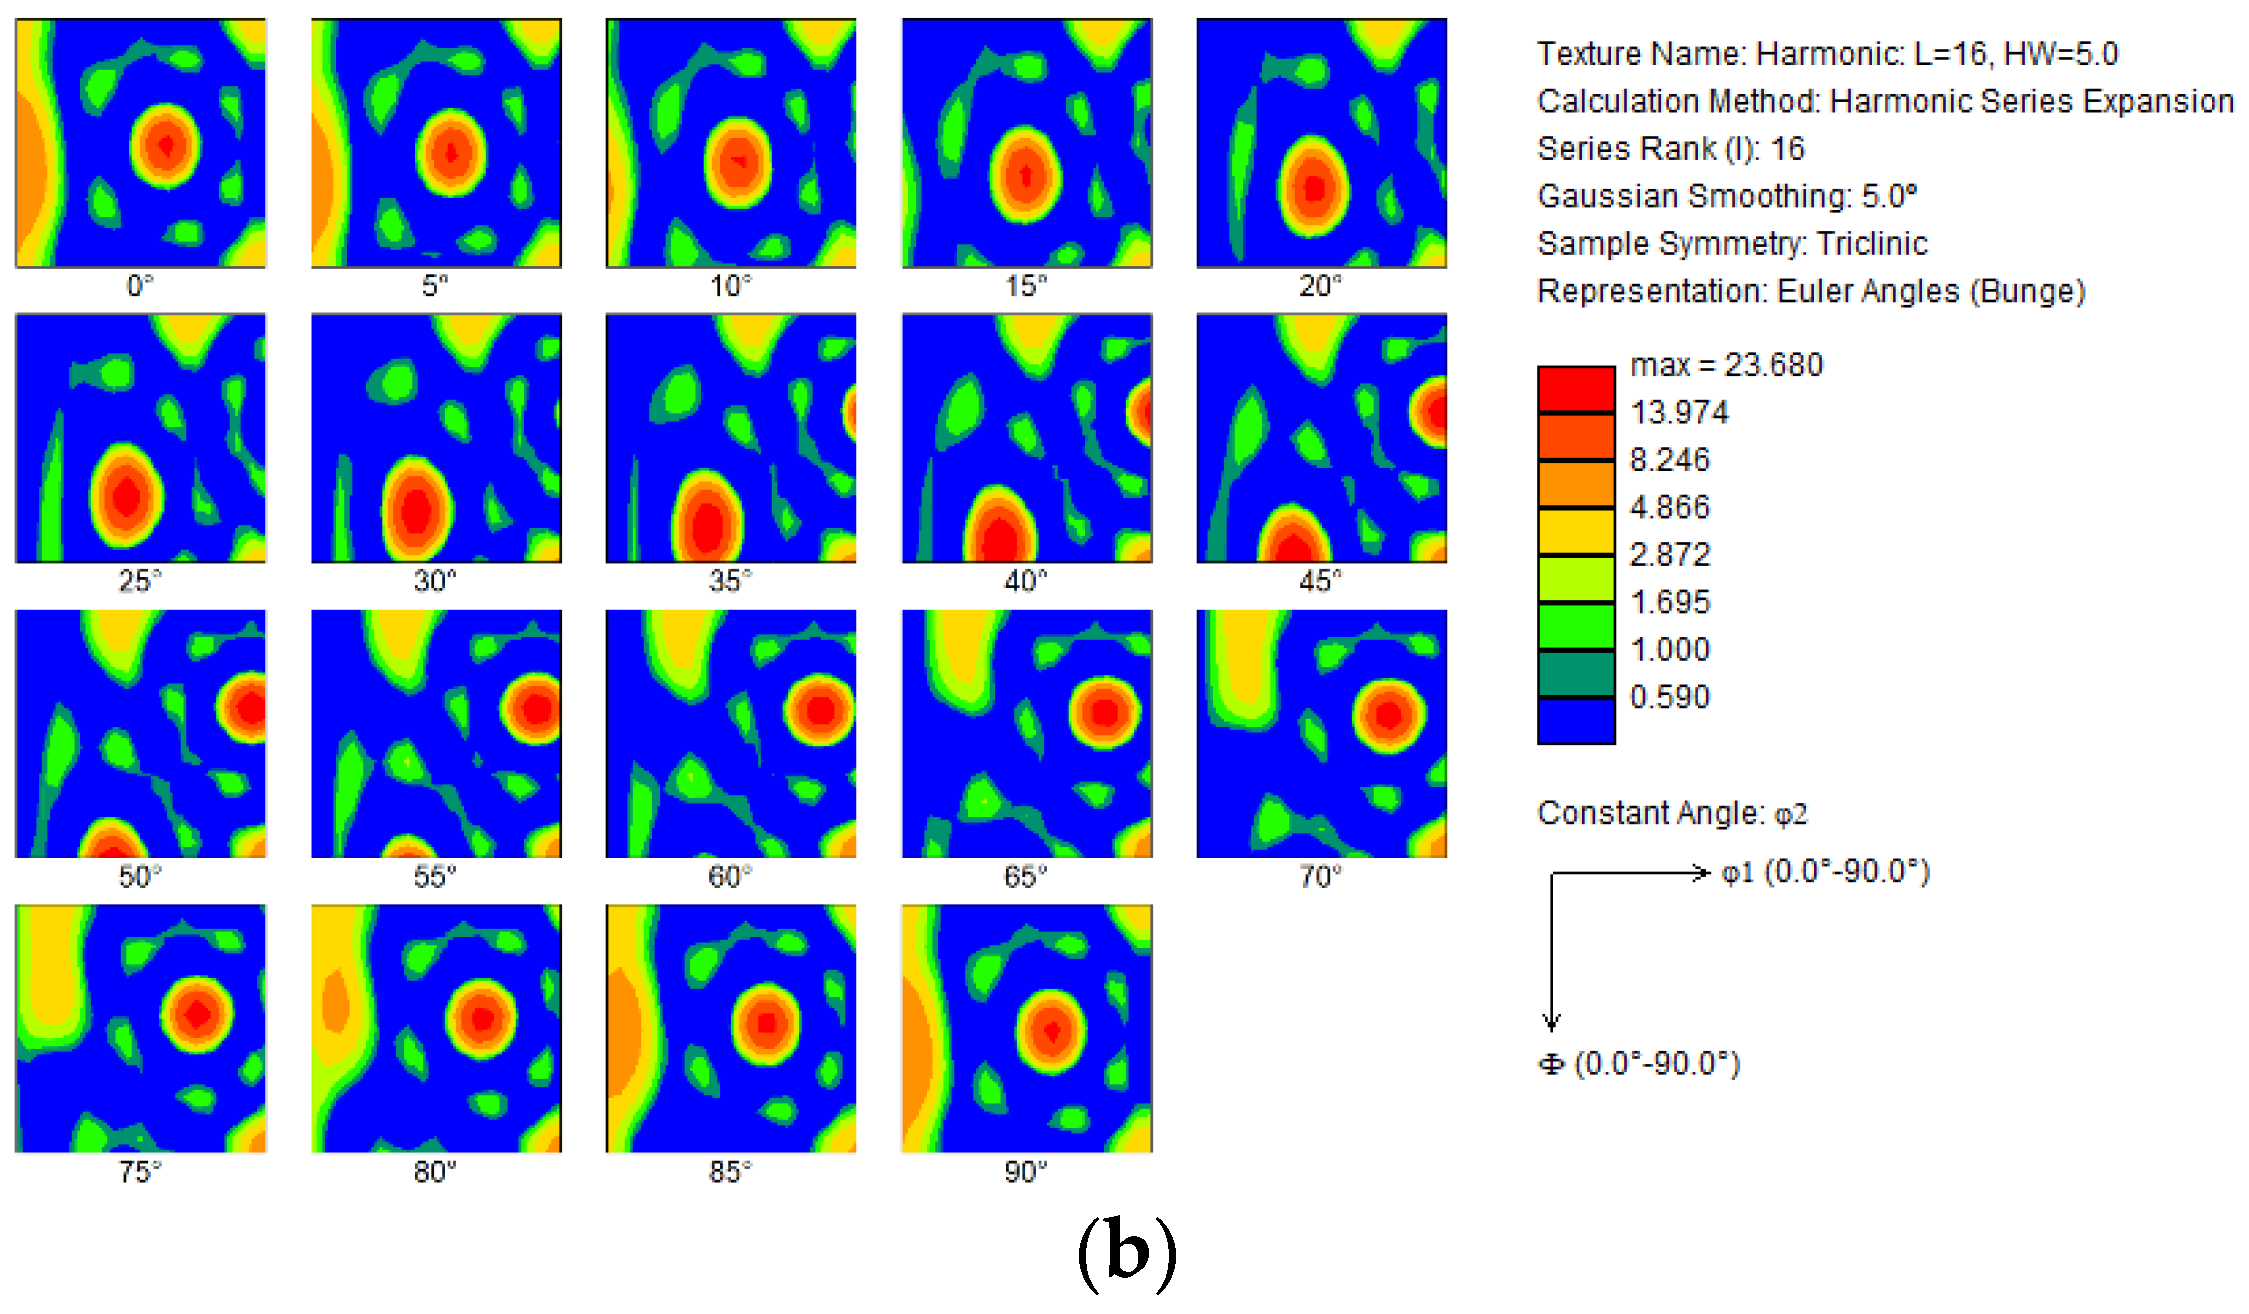
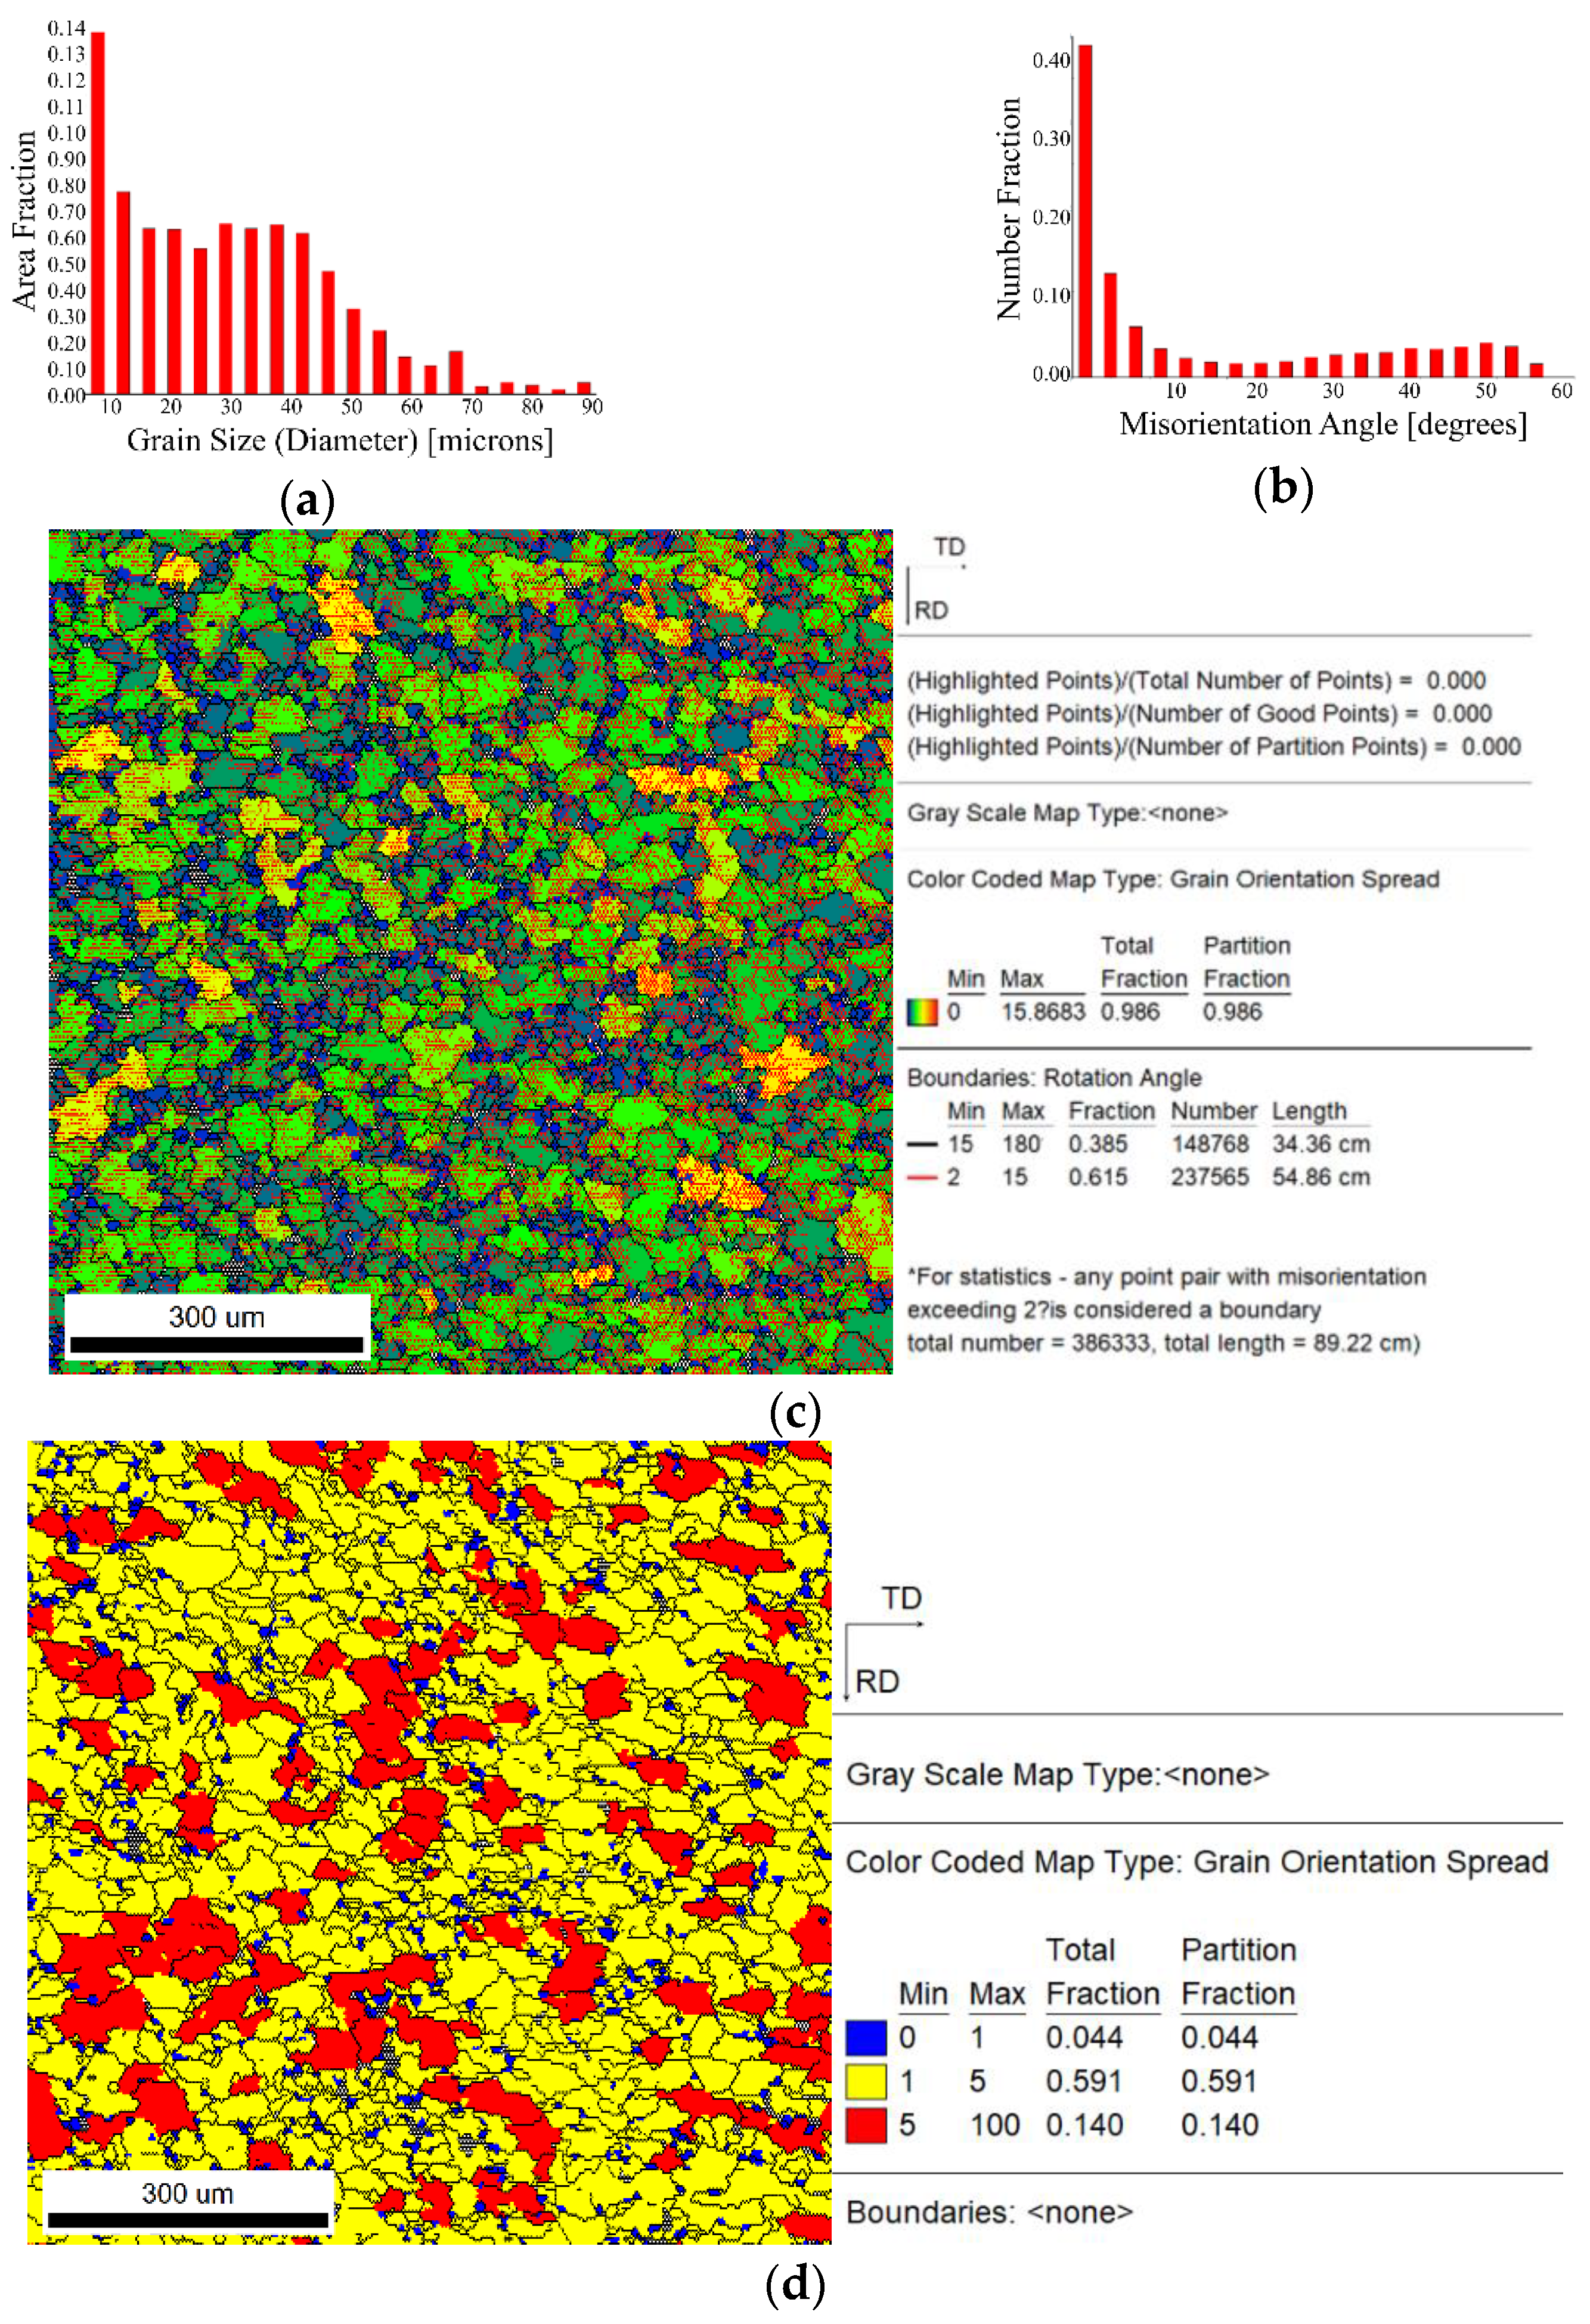
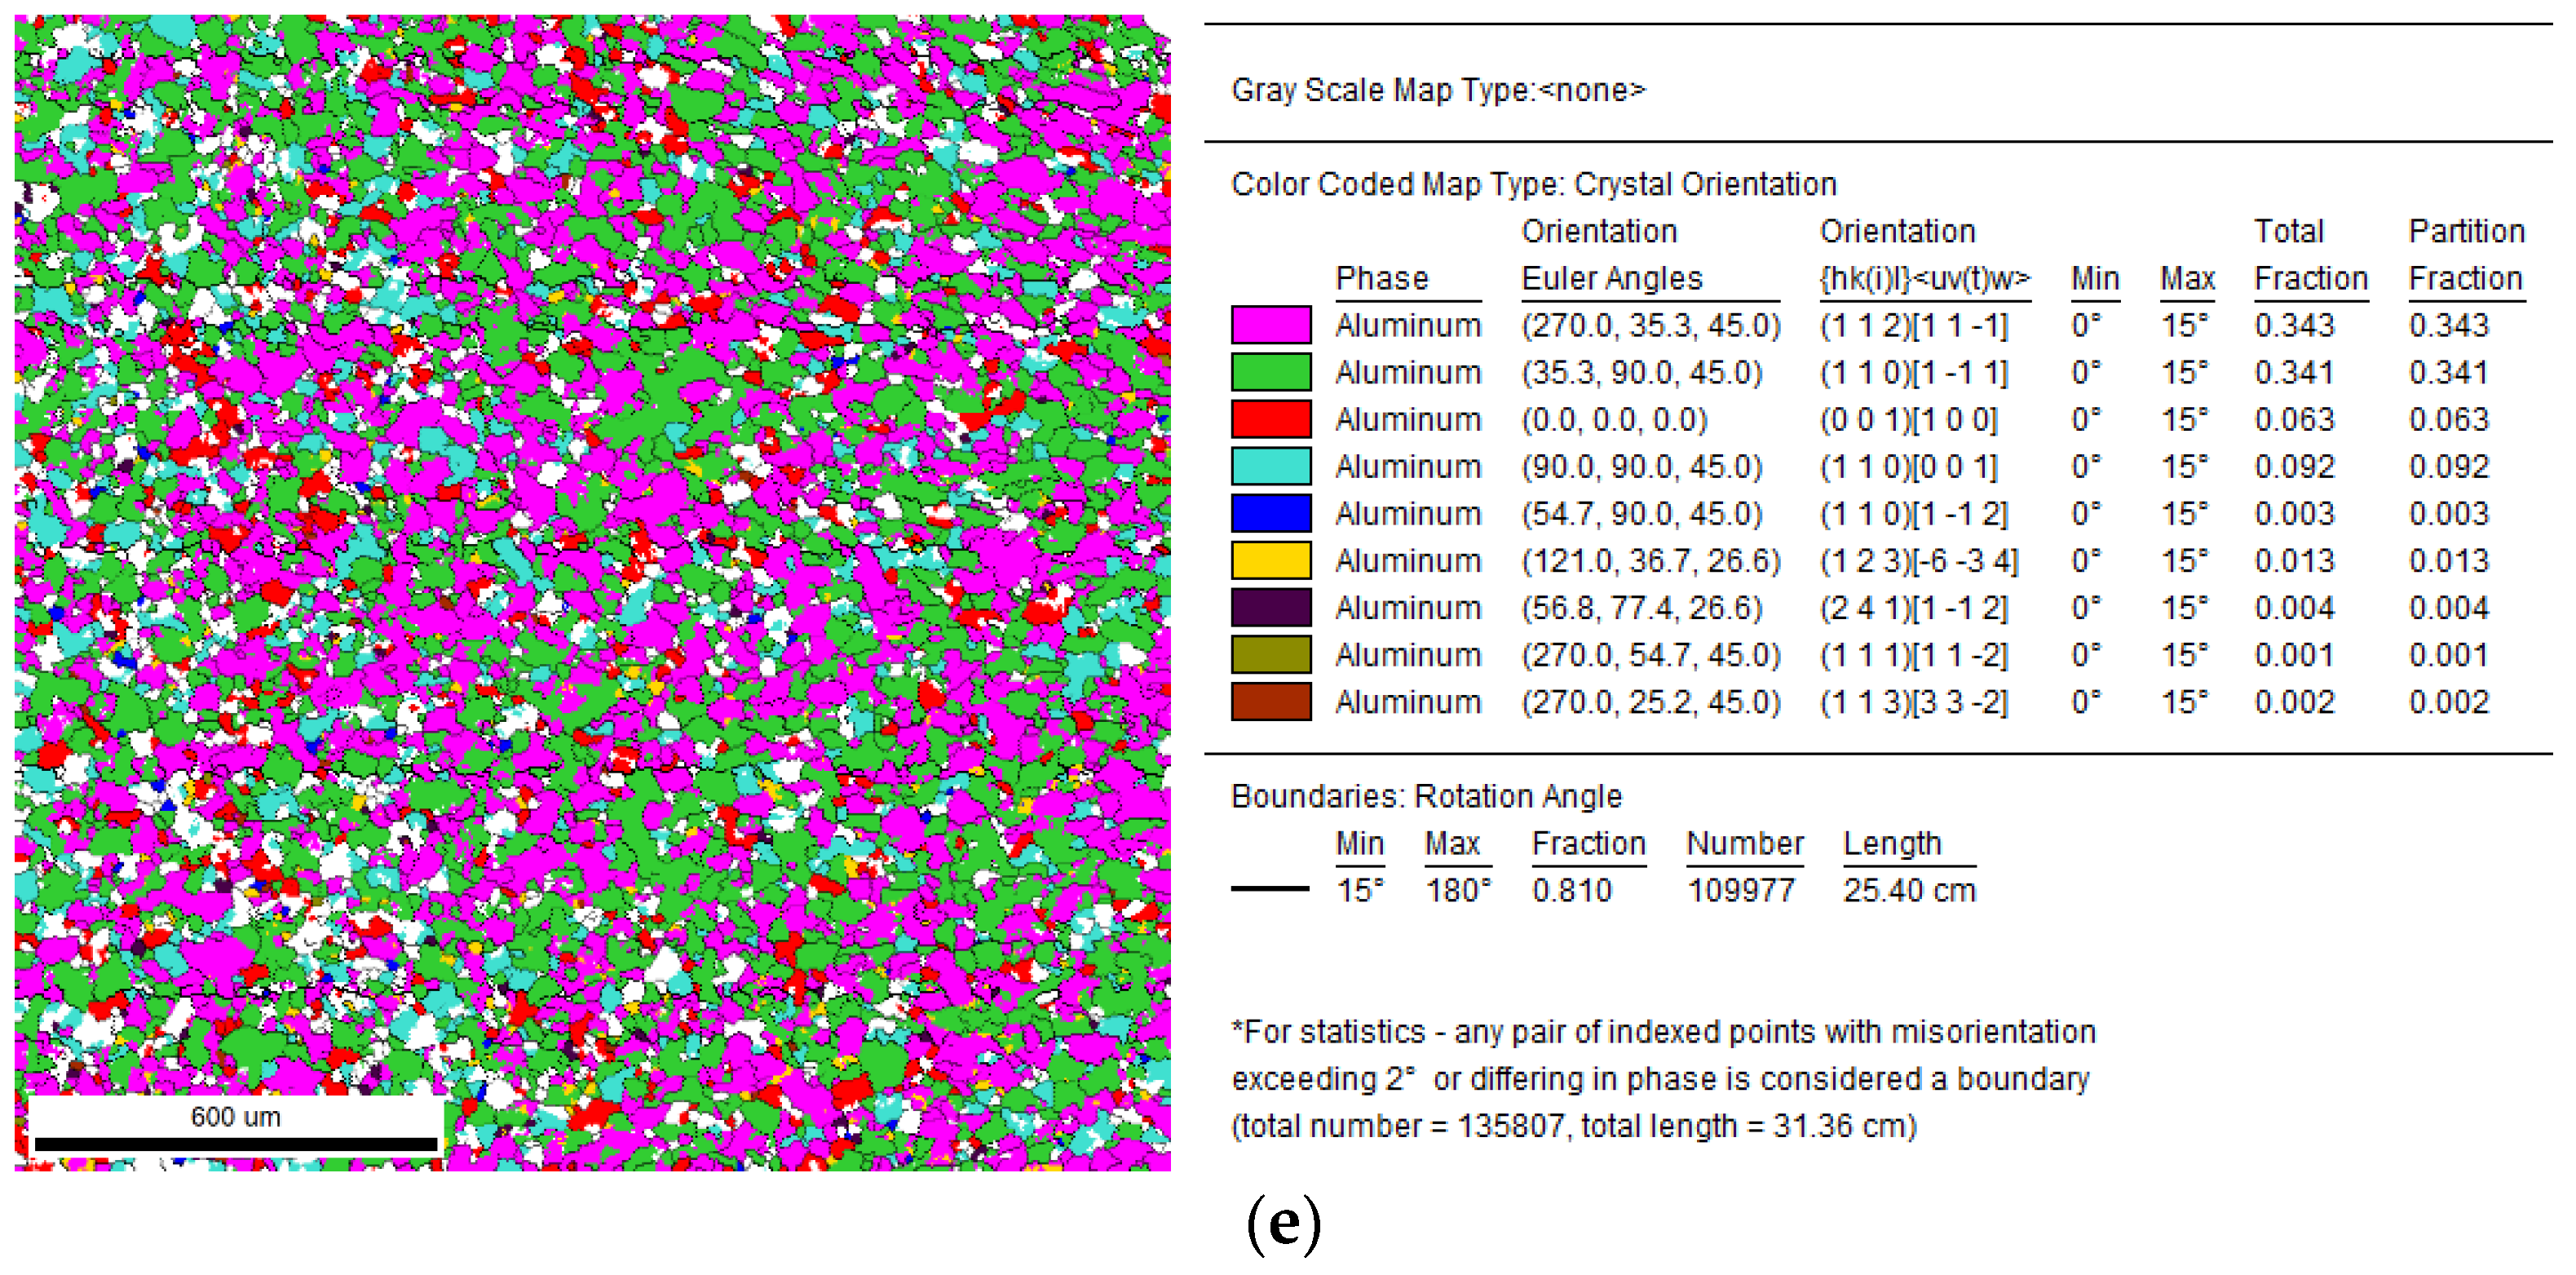
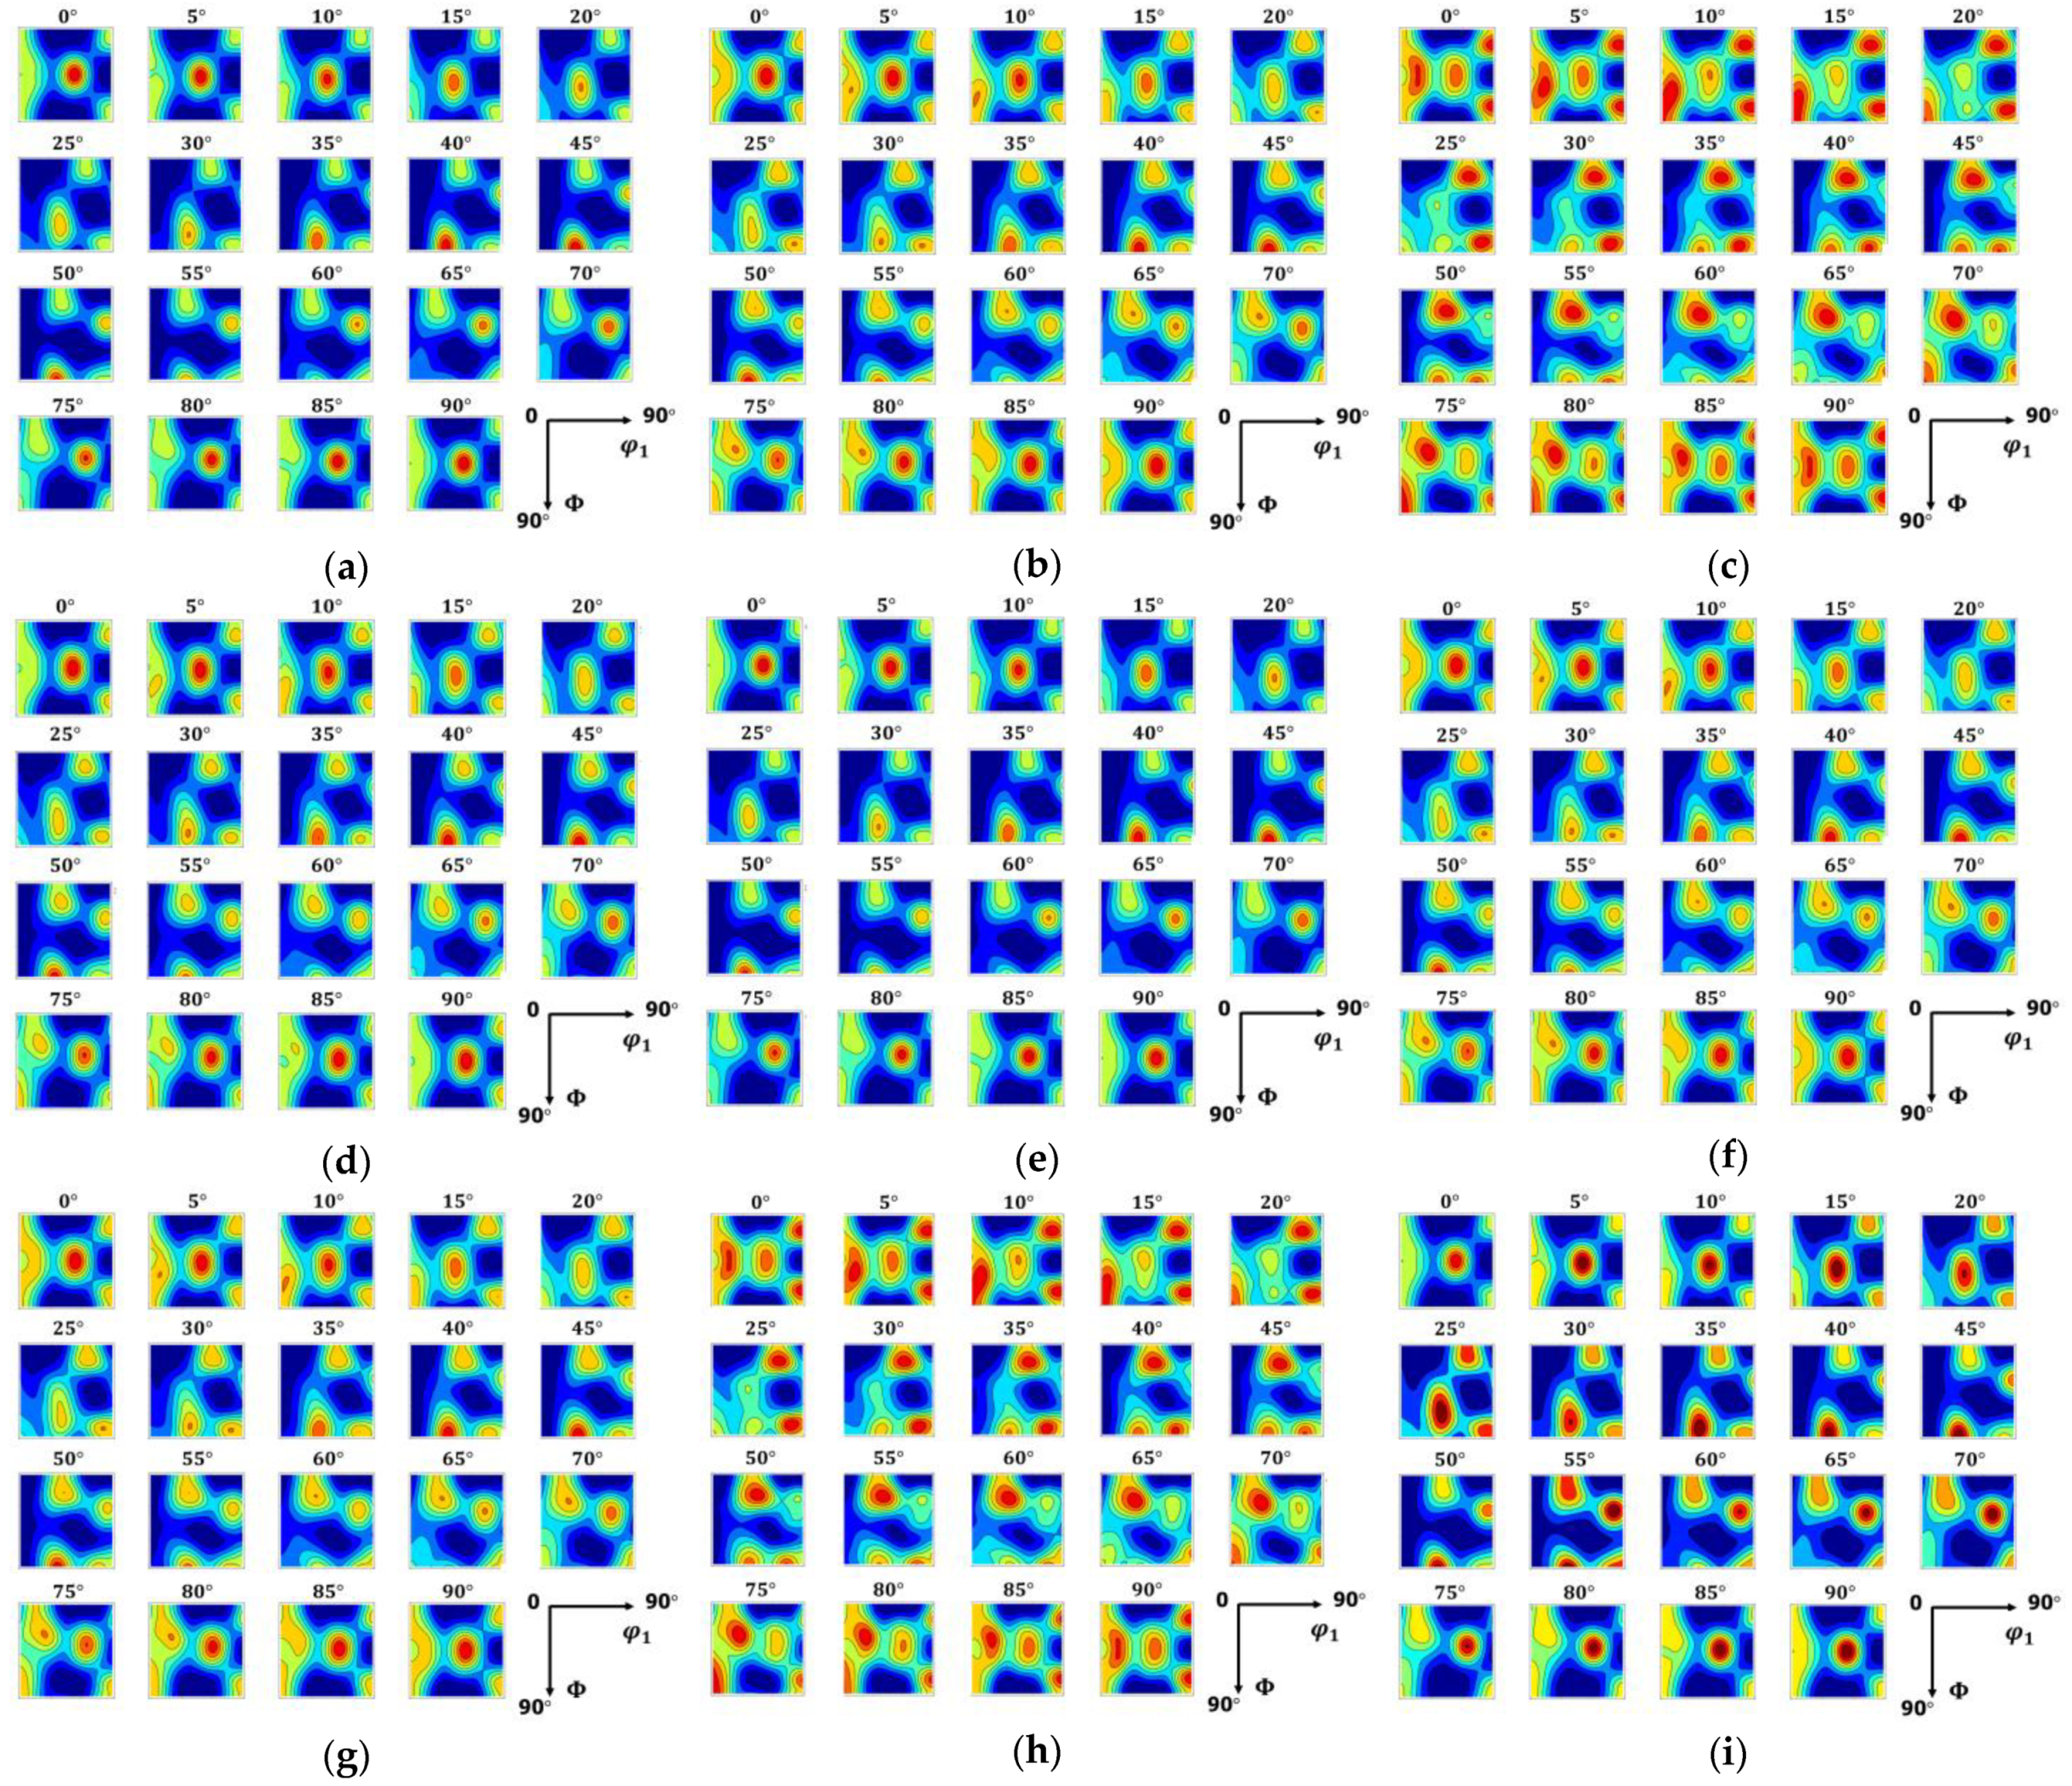
  • Before hot compression, the main components of the texture of AA7075 bars consist of Cube {001} <100>, Goss {011} <100>, Copper {112} < 111 >, {011} <1 1 ¯ 1>, and <011> + <112> fiber textures. It is found that the grain refines continuously, and the fiber structure and grain fragmentation occur with the increase in deformation. When the deformation temperature is higher than 400 ° C , fine equiaxed grains begin to appear. When the strain rate is 0.01 s 1 , the grain boundaries are clear, and the grains are fine and uniform. When the strain rate increases to 1 s 1 , the grain boundary tends to be blurred, and the non-uniformity of grain deformation increases. At higher temperatures (400 °C and 450 °C), the number and size of fine equiaxed grains decrease with the increase in strain rate.
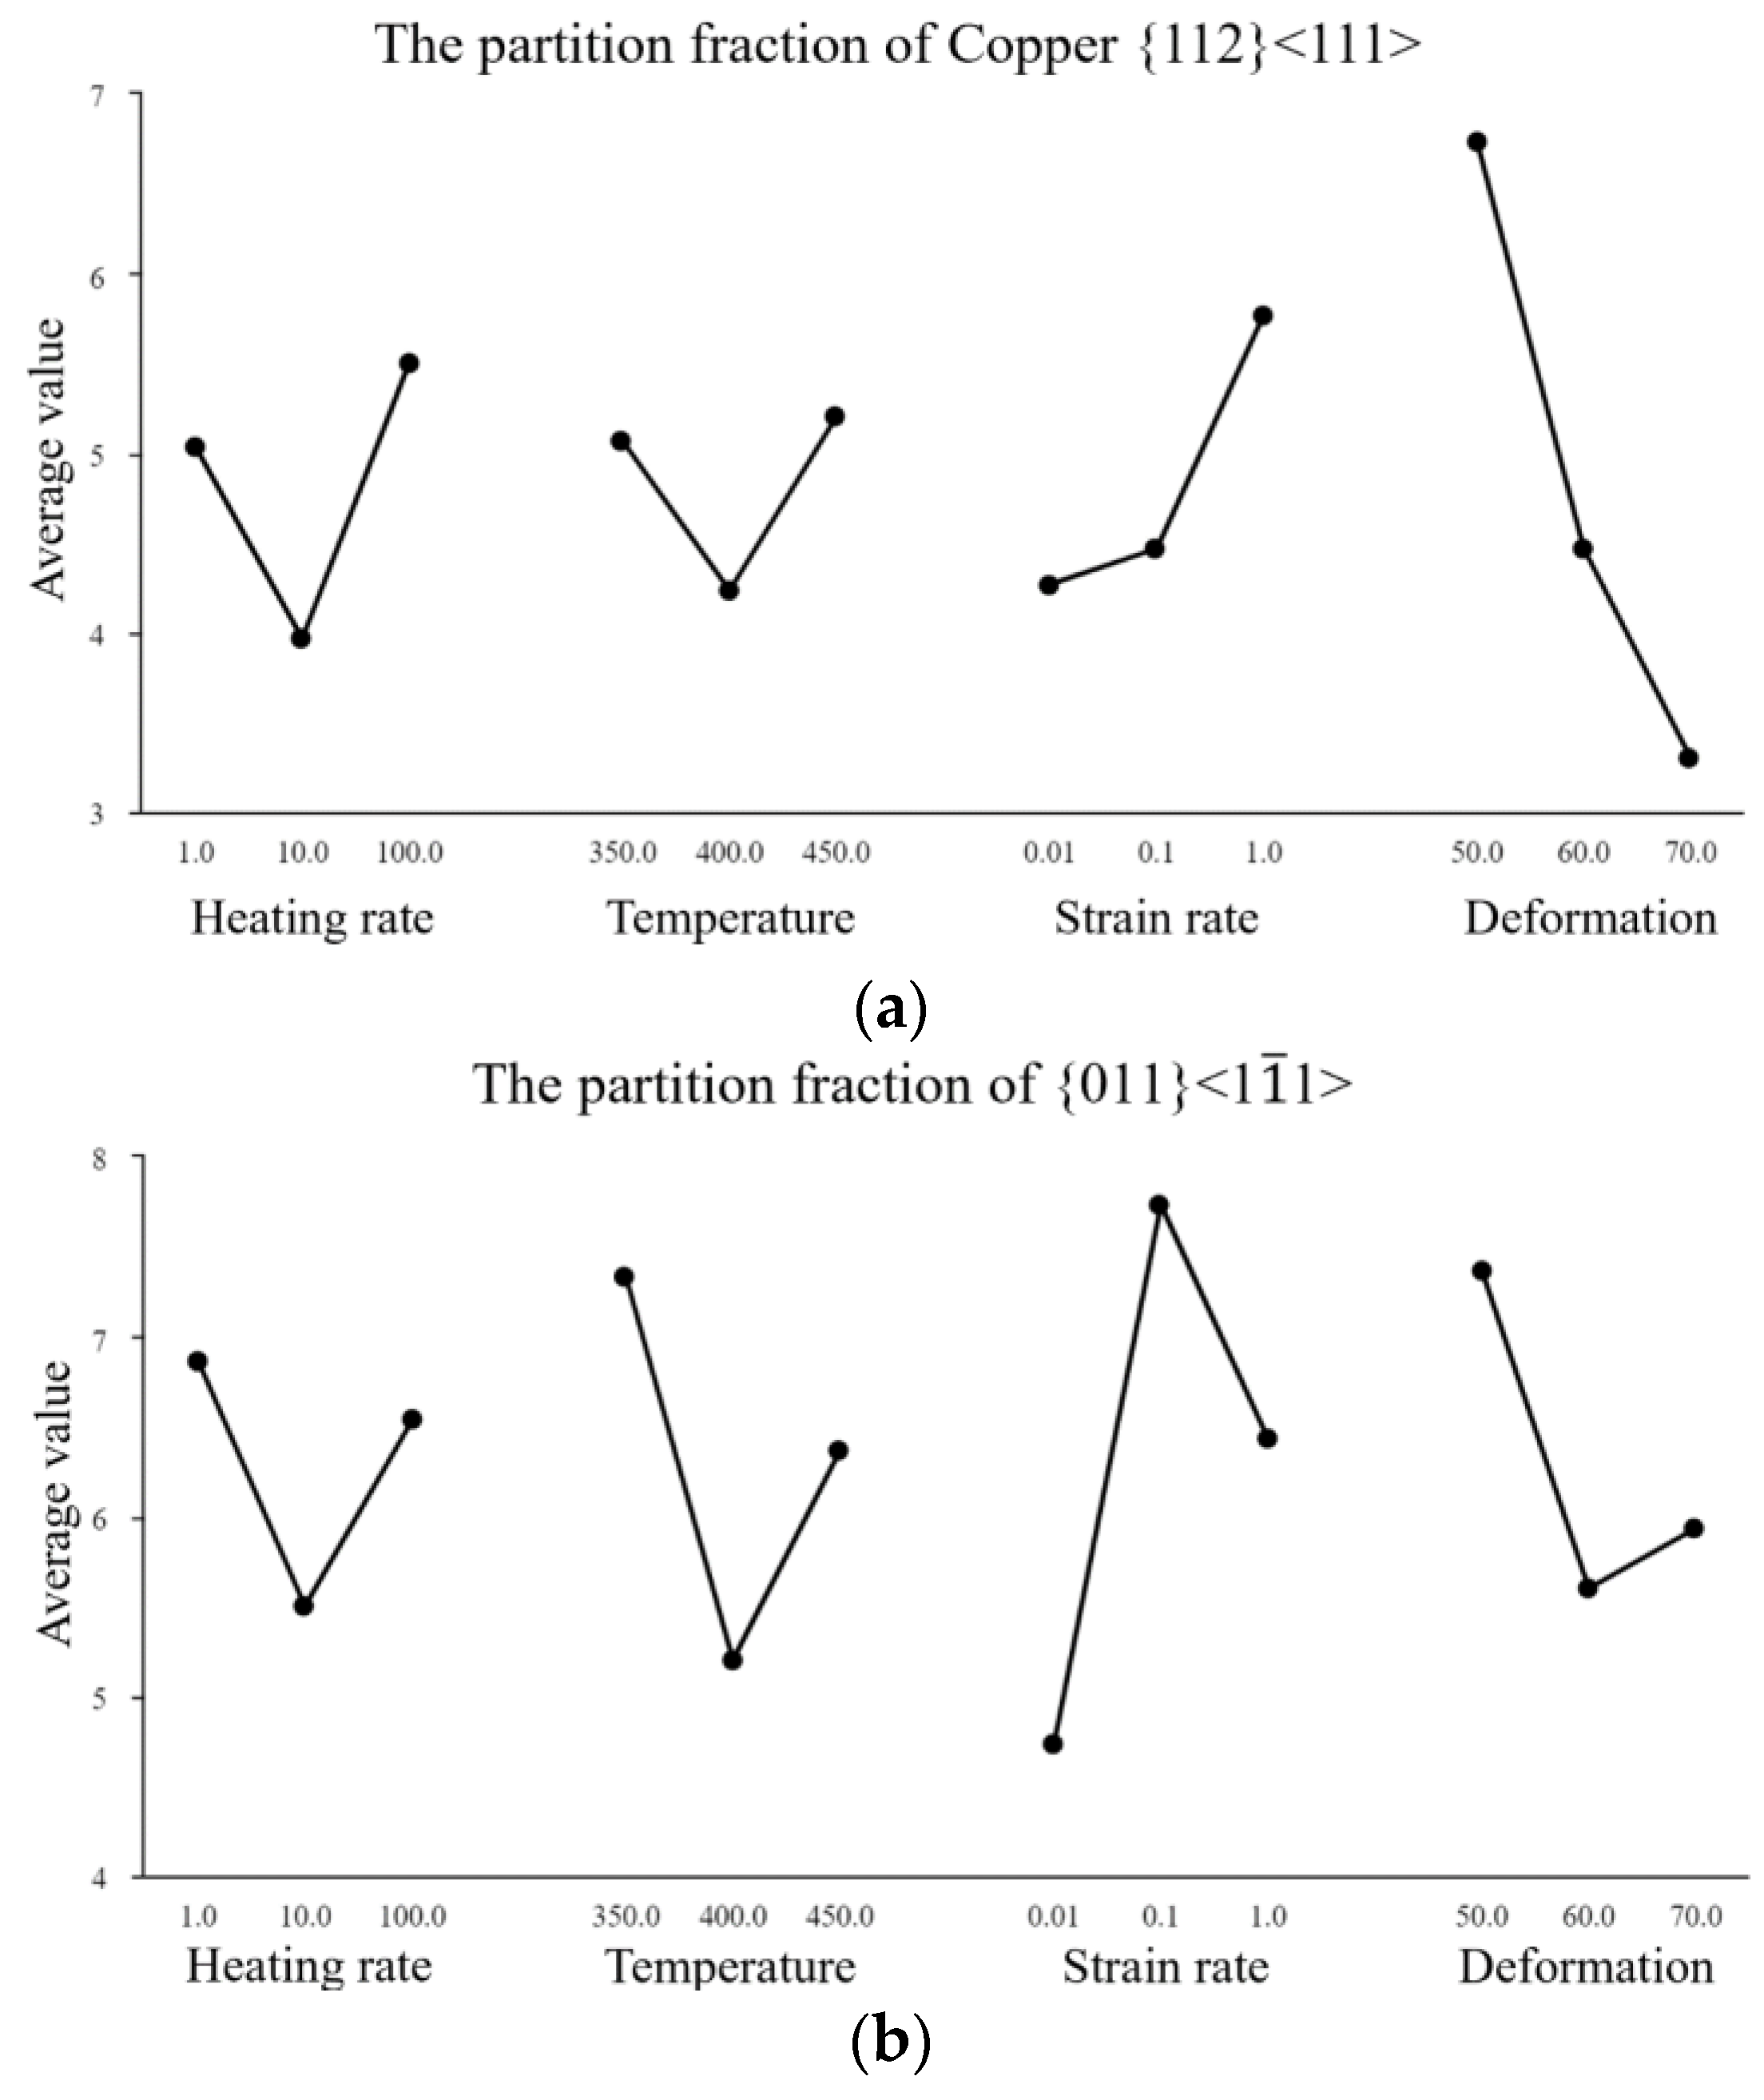
  • The increase in deformation can promote the formation of Cube {001} <100> texture to some extent. With the increase in deformation, the partition fraction of Copper {112} <111> texture decreases significantly. It is found that the Cube {001} <100> texture partially changes to Goss {011} <100> texture when the temperature is above 400 ° C . The partition fraction of both Copper {112} <111> and {011} <1 1 ¯ 1> decrease at first and the increase with the increase in temperature. The intensity of texture increases with the increase in strain rate. The partition fraction of Copper {112} <111> increases with the increase in strain rate, while that of {011} <1 1 ¯ 1> increases at first and then decreases. The intensity of Copper {112} <111> and {011} <1 1 ¯ 1> increases with the increase in heating rate, and the partition fraction decreases at first and then increases.
  • The deviation between the predicted results of the improved VPSC model and the experimental results is in the acceptable range. The texture distribution and maximum intensity of the predicted results agree with the experimental results, which proves that the improved model used in this work is suitable for predicting the texture evolution of AA7075 during hot compression. In follow-up research, the validity of the model can be further verified by using a larger span of experimental parameters and compared with the current research results.

Author Contributions

Conceptualization, S.Y.L.; funding acquisition, J.M.; investigation, M.Z.; writing—original draft, S.Z. All authors have read and agreed to the published version of the manuscript.

Funding

This work is supported by Sponsored by Shanghai Pujiang Program [20PJ1404700] and Young Scientific Research Team Cultivation Program of SUES [QNTD202112].

Data Availability Statement

The datasets generated and analyzed during the current study are available from the corresponding author on reasonable request.

Conflicts of Interest

The authors declare no conflict of interest.

References

  1. Khomutov, M.G.; Pozdniakov, A.V.; Churyumov, A.Y.; Barkov, R.Y.; Solonin, A.N.; Glavatskikh, M.V. Flow Stress Modelling and 3D Processing Maps of Al4.5Zn4.5Mg1Cu0.12Zr Alloy with Different Scandium Contents. Appl. Sci. 2021, 11, 4587. [Google Scholar] [CrossRef]
  2. Ruhaizat, N.E.; Yusuf, N.K.; Lajis, M.A.; Al-Alimi, S.; Shamsudin, S.; Tukiat, I.S.T.; Zhou, W. Effect of Direct Recycling Hot Press Forging Parameters on Mechanical Properties and Surface Integrity of AA7075 Aluminum Alloys. Metals 2022, 12, 1555. [Google Scholar] [CrossRef]
  3. Muñoz, J.A.; Khelfa, T.; Duarte, G.A.; Avalos, M.; Bolmaro, R.; Cabrera, J.M. Plastic Behavior and Microstructure Heterogeneity of an AA6063-T6 Aluminum Alloy Processed by Symmetric and Asymmetric Rolling. Metals 2022, 12, 1551. [Google Scholar] [CrossRef]
  4. Zhou, G.; Liu, B.; Song, W.; Li, H.; Kuang, J.; Qiu, M. Controlling Welding Residual Stress and Distortion of High-Strength Aluminum Alloy Thin Plates by a Trailing Hybrid High-Speed Gas Fluid Field. Materials 2022, 15, 6451. [Google Scholar] [CrossRef] [PubMed]
  5. Chen, Z.; Duan, Y.; Wang, P.; Qian, H. Residual Stress Redistribution Analysis in the Repair Welding of AA6082-T6 Aluminum Alloy Joints: Experiment and Simulation. Materials 2022, 15, 6399. [Google Scholar] [CrossRef] [PubMed]
  6. Wang, C.; Park, N.; Bunge, H. Orientation relation and texture control principle of phase transformation strain of shape memory alloy. Shanghai Met. Non-Ferr. Fascicles 1993, 5, 24–27. [Google Scholar]
  7. Surya, R.; Brendan, R.; Donohu; Saiyi, L. Modeling Texture Evolution in Equal Channel Angular Extrusion Using Crystal Plasticity Finite Element Models. Int. J. Plast. 2008, 25, 768–779. [Google Scholar]
  8. Kumar, P.; Singh, A. Experimental and numerical investigation of Strain Rate Effect on low cycle fatigue behaviour of AA 5754 Alloy. Iop Conf. Ser. Mater. Sci. Eng. 2018, 346, 012018. [Google Scholar] [CrossRef]
  9. Guo, X. Study on the Large Deformation Behavior of Polycrystalline Materials Based on Polycrystalline Plasticity Model. Ph.D. Thesis, China University of Mining and Technology, Xuzhou, China, 2015. [Google Scholar]
  10. Raja, N.; Daniel, B. Microstructural evolution of Al-7.3Zn-2.2Mg-2Cu (Al7068) alloy in T6 condition during isothermal compression using 3-dimensional processing map. J. Alloys Compd. 2022, 902, 163690. [Google Scholar] [CrossRef]
  11. Yuan, Q. Study on High Temperature Plastic Deformation Mechanism of Hot Extruded 1060 Aluminum Alloy. Ph.D. Thesis, Shanghai Jiaotong University, Shanghai, China, 2020. [Google Scholar]
  12. Dong, Y. Experimental Study on Anisotropy and Constitutive Relation of AA6061 Aluminum Alloy. Ph.D. Thesis, Yanshan University, Qinhuangdao, China, 2020. [Google Scholar]
  13. Fan, Z. Study on Annealing Recrystallization Mechanism and Formability of AA6014 Aluminum Alloy. Ph.D. Thesis, Chongqing University, Chongqing, China, 2018. [Google Scholar]
  14. Miller, V.; Semiatin, S.; Szczepanski, C. Optimization of Vpsc Model Parameters for Two-phase Titanium Alloys: Flow Stress Vs Orientation Distribution Function Metrics. Metall. Mater. Trans. 2018, 49, 3624–3636. [Google Scholar] [CrossRef]
  15. Takajo, S.; Tome, C.; Vogel, S. Texture Simulation of a Severely Cold Rolled Low Carbon Steel Using Polycrystal Modeling. Int. J. Plast. 2018, 109, 137–152. [Google Scholar] [CrossRef]
  16. Zhang, B.; Li, S.; Wang, H. Investigation of the In-plane Mechanical Anisotropy of Magnesium Alloy Az31b-o By Vpsc–tdt Crystal Plasticity Model. Materials 2019, 12, 1590. [Google Scholar] [CrossRef] [PubMed] [Green Version]
  17. Taylor, G.; Elam, C. The Plastic Extension and Fracture of Aluminium Crystals. In Proceedings of the Royal Society of London; Series A, Containing Papers of a Mathematical and Physical Character; Royal Society: London, UK, 1925; Volume 108. [Google Scholar]
  18. Lebensohn, R.; Tome, A. Self-consistent Anisotropic Approach for the Simulation of Plastic Deformation and Texture Development of Polycrystals: Application to Zirconium Alloys. Acta Metall. Mater. 1993, 41, 2611–2624. [Google Scholar] [CrossRef]
  19. Tuner, P.; Tome, C. Self-consistent Modeling of Visco-elastic Polycrystals: Application to Irradiation Creep and Growth. J. Mech. Phys. Solids 1993, 41, 1191–1211. [Google Scholar] [CrossRef]
  20. Kroner, E. Zur Plastischen Verformung Des Vielkristalls. Acta Metall. 1961, 9, 155–161. [Google Scholar] [CrossRef]
  21. Hill, R. Continuum Micro-mechanics of Elastoplastic Polycrystals. Pergamon 1965, 13, 89–101. [Google Scholar] [CrossRef]
  22. Mercier, S.; Molinari, A. Homogenization of Elastic-visco-plastic Heterogeneous Materials: Self-consistent and Mori-tanaka Schemes. Int. J. Plast. 2009, 25, 1024–1048. [Google Scholar] [CrossRef]
  23. Tiamiyu, A.; Vahid, T.; Szpunar, J. Effects of Grain Refinement on the Quasi-static Compressive Behavior of Aisi 321 Austenitic Stainless Steel: Ebsd, Tem, and Xrd Studies. Int. J. Plast. 2018, 107, 79–99. [Google Scholar] [CrossRef]
  24. Zecevic, M.; Lebensohn, R.; Mccabe, R. Modeling of Intragranular Misorientation and Grain Fragmentation in Polycrystalline Materials Using the visco-plastic Self-consistent Formulation. Int. J. Plast. 2018, 109, 193–211. [Google Scholar] [CrossRef]
  25. Zhang, B. Study on Plastic Deformation Mechanism of Magnesium Alloy Based on Viscoplastic Self-Consistent Model. Ph.D. Thesis, China University of Mining and Technology, Beijing, China, 2019. [Google Scholar]
  26. Zang, Q. Study on Deformation Behavior, Microstructure Evolution and Mechanical Properties of Al-Zn-Mg-Cu Alloy with High Zn Content. Ph.D. Thesis, Shandong University, Jinan, China, 2019. [Google Scholar]
  27. Chen, G. Study on Hot Deformation Characteristics and Application of Ultra-High Strength Aluminum Alloy Al-12Zn-2.4Mg-1.2Cu. Ph.D. Thesis, Central North University, Minneapolis, MN, USA, 2016. [Google Scholar]
  28. Qiu, Y. 7A85 Aluminum Alloy High Temperature Hot Compression Rheological behavior and Microstructure Evolution. Ph.D. Thesis, Hunan University, Changsha, China, 2015. [Google Scholar]
  29. Tian, Z.; Yi, Z.; Liu, H. Effect of solution treatment on microstructure and mechanical properties of Al-5.8Cu-0.6Mg-0.6Ag-0.3Nd alloy. Chin. J. Nonferrous Met. 2015, 25, 2326–2334. [Google Scholar]
  30. Liu, W.; Liang, Y.; Zhang, Z. Effect of single-stage and double-stage solution heat treatment on properties of AA7085 alloy. Hot Work. Technol. 2013, 42, 161–168. [Google Scholar]
  31. Xiao, D.; Chen, K.; Luo, W. Effect of solid solution heat treatment on microstructure and properties of AA7085 aluminum alloy. Rare Met. Mater. Eng. 2010, 39, 494–497. [Google Scholar]
Figure 1. Clamping diagram of the hot compression test sample.
Metals 12 01648 g001
Figure 2. Schematic representation of the changes in the sample before and after hot pressing.
Metals 12 01648 g002
Figure 3. Schematic representation of the EBSD of single crystal planes.
Metals 12 01648 g003
Figure 4. The geometric meaning of Voce hardening parameters.
Metals 12 01648 g004
Figure 5. Stress–strain curve of AA7075 after hot deformation. (The subgraph captions (ai) correspond to the experimental groups (1) to (9) in Table 2, respectively).
Metals 12 01648 g005
Figure 6. Micro−texture of AA7075 in its initial state. (a) IPF; (b) ODF.
Metals 12 01648 g006aMetals 12 01648 g006b
Figure 7. Microstructure of AA7075 in initial state. (a) Grain size of AA7075 in the initial state; (b) misorientation angle of AA7075 in the initial state; (c) grain boundary distribution of AA7075 in initial state; (d) GOS diagram of AA7075 in initial state; (e) crystal orientation distribution of AA7075 in initial state.
Metals 12 01648 g007aMetals 12 01648 g007b
Figure 8. Boundary angle distribution maps after hot compression deformation. (The subgraph captions (ai) correspond to the experimental groups (1) to (9) in Table 2, respectively).
Metals 12 01648 g008aMetals 12 01648 g008b
Figure 9. The GOS diagrams obtained from the thermal compression deformation experiment. (The subgraph captions (ai) correspond to the experimental groups (1) to (9) in Table 2, respectively).
Metals 12 01648 g009
Figure 10. Sensitivity analysis of textures to hot compression deformation parameters. (a) Cooper {112} <111>; (b) {011} <1 1 ¯ 1>.
Metals 12 01648 g010
Figure 11. The IPF from the experiment after deformation by hot compression. (The subgraph captions (ai) correspond to the experimental groups (1) to (9) in Table 2, respectively).
Metals 12 01648 g011
Figure 12. The experimentally determined ODF diagram after hot compression deformation. (The subgraph captions (ai) correspond to the experimental groups (1) to (9) in Table 2, respectively).
Metals 12 01648 g012
Figure 13. IPF of hot compression deformation simulated by VPSC. (The subgraph captions (ai) correspond to the experimental groups (1) to (9) in Table 2, respectively).
Metals 12 01648 g013aMetals 12 01648 g013b
Figure 14. ODF of hot compression deformation simulated by VPSC. (The subgraph captions (ai) correspond to the experimental groups (1) to (9) in Table 2, respectively).
Metals 12 01648 g014
Table 1. Chemical composition of AA7075.
ZnMgCuMnFeSiCrNiTiAl
5.672.801.640.300.250.090.220.050.06Balance
Table 2. Orthogonal experiment table.
No.Factors
Heating Rate
( ° C / s )
Temperature
( ° C )
Strain Rate
( s 1 )
Amount of
Deformation
(%)
113500.0150
214000.160
31450170
4103500.170
510400150
6104500.0160
7100350160
81004000.0170
91004500.150
Table 3. Material hardening parameters in simulation.
No.Hardening Parameter
τ o / MPa τ 1 / MPa θ o / MPa θ 1 / MPa
14.21810000
2217.512000.8
32.217.58001.2
44218000.6
53.82116000.1
62.67.52500.7
74.325.510000.7
85.58.55000
95.5910001
Table 4. Typical texture.
Name{hkl} <uvw> φ 1 , Φ ,   φ 2
Cube{001} <100>0, 0, 0
R-Cube{001} <110>45, 0, 45
Goss{011} <100>0, 45, 0
Copper{112} <111>90, 35, 45
Brass{011} <211>35, 45, 0
{111}{111} <110>0, 55, 45
{111}{111} <112>90, 55, 45
S{123} <634>59, 37, 63
R{124} <211>57, 29, 27
Table 5. The partition fraction of Copper {112} < 111 > and {011} <1 1 ¯ 1>.
No.FactorsPartition Fraction (%)
Heating Rate
( ° C / s )
Temperature
( ° C )
Strain Rate
( s 1 )
Amount of
Deformation
(%)
Copper
{ 112 }   < 111 >  
{ 011 }   < 1 1 ¯ 1 >
113500.01506.67.4
214000.1603.76.5
314501704.86.7
4103500.1702.37.6
5104001506.25.6
6104500.01603.43.3
71003501606.37.0
81004000.01702.83.5
91004500.1507.49.1
Publisher’s Note: MDPI stays neutral with regard to jurisdictional claims in published maps and institutional affiliations.

