Abstract
Bimetallic components welded by Ta and stainless steel have great promise for engineering applications, but there is relatively little relevant research. In this study, 0.6 mm-thick Ta and 304L stainless steel plates were laser welded, and the forming characteristics, microstructure, and mechanical properties of the welded joints were analyzed. First-principles calculations were also performed to explore the structural stabilization mechanisms of the two intermetallic compounds, TaFe2 and TaCr2, in terms of mechanical properties as well as electronic structure. The results showed that the weld surface was smooth and free from any defects. Fe-based solid solutions formed grains, while TaFe2, TaCr2, and some Fe-based solid solutions formed intergranular and eutectic structures. In addition, due to the presence of the brittle phases of TaFe2 and TaFe, the microhardness of the weld area can reach 650HV, with an average hardness of 530HV, which is much higher than that of the base material. The tensile shear of the joint at room temperature was 154.77 N/mm, and the fracture occurred in the weld zone on the steel side, showing brittle fracture. TaFe2 is a brittle intermetallic compound, while TaCr2 is ductile. Both TaFe2 and TaCr2 systems have dual properties of metallic and covalent bonding within them, and metallic bonding dominates.
1. Introduction
Ta has many advantages, such as high ductility, excellent corrosion resistance and high temperature resistance, and good cold working and welding performance. Therefore, it has huge application and development potential in many fields, such as aerospace, weapon equipment, electronic devices, the chemical industry, and medical devices [1,2,3,4]. However, due to the scarcity of Ta resources on Earth, high energy consumption in smelting, and high application costs [5], Ta and other metal connection research is urgently needed. Many components for aircraft engines are made of stainless steel [6,7], which is resistant to corrosion and heat, and has high strength and toughness. Using appropriate Ta–steel composite structure parts and replacing local stainless steel materials with Ta can improve the high temperature resistance of components, extend the working life of aircraft engines, and have good economic benefits. However, although brittle intermetallic TaFe2 and TaFe are very easily produced when Ta and stainless steel are welded, giant differences in the physical and chemical properties will also cause large residual stresses in the joints and lead to joint cracking [8].
At present, the research on Ta/steel welding mainly focuses on brazing [9], diffusion welding [10,11], explosive welding [12,13,14,15,16,17,18], and electronic beam welding [19,20]. However, the selection of brazing filler metal is complex and difficult, it is difficult to control the welding quality with argon arc welding, explosive welding requires a thick coating metal, and electron beam welding requires a high vacuum environment, which has certain limitations.
As an advanced welding method, laser welding can be carried out in an atmosphere without producing X-rays. It has the advantages of high heat source density, small spot diameter, and fast welding speed [21,22]. In the field of dissimilar metal welding, it can precisely control the melting amount of the base metal, reduce the heat-affected zone, shorten the metallurgical reaction time, as well as effectively reduce the joint weakening and deformation caused by overheating and material damage [23,24,25]. As far as we know, although laser welding has outstanding advantages in welding different metals, there are no reports on the laser welding of Ta/steel.
The purpose of this paper was to study the weldability of Ta/304L stainless steel by laser welding, analyze the forming characteristics, microstructure, and mechanical properties of the welded joint, and provide a theoretical basis for its research and development.
2. Experiments
The materials used in this experiment were Ta plate and 304L stainless steel plate, both of which were 85 mm × 35 mm × 0.6 mm in size. The chemical compositions of the two base materials are shown in Table 1 and Table 2. It is noteworthy that the physical and chemical properties of Ta and 304L stainless steel differ greatly, as shown in Table 3, which makes the welding process very difficult. Before welding, mechanical grinding was used to remove the impurities such as oxide film, and water and oil stains on the surface of the parts to be welded. After drying, the welding was carried out. As shown in Figure 1, the overlap quantity of the two plates was 20 mm.

Table 1.
Ta chemical composition table (wt.).
Table 2.
304L stainless steel chemical composition table (wt.).
Table 3.
Main thermal and mechanical properties of Ta and 304L stainless steel.
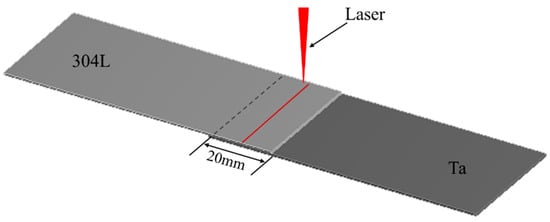
Figure 1.
Schematic diagram of laser welding process for Ta to 304L.
The laser used in the laser welding experiment was the YLS-2000TR continuous laser generator, manufactured by IPG Photonics Company, Oxford, MA, USA, with a maximum output power of 2 kW and continuous adjustability. The equipment execution system was the KR16-2 six-degrees-of-freedom robot (including a laser head), manufactured by KUKA Robot Co., Ltd., Augsburg, Bavaria, Germany, with a repetitive positioning accuracy of <0.05 mm. The welding path and parameter settings were controlled by a controller-compiled program. To protect the welding process, high purity argon was used as a shielding gas, with a flow rate of 25 L/min. The welding parameters were as follows: the laser power was 600 W, the welding speed was 0.02 m/min, and the defocus was +0.5 mm, as shown in Table 4.
Table 4.
Welding parameters for Ta and 304L.
After welding, the uniform part of the middle weld was cut vertically to obtain the sample, then it was ground, polished, and corroded. The corrosive solution used in this test was a mixture of 5:1:1:2 of H2O, HF, H2SO4, and HNO3. The field emission environment scanning electron microscope (FEG) of Quanta 200FEG, FEI Corporation, Eindhoven, Netherlands, was used to analyze the weld structure and observe the fracture morphology, and the corresponding element content of the structure was analyzed by the energy dispersive spectrometer (EDS). The phase composition of the weld zone was detected with the Smart Lab 9 kW X-ray diffractometer of Japanese Physiology, Shokima, Japan. For the mechanical properties test, the hardness test of the welded joint was carried out with the micro Vickers hardness tester model HVX-1000A, Shanghai Shuangxu Electronics Co., Ltd., Shanghai, China. The loading force was 100 g and the holding time was 15 s. The welds were tested at room temperature with the Z100SH universal material tester, manufactured by Zwick Gmbh Company, Ulm, Germany. According to the literature [26], the tensile rate is 1 mm/min. The size of the tensile specimen is shown in Figure 2.
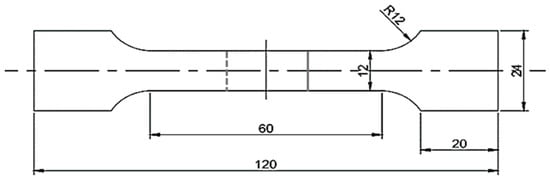
Figure 2.
Tensile specimen size.
Finally, the structural stabilization mechanisms of the two intermetallic compounds, TaFe2 and TaCr2, were explored in terms of mechanical properties as well as electronic structures, using first-principles calculations. The structure optimization of the established crystal models was performed using the CASTEP module of MS software, and the elastic constants and electronic structures were calculated. The calculation of the electron exchange correlation energy was performed using the Perdew–Burke–Ernzerhof (PBE) method in the generalized gradient approximation (GGA), on a minimized fast Fourier transform (FFT) grid. The chosen pseudofunction was an ultrasoft (Ultrasoft) pseudopotential that relaxes to the canonical condition, and the Pulay density mixing method incorporating the Broyden–Fletcher–Goldfarb–Shanno (BFGS) conjugate gradient method was used to handle the electronic relaxation [27,28]. Using the self-consistent iterative (SCF) method, the self-consistent conditions were set as follows: a convergence threshold of 1.0 × 10⁻⁶ eV/atom, total energy less than 1.0 × 10⁻⁵ eV/atom, the force acting on each atom less than 0.03 eV/Å, stress deviation less than 0.05 GPa, and tolerance offset less than 0.001 Å. The FFT grid parameters were set as 18 × 18 × 18. The kinetic energy cut-off point was 300 eV, and the K-point grid was taken as 6 × 6 × 3. Both TaFe2 and TaCr2 belong to the hexagonal crystal system, and the space group is P63/mmc (194). The cell structure is shown in Figure 3. The specific parameters of the two structures are shown in Table 5, and the original cell model was used for the calculation.
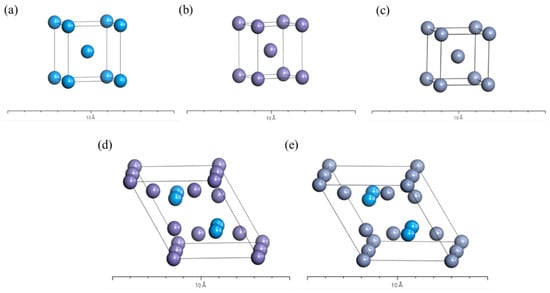
Figure 3.
Fe (a), Ta (b), Cr (c), TaFe2 (d), and TaCr2 (e) crystalline cell structure.
Table 5.
Structural parameters of Fe, Ta, TaFe2, and TaCr2.
3. Results and Discussion
3.1. Joint Forming and Microstructure
The macromorphology of the weld is shown in Figure 4. The surface of the weld was smooth and well-formed. There were no macropores, cracks, slag inclusions, undercuts, or other defects. The cross-section observation shows that the weld seam is goblet-shaped with high feet on the top width and a narrow bottom, as shown in Figure 5. This is because the melting point of 304L is much lower than that of Ta, the specific heat capacity is three times higher than that of Ta, and the thermal conductivity is about 2/7 of that of Ta, which caused the accumulated heat of the 304L stainless steel side to be significantly greater than that of the Ta side. Correspondingly, the melting amount of 304L was also significantly greater than that of Ta. The whole structure of the weld presented an onion-like surface profile, resulting from the convection of gasified steel (the boiling point of Fe is 2750 °C) as the temperature rose during the welding process. Since the welding pool is always pulsed by molten metal and gas flow, both the heat supply and transfer and the flow of molten metal have pulsating properties. This periodic change also leads to a periodic increase and decrease in the grain growth rate.
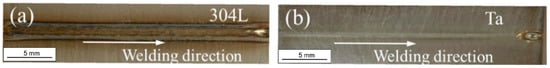
Figure 4.
Weld macroscopic morphology of 304L (a) and Ta (b).
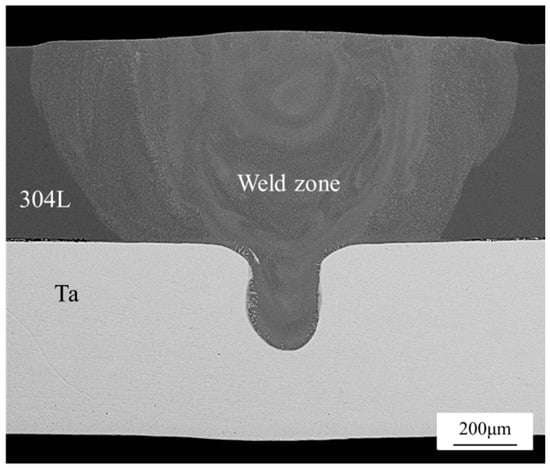
Figure 5.
Joint section morphology.
According to the interfacial morphology of the Ta/304L dissimilar metal laser lap weld joint, the weld was divided into two parts: the first part is the upper half of the weld in the 304L base metal, which is defined as the steel side weld; the second part, the lower half of the weld in the Ta base metal, is defined as the Ta side weld.
The melting line near the weld zone on the steel side was primarily arranged alternately by cylindrical crystals and fine equiaxed crystals, with a cylindrical crystal size of 10–18 m and an equiaxed crystal size of 1–3 m, as shown in Figure 6a,b. Due to the small volume of the welding pool and the surrounding cold metal, the cooling rate was high. During the initial solidification process, the maximum temperature gradient at the solid–liquid interface generates the maximum solidification driving force. The grains grow vertically along the interface and form cylindrical crystals. At the same time, due to the periodicity of crystallization latent heat and heat input, the supercooling will change accordingly. When the supercooling is small, preferential orientation growth will form cylindrical crystals. When the supercooling increases sharply, a large number of nucleations will form fine-grained areas. Figure 6c shows the middle structure of the weld on the steel side, which is dominated by dendrites and equiaxed grains. As shown in Figure 6d, a eutectic region was discovered and enlarged.
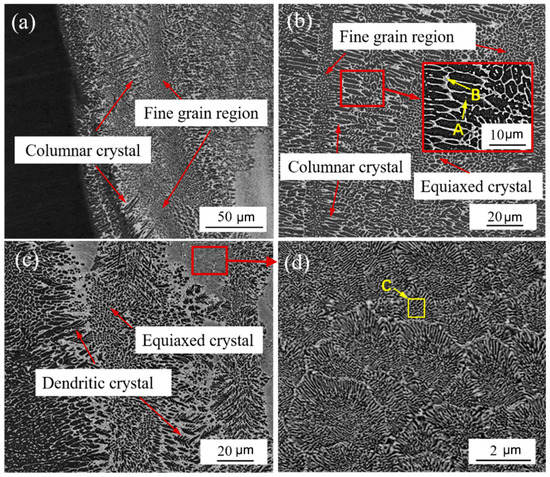
Figure 6.
Microstructure of steel side weld: (a,b) microstructure near the fusion line; (c) microstructure in the middle of weld; (d) partial enlargement of C figure.
To show the representativeness, the grain organization and intergranular organization of the A and B areas near the fusion line were selected, and the C area in the middle of the weld was selected for EDS analysis. Table 6 shows the EDS results of black grain A, white intergranular structure B, and eutectic structure C. Comparing the element content in area A and B, it was found that the change of Fe and Ta elements in the white intergranular structure is the largest compared with that in the black grain. No Ta element was found in the crystal, and the component composition in area C and area B was very similar. In combination with the XRD test results shown in Figure 7, it is reasonable to believe that when the temperature drops to 1454 °C, Fe-based solid solution is formed in the weld, and it grows rapidly to form black grains. In addition, in the Ta-containing region, the reaction L→δ-Fe + TaFe2 occurs at 1442 °C, and a part of TaFe2 is directly crystallized from the liquid phase. As the temperature continues to decrease, the eutectoid reaction δ-Fe→γ-Fe + TaFe2 occurs at 1215 °C. When the temperature drops to 910 °C, the γ-Fe undergoes solid-state phase transformation again and turns into α-Fe. Simultaneously, Cr with less content will also react with some Ta elements to form TaCr2 mesophase. In the Ta-poor area, dominated by molten Fe near the fusion line of the weld, the white intergranular structure is formed by the mixing of TaFe2, TaCr2, and Fe-based solid solution, while in the Ta-rich area in the middle of the weld, the lamellar eutectic structure is formed by TaFe2, TaCr2, and Fe-based solid solution.
Table 6.
EDS results of steel side welds (at.%).
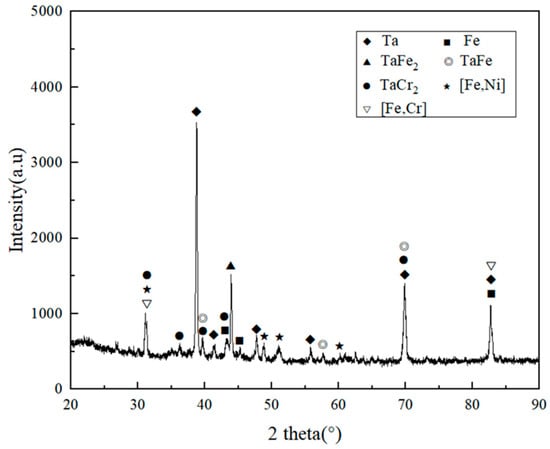
Figure 7.
XRD analysis of the welded joint.
By analyzing the structure of the Ta side weld, it was found that the middle structure of the Ta side weld was the same as that of the steel side, mainly equiaxed and dendrite, and there were some lamellar eutectic zones, as shown in Figure 8a,b. However, unlike the steel side weld structure, there were a lot of gray cellular structures near the fusion line of the Ta side weld, and a white island structure was also found, around which the same cellular grains as were found around the fusion line were present, as shown in Figure 8c. The EDS results, shown in Table 7, show that there were a lot of Fe and Ta elements in both gray cell grains and island structures, in which the ratio of Ta to Fe was about 1:2. The structure of gray cell grains was mainly TaFe2 with a little TaCr2. The island tissue had a higher Ta content, up to 50%, which was analyzed as a mixture of Ta, TaFe2, TaFe, and a small amount of TaCr2. The island structure is stripped from the base metal during welding. It is a semi-melted, viscous, and aggregated material, with a high temperature when stripped. It diffuses into a large amount of Fe, Cr, and Ni when wrapped by molten steel and forms brittle intermediate phases, such as TaFe2 and TaCr2. The gray cellular structure at the edge of the weld was similar to the cellular grains around the island structure. The formation was similar to that of the island structure, but it was in a small volume state when the base metal was stripped, with a greater degree of melting and more elements like Fe, Cr, and Ni diffused into it.
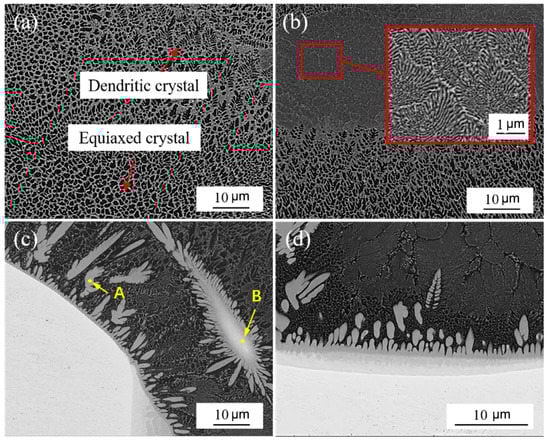
Figure 8.
Structure of Ta side weld: (a,b) middle structure of weld; (c) the structure near the fusion line; (d) bottom structure of Ta side weld.
Table 7.
EDS results for Ta side welds (at.%).
Delamination occurred at the fusion line of the Ta side weld, as shown in Figure 8d, and this layered area grew a layer of coarse gray cellular grains along the Ta side fusion line interface toward the weld zone. The weld structure of the adjacent parts was black Fe-based solid solution grains, with a lamellar eutectic structure. A line scan of this area is shown in Figure 9. In the area of stratified structure, along the direction from the Ta base metal to the weld seam, the content of Ta elements decreased sharply and the content of Fe and Cr elements increased obviously. Therefore, it can be judged that the reaction layer is located at the bottom of welding holes where heat accumulates, and the incompletely melted Ta base metal diffuses into a large number of Fe and Cr elements and reacts violently, forming a reaction layer rich in Ta, TaFe, TaFe2, and TaCr2. The TaFe2 and TaFe contained in the reaction layer and the gray cellular grain structure will greatly increase the brittleness of the fusion line of the Ta side weld, which will cause cracks or even fractures when external force is applied, which seriously reduces the mechanical properties of the welded joint.
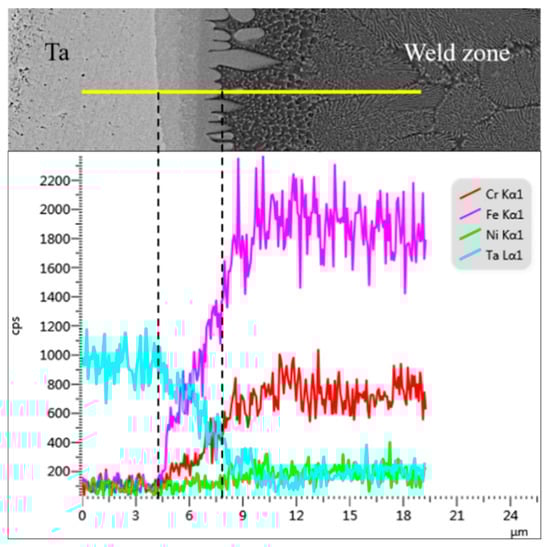
Figure 9.
EDS line scan results at bottom of weld.
3.2. Mechanical Properties of Joint
Figure 10 shows the microhardness distribution of the weld. It can be seen from the diagram that the microhardness distribution in the weld zone is not uniform. The microhardness of 304L stainless steel base metal and Ta base metal are about 200HV and 100HV, respectively. The microhardness of the weld zone is obviously higher than that of base metal in the range of 420HV~650HV. The average hardness of the weld zone is 530HV, which is significantly higher than that of 304L and Ta. This is because the laser welding has a fast cooling rate, the structure of the weld zone cannot grow, and the fine grain structure improves the strength of the weld zone. Simultaneously, a large amount of lamellar eutectic structure and white intergranular structure contain brittle and hard TaFe2 phase, which greatly improves weld zone hardness. It was also confirmed that the points with high hardness distribution were located in the lamellar eutectic structure area and the gray cell grain area.
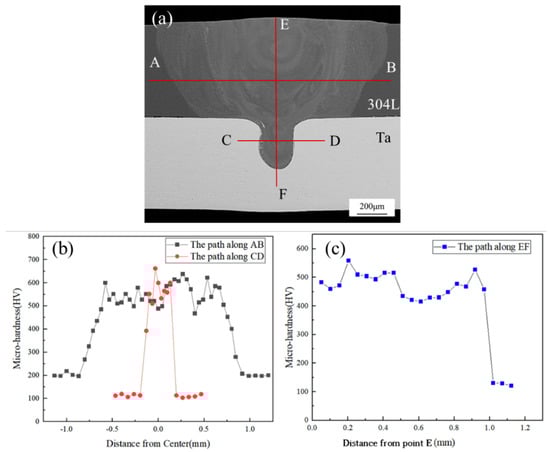
Figure 10.
Hardness distribution: (a) hardness test path; (b) hardness distribution along AB and CD paths; (c) hardness distribution along EF path.
The distribution of the brittle and hard intermetallic compounds, TaFe and TaFe2, in the weld greatly increased the hardness of the weld zone as well as the brittleness of the weld, especially in the eutectic structure containing a large amount of TaFe2 produced in the Ta-rich zone, which was very prone to crack or even fracture during tension. The tensile test was carried out at room temperature, and the resulting tensile shear force was 154.77 (±3.9) N/mm. The final result is the average of the three groups of samples. The fracture occurred in the center of the weld, as shown in Figure 11.
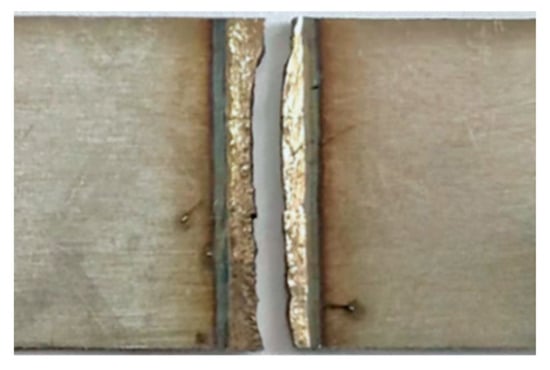
Figure 11.
Joint fracture location.
Observation of the fracture surface shows that there are obvious river patterns and cleavage steps, as shown in Figure 12, which are brittle fracture features. It also confirms that the brittle intermetallic compounds mentioned above have adverse effects on the mechanical properties of welded joints. On the other hand, the linear expansion coefficient of 304L was almost 2.5 times that of Ta (Table 3). During welding cooling, the shrinkage of 304L was greater than that of Ta, which will result in high welding stress and joint cracking.
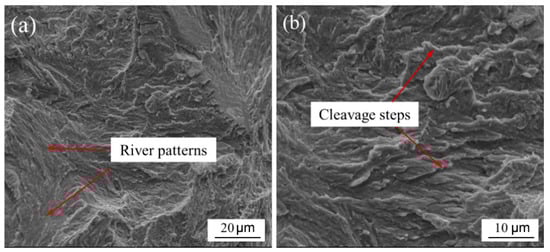
Figure 12.
Fracture morphology. River patterns (a); Cleavege steps (b).
3.3. First-Principles Calculations
To investigate the mechanical properties of tantalum steel intermetallic compounds, the elastic constants of these compounds were calculated using MS software in this paper, and the results are shown in Table 8. The bulk modulus (B), shear modulus (G), Young’s modulus (E), and Poisson’s ratio (ν) of the crystals were obtained by the Viogt–Reuss–Hill (VRH) approximation method, and the calculated results are shown in Table 9.
Table 8.
Calculated elastic constants.
Table 9.
Calculated modulus.
In general, the larger the value of shear modulus G, the higher the hardness of the compound, the larger the Young’s modulus, and the greater the stiffness of the material. As known from Table 8, the bulk modulus, shear modulus, and Young’s modulus of TaFe2 are the largest, 239.86 GPa, 137.95 GPa and 347.27 GPa, respectively, which indicates that TaFe2 has the strongest compression and shear resistance, as well as high hardness and stiffness. Moreover, in the table it can be seen that the elastic moduli of Fe and Ta are 204.6 and 184.3, respectively, which almost correspond to the parameters in the literature [29,30], respectively.
According to the Pugh criterion, the ratio of the shear modulus to bulk modulus k = G/B of the material can determine the brittleness and plasticity of the material; when G/B > 0.57, it is brittle material, otherwise, it is plastic material. From the calculation results in Table 8, it can be seen that the G/B value of TaFe2 is greater than 0.57, which is a brittle intermetallic compound, and the other four materials are plastic. As a plastic material, Poisson’s ratio is generally 1/3, while the Poisson’s ratio of Cr is 0.26, which is less than 1/3, indicating that the plasticity of Cr is poor.
Hardness is also a very important parameter in the mechanical properties of materials, and brittle compounds generally have a high hardness. In this paper, the Vickers hardness of several substances was calculated empirically using Equation (1):
The calculated results are shown in Table 8. The lowest hardness is Ta (5.90 GPa), the highest hardness is TaFe2 with 16.05 GPa, followed by Cr with 11.20 GPa. This is in accordance with the maximum hardness of TaFe2, deduced from Young’s modulus in the previous section.
In order to calculate the electronic structure and chemical bonding properties of Ta/304L intermetallic compounds, the total density of states (TDOS) and the partial wave density of states (PDOS) of TaFe2 and TaCr2 were experimentally calculated, and since the properties of materials are mainly affected by the electronic states near the Fermi energy level, only the region near the Fermi energy level was taken for this study, as shown in Figure 13.
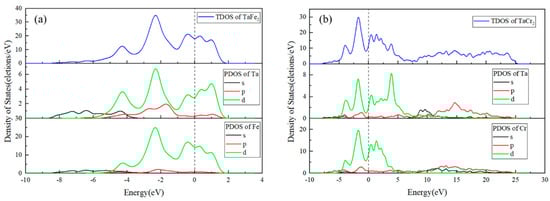
Figure 13.
Density of states calculation results: (a) TaFe2; (b) TaCr2.
The results in Figure 13 show that in the TaFe2 structure, the source of the total density of states is mainly Ta-d and Fe-d in the d orbitals, with small amounts of Ta-s, Ta-p, Fe-s, and Fe-p. The source of the density of states at the Fermi energy level is also mainly Ta-d and Fe-d. At the peak density of states, between −3 and −1 eV, Ta-d and Fe-d overlap and hybridize to form covalent bonds Characteristic. In the TaCr2 structure, the sources of the total density of states and the density of states at the Fermi energy level are also mainly d-orbital Ta-d and Cr-d, accompanied by small amounts of Ta-s, Ta-p, Cr-s, and Cr-p. At −4 to −1 eV and 0 to 1 eV, Ta-d and Cr-d both recombine and hybridize to form covalent bonding properties.
In addition, to study the chemical bonding and charge transfer of TaFe2 and TaCr2, the differential charge densities of these compounds were calculated, as shown in Figure 14. The blue color in the figure indicates the dissipation of electron density, the red color indicates the aggregation of electron density, and the white color indicates the intermediate states. Only partial overlap of the electron cloud between TaFe2 and TaCr2 atoms and little distortion of the charges at the junction indicate that both compounds exist. In the charge density difference diagram of TaFe2, the Ta atoms and Fe atoms are positioned in the electron-losing region with a negative charge density difference, and the atoms are positioned in the electron-gaining region with a positive charge density difference, and the outer electrons of Fe atoms are affected in a three-valve distribution with covalent bonding. The charge transfer of Cr atoms in the TaCr2 system is more, and the electron distribution between Ta–Cr atoms is asymmetric, mostly gathered around Cr atoms, indicating the existence of obvious metal bonds in Ta–Cr. There is obvious electron gathering between Cr–Cr, which shows the covalent bonding property.The overall covalent bond strength of TaCr2 is higher than that of TaFe2, which leads to a larger external force required to destroy TaCr2 than TaFe2.
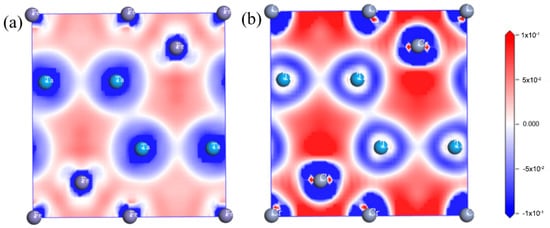
Figure 14.
Differential charge density diagrams: (a) TaFe2; (b) TaCr2.
4. Conclusions
Laser welding experiments on Ta and 304L stainless steel were carried out and the following conclusions were drawn:
- (1)
- The connection between Ta and 304L stainless steel can be realized by laser welding. After welding, the surface of the weld is well-formed and the cross-section is cup-shaped, with high feet and narrow feet.
- (2)
- Fe is the main element in the weld zone, and the Fe-based solid solution precipitates into grains. TaFe2 and TaCr2 intermetallic compounds form intergranular and eutectic structures, together with some Fe-based solid solutions. TaFe2 cellular grains and a brittle Fe–Ta reaction layer appear at the fusion line of the Ta side weld zone. The structure of the reaction layer consists of Ta, TaFe, TaFe2, and TaCr2.
- (3)
- The brittle and hard phases of TaFe and TaFe2 in the weld reduces the joint performance. The microhardness of the weld zone is significantly higher than that of 304L and Ta base metal, reaching 650HV with an average hardness of 530HV. The tensile shear force of the joint at room temperature is 154.77 N/mm, and the fracture occurs in the weld zone on the steel side, presenting brittle fracture characteristics.
- (4)
- When calculating the mechanical properties, the bulk modulus B, shear modulus G, and Young’s modulus E of TaFe2 are the largest, 239.86 GPa, 137.95 GPa, and 347.27 GPa, respectively, which indicates that TaFe2 has the strongest resistance to compression and shear, as well as high hardness and stiffness. TaFe2 is a brittle intermetallic compound with a hardness of 16.05 GPa, while TaCr2 is a ductile compound with a hardness of only 6.96 GPa, as calculated by Pugh’s criteria.
- (5)
- When settling the electronic structure properties, both TaFe2 and TaCr2 have nonzero values of density of states at the Fermi energy level, and both have metallic properties and conductivity. The total density of states of TaFe2 and TaCr2 and the sources at the Fermi energy level are mainly d-orbital electrons, and both TaFe2 and TaCr2 structures have both covalent and metallic bonding properties, with metallic bonding dominating.
Author Contributions
Conceptualization, Z.Z. and Y.C.; Methodology, Y.Z. (Yongqiang Zhou); Software, S.F.; Validation, Y.Z. (Yunming Zhu) and S.F.; Data Management, Y.Z. (Yongqiang Zhou); Writing—manuscript preparation, S.F.; Writing—review and editing, Z.Z. All authors have read and agreed to the published version of the manuscript.
Funding
The research was supported by National Natural Science Foundation of China funded project (Grant no. 51861024), the 2021 Jiangxi Province Technology Innovation Guide Class Project (Special Project for Science and Technology Cooperation) (Grant no. 20212BDH81014), and the 2021 Nanchang University High Value Patent Cultivation Project.
Institutional Review Board Statement
Not applicable.
Informed Consent Statement
Not applicable.
Data Availability Statement
Not applicable.
Acknowledgments
The research was supported by the National Natural Science Foundation of China funded project (Grant no. 51861024), the 2021 Jiangxi Province Technology Innovation Guide Class Project (Special Project for Science and Technology Cooperation) (Grant no. 20212BDH81014), and the 2021 Nanchang University High Value Patent Cultivation Project.
Conflicts of Interest
The authors declare no conflict of interest.
References
- Cardonne, S.M.; Kumar, P.; Michaluk, C.A.; Schwartz, H.D. Tantalum and its alloys. Int. J. Refract. Met. Hard Mater. 1995, 13, 187–194. [Google Scholar] [CrossRef]
- Deng, J.; Wang, Y. Application of tantalum metal in orthopedics. J. Biomed. Eng. 2011, 28, 419–422. [Google Scholar]
- Mineta, K.; Okabe, T.H. Development of a recycling process for tantalum from capacitor scraps. J. Phys. Chem. Solids 2005, 66, 318–321. [Google Scholar] [CrossRef]
- Wurster, S.; Gludovatz, B.; Hoffmann, A.; Pippan, R. Fracture behaviour of tungsten–vanadium and tungsten–tantalum alloys and composites. J. Nucl. Mater. 2011, 413, 166–176. [Google Scholar] [CrossRef]
- Moser, K.D. The manufacture and fabrication of tantalum. JOM 1999, 51, 29–31. [Google Scholar] [CrossRef]
- Arivazhagan, N.; Singh, S.; Prakash, S.; Reddy, G.M. Investigation on AISI 304 austenitic stainless steel to AISI 4140 low alloy steel dissimilar joints by gas tungsten arc, electron beam and friction welding. Mater. Des. 2011, 32, 3036–3050. [Google Scholar] [CrossRef]
- Kumar, R.R.; Babu, J.M. Investigation and Joint effect Analysis of Ti-6AL-4V & SS-304L in Aerospace Applications. INCAS Bull. 2020, 12, 195–201. [Google Scholar]
- Paul, E.; Swartzendruber, L.J. The Fe−Nb (Iron-Niobium) system. Bull. Alloy. Phase Diagr. 1986, 7, 248–254. [Google Scholar] [CrossRef]
- Hosking, F.M. Sodium compatibility of refractory metal alloy-type 304L stainless steel joints. Weld. J. 1985, 64, 181s–190s. [Google Scholar]
- Masumoto, H.; Asada, A.; Hasuyama, H.; Nishio, K.; Kato, M.; Mukae, S. Diffusion bonding of tantalum and stainless steel. Weld. Int. 1997, 11, 110–120. [Google Scholar] [CrossRef]
- Lison, R.; Stelzer, J.F. Diffusion welding of reactive and refractory metals to stainless steel. Weld. J. 1979, 58, 306–314. [Google Scholar]
- Yang, M.; Ma, H.; Shen, Z.; Huang, Z.; Tian, Q.; Tian, J. Dissimilar material welding of tantalum foil and Q235 steel plate using improved explosive welding technique. Mater. Des. 2020, 186, 108348. [Google Scholar] [CrossRef]
- Paul, H.; Miszczyk, M.M.; Chulist, R.; Prażmowski, M.; Morgiel, J.; Gałka, A.; Faryna, M.; Brisset, M. Microstructure and phase constitution in the bonding zone of explosively welded tantalum and stainless steel sheets. Mater. Des. 2018, 153, 177–189. [Google Scholar] [CrossRef]
- Paul, H.; Chulist, R.; Lityńska-Dobrzyńska, L.; Prażmowski, M.; Faryna, M.; Mania, I.; Szulc, Z.; Miszczyk, M.M.; Kurek, A. Interfacial reactions and microstructure related properties of explosively welded tantalum and steel sheets with copper interlayer. Mater. Des. 2021, 208, 109873. [Google Scholar] [CrossRef]
- Kosec, B.; Kosec, L.; Petrović, S.; Gontarev, V.; Kosec, G.; Gojić, M.; Škraba, P. Analysis of low-carbon steel/tantalum interface after explosive welding. Metalurgija 2003, 42, 147–151. [Google Scholar]
- Xia, C.; Jin, Z. Examination of the diffusion path in a niobium-steel explosion weld interface during heat treatment. Mater. Sci. Eng. A. 1996, 221, 173–178. [Google Scholar] [CrossRef]
- Xia, C.; Jin, Z. Interfacial reaction in the tantalum-steel explosion weld composite at 1053 K. J. Cent. South Univ. Technol. 1997, 4, 5–8. [Google Scholar] [CrossRef]
- Xia, C.; Jin, Z. Interfacial reactions in an explosively-welded tantalum clad steel plate. Surf. Coat. Technol. 2000, 130, 29–32. [Google Scholar] [CrossRef]
- Guoqing, C.; Binggang, Z.; Yuan, Z.; Binghui, D.; Jicai, F. Microstructure and properties of electron beam welded tantalum-to-stainless steel joints. Rare Met. Mater. Eng. 2013, 42, 914–918. [Google Scholar] [CrossRef]
- Sang, S.; Li, D.; Wang, C.; Ding, L.; Tang, Y.; Xiong, Q. Microstructure and mechanical properties of electron beam welded joints of tantalum and GH3128. Mater. Sci. Eng. A. 2019, 768, 138431. [Google Scholar] [CrossRef]
- Katayama, S. Introduction: Fundamentals of laser welding. In Handbook of Laser Welding Technologies; Woodhead Publishing: Sawston, UK, 2013. [Google Scholar] [CrossRef]
- Yunlian, Q.; Ju, D.; Quan, H.; Liying, Z. Electron beam welding, laser beam welding and gas tungsten arc welding of titanium sheet. Mater. Sci. Eng. A 2000, 280, 177–181. [Google Scholar] [CrossRef]
- Zhou, X.; Huang, Y.; Hao, K.; Chen, Y. Cracking in dissimilar laser welding of tantalum to molybdenum. Opt. Laser Technol. 2018, 102, 54–59. [Google Scholar] [CrossRef]
- Penilla, E.H.; Devia-Cruz, L.F.; Wieg, A.T.; Martinez-Torres, P.; Cuando-Espitia, N.; Sellappan, P.; Kodera, Y.; Aguilar, G.; Garay, G.E. Ultrafast laser welding of ceramics. Science 2019, 365, 803–808. [Google Scholar] [CrossRef] [PubMed]
- Pankaj, P.; Tiwari, A.; Bhadra, R.; Biswas, P. Experimental investigation on CO2 laser butt welding of AISI 304 stainless steel and mild steel thin sheets. Opt. Laser Technol. 2019, 119, 105633. [Google Scholar] [CrossRef]
- Zhou, X.; Huang, Y.; Chen, Y.; Peng, P. Laser joining of Mo and Ta sheets with Ti6Al4V or Ni filler. Opt. Laser Technol. 2018, 106, 487–494. [Google Scholar] [CrossRef]
- Head, J.D.; Zerner, M.C. A Broyden—Fletcher—Goldfarb—Shanno optimization procedure for molecular geometries. Chem. Phys. Lett. 1985, 122, 264–270. [Google Scholar] [CrossRef]
- Lewis, A.S.; Overton, M.L. Nonsmooth optimization via quasi-Newton methods. Math. Program. 2013, 141, 135–163. [Google Scholar] [CrossRef]
- Yu, X.; Tan, L.; Ke, Y. Advances in medical applications of tantalum metals. Mater. Guide. 2012, 26, 79–82. [Google Scholar]
- Tong, L.; Minshan, L. Theoretical analysis of the relationship between elastic constants and temperature of metallic materials. Mech. Eng. Mater. 2014, 38, 85–89, 95. [Google Scholar]
Publisher’s Note: MDPI stays neutral with regard to jurisdictional claims in published maps and institutional affiliations. |
© 2022 by the authors. Licensee MDPI, Basel, Switzerland. This article is an open access article distributed under the terms and conditions of the Creative Commons Attribution (CC BY) license (https://creativecommons.org/licenses/by/4.0/).