
Effect of Microstructure Morphology of Q&P Steel on Carbon and Manganese Partitioning and Stability of Retained Austenite

Abstract
:1. Introduction
2. Experimental Procedure
3. Results
3.1. Microstructures of QQ&P and Q&P Samples
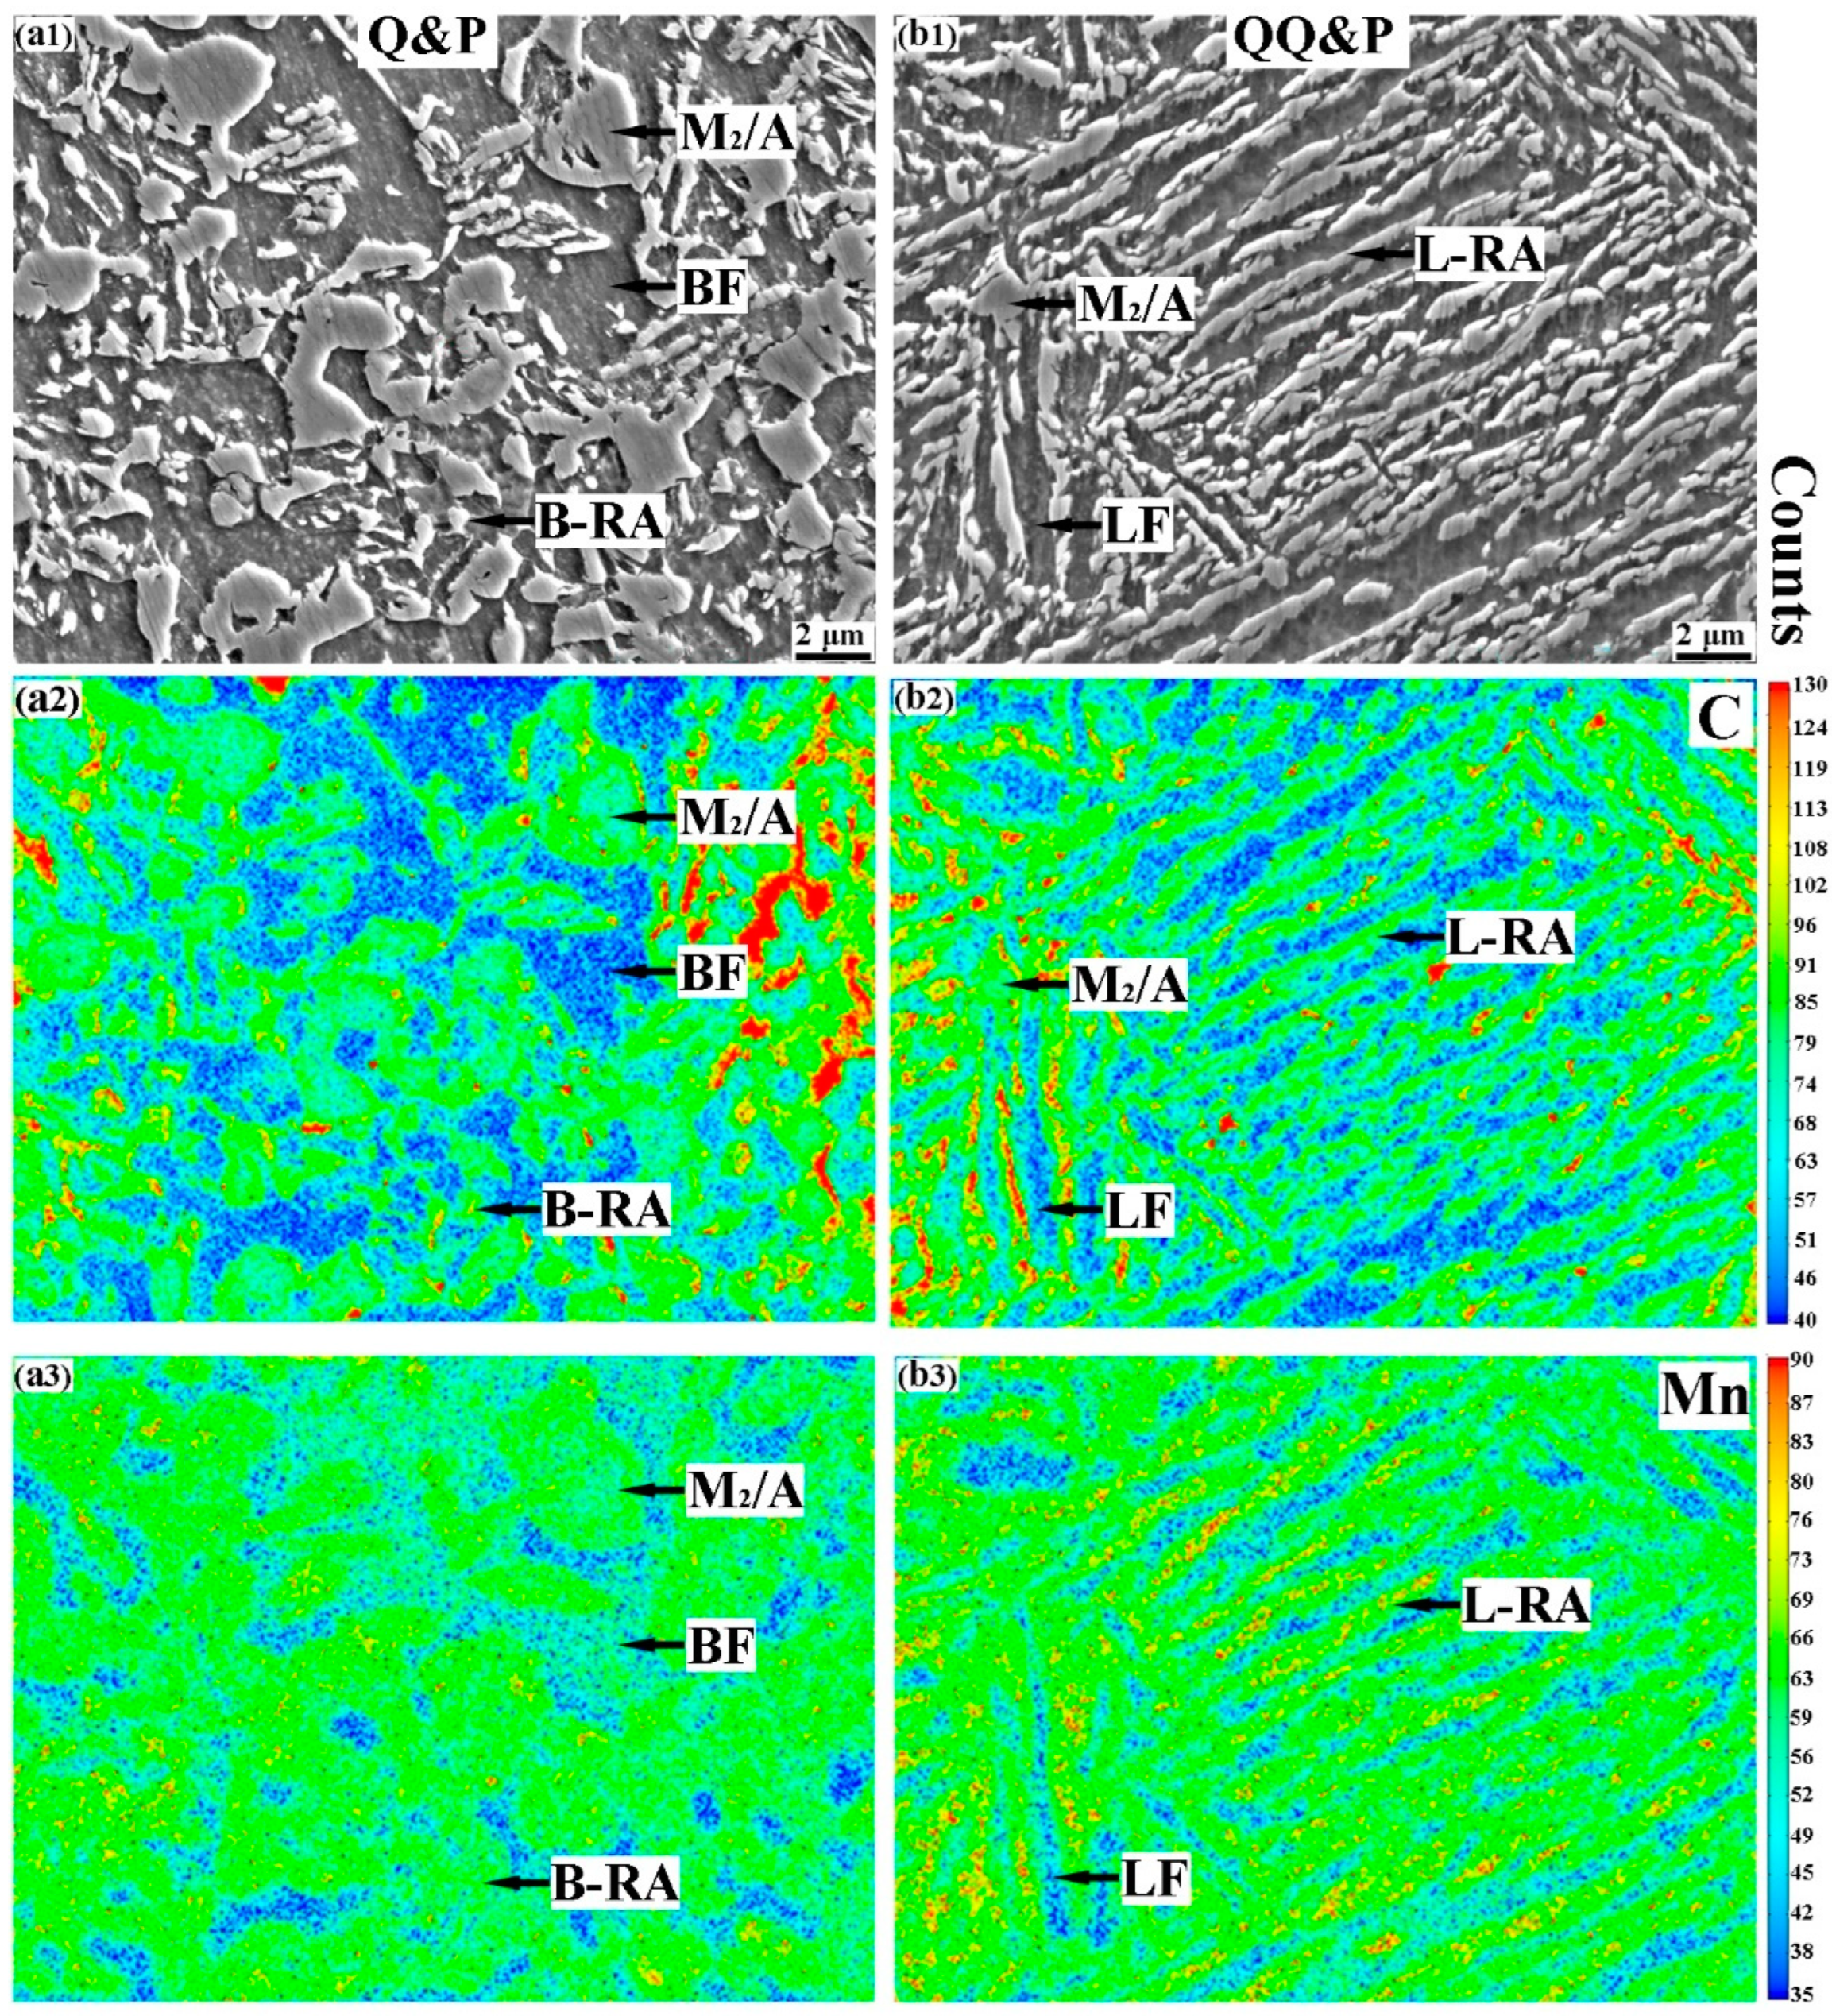
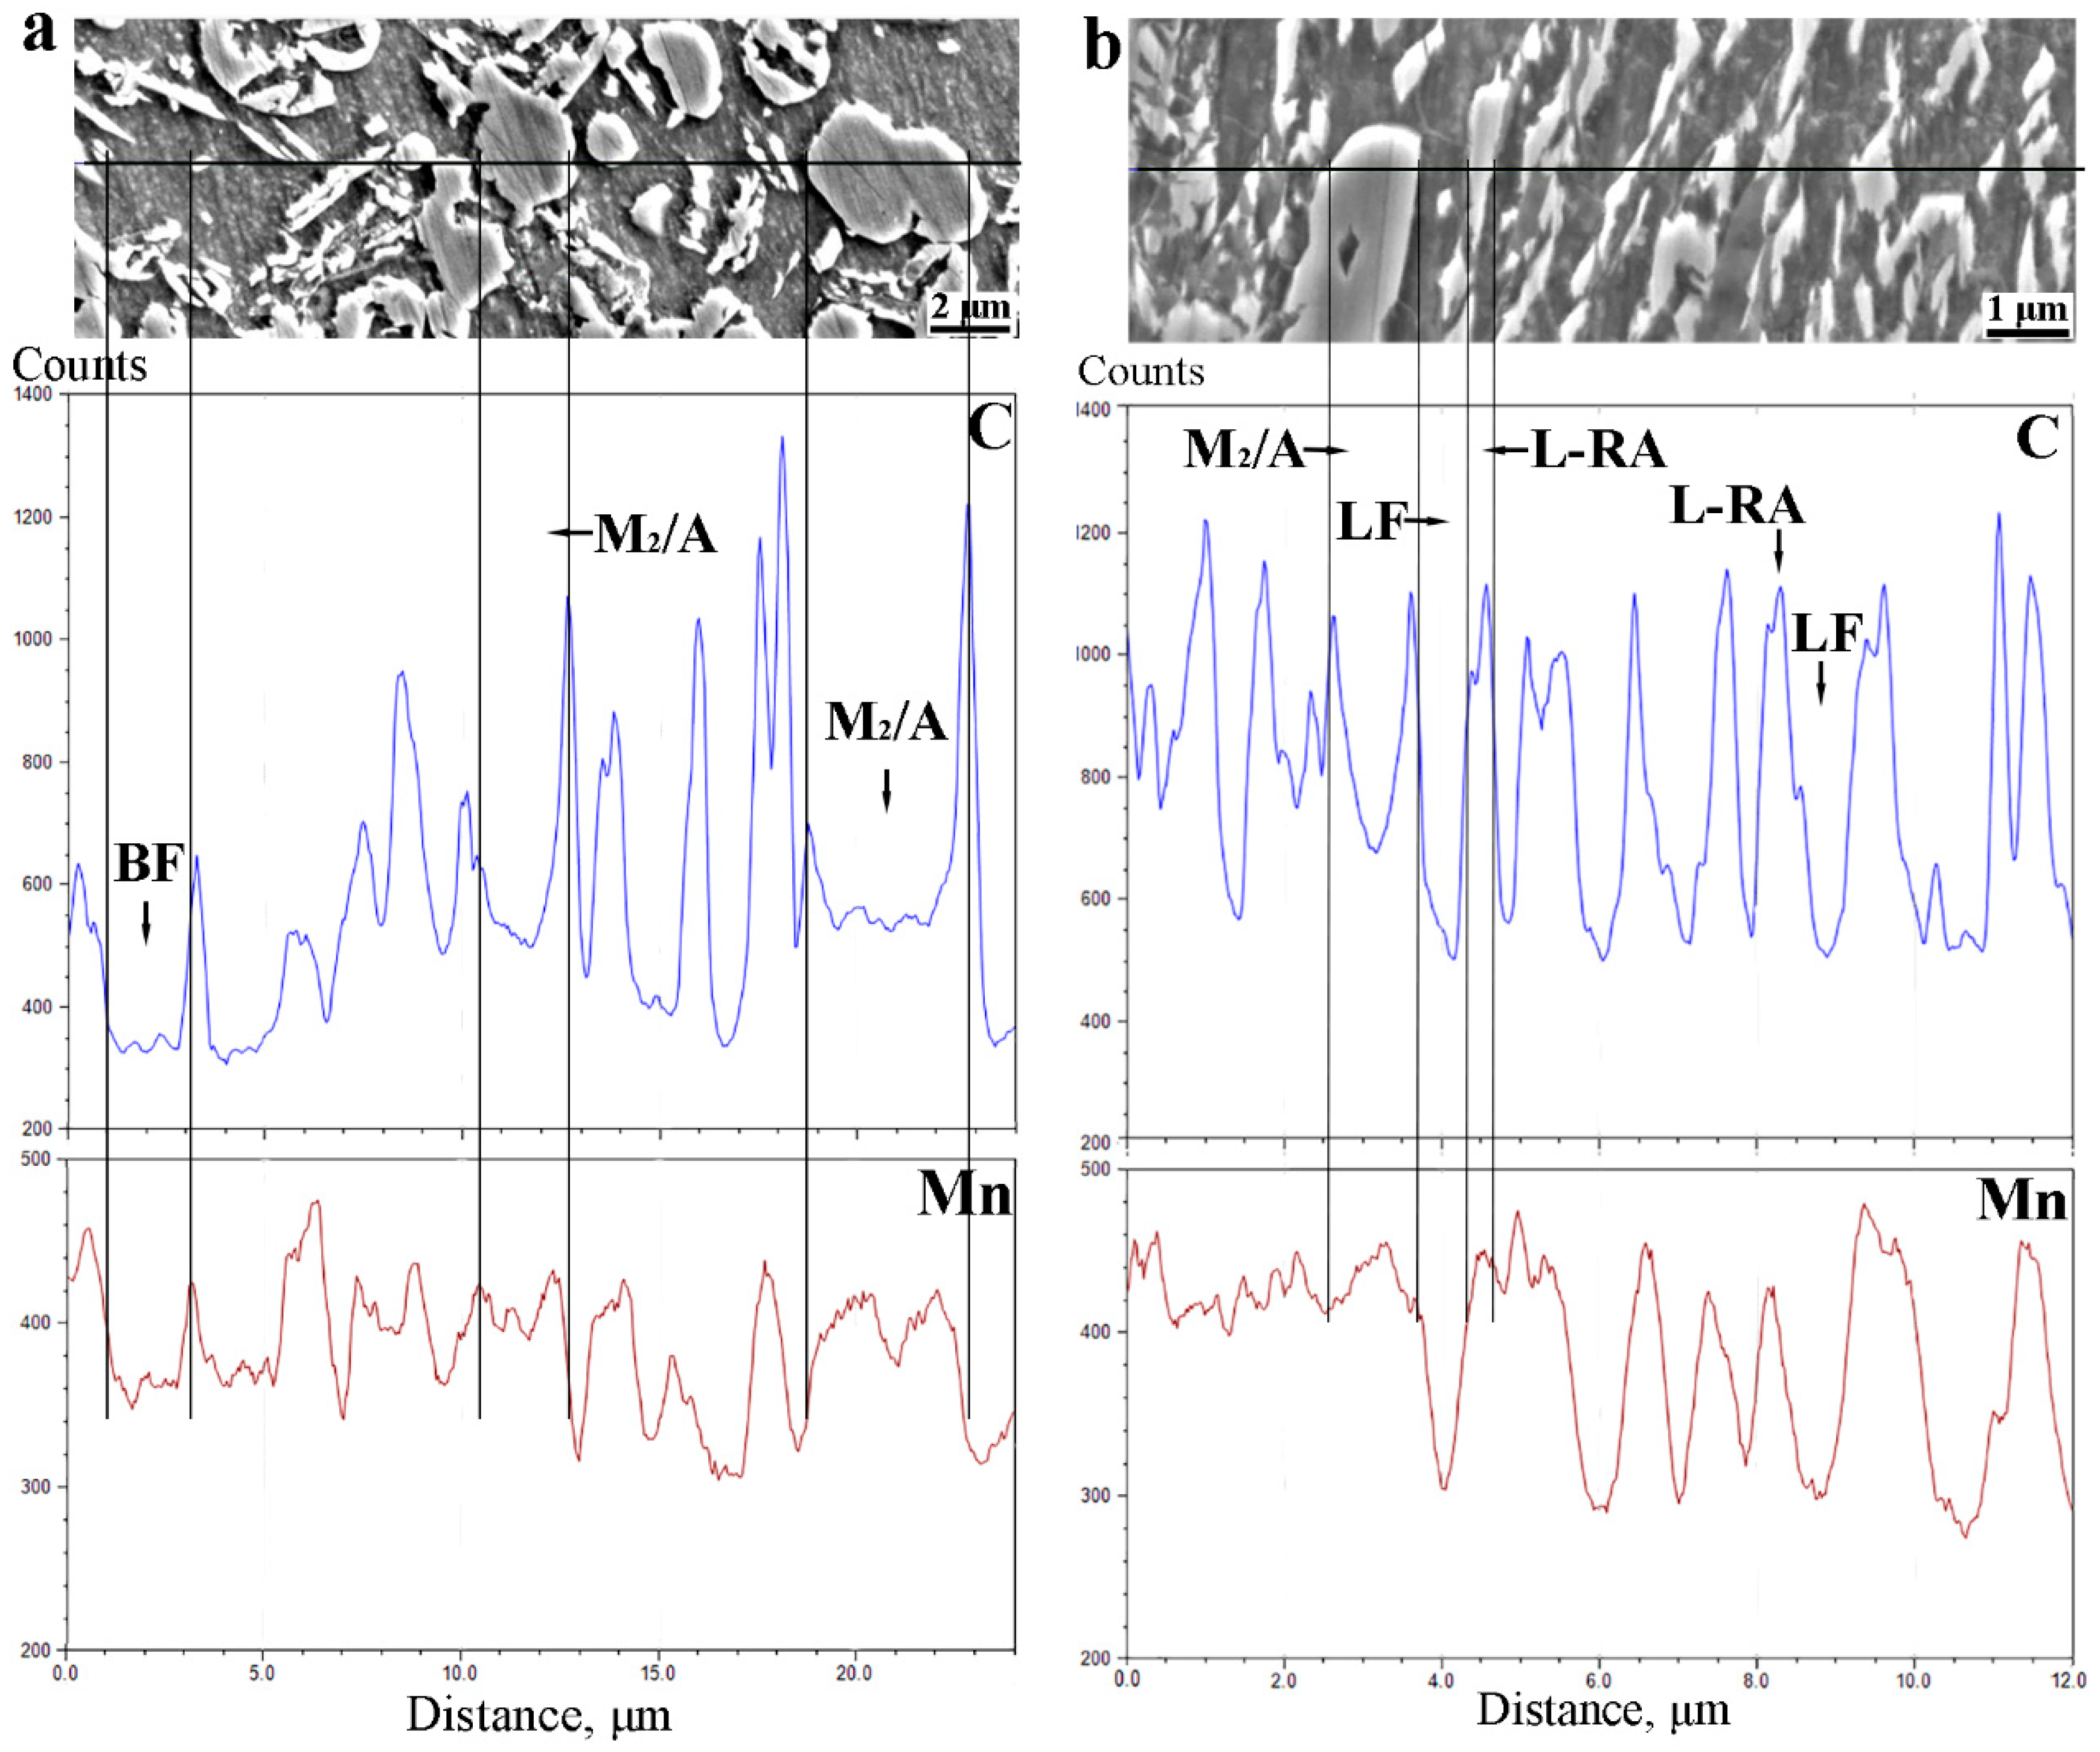
3.2. Diffusions of Carbon and Manganese during Q&P Process
4. Discussions
4.1. The Effect of Initial Structures on the Microstructure Morphology in Q&P and QQ&P Samples
4.2. The Effect of Microstructure Morphology on Carbon and Manganese Diffusions during Q&P Treatments
4.3. The Relationship between Microstructures and Mechanical Properties of Q&P and QQ&P Samples
5. Conclusions
- (1)
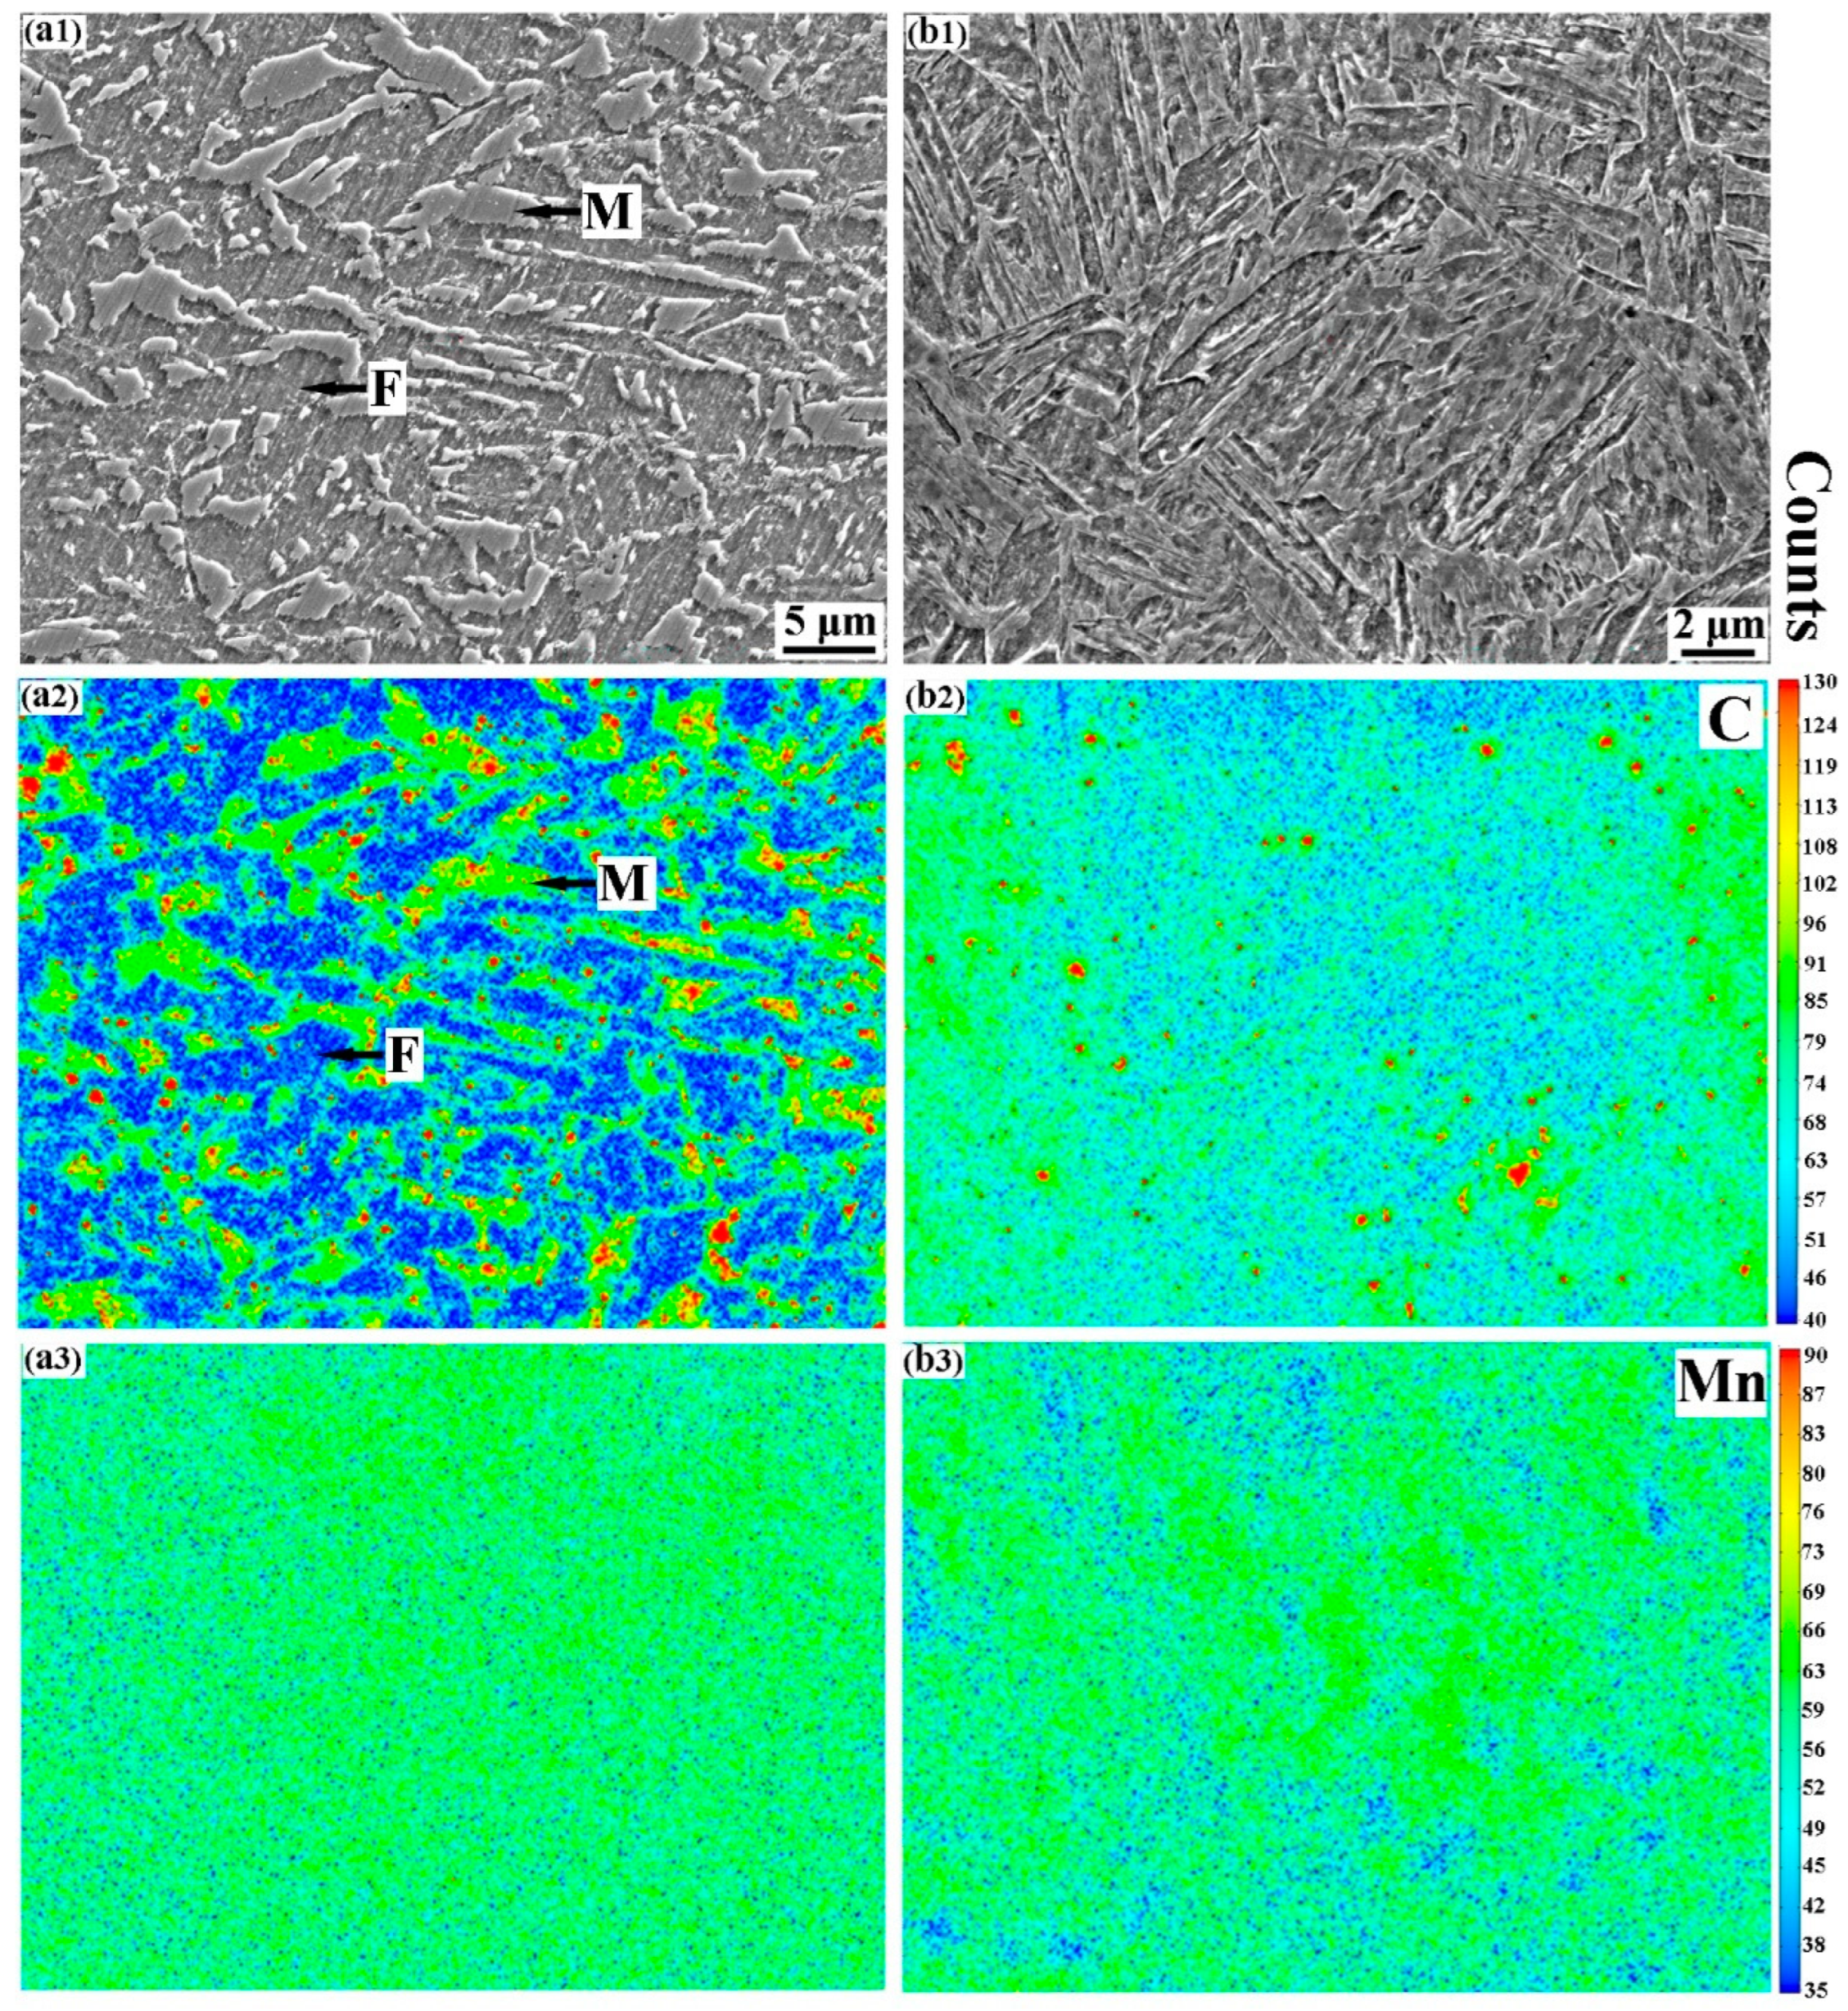
- During the intercritical annealing, the partitioning of carbon and manganese in the Q&P and the QQ&P samples occurred, and the carbon and manganese contents in austenite are significantly higher than those in ferrite.
- (2)
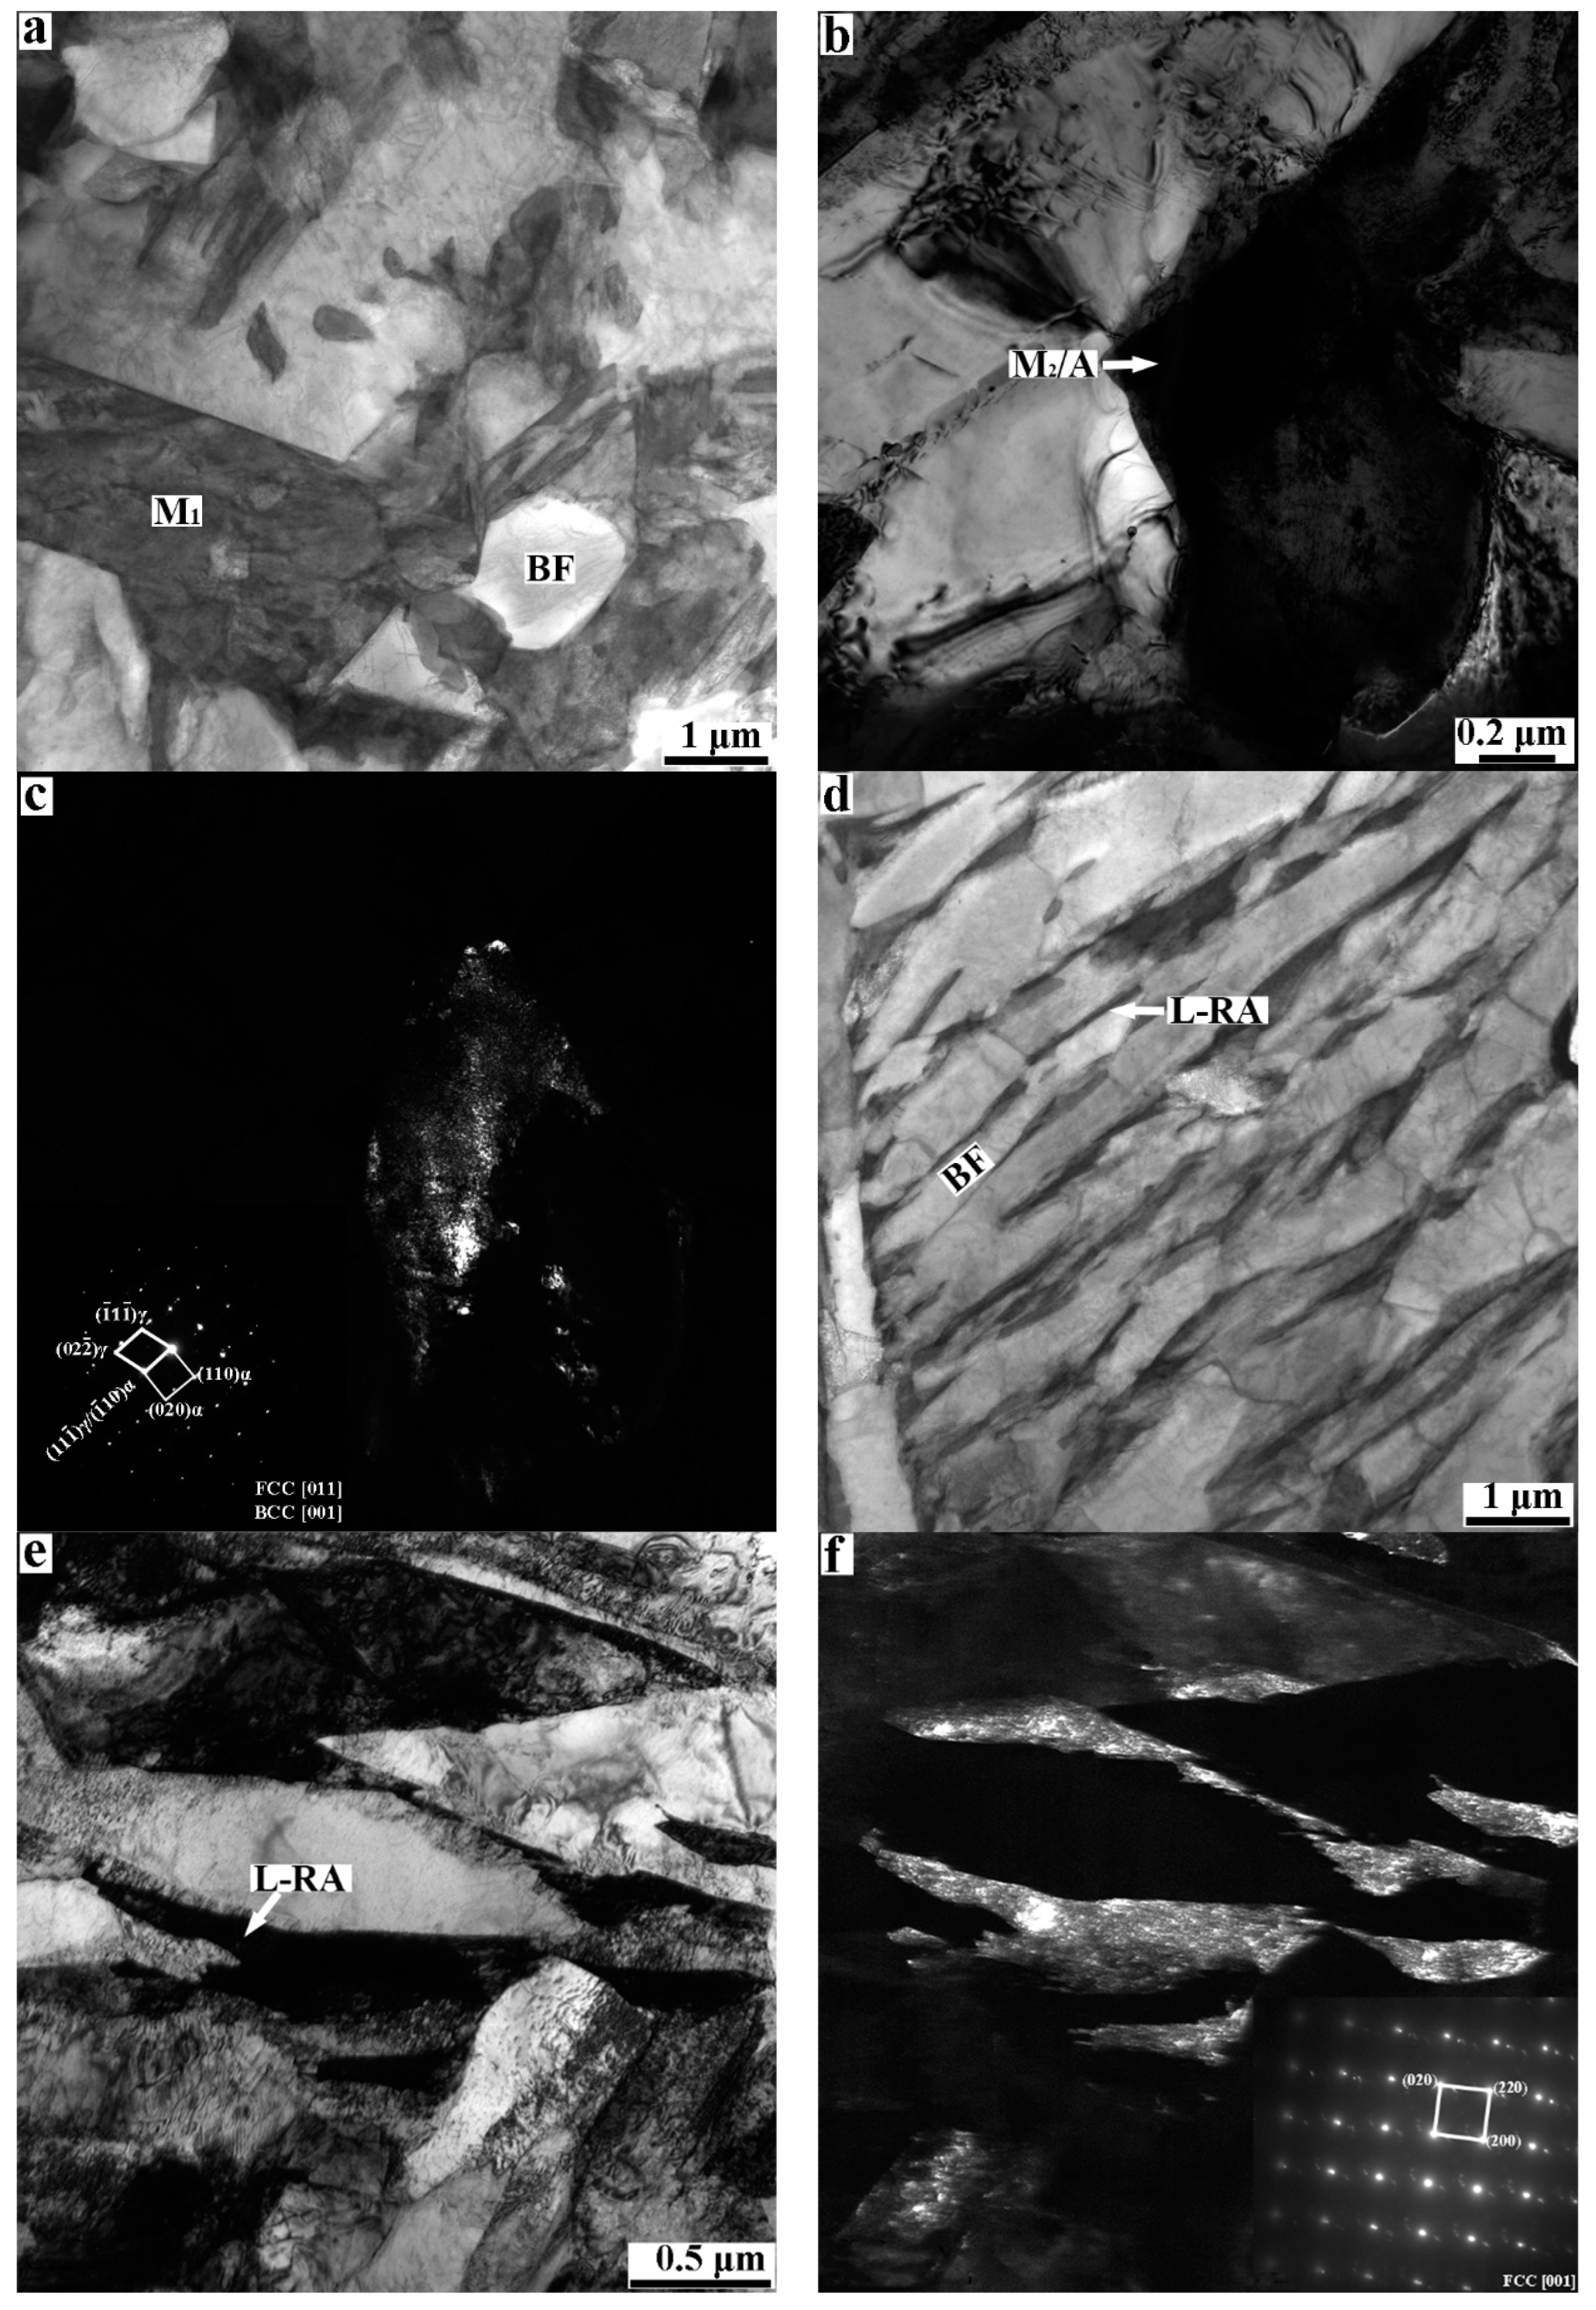
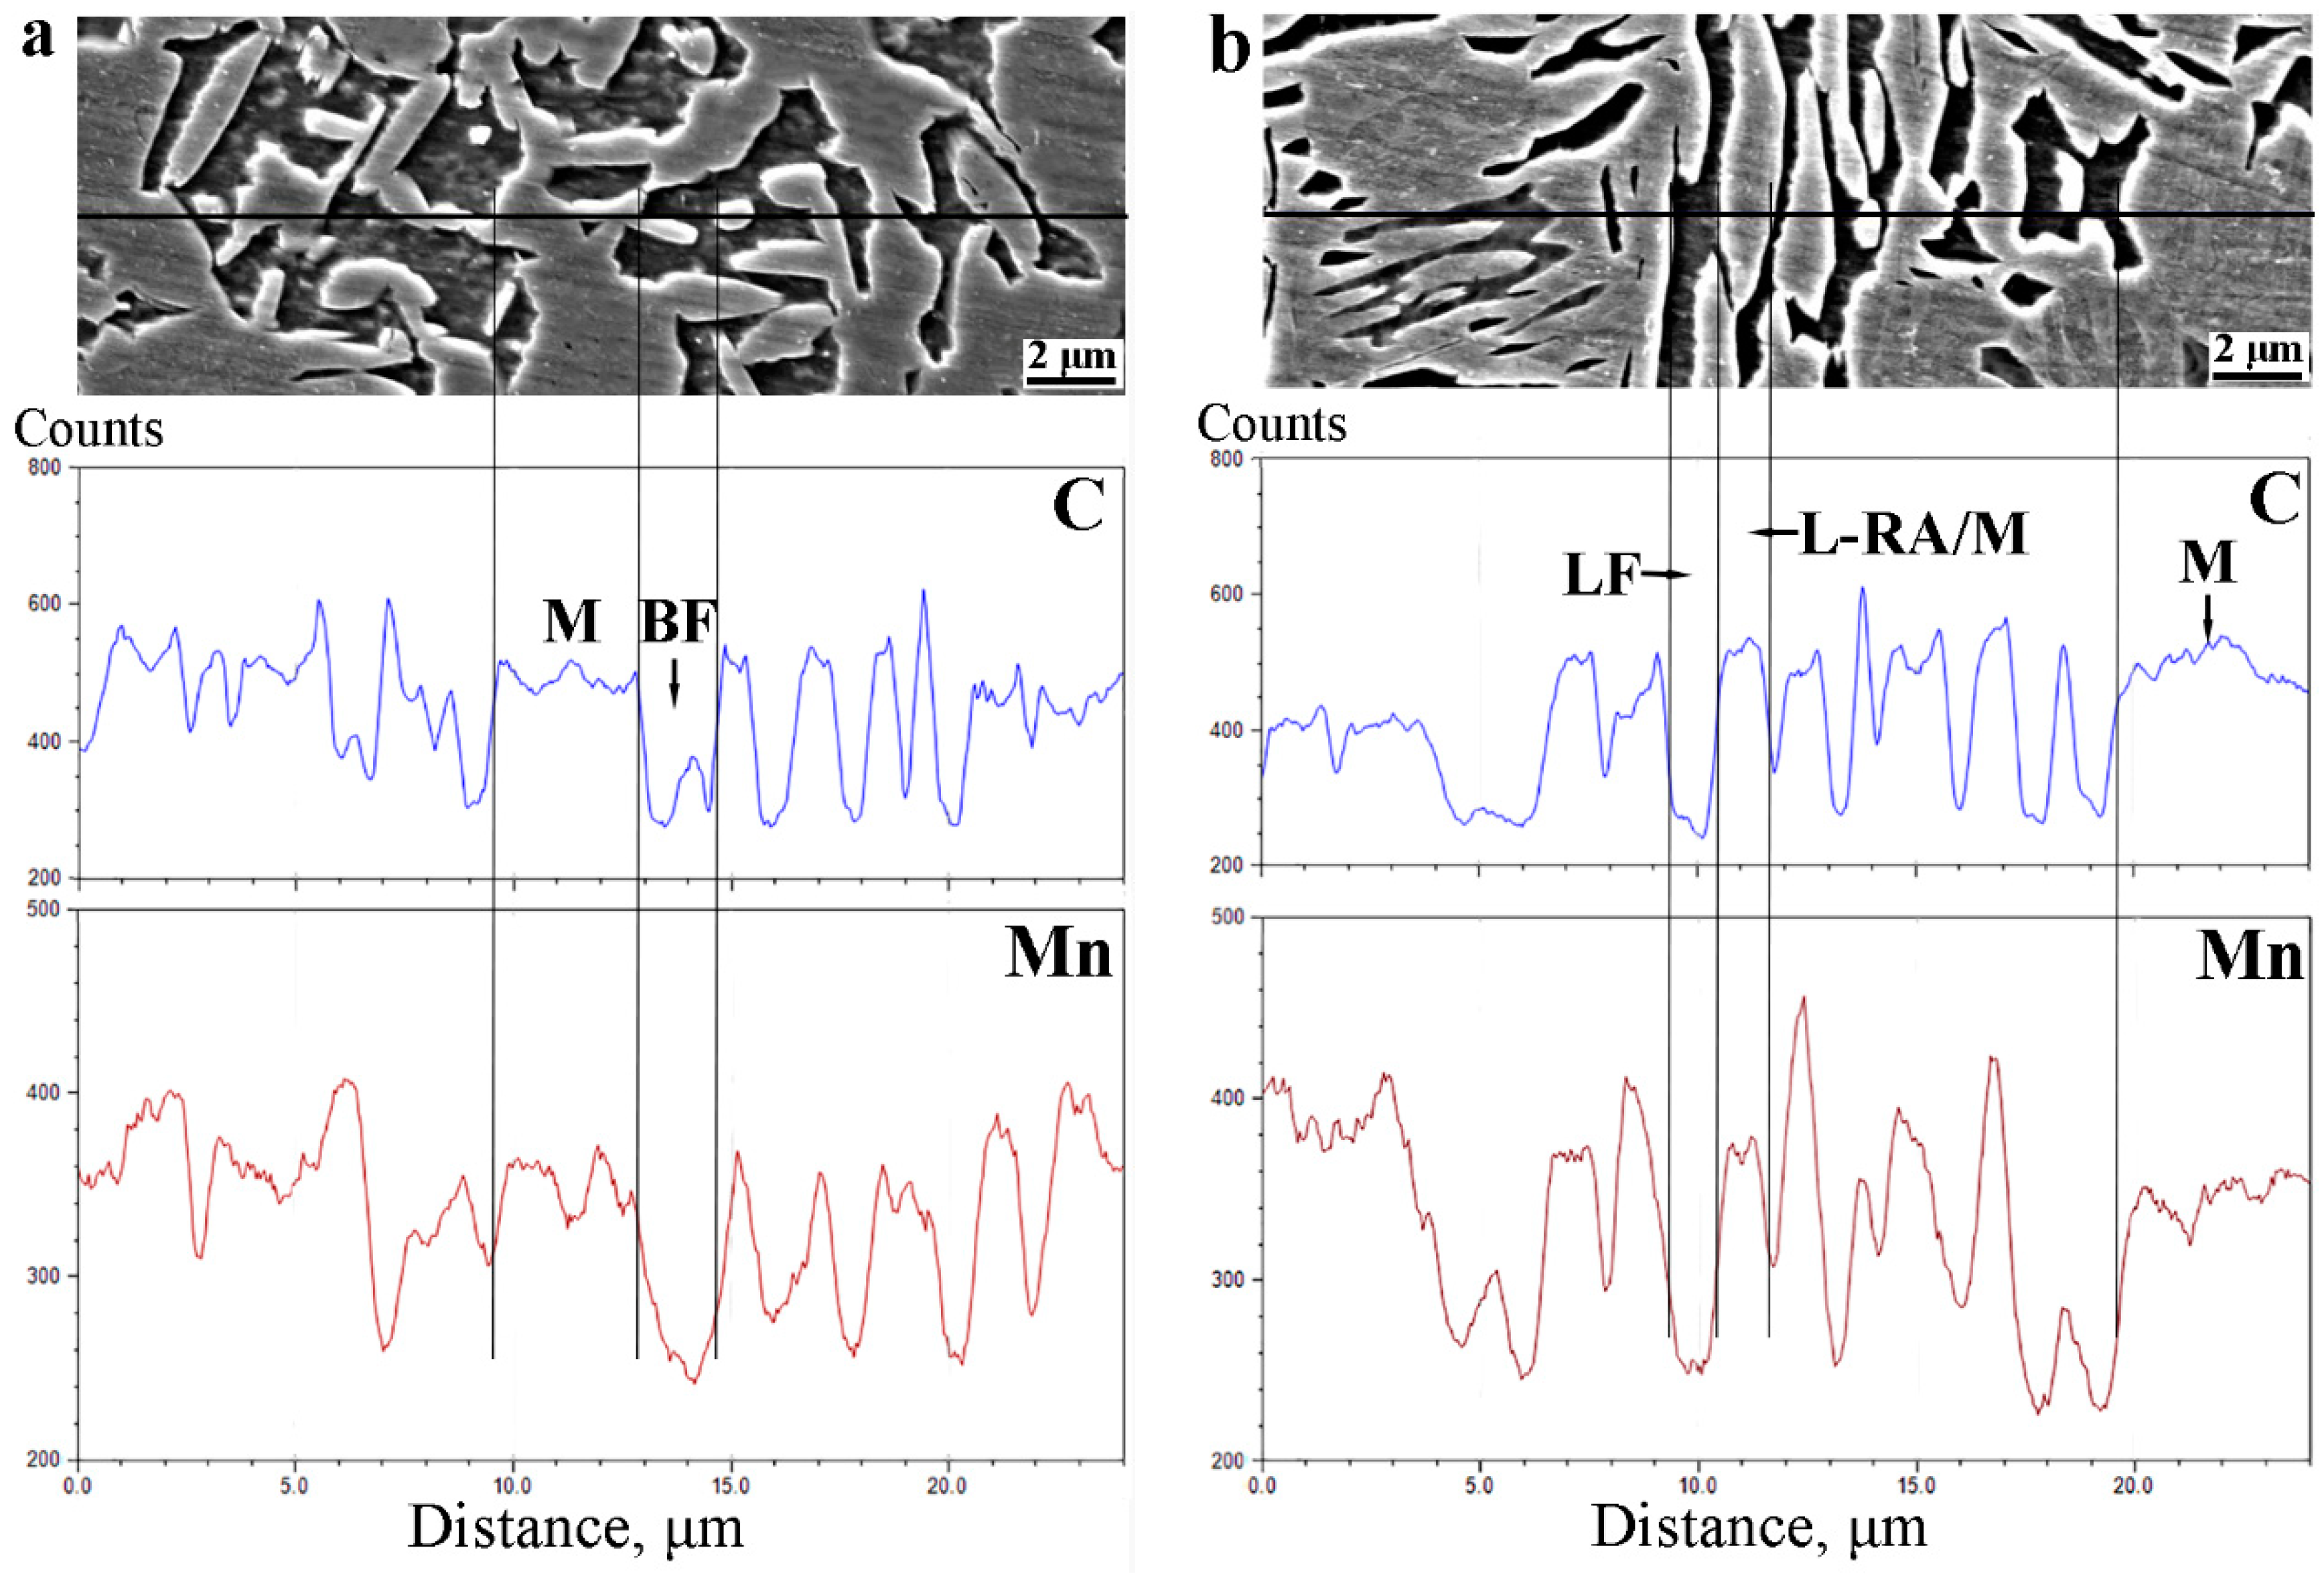
- The microstructure morphology of the Q&P sample will affect the diffusion of carbon in metastable austenite grains during the partitioning stage. Compared with blocky austenite, lath-shaped austenite can shorten the diffusion path of carbon in austenite grains, increase the homogenization of carbon in austenite grains, thereby improving the thermal stability of lath-shaped austenite.
- (3)
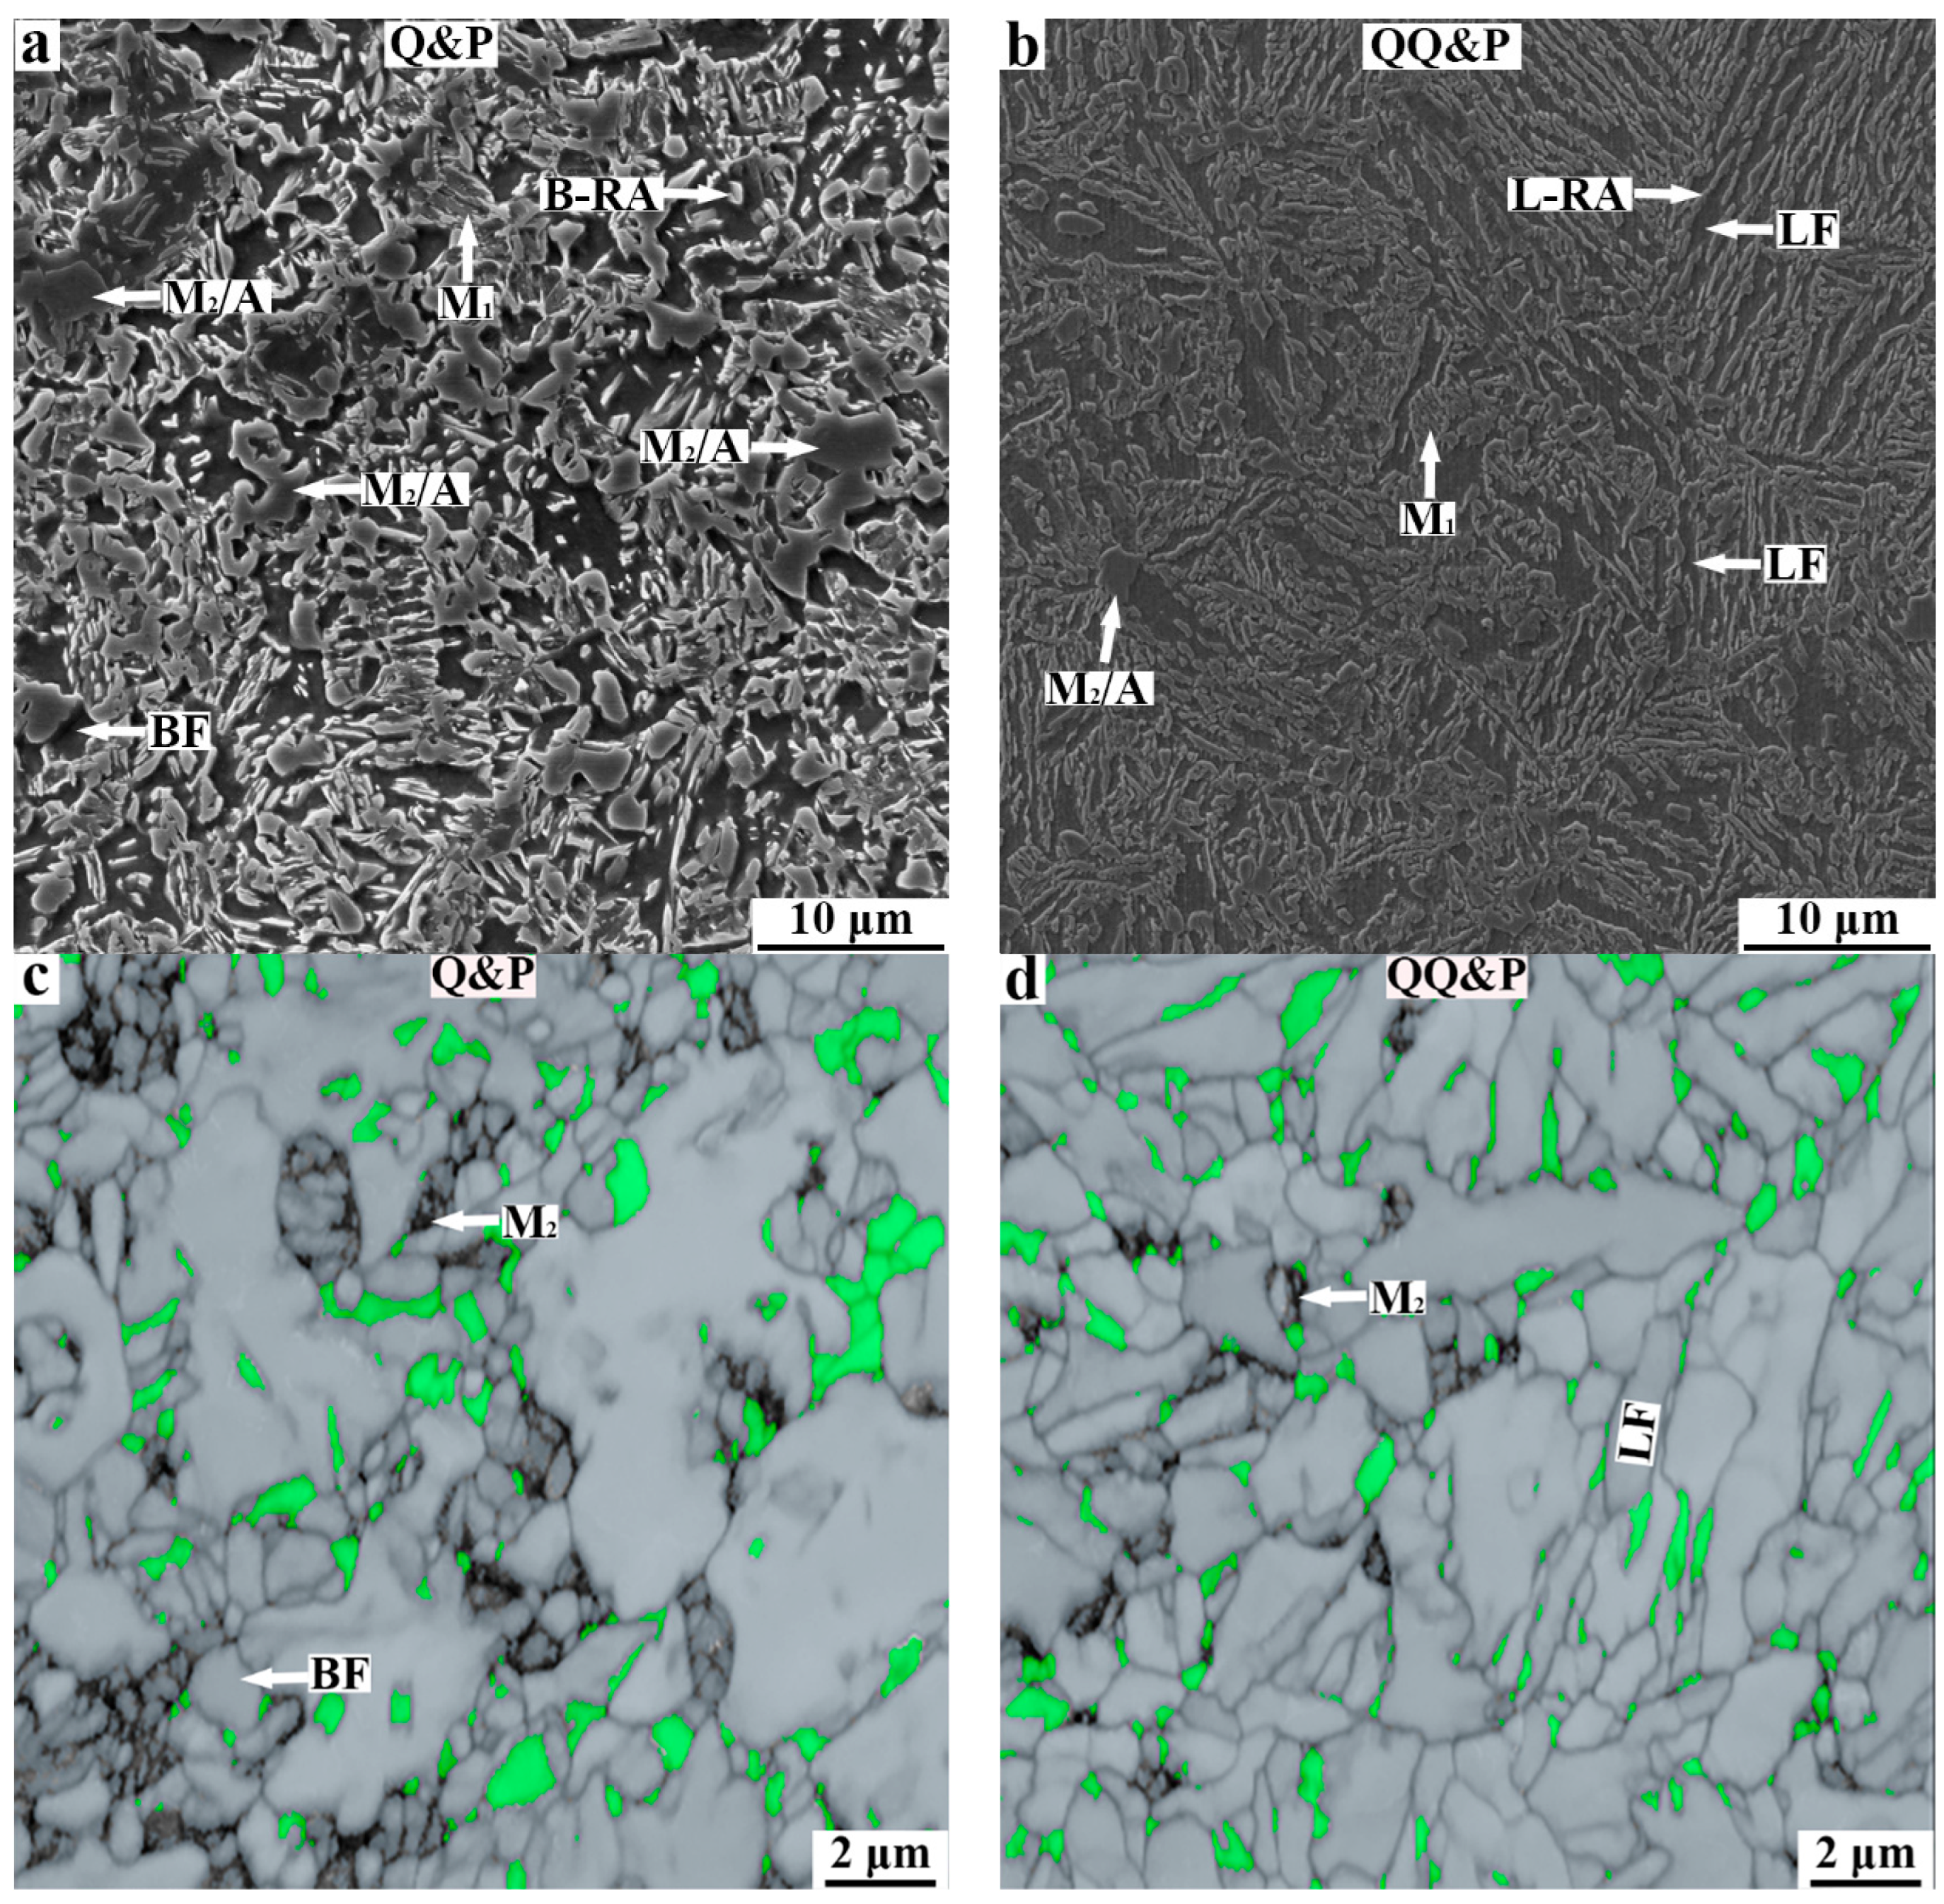
- Compared with the Q&P sample with blocky microstructures, the QQ&P sample with lath-shaped microstructures has higher content of retained austenite (14.74% vs. 13.96%), better elongation (25.9% vs. 19.2%), and higher PSE (27.5 GPa% vs. 24.4 GPa%).
Author Contributions
Funding
Institutional Review Board Statement
Informed Consent Statement
Data Availability Statement
Acknowledgments
Conflicts of Interest
References
- Speer, J.G.; Matlock, D.K.; Cooman, B.C.D.; Schroth, J.G. Carbon partitioning into austenite after martensite transformation. Acta Mater. 2003, 51, 2611–2622. [Google Scholar] [CrossRef]
- Speer, J.G.; Matlock, D.K.; Cooman, B.C.D.; Schroth, J.G. Comments on “On the definitions of paraequilibrium and orthoequilibrium” by Hillert, M. and Ågren, J. Scr. Mater. 2004, 50, 697–699, Erratum in Scr. Mater. 2005, 52, 83–85. [Google Scholar]
- Tan, X.D.; Xu, Y.B.; Ponge, D.; Yang, X.L.; Hu, Z.P.; Fei, F.; Ju, X.W.; Wu, D.; Raabe, D. Effect of intercritical deformation on microstructure and mechanical properties of a low-silicon aluminum-added hot-rolled directly quenched and partitioned steel. Mater. Sci. Eng. 2016, A 656, 200–215. [Google Scholar] [CrossRef]
- Liu, L.; He, B.B.; Cheng, G.J.; Yen, H.W.; Huang, M.X. Optimum properties of quenching and partitioning steels achieved by balancing fraction and stability of retained austenite. Scr. Mater. 2018, 150, 1–6. [Google Scholar] [CrossRef]
- Finfrock, C.B.; Clarke, A.J.; Thomas, G.A.; Clarke, K.D. Austenite stability and strain hardening in C-Mn-Si quenching and partitioning steels. Metall. Mater. Trans. A 2020, 51, 2025–2034. [Google Scholar] [CrossRef]
- Mahieu, J.; Cooman, B.C.D.; Maki, J. Phase transformation and mechanical properties of Si-free CMnAl transformation-induced plasticity-aided steel. Metall. Mater. Trans. A 2002, 33, 2573–2580. [Google Scholar] [CrossRef]
- Lee, S.; Cooman, B.C.D. On the selection of the optimal intercritical annealing temperature for medium Mn TRIP steel. Metall. Mater. Trans. A 2013, 44, 5018–5024. [Google Scholar] [CrossRef]
- Forouzan, F.; Borasi, L.; Vuorinen, E.; Mücklich, F. Optimization of quenching temperature to minimize the micro segregation induced banding phenomena in quenching and partitioning (Q & P) steels. Steel Res. Int. 2019, 90, 1800281. [Google Scholar]
- Chen, L.S.; Zhang, J.Y.; Tian, Y.Q.; Song, J.Y.; Xu, Y.; Zhang, S.H. Effect of Mn pre-quenching on C partitioning and retained austenite of Q&P steels. Acta Metall. Sin. 2015, 51, 527–536. [Google Scholar]
- Kim, J.H.; Kwon, M.H.; Gu, G.; Lee, J.S.; Suh, D.W. Quenching and partitioning (Q&P) processed medium Mn steel starting from heterogeneous microstructure. Materialia 2020, 12, 100757. [Google Scholar]
- Zhang, J.; Ding, H.; Misra, R.D.K.; Chao, W. Enhanced stability of retained austenite and consequent work hardening rate through pre-quenching prior to quenching and partitioning in a Q-P microalloyed steel. Mater. Sci. Eng. A 2014, 611, 252–256. [Google Scholar] [CrossRef]
- Ren, Y.Q.; Xie, Z.J.; Zhang, H.W.; Yuan, S.F.; Shang, C.J. Effect of precursor microstructure on morphology feature and mechanical property of C-Mn-Si steel. Acta Metall. Sin. 2013, 12, 1558–1566. (In Chinese) [Google Scholar] [CrossRef]
- Ding, R.; Tang, D.; Zhao, A.; Dong, R.; Cheng, J.; Zhang, X. A new type of quenching and partitioning processing developed from martensitic pre-microstructure. Mater. Manuf. Process. 2014, 29, 704–709. [Google Scholar] [CrossRef]
- Xu, D.M.; Cheng, Y.Y.; Yang, G.W.; Zhao, G.; Bao, S.Q. The influence of annealing temperature on the morphology of structures and the mechanical properties of prequenching-quenching and partitioning steel. Materials 2022, 15, 4156. [Google Scholar] [CrossRef] [PubMed]
- Su, Y.Y.; Chiu, L.H.; Chuang, T.L.; Huang, C.L.; Wu, C.Y.; Liao, K.C. Retained austenite amount determination comparison in JIS SKD11 steel using quantitative metallography and X-ray diffraction methods. Adv. Mater. Res. 2012, 482–484, 1165–1168. [Google Scholar] [CrossRef]
- Vandjk, N.H.; Butt, A.M.; Zhao, L.; Sietsma, J.; Offerman, S.E.; Wright, J.P.; Zwaag, S. Thermal stability of retained austenite in TRIP steels studied by synchrotron X-ray diffraction during cooling. Acta Mater. 2015, 53, 5439–5447. [Google Scholar] [CrossRef]
- Santofimia, M.J.; Zhao, L.; Sietsma, J. Microstructural evolution of a low-carbon steel during application of quenching and partitioning heat treatments after partial austenitization. Metall. Mater. Trans. A 2009, 40, 46–57. [Google Scholar] [CrossRef]
- Santofimia, M.J.; Petrov, R.H.; Zhao, L.; Sietsma, J. Microstructural analysis of martensite constituents in quenching and partitioning steels. Mater. Character. 2014, 92, 91–95. [Google Scholar] [CrossRef]
- HajyAkbary, F.; Sietsma, J.; Miyamoto, G.; Kamikawa, N.; Petrov, R.H.; Furuhara, T.; Santofimia, M.J. Analysis of the mechanical behavior of a 0.3 C-1.6 Si-3.5 Mn (wt%) quenching and partitioning steel. Mater. Sci. Eng. A 2016, 677, 505–514. [Google Scholar] [CrossRef]
- Yang, D.Z.; Brown, E.L.; Matlock, D.K.; Krauss, G. Ferrite recrystallization and austenite formation in cold-rolled intercritically annealed steel. Metall. Trans. A 1985, 16A, 1385–1391. [Google Scholar] [CrossRef]
- Li, Y.J.; Liu, D.; Chen, D.; Kang, J.; Wang, X.H.; Yuan, G.; Misra, R.D.K.; Wang, G.D. Response of retained austenite to quenching temperature in a novel low density Fe-Mn-Al-C steel processed by hot rolling-air cooling followed by non-isothermal partitioning. Mater. Sci. Eng. A 2019, 753, 197–207. [Google Scholar] [CrossRef]
- Shi, J.; Xu, H.; Zhao, J.; Cao, W.; Wang, C.; Wang, C.; Li, J.; Dong, H. Effect of austenization temperature on the microstructure evolution of the medium manganese steel (0.2C-5Mn) during ART-annealing. Acta Metall. Sin. 2012, 25, 111–123. [Google Scholar]
- Cheng, Y.Y.; Zhao, G.; Xu, D.M.; Mao, X.P.; Bao, S.Q.; Yang, G.W. Comparative study on microstructures and mechanical properties of Q & P steels prepared with hot-rolled and cold-rolled C-Si-Mn sheets. J. Mater. Res. Tech. 2022, 20, 1226–1242. [Google Scholar]
- Speich, G.R.; Szirmae, A.; Richards, M.J. Formation of austenite from ferrite and ferrite-carbide aggregates. Trans. Met. Soc. AIME 1969, 245, 1063–1074. [Google Scholar]
- Agren, J. Computer simulations of the austenite/ferrite diffusional transformations in low alloyed steels. Acta Metall. 1982, 30, 841–851. [Google Scholar] [CrossRef]
- Wei, R.; Enomoto, M.; Hadian, R.; Zurob, H.S.; Purdy, G.R. Growth of austenite from as-quenched martensite during intercritical annealing in an Fe-0.1C-3Mn-1.5Si alloy. Acta Mater. 2013, 61, 697–707. [Google Scholar] [CrossRef]
- Wu, Y.X.; Wang, L.Y.; Sun, W.W.; Styles, M.J.; Studer, A.J.; Bréchet, Y.; Arlazarov, A.; Hutchinson, R.C. Austenite formation kinetics from multicomponent cementite-ferrite aggregates. Acta Mater. 2020, 196, 470–487. [Google Scholar] [CrossRef]
- Rizzo, F.C.; Edmonds, D.V.; He, K.; Speer, J.G.; Matlock, D.K.; Clarke, A. Carbon enrichment of austenite and carbide precipitation during the quenching and partitioning (Q & P) process. Solid Phase Transform. Inorg. Mater. 2005, 1, 535–544. [Google Scholar]
- Gouné, M.; Aoued, S.; Danoix, F.; Geandier, G.; Poulon-Quintin, A.; Hell, J.C.; Soler, M.; Allainet, S.Y.P. Alloying-element interactions with austenite/martensite interface during quenching and partitioning of a model Fe-C-Mn-Si alloy. Scr. Mater. 2019, 162, 181–184. [Google Scholar] [CrossRef]
- Sun, B.; Fazeli, F.; Scott, C.; Guo, B.; Aranas, C., Jr.; Chu, X.; Jahazi, M.; Yue, S. Microstructural characteristics and tensile behavior of medium manganese steels with different manganese additions. Mater. Sci. Eng. A 2018, 729, 496–507. [Google Scholar] [CrossRef]
- Hu, J.; Du, L.X.; Xu, W.; Zhai, J.H.; Dong, Y.; Liu, Y.J.; Misra, R.D.K. Ensuring combination of strength, ductility and toughness in medium-manganese steel through optimization of nano-scale metastable austenite. Mater. Character. 2018, 136, 20–28. [Google Scholar] [CrossRef]
- Hu, J.; Zhang, J.M.; Sun, G.S.; Du, L.X.; Liu, Y.; Dong, Y.; Misra, R.D.K. High strength and ductility combination in nano-/ultrafine-grained medium-Mn steel by tuning the stability of reverted austenite involving intercritical annealing. J. Mater. Sci. 2019, 54, 6565–6578. [Google Scholar] [CrossRef]
- Sun, S.; Zhao, A. Effect of microstructure morphology on mechanical properties of quenching and partitioning steel. Mater. Sci. Tech. 2018, 34, 347–354. [Google Scholar] [CrossRef]
- Knijf, D.D.; Petrov, R.; Föjer, C.; Kestens, L.A.I. Effect of fresh martensite on the stability of retained austenite in quenching and partitioning steel. Mater. Sci. Eng. A 2014, 615, 107–115. [Google Scholar] [CrossRef]


Publisher’s Note: MDPI stays neutral with regard to jurisdictional claims in published maps and institutional affiliations. |
© 2022 by the authors. Licensee MDPI, Basel, Switzerland. This article is an open access article distributed under the terms and conditions of the Creative Commons Attribution (CC BY) license (https://creativecommons.org/licenses/by/4.0/).
Share and Cite
Xiao, H.; Zhao, G.; Xu, D.; Cheng, Y.; Bao, S. Effect of Microstructure Morphology of Q&P Steel on Carbon and Manganese Partitioning and Stability of Retained Austenite. Metals 2022, 12, 1613. https://doi.org/10.3390/met12101613
Xiao H, Zhao G, Xu D, Cheng Y, Bao S. Effect of Microstructure Morphology of Q&P Steel on Carbon and Manganese Partitioning and Stability of Retained Austenite. Metals. 2022; 12(10):1613. https://doi.org/10.3390/met12101613
Chicago/Turabian StyleXiao, Huan, Gang Zhao, Deming Xu, Yuanyao Cheng, and Siqian Bao. 2022. "Effect of Microstructure Morphology of Q&P Steel on Carbon and Manganese Partitioning and Stability of Retained Austenite" Metals 12, no. 10: 1613. https://doi.org/10.3390/met12101613
APA StyleXiao, H., Zhao, G., Xu, D., Cheng, Y., & Bao, S. (2022). Effect of Microstructure Morphology of Q&P Steel on Carbon and Manganese Partitioning and Stability of Retained Austenite. Metals, 12(10), 1613. https://doi.org/10.3390/met12101613