Abstract
Microstructures and mechanical properties of Al-5Zn-2.6Mg alloys with 0.24, 0.43, and 0.91 wt.% Cu were studied and the precipitation rate and activation energy at 378, 393, and 408 K were calculated using the Arrhenius equation in this work. The aging reaction rate k increased and the precipitation activation energy Ea decreased from 25.7 to 15.0 kJ/mol. The η’ distribution density of the precipitates clearly increased with increasing Cu content. However, the size and number of coarse second phase with Fe and Mn impurities also increased, which increased the tendency for crack initiation and propagation at the grain boundary, resulting in a decrease in dimple area. The fracture morphology transformed from plastic transgranular fracture to brittle intergranular fracture and the elongation of the alloys decreased by 3.8%. The contribution of Cu content to yield strength was predominantly due to precipitation strengthening rather than grain boundary strengthening and solid solution strengthening. The tensile strength of the Al-5Zn-2.6Mg alloys with 0.91 wt.% Cu subject to peak aging at 393 K increased by 10.2%.
1. Introduction
Al-Zn-Mg alloys are characterized by high specific strength, good weldability, and excellent formability. They are indispensable, lightweight materials in the aerospace, automobile, and building materials fields [1,2,3,4,5]. Al-Zn-Mg alloys have high corrosion sensitivity in the peak aging state. The addition of Cu improves the potential of grain boundary precipitates (GBPs) and reduces the anodic dissolution rate and stress corrosion crack growth rate [6,7], while Al7Cu2Fe intermetallic containing Cu can reduce pitting corrosion performance [8]. Therefore, control of the Cu content is critical to the comprehensive properties in Al-Zn-Mg alloys [9].
In previous studies, the precipitation sequence of Al-Zn-Mg as an aging strengthening alloy was as follows: supersaturated solid solution (SSS) → Guinier–Preston zones (GPZs) → metastable phase (η’) → equilibrium phase (η), in which η’ phase is the main precipitation strengthening phase [10]. The alloy composition and heat treatment have a considerable impact on the volume fraction, size, and precipitation rate of precipitates in grains and grain boundaries. The comprehensive properties of materials can be regulated by controlling the composition and aging process of materials. Increasing the Cu content improves the age-hardening effect, but the strengthening of Cu relative to Mg is limited [11,12]. In terms of microstructure, changing the precipitation sequence and advancing the formation of early clusters in the process of artificial aging at 413 K were attributed to Cu, whereas the η precursor phase was found in high Cu-containing alloys (≥3.0 wt.%), preventing the alloy from over aging [13]. Chinh et al. [14] further found that the formation of η’ phase was promoted during aging by Cu addition, which affected the precipitation density, shape, and chemical composition of GPZ after quenching. In terms of precipitation kinetics, Khalfallah et al. [15] calculated the values of activation energy Ea and Avrami parameter n of GPZ, η’ phase, and η phase in Al-Zn-Mg-Cu alloys. It was concluded that GPZ and precipitates were formed by the diffusion of Zn and Mg atoms under various migration rates. Fang et al. [16] predicted the phase transformation dynamics of Li to the 7075 aluminum alloy by means of differential thermal analysis. However, Li did not affect the formation of GPZ and, strikingly, improved the dissolution activation energy of the η’ phase. Esmaeili et al. [17] simulated the effect of naturally aged atomic clusters on the nucleation and growth of precipitated phases in the subsequent artificial aging process and then combined the dynamic model with the yield strength model of aging-strengthened aluminum alloy to forecast the precipitation-hardening behavior of naturally aged alloys.
However, there are limited reports on the influence of solid-solution minor Cu in the matrix on the properties of Al-Zn-Mg alloys. Reports on the influence of solid solution minor Cu on the precipitation kinetics parameters are also rare. In this study, the effect of Cu on the precipitation kinetics of Al-Zn-Mg alloys at different aging temperatures was investigated by adding Cu to the alloys and the mechanism controlling the microstructure and strength in the peak aging state was further explored.
2. Materials and Methods
The experimental raw materials used were 99.9% Al, 99.9% Mg, and 99.9% Zn. Cu and Cr were added for microalloying using Al-2Cu and Al-5Cr master alloys, while Fe and Si were added as an impurity element. The alloy was melted in a range of 993–1033 K to form three 20 mm thick square ingots. The chemical composition is shown in Table 1, which was measured by direct reading spectrometer. The ingots were homogenized at 743 K for 24 h (cooled in air) and rolled to 3 mm in a range of 693–723 K. The obtained rolled plates were solution treated at 743 K for 1 h, then water-quenched at room temperature, and finally transferred to a resistance furnace for artificial-aging heat treatment. Due to the aging temperature of Al-Zn-Mg usually being 393 K [5,6,10,18] and in order to keep enough aging strengthening effect and difference in precipitation kinetics, we choose 378, 393, and 408 K to study the effect of aging temperature on precipitation kinetics Al-Zn-Mg-xCu.

Table 1.
Chemical compositions of Al-5Zn-2.6Mg-xCu aluminum alloys (wt. %).
The specimens were mechanically polished and were electropolished using a solution of 10 vol.% perchloric acid and 90 vol.% ethanol in a range of 298 K with an electrolytic potential of 20 V and a current of 500 mA. Then, the grain orientation on the ND (normal direction)-RD (rolling direction) section and the distribution of coarse second-phase particles on the ND-TD (transverse direction) surface of the specimens was investigated by electron backscattered diffraction (EBSD) and energy dispersive spectrometer (EDS) system installed on scanning electron microscope (SEM) Zeiss EVO MA10 at 20 kV (Carl Zeiss Microscopy GmbH, Munich, Germany) and the EBSD data, including grain size distribution, Taylor factor distribution, recrystallization distribution map, etc., were analyzed by the HKL Channel 5.0 software (Oxford University, Oxford, UK). At the same time, the specimens were mechanically grounded to 0.15 mm and ion thinned to 0.08 mm in thickness, then punched with a round sheet with a diameter of 3 mm. Then, the specimens were electropolished in a mixed solution of 30 vol.% nitric acid and 70 vol.% methanol in a range of 248 K with an electrolytic potential of 15 V and a current of 90–100 mA. The precipitation morphology in the grains was observed and photographed using a transmission electron microscope (TEM) of FEI TECNAI G20 at 200 kV, (FEI Company, Hillsboro, The United States of America). The accelerating voltage was 200 kV. The SEM and TEM tests were carried out on specimens in the peak aging state. To verify the significance and consistency of the results, the parameters of the phase were measured by averaging five images at least five times from different positions for each specimen and the areas measured for SEM and TEM are at least 500,000 μm2 and 37,500 nm2.
The hardness of the specimens was tested using an HV-10B Vickers hardness tester (Shuttle Inc., Shenzhen, China) every hour at different ageing temperatures with a load of 30 N and the loading time is 15 s. The final value was obtained by averaging five points measured in each test. Tensile tests were carried out according to the GB/T 228.1-2010 standard in the DDL-100 universal electronic testing machine at room temperature [19]. The specimens were cut in the rolling direction. The specimen gauge distance was 25 mm and the tensile speed was 2 mm/min. The strength of each sample was obtained by averaging the values from three measurements. After the experiment, the elongation was measured and the fracture morphology was observed by SEM in the secondary electron mode.
3. Results
3.1. Age Hardening
The relationships of aging temperature and time to the microhardness of alloys A, B, and C are shown in Figure 1 and Table 2. For aging at 378 K, alloys A, B, and C reached peak hardness (164.2, 170.5, and 176.2 HV, respectively) at 37, 34, and 30 h, respectively. For aging at 393 K, alloys A and B reached peak aging 3 h earlier, whereas alloy C reached peak aging 4 h earlier; the peak hardness increased by 5.3, 1.7, and 3.8 HV, respectively. When the temperature increased to 408 K, alloys A, B, and C reached peak hardness at 26, 20, and 14 h, respectively. However, with respect to the results obtained for aging at 105 °C (378 K), the peak hardness decreased by 3.9, 5.6, and 3.8 HV, respectively. It is clear that increasing the aging temperature of an alloy with a specific Cu content accelerates the time taken to reach peak hardness, but the peak hardness decreases when the temperature exceeds 393 K. For a given aging temperature, faster hardening responses and higher peak hardness values were induced with the increase in Cu content.
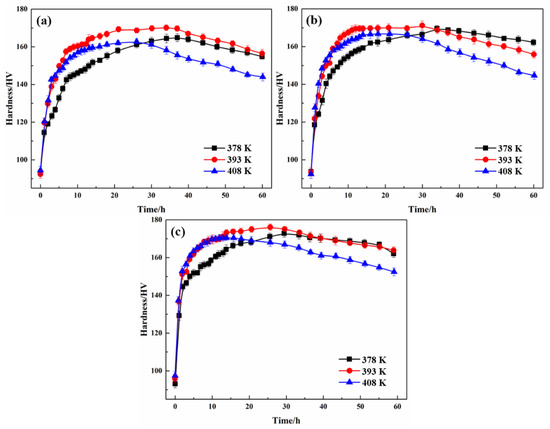
Figure 1.
Age-hardening curves of Al-5Zn-2.6Mg-xCu alloys at different temperatures: (a) x = 0.24 wt.%, (b) x = 0.43 wt.%, and (c) x = 0.91 wt.%.
Table 2.
Peak hardness and aging time of Al-5Zn-2.6Mg-xCu alloy.
3.2. Mechanical Properties
The tensile properties of alloys with different Cu contents in the 393 K peak-aging state are shown in Figure 2. The yield strength and tensile strength of alloy A were 439.9 and 480.8 MPa, respectively, with 0.24 wt.% Cu. With the increase in Cu content to 0.43 wt.%, the yield strength and tensile strength of alloy B increased by 4.5 and 19.1 MPa, respectively, compared with that of alloy A. When the Cu content increased to 0.91 wt.%, the yield strength and tensile strength of alloy C increased by 40.7 and 49.2 MPa, respectively. The addition of Cu changed the chemical composition of aging precipitates, including metastable atomic clusters, GPZ and η’ phase [20,21]. There is a certain amount of Cu in the precipitates, even in the η particles. This phase is considered to have composition Mg (Zn, Cu, Al)2. The higher the effective temperature, the higher the Cu content in the η phase [20,21]. For alloys in a similar aging state, the strength increases with increasing Cu content. This is clearly in accordance with the hardness curves in Figure 1. However, the fracture elongation of alloys A, B, and C was 13.2, 11.4, and 10.5%, respectively, which reduced gradually with increasing solute concentration and yield strength.
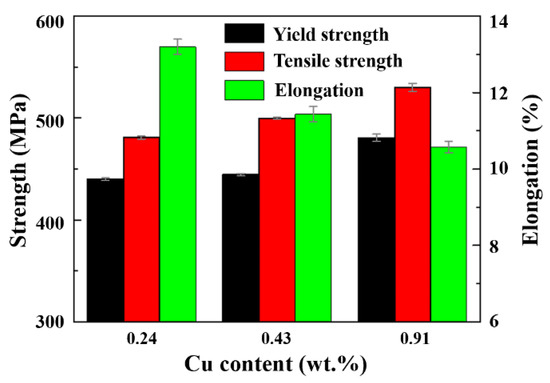
Figure 2.
Yield strength, tensile strength, and elongation of Al-5Zn-2.6Mg-xCu alloys as a function of Cu content.
Figure 3 shows the corresponding scanning fracture morphology of the specimens. The dimples and smooth surfaces are marked by red and blue lines. In accordance with the literature [22], there are four basic fracture mechanisms of Kahn tear test because of the fracture mechanism modes and main characteristics. It is clear that the impurity phase existed in the alloy in different proportions and increased with increasing Cu content. This corresponds to fracture mode III (Ductile transgranular shear fracture, showing large planar areas crossed by intense slip lines) and was caused by coarse intermetllic (IM) compounds. As shown in Figure 3d, impurity phases rich in Cr were found on the facture surface. In the initial stage of plastic flow, coarse particles fractured or separated from the matrix, providing damage initiation points and preferred crack paths prior to crack formation. Coarse particles are beneficial to crack growth and toughness reduction. In addition to mode III, the area fraction of mode II (Ductile transgranular fracture, characterized by dimples, the center of which contain constituent particles) in alloy A is visibly larger than that of the other alloys. The fracture in alloy B is characterized by a high density of micro-dimples and has a step-like distribution. Moreover, a relatively smooth surface morphology (mode Ⅳ: Ductile intergranular or inter-subgranular fracture, characterized by relatively smooth surfaces, revealing the initial grain structure) was found in alloy C. The result shows that the fracture mechanism changed from mode Ⅱ to mode Ⅳ with increasing Cu content.
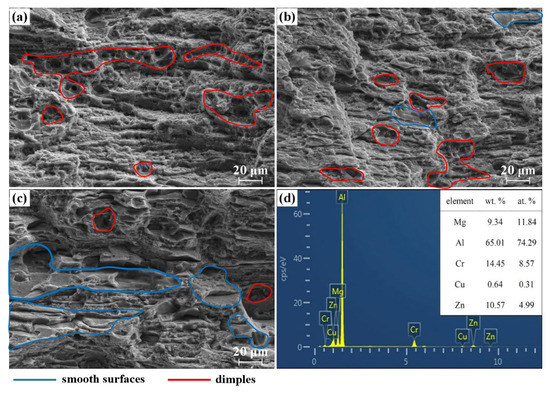
Figure 3.
Fracture morphology of Al-5Zn-2.6Mg-xCu alloys at room temperature: (a) x = 0.24 wt.%; (b) x = 0.43 wt.%; (c) x = 0.91 wt.%; and (d) chemical composition of the second phase of dimples.
3.3. Microstructure
The grain structures of the alloys are shown in Figure 4a,d,g. The grain and lattice of the alloy broken and distorted due to the cold working deformation, which caused large orientation difference occurred in the deformed structure. The nucleation and growth occurred in the alloy with the temperature increased, exceeding recrystallization temperature and keeping. Therefore, the grain orientation difference in the recrystallized structure is very small due to the lower internal stress and work hardening. Therefore, the grains with an internal orientation difference of more than 7.5° were defined as deformed structure, the grains with an internal orientation difference of less than 1° as the recrystallized structure, and the remaining grains as substructure. There are obvious differences in the microstructures of the three alloys with different Cu contents that underwent identical deformation and heat treatment. Although the grains were slightly elongated in the rolling direction, the degree of recrystallization after quenching of the solution differed. The blue and yellow regions are recrystallized grains and uncrystallized grains, respectively. Statistical analysis of the recrystallized structure using HKL Channel 5 software (Oxford University, Oxford, UK) found that the trend was not the same as described in the literature [18]. The recrystallized structure of alloy C was 87.1%, which is the highest of the three alloys, followed by alloy A (81.2%) and alloy B (46.1%). Concurrently, the average grain sizes of the alloy A, B, and C were 43.21, 33.39, and 32.06 μm, which show similar grain size distributions, as shown in Figure 4c,f,i and the grains were refined by 34.77% as the Cu content increased from 0.24 to 0.91 wt.%.
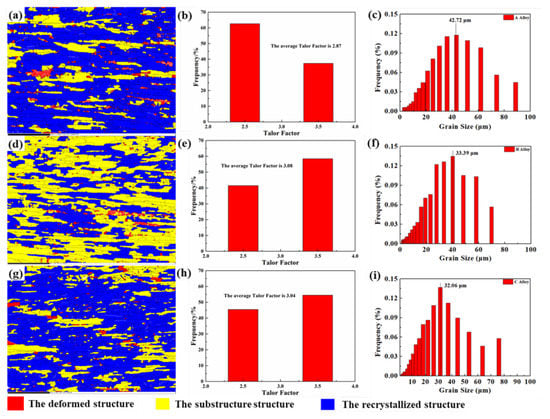
Figure 4.
EBSD maps of Al-5Zn-2.6Mg-xCu alloys: (a) x = 0.24 wt.%, (d) x = 0.43 wt.%, and (g) x = 0.91 wt.% and corresponding frequency distribution of (b,e,h) Taylor factor and (c,f,i) grain size.
Taylor factor is an important parameter for predicting mechanical properties. It is a physical quantity that describes the relationship between macro stress and micro dislocation slip/Twin critical shear stress (CRSS) under multi-slip conditions based on crystal plasticity theory. The graphs in Figure 4b,e,h are the Taylor factor frequency distribution maps corresponding to the crystal grains shown to the left with increasing Cu content, from which it can be concluded that the average values of the Taylor factors are 2.87, 3.08, and 3.04 for alloys A, B, and C, respectively.
Figure 5 shows the SEM analysis results of the longitudinal sections of alloys A, B, and C after solution quenching and peak ageing treatment. These volume fractions in the second phase could be derived from the 2D SEM images because, for a 3D distribution of particles, the volume fraction is equal to the area fraction measured in the cutting face of a random cut. The volume fractions of the second phase in alloy A, B, and C are 0.31, 0.47, and 0.52%. There are bright white and gray intermetallic phase particles visible through local magnification (as shown in Figure 5d).
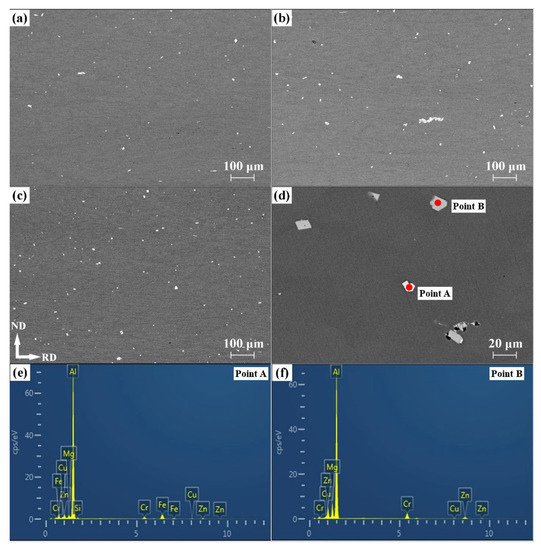
Figure 5.
SEM images of Al-5Zn-2.6Mg-xCu alloys with different Cu contents: (a) x = 0.24 wt.%, (b) x = 0.43 wt.%, (c) x = 0.91 wt.%. (d) Local amplification. Energy spectrum analysis of white (e) and gray (f) phases in (d).
According to the energy spectrum results in Figure 5e, f, the white and gray phases are considered to be rich in Fe, Si, and Cr, respectively, and contain Zn, Mg, and Cu from the surrounding matrix, respectively, which is consistent with the chemical composition of the dimple cavity. In addition, the Cr-rich intermetallic compounds have significant differences in composition according to the EDS results in Table 3. The Cu content in the matrix and the volume fraction of second phases increased with increasing Cu content. This indicates that Cu tends to promote increases in the volume fraction of the secondary phases.
Table 3.
Chemical composition of secondary phase in Al-5Zn-2.6Mg-xCu alloy (wt.%).
TEM images in Figure 6a,c,e show the precipitates in the matrixes of the three alloys with different Cu contents at 378 K peak aging. The η’ precipitates appear oriented along the habitual plane {111}Al and present a short rod-shaped and approximately disc-shaped structure in two directions when projected under the axis of <110>Al crystal band [23,24]. The right-hand side of the image shows the corresponding selected area electron diffraction (SAED) in the <110> zone axis of Al. It is observed that there are diffraction streaks in the {111} direction, as well as diffraction spots at 1/3 and 2/3 of the {220} direction, which represents a large amount of η’ phase particles [11]. However, there are almost no differences between the SAED images of the three alloys. The bright-field (BF) images show that the spheroidal or ellipsoidal η’ phase precipitates are evenly distributed in the matrixes of the three alloys [25].
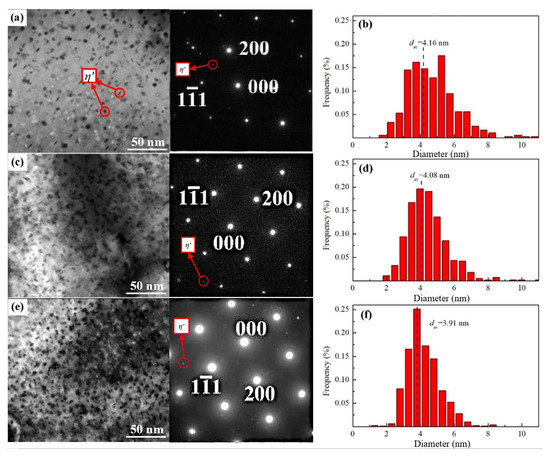
Figure 6.
TEM images of Al-5Zn-2.6Mg-xCu alloys at 393 K peak aging: (a) x = 0.24 wt.%, (c) x = 0.43 wt.%, and (e) x = 0.91wt.% and (b,d,f) corresponding size distribution of the precipitates.
Firstly, we use the scale function in the Image J software v1.8.0 (National Institutes of Health, Bethesda, Rockville, MD, USA) to calibrate the ruler in the TEM images and then measure the diameter and thickness of the η’ phase. Through the measurement of the diameter and thickness of each phase, we can obtain a statistical table and then make a distribution map of the diameter and thickness of the η’ phase. We treat each precipitate as a disk and then the volume of each η’ phase can be determined. The total volume of the η’ phase can be calculated through the number and volume of each η’ phase. The thickness of the thinned TEM sample is calculated to be about 60 nm and the area of the transmission picture, which is the length times the width, is easy to obtain. Therefore, the volume fraction of precipitates in alloys A, B, and C are 5.92 ± 0.04 × 10⁴, 9.96 ± 0.03 × 10⁴, and 1.53 ± 0.05 × 10⁵/μm3, respectively. As observed in Figure 6b,d,f, as the Cu content increases, the size frequency distribution moves to the left as a whole and the plane diameters dav of precipitation are approximately 4.16, 4.08, and 3.91 nm, respectively. This illustrates that copper promotes higher volume fraction of precipitates in the matrix, accompanied by a gradual refinement of the size.
4. Discussion
4.1. Effects of Cu Addition on Precipitation Kinetics
From Figure 1 and Table 2, the time to reach the peak hardness decreased and the peak hardness increased with increasing Cu content from 0.24 to 0.91% at aging temperature of 378, 393, or 408 K. To understand the reason for the increase in hardening rate during aging with the mass fraction of Cu increase, the activation energy Ea must be calculated.
The increase in hardness during aging is due to the precipitation of nanophase nano-reinforcement phase. Owing to the diffusion of solute atoms, the formation and disappearance of clusters and the formation and transformation of GPZ and η’ phase occurred in the aging process [6,15]. The precipitation and transformation rate of nanoparticles are related to the concentration of solute atoms and the saturation of supersaturated solid solution after solution treatment. The activity of the supersaturated solute atoms increases and the early precipitation rate and age hardness enhances as the aging temperature increases. The concentration of solute atoms in the matrix decreases and the precipitation rate slows down with increasing aging time, decreasing the aging trend. The effect of the increase in Cu on the kinetics of precipitation can be described by the Arrhenius equation followed by the rate of chemical reaction at a specific temperature [17]:
where k is the reaction rate related to temperature; A the pre-rate factor, also known as the Arrhenius constant; Ea the chemical activation energy of the reaction, in J/mol or kJ/mol; and R the gas constant. It is suggested that ln(k) is inversely proportional to temperature T and, therefore, the activation energy Ea of the chemical reaction can be defined as:
In describing the isothermal aging of aluminum alloys, this process is regarded as a chemical reaction at a given temperature. To obtain the chemical activation energy Ea of an alloy under isothermal aging, the value of the reaction rate k should be confirmed first. According to Esmaeili et al. [17], the relationship between the reaction rate k of the diffusion-controlled secondary precipitation phase and aging time t satisfies:
where n is a parameter related to time. In most cases, it is difficult to obtain the transformed fraction f; however, the appropriate physical properties of the alloy (such as hardness), f can be measured and defined as [26]:
where Hi is the current hardness value, Haq the hardness value in the quenching state, and Hpeak the peak aging hardness value of the corresponding temperature of the alloy.
The aging hardness data shown in Table 2 were substituted into Equation (4) and the fitting results of the Al-Zn-Mg alloys with different Cu contents in different aging environments are shown in Figure 7. The corresponding precipitation kinetics equations of the aging treatment are shown in Table 4. It is clear that the reaction rate k of each alloy is different at different aging temperatures. For a single alloy, k increases with increasing aging temperature. Meanwhile, the higher the Cu content in the alloy, the greater the reaction rate k at the same temperature.
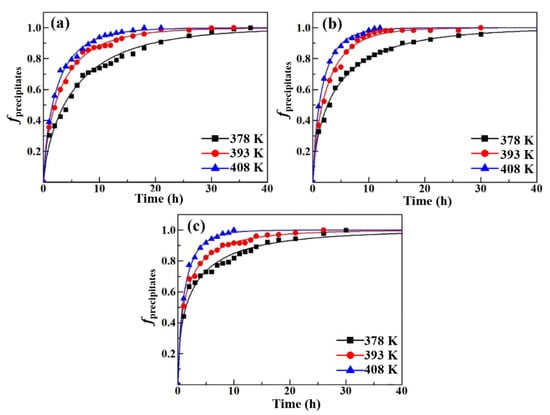
Figure 7.
Relation between transformed fraction of the precipitates and aging time of Al-5Zn-2.6Mg-xCu alloys at different temperatures: (a) x = 0.24 wt.%, (b) x = 0.43 wt.%, and (c) x = 0.91 wt.%.
Table 4.
Precipitation kinetics equations of different Al-5Zn-2.6Mg-xCu alloys and temperatures of aging treatment.
Figure 8 shows the calculation of the chemical activation energy of the isothermal aging precipitation reaction with ln(k) − 1/T. As shown in Figure 8a, the fitting results show that the data obtained at three temperatures have a good linear relationship; therefore, the activation energies of the aging precipitation of alloys A, B, and C can be determined from the slope of the line in Figure 8a as 25.7, 22.8, and 15.0 kJ/mol, as shown in Figure 8b.
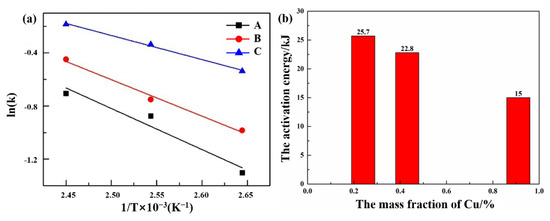
Figure 8.
The (a) relationship between ln(k) and (1/T), and (b) the calculation of the chemical activation energy of aging precipitation reaction by ln(k)−(1/T).
Since the main mechanism of formation of the η’ phase is diffusion-controlled growth, the addition of Cu reduces the activation energy of formation of the η’ phase, which is beneficial for this reaction to be faster. Based on the literature [27], the Monte Carlo method was used to simulate the exsolution process of Cu in the early stage of aging. It was found that the clusters formed by the Cu, Zn, and Mg atoms precipitated in large quantities in the early stage of aging and the clusters were smaller than the Zn-Mg clusters, reducing the concentration of Zn and Mg solute atoms in the Al matrix compared with Cu-free alloys. The results show that with the increase in Cu content, the nucleation rate of precipitates increased and the volume fraction of the precipitates increased after peak aging without increasing the total concentration of matrix solute atoms (Mg + Zn). This result is supported by the characterization result of the precipitates (as shown in Figure 6).
4.2. Model of Strengthening
In order to determine the contribution of Cu content to yield strength, we made the following calculations. In the current research, it is considered that the yield strength of Al-Zn-Mg-Cu alloys satisfies the following comprehensive formula by Starink et al. [28]:
where ∆σgb is the strengthening due to the presence of (sub)grain boundaries, which depends on the grain size; M a Taylor factor that depends on texture, which is determined by EBSD analysis; and τtot the critical resolved shear stress (CRSS) of the grains. There are four contributions to the CRSS of grains, namely the intrinsic CRSS of pure Al (approximately 16 MPa [29]), τ0; the solid solution contribution, τss; the contribution due to dislocations in the grain, τd; and the contribution due to precipitation strengthening, τp. The dislocation strengthening can be neglected because the dislocations of the samples are consumed in the solution process. Hence, we obtain the CRSS of the grains, ∆τtot:
The coarse/fine grains are refined by the formation of dislocation cells during severe deformation, resulting in nanograins [30,31], and an adequate model of the dislocation cell structure might enable an improved prediction of the macroscopic behavior, especially under complex loading conditions [32]. The dislocation cell and subgrain strengthening model in the plastic flow stress model was proposed by Marthinsen and Nes [33]. ∆σgb can be described by the following formula:
where G is the shear modulus of the matrix (approximately 28 GPa), b the Burgers vector of the gliding dislocations (0.286 nm), fReX the recrystallized volume fraction, δ the (sub) grain size or cell size in the unrecrystallized part of the material, α2 a constant (typically 2 [34]), and Dr the grain size of the recrystallized part of the material.
The calculation results of by Nes model as shown in Table 5. After the solution treatment of aluminum alloys, dislocation annihilation and climbing occur in the grains, resulting in an evident reduction in dislocation density, a reduction in the content of the dislocation cells in the grains, and a thinning of the dislocation cell walls; the Nes calculation indicates that Cu has a certain contribution to grain boundary strengthening; however, the strengthening effect is not great.
Table 5.
Strength of grain boundaries of Al-5Zn-2.6Mg-xCu alloy in Nes model.
The amount of solute precipitation during the aging process is limited in the T6 temper and the solution strengthening is determined through the following formula [29]:
where k0 is the coefficient describing the effect of atomic solute on solid solution strengthening and the corresponding strengthening coefficients of Zn, Mg, and Cu are 3.085, 20.081, and 12.431, respectively [29]; Xi is the content in weight-percent of atomic solute in the matrix. The content of the solute in the matrix and the calculation results are shown in Table 6. The combined SEM results show that the volume fraction of intermetallic compound products increased when the Cu content increased from 0.24 to 0.43 wt.% and numerous solute atoms were consumed simultaneously. Although the fraction of intermetallic compounds increased when the Cu content increased to 0.91 wt.%, the Cu diffusion coefficient decreased, which reduced the matrix solute transfer and consumption. Therefore, the solid solution initially decreased and then increased.
Table 6.
Solute concentration of Al-5Zn-2.6Mg-xCu alloy and strength of solid solution.
Precipitation strengthening was mainly due to a hindrance in dislocation motion during plastic deformation of the precipitation phase. The increase in Cu content changed the morphology of the precipitates, as shown in Figure 6. The strengthening effect of Orowan for aluminum alloys can be described according to the following formula [23]:
where ν is the Poisson’s ratio (0.3), λ the effective planner inter-particle spacing, d the diameter of the particles, and r0 the core radius of the dislocations. λ is related to the orientation and distribution of particles as follows:
where fv is the volume fraction of the dispersed phase. Assuming that the precipitate is spherical, then fv is obtained according to the following formula:
where Nv is number density of the phase per unit volume and V the volume of a single precipitate. The relevant parameters and calculation results are shown in Table 7. With increasing Cu content, τp was 47.30, 60.98, and 73.13 MPa, respectively. It was revealed that Cu effectively increased the barrier effect of the unit-area dispersed phase for dislocation. According to the aforementioned calculation, it can be concluded that the strength enhancement in the Cu content depends predominantly on the precipitation characteristics compared with that of solution strengthening and grain boundary strengthening. Finally, all parameters obtained from the calculation were substituted into Equations (5) and (6) and the calculation results are 336.4, 394.7, and 446.2 MPa, respectively. The experimental yield strength and simulation yield strength are shown in Figure 9. These are quite different from the experimental results (the error is 23.38, 11.1, and 7.03%, respectively), while these results show that the addition of Cu effectively improved the strength and hardness of the sample, which is consistent with the experimental result (as shown in Figure 1 and Figure 2).
Table 7.
Statistical information of Al-5Zn-2.6Mg-xCu alloy precipitates.
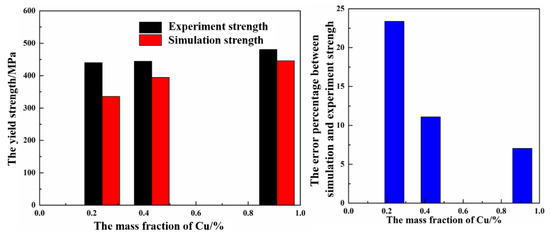
Figure 9.
The (a) experimental yield strength and simulation yield strength of Al-5Zn-2.6Mg-xCu alloy and (b) error percentage between the simulation and the experimental results.
4.3. Fracture Analysis
With the mass fraction of Cu increases, the fracture mode of the Al-Zn-Mg-xCu alloy transforms from ductile fracture to brittle fracture, as shown in Figure 3. The effect of Cu in the microstructure of Al-Zn-Mg alloys on their toughness cannot be explained from a single perspective. From a macroscopic point of view, IM compounds are the main cause of micropores and cracks. It can be seen from Figure 5 that the volume fraction of raw IM compounds increased with increasing Cu content and the chemical composition is similar to that in the pores in Figure 3. The incoherent interface between the coarse second phase and the matrix led to dislocation movement and stress concentration in the plastic deformation stage. At the same time, the non-uniform precipitation of (sub-)crystalline boundaries led to the softening and dissolution of precipitation-free zones (PFZs) in the matrix near the grain boundary during aging. The high yield stress contrast between the grain cores and the PFZs resulted in low deformation persistence of the grain boundary, which, in turn, promoted intergranular fracture. Based on the aforementioned factors, a ductile-fracture model was established by Vratnica and Cvijović [35] and the KIC equation of plane strain fracture toughness is as follows:
where E is the Young’s modulus; L and fIM the mean linear size and volume fraction of the coarse IM particles, respectively; λ the interparticle spacing of the coarse IM particles; AAp the area fraction of large voiding; AAt the area fraction of the transgranular fracture; and WPFZs the width of the precipitation-free zones. For low fractions of fractured particles, m is assumed to be 0.3; for high fractions, m is equal to ~0.5. N is the number of PFZs between the coarse IM particles with distances greater than λ; for simplicity, N = 3 [35]. The relevant parameter values are shown in Table 8. The KIC of alloy A, B, and C are 51.44 MPa·m1/2, 49.61 MPa·m1/2, and 41.58·MPa m1/2, respectively. The value of KIC decreased with the increase in mass fraction of Cu, which is consistent with the trend observed for the elongation.
Table 8.
Relevant parameter values of Al-5Zn-2.6Mg-xCu alloy.
The relationship between fracture toughness ψ and elongation El is as follows from the literature [36]:
The obtained elongations of alloys A, B, and C by calculation are 13.4, 12.9, and 10.8%, respectively. These results are consistent with the experimental results but the former are slightly higher (the errors are 1.52, 11.63, and 2.78%, respectively) and, therefore, may also be related to the degree of recrystallization of the material structure [11]. Thus, the influence of the particle spacing and size and the yield strength on the fracture toughness is significant compared with the effect of the presence of PFZs in the specimens. This further indicates that Cu reduces the toughness of Al-Zn-Mg alloys subject to T6 temper.
5. Conclusions
In this work, the microstructures and mechanical properties of Al-5Zn-2.6Mg-xCu alloys were studied and the precipitation rate, activation energy, strengthening model, and ductile-fracture model were calculated. From the analyses performed, the following major conclusions can be drawn:
- (1)
- For Al-Zn-Mg-xCu alloys, the age-hardening rate increased and the peak hardness increased initially and then decreased with aging temperature increase from 378 to 393 K. The time to reach the peak hardness decreased, the peak hardness increased, the dimple density decreased, and the plateau area fraction increased with increasing Cu content from 0.24 to 0.91% at aging temperatures of 378, 393, or 408 K.
- (2)
- The experiments and Arrhenius kinetic calculation indicate that the increase in temperature and Cu content promoted the reaction rate k and decreased the activation energy Ea, which was accompanied by an increase in the volume fraction of the η’ phase.
- (3)
- The simulation yield strength is consistent with experimental yield strength when the mass fraction of Cu is 0.43 and 0.91%. The contribution of Cu content to yield strength was predominantly due to precipitation strengthening rather than grain boundary strengthening and solid solution strengthening.
Author Contributions
Conceptualization, A.T. and Y.D.; methodology, A.T. and M.Y.; software, L.S. and M.Y.; validation, A.T., Y.D. and M.Y.; formal analysis, LS.; investigation, A.T.; resources, Y.D.; data curation, M.Y. and A.T.; writing—original draft preparation, A.T. and M.Y.; writing—review and editing, Y.D. and L.S.; visualization, A.T.; supervision, M.Y.; project administration, L.S.; funding acquisition, Y.D. All authors have read and agreed to the published version of the manuscript.
Funding
This research was funded by the National Building Project of Application Demonstration Platform on New Materials Products (Project No.TC190H3ZV/2).
Data Availability Statement
Not applicable.
Acknowledgments
All individuals included in this section have consented to the acknowledgement.
Conflicts of Interest
All authors have read and approve this version of the article and due care has been taken to ensure the integrity of the work. The authors declare that they have no known competing financial interests or personal relationships that could have appeared to influence the work reported in this paper. This paper is our original unpublished work and it has not been submitted to any other journal for review.
References
- Williams, J.C.; Starke, E.A. Progress in structural materials for aerospace systems. The Golden Jubilee Issue—Selected topics in Materials Science and Engineering: Past, Present and Future, edited by S. Suresh. Acta Mater. 2003, 51, 5775–5799. [Google Scholar] [CrossRef]
- Freiberg, D.; Zhu, W.; Park, J.-S.; Almer, J.D.; Sanders, P. Precipitate Characterization in Model Al-Zn-Mg-(Cu) Alloys Using Small-Angle X-ray Scattering. Met.-Open Access Metall. J. 2020, 10, 959. [Google Scholar] [CrossRef]
- Yuan, M.; Deng, Y.; Lin, S.; Guo, X.; Xie, Y. Effect of the Cross Accumulative Roll Bonding on the Corrosion Behaviour of AA6082/AA7204 Composite Sheets. Met. Mater. Int. 2021, 27, 3709–3719. [Google Scholar] [CrossRef]
- Yu, X.; Zhao, Z.; Shi, D.; Dong, X.; Shi, X.; Li, C.; Zhao, J.; Dai, H. Enhancing the Corrosion Resistance and Mechanical Properties of a High-Alloying Al-Zn-Mg-Cu-Zr Alloy by Ce Addition and Aging Treatment. Met.-Open Access Metall. J. 2020, 10, 1318. [Google Scholar] [CrossRef]
- Li, H.; Cao, F.; Guo, S.; Jia, Y.; Zhang, D.; Liu, Z.; Wang, P.; Scudino, S.; Sun, J. Effects of Mg and Cu on microstructures and properties of spray-deposited Al-Zn-Mg-Cu alloys. J. Alloy. Compd. 2017, 719, 89–96. [Google Scholar] [CrossRef]
- Dong, P.; Chen, S.; Chen, K. Effects of Cu content on microstructure and properties of super-high-strength Al-9.3Zn-2.4Mg-xCu-Zr alloy. J. Alloy. Compd. 2019, 788, 329–337. [Google Scholar] [CrossRef]
- Li, Y.; Wang, Y.; Lu, B.; Yu, W.; Wang, H.; Xu, G.; Wang, Z. Effect of Cu content and Zn/Mg ratio on microstructure and mechanical properties of Al–Zn–Mg–Cu alloys. J. Mater. Res. Technol. 2022, 19, 3451–3460. [Google Scholar] [CrossRef]
- Sun, Y.; Pan, Q.; Sun, Y.; Wang, W.; Huang, Z.; Wang, X.; Hu, Q. Localized corrosion behavior associated with Al7Cu2Fe intermetallic in Al-Zn-Mg-Cu-Zr alloy. J. Alloy. Compd. 2019, 783, 329–340. [Google Scholar] [CrossRef]
- Deschamps, A.; Bréchet, Y.; Livet, F. Influence of copper addition on precipitation kinetics and hardening in Al-Zn-Mg alloy. Mater. Sci. Technol. 1999, 15, 993–1000. [Google Scholar] [CrossRef]
- Wang, T.; Yin, Z.; Shen, K.; Li, J.; Huang, J.-W. Single-aging characteristics of 7055 aluminum alloy. Trans. Nonferrous Met. Soc. China 2007, 17, 548–552. [Google Scholar] [CrossRef]
- Shu, W.; Hou, L.; Zhang, C.; Zhang, F.; Liu, J.; Zhuang, L.; Zhang, J. Tailored Mg and Cu contents affecting the microstructures and mechanical properties of high-strength Al–Zn–Mg–Cu alloys. Mater. Sci. Eng. A 2016, 657, 269–283. [Google Scholar] [CrossRef]
- Jiao, H.; Chen, K.; Chen, S.; Yang, Z.; Xie, P.; Chen, S. Effect of Cu on the Fracture and Exfoliation Corrosion Behavior of Al-Zn-Mg-xCu Alloy. Met.-Open Access Metall. J. 2018, 8, 48. [Google Scholar] [CrossRef]
- Fang, X.; Du, Y.; Song, M.; Li, K.; Jiang, C. Effects of Cu content on the precipitation process of Al-Zn-Mg alloys. J. Mater. Sci. 2012, 47, 8174–8187. [Google Scholar] [CrossRef]
- Chinh, N.; Lendvai, J.; Ping, D.; Hono, K. The effect of Cu on mechanical and precipitation properties of AI-Zn-Mg alloys. J. Alloy. Compd. 2004, 378, 52–60. [Google Scholar] [CrossRef]
- Khalfallah, A. Precipitation kinetics of GP zones, metastable η′ phase and equilibrium η phase in Al−5.46wt.%Zn−1.67wt.%Mg alloy. Trans. Nonferrous Met. Soc. China 2019, 29, 233–241. [Google Scholar] [CrossRef]
- Fang, W.; Zhao, Z.; Bai, P.; Zhou, T.; Liu, P.; Zhang, Y.; Chen, C. Influence of Lithium on the Kinetics of the Microstructural Transformations in 7075-Li Alloy. Rare Met. Mater. Eng. 2004, 33, 945–948. [Google Scholar] [CrossRef]
- Esmaeili, S.; Lloyd, D.J.; Poole, W.J. Modeling of precipitation hardening for the naturally aged Al-Mg-Si-Cu alloy AA6111. Acta Mater. 2003, 51, 3467–3481. [Google Scholar] [CrossRef]
- Liao, Y.-G.; Han, X.-Q.; Zeng, M.-X.; Jin, M. Influence of Cu on microstructure and tensile properties of 7XXX series aluminum alloy. Mater. Des. 2015, 66, 581–586. [Google Scholar] [CrossRef]
- BS-EN-ISO-6892-2; Standards, I. Metallic Materials; Tensile Testing; Part 1: Method Of Testing (at Ambient Temperature). British Standards Institution: London, UK, 2011.
- Weidlein, E.R. Industrial Changes Due to Chemistry. Ann. Am. Acad. Political Soc. Sci. 1928, 139, 15–33. [Google Scholar] [CrossRef]
- Marlaud, T.; Deschamps, A.; Bley, F.; Lefebvre, W.; Baroux, B. Influence of alloy composition and heat treatment on precipitate composition in Al-Zn-Mg-Cu alloys. Acta Mater. 2010, 58, 248–260. [Google Scholar] [CrossRef]
- Dumont, D.; Deschamps, A.; Brechet, Y. On the relationship between microstructure, strength and toughness in AA7050 aluminum alloy. Mater. Sci. Eng. A 2003, 356, 326–336. [Google Scholar] [CrossRef]
- Nie, J.F.; Muddle, B.C.; Polmear, I.J. The Effect of Precipitate Shape and Orientation on Dispersion Strengthening in High Strength Aluminium Alloys. In Materials Science Forum; Trans Tech Publications Ltd.: Bäch, Switzerland, 1996; pp. 1257–1262. [Google Scholar]
- Li, G.; Ding, H.; Wang, J.; Zhang, N.; Hou, H. Superplastic Tensile Deformation Behavior and Microstructural Evolution of Al–Zn–Mg–Cu Alloy. Met.-Open Access Metall. J. 2019, 9, 941. [Google Scholar] [CrossRef]
- Fan, Y.; Tang, X.; Wang, S.; Chen, B. Comparisons of Age Hardening and Precipitation Behavior in 7075 Alloy under Single and Double-Stage Aging Treatments. Met. Mater. Int. 2021, 27, 4204–4215. [Google Scholar] [CrossRef]
- Yao, D.; Bai, Z.; Qiu, F.; Li, Y.; Jiang, Q. Effects of La on the age hardening behavior and precipitation kinetics in the cast Al–Cu alloy. J. Alloy. Compd. 2012, 540, 154–158. [Google Scholar] [CrossRef]
- Lin, L.Q.; Li, R.; Wang, W.; Nie, Z.R. Monte Carlo simulation of effect of Mg and Cu on precipitation of Al-Zn-Mg alloys during initial ageing stage. Chin. J. Nonferrous Met. 2012, 6, 288–293. [Google Scholar] [CrossRef]
- Starink, M.J.; Wang, S.C. A model for the yield strength of Al-Zn-Mg-Cu alloys. Acta Mater. 2003, 51, 5131–5150. [Google Scholar] [CrossRef]
- Dixit, M.; Mishra, R.S.; Sankaran, K.K. Structure–property correlations in Al 7050 and Al 7055 high-strength aluminum alloys. Mater. Sci. Eng. A 2007, 478, 163–172. [Google Scholar] [CrossRef]
- Sakai, T.; Belyakov, A.; Miura, H. Ultrafine Grain Formation in Ferritic Stainless Steel during Severe Plastic Deformation. Metall. Mater. Trans. A 2008, 39, 2206. [Google Scholar] [CrossRef]
- Li, Y.S.; Tao, N.R.; Lu, K. Microstructural evolution and nanostructure formation in copper during dynamic plastic deformation at cryogenic temperatures. Acta Mater. 2008, 56, 230–241. [Google Scholar] [CrossRef]
- Viatkina, E.M.; Brekelmans, W.A.M.; Geers, M.G.D. Modelling of the internal stress in dislocation cell structures. Eur. J. Mech.-A/Solids 2007, 26, 982–998. [Google Scholar] [CrossRef]
- Marthinsen, K.; Nes, E. A general model for metal plasticity. Mater. Sci. Eng. A 1997, 234, 1095–1098. [Google Scholar] [CrossRef]
- Nes, E.; Pettersen, T.; Marthinsen, K. On the mechanisms of work hardening and flow-stress saturation. Scr. Mater. 2000, 43, 55–62. [Google Scholar] [CrossRef]
- Vratnica, M.; Cvijović, Z.; Degischer, H.P.; Requena, G.C. The effect of coarse intermetallic particles on the fracture process in forged 7000 alloys. J. Microsc. 2010, 224, 117–120. [Google Scholar] [CrossRef]
- Tiryakioglu, M.J., Jr.; Campbell, J. The effect of structural integrity on the tensile deformation characteristics of A206-T71 alloy castings. Mater. Sci. Eng. A 2008, 487, 383–387. [Google Scholar] [CrossRef]
Publisher’s Note: MDPI stays neutral with regard to jurisdictional claims in published maps and institutional affiliations. |
© 2022 by the authors. Licensee MDPI, Basel, Switzerland. This article is an open access article distributed under the terms and conditions of the Creative Commons Attribution (CC BY) license (https://creativecommons.org/licenses/by/4.0/).