Article

Effect of Segregation of Sc, Y and La Atoms on Prenucleation at the Liquid-Al/γ-Al2O3{1 1 1} Interfaces

Brunel Centre for Advanced Solidification Technology (BCAST), Brunel University London, Uxbridge UB8 3PH, UK
*
Author to whom correspondence should be addressed.
Metals 2022, 12(10), 1550; https://doi.org/10.3390/met12101550
Submission received: 16 August 2022 / Revised: 15 September 2022 / Accepted: 16 September 2022 / Published: 20 September 2022

Abstract

:
γ-Al2O3 particles form inevitably in liquid Al- alloys during liquid-handling and casting processes. Such oxide particles may act as potential nucleation sites during solidification. Recent research revealed that native γ-Al2O3 particles exhibit different potency for nucleating solid Al, which may reduce the number of potential nucleation sites in the liquid. Chemical segregation at the liquid/oxide interface may modify the substrates’ nucleation potency. In this paper, we investigated prenucleation at the Al(l)/γ-Al2O3 interface with segregation of Sc, Y and La (Group 3) atoms using an ab initio molecular dynamics simulation technique. Our results revealed that the segregation of Sc, Y and La results in a reconstruction of the Al atoms adjacent to the substrates and consequently a rough substrate surface. Present investigation opens a new path for manipulating solidification processes via chemical segregation at the liquid/substrate interface.

1. Introduction

During melting and casting of Al-alloys, γ-Al2O3 particles are formed in the alloy met [1,2]. Electron microscopy (EM) studies revealed that the newly formed γ-Al2O3 particles mostly have a platelet morphology with dominant {1 1 1}-facets (denoted as γ-Al2O3{1 1 1}) [2]. Such native oxide particles not only have nontrivial influences on the performance of the cast parts, but also may act as potential nucleation sites during solidification [2,3,4,5].
γ-Al2O3 has a defective spinel-type structure [6,7]. Along its [1 1 1] orientation, it has two different kinds of independent surfaces. Recent ab initio molecular dynamics (AIMD) simulations [8] revealed that there is an ordered Al layer terminating the γ-Al2O3{1 1 1} surfaces in liquid Al. The liquid Al adjacent to the interfaces between liquid Al and γ-Al2O3{1 1 1} (denoted as Al(l)/γ-Al2O3{1 1 1}) exhibits different degrees of atomic ordering, depending on the exact atomic arrangement on the terminating γ-Al2O3{1 1 1} surface [5,8]. At Al(l)/γ-Al2O3{1 1 1})Al_1, the terminating Al layer is composed of three sub-layers, being atomically rough, whereas at Al(l)/γ-Al2O3{1 1 1})Al_2, the terminating Al atoms form one flat layer [8].
Prenucleation refers to atomic ordering in the liquid adjacent to a liquid/substrate interface at temperatures above its nucleation temperature [9,10,11]. Prenucleation provides a precursor for subsequent heterogeneous nucleation of the solid phase in the liquid and thus, plays an important role in solidification processes [12,13,14]. The AIMD results revealed a variety of atomic roughness at the two pristine Al(l)/γ-Al2O3{1 1 1}Al interfaces, which infers different nucleation potency of the two γ-Al2O3{1 1 1} substrates [8]. Moreover, the AIMD simulations produced similar energies of the two interface systems, suggesting the coexistence of Al(l)/γ-Al2O3{1 1 1}Al_1 and Al(l)/γ-Al2O3{1 1 1}Al_2 interfaces in Al melts [5,8]. For reaching maximum efficiency of grain-refinement, it is desirable to make all γ-Al2O3{1 1 1} substrates have similar nucleation potency [12,13,14], and chemical segregation at the at the Al(l)/γ-Al2O3{1 1 1} interface may provide a potential approach to achieve this.
Utilization of chemical segregation for modifying the substrates’ nucleation potency has been applied for grain refinement in the literature [15,16,17,18]. The most successful example is the addition of the Al-Ti-B master alloys which contain TiB2 particles, into Al-alloys during casting [16,17,18]. Recent experimental studies discovered a monoatomic layer, most-likely a two-dimensional compound (2DC) Al3Ti formed on the TiB2{0 0 0 1} substrates [18]. During solidification of Al-alloys inoculated by the Al-Ti-B grain refiners, the TiB2 particles with the 2DC Al3Ti are responsible for the resultant fine and uniform microstructures. An opposite example is addition of Zr in Al alloys to poison the Al-Ti-B grain refiners [17,19]. High resolution transmission electron microscopy (HR-TEM) studies revealed that the added Zr atoms segregated at the TiB2{0 0 0 1} surfaces, forming a 2DC Ti2Zr [19]. Ab initio molecular dynamics simulations found that the TiB2 substrates become rough due to the large Zr atomic size and chemical interaction at the interfaces [19]. Such Zr-induced roughness deteriorates the nucleation potency of the TiB2 substrates.
Sc, Y and La have the electronic configurations, (n + 1)s2 nd1 (here the main quantum number n = 3, 4, 5 for Sc, Y and La, respectively) and belong to Group 3 elements. The number of the valence electrons is the same as that of Al that has an electronic configuration of [Ne]3s2 3p1. The Group 3 atoms have larger atomic sizes than that of Al (1.64 Å for Sc, 1.80 Å for Y and 1.88 Å for La [20], vs. 1.43 Å for α-Al). This indicates that segregation of the Group 3 atoms has the potential to modify the atomic structure on the substrate surfaces. Chemically, the Group 3 elements are more active than Al, as the electronegativity values are 1.36 for Sc, 1.32 for Y and 1.10 for La (in Pauling scale), respectively, being smaller than that for Al (1.61). Therefore, they are likely to replace the terminating Al atoms at the Al(l)/γ-Al2O3{1 1 1} interfaces via the reduction-oxidization (redox) reactions. This assumption has been confirmed by the recent experiments. Wang, et al. [21] added La and Y separately into Al melts and confirmed their segregation at the γ-Al2O3{1 1 1} surfaces in the cast samples. Moreover, using HR-TEM Wang et al. observed a hexagonal 2DC Al2M (M = Y or La) terminating the γ-Al2O3{1 1 1} substrates in the cast samples.
In this work we investigated systematically the atomic ordering and chemical interactions at the M (M = Sc, Y and La) segregated Al(l)/γ-Al2O3{1 1 1} (denoted as Al(l)/γ-Al2O3{1 1 1}AlM) interfaces using an ab initio molecular dynamics simulation technique. The simulations revealed that segregation of the Group 3 atoms causes reconstruction of the terminating layer of the substrates and roughens the terminating substrate surfaces. Consequently, the Group 3 atoms segregations modified the nucleation potency of the substrates. The obtained information here not only provides insight into the effects of chemical segregation on the oxides’ nucleation potency [21,22], helps improve our understanding about grain refinement and solidification in general [12,13,14,15,23,24], but also support manipulation of solidification process for microstructural control.

2. Methods

In the current study, we adopted a reverse engineering approach based on the recent experimental observations on the cast samples [21] and the previous AIMD simulations on the authentic Al(l)/γ-Al2O3{1 1 1} interfaces [8]. We use the structural model of γ-Al2O3 described in the literature [6,7] as the starting point. The built Al(l)/γ-Al2O3{1 1 1} systems have a hexagonal supercell with a = √2 a0, where a0 is the lattice parameter of the cubic γ-Al2O3 at the simulation temperature (900 K) [6,7,25]. Thus, a hexagonal supercell with a = 11.37 Å, c = 37.18 Å was built and used for the simulations. This supercell contains 96 O (six atomic layers) and 214 metal (Al and Group 3) atoms in the Al(l)/γ-Al2O3{1 1 1} systems [8]. We replace one third of the terminating Al by the Group 3 atoms at the Al(l)/γ-Al2O3{1 1 1}Al interfaces according to the recent experimental observations [21]. We tested the systems with different lengths of the c-axis, considering the difference in atomic volumes between Al and the Group 3 atoms. Our simulation tests have confirmed that the difference in lengths of c-axis have no significant effect on the simulation outcomes.
We utilize the first-principles code VASP (Vienna ab initio simulation package) [26] for the simulations. This code permits variable fractional occupation numbers. It works well for insulating-oxide/metal systems [26]. VASP employs the finite-temperature density functional theory of one-electron states, the exact energy minimization and calculation of the exact Hellmann–Feynman forces after each MD step using the preconditioned conjugate techniques, and the Nosé dynamics for generating a canonical NVT ensemble. The Gaussian smearing (smearing width being 0.1 eV) was employed. This code uses the projector augmented-wave (PAW) method [27] within the generalized gradient approximation (PBE-GGA) [28]. The semi-core 4s2 4p6, and 5s2 5p6 electrons are treated as valence electrons for Y and La, respectively.
For electronic structure calculations, we used cut-off energies of 520.0 eV for the wave functions and 700.0 eV for the augmentation functions. These values are higher than the corresponding default ones (ENMAX/EAUG = 240.4 eV/291.1 eV for Al, 400.0 eV/605.4 eV for O, 154.8 eV/301.8 eV for Sc, 202.6 eV/470.9 eV for Y and 219.3 eV/583.6 eV for La). Reasonably dense k-meshes were used for sampling the electronic wave functions, e.g., a 2 × 2 × 2 (8 k-points) in the Brillouin zone (BZ) of the supercell of the interface systems in the Monkhost–Pack scheme [29]. For the AIMD simulations of the authentic and the Group 3 atoms segregated Al(l)/γ-Al2O3{1 1 1} systems, we employed a cut-off energy of 320.0 eV, and the Γ-point in the BZ. The latter was used due to the lack of periodicity of the whole system in an interface or a surface system [8,11,30,31]. Test simulations using cut-off energies ranging from 200.0 eV to 400.0 eV demonstrated that the settings are reasonable.
The simulation systems were equilibrated at 900 K with full relaxation of the atoms for 4000 to 10,000 steps (1.5 fs per step). The time averaged method was used to sample the systems over 3.0–4.5 ps to ensure statistically meaningful results [8,30].

3. Results

We first report the calculated results for the elemental solids. First-principle structural optimizations using the above settings produced lattice parameters, a = 4.039 Å for α-Al (experimental value a = 4.0493 Å at room temperature (298 K) [32], same for the followings); a = 3.322 Å and c = 5.159 Å for Sc (a = 3.3089 Å and c = 5.26806 Å [32]); a = 3.655 Å and c = 5.664 Å for Y (a = 3.6483 Å and c = 5.7317 Å [32]), and a = 3.781 Å and c = 12.067 Å for La (a = 3.7742 Å and c = 12.17 Å [32]). Clearly, the present calculations reproduced the experimental values well (with deviation within 1%), except for a slightly larger deviation (~2.1%) of the c-axis of Sc. Such calculations help us to test the reliability of the code and settings. Furthermore, the calculated energies are useful for analysis of related compounds.
During the AIMD simulations, we observed that the Group 3 atoms remain close to the γ-Al2O3{1 1 1} substrates and have no tendency to move away into the bulk liquid. This indicates the stability of the segregated interfaces. We also tested different configurations, e.g., putting some Group 3 atoms about 5 Å away from the outmost O layer of the substrate in the input. Then, we found those Group 3 atoms moving towards the O atoms of the substrate during the simulations. Meanwhile, we found that during simulations some Group 3 atoms move from one site to another at the substrate surfaces within the first 0.5 ps, then they move around the sites during the simulation periods up to 15 ps. Analysis of the total valence electron energies shows that the systems reach thermal equilibrium within 1.0 ps. Figure 1 shows the snapshots of the equilibrated Al(l)/γ-Al2O3{1 1 1}AlM systems.
Figure 1 shows well-ordered atoms in the substrates and disordered Al atoms in the liquid away from the substrates. The liquid metal atoms adjacent to the substrates display variations of atomic densities along the direction perpendicular to the substrates, which is referred to as layering [9,10,33]. This occurs also at the authentic Al(l)/γ-Al2O3{1 1 1} interfaces [8]. Meanwhile, the Group 3 atoms segregation induces subtle differences between the authentic and the segregated interfaces. The segregated Group 3 atoms are positioned farther away from the outmost O atoms compared with the Al atoms. A closer look revealed that at the Al(l)/γ-Al2O3{1 1 1}AlM_1 interfaces, the Group 3 atoms are dominantly positioned on top of O atoms (Figure 1a–c), whereas at Al(l)/γ-Al2O3{1 1 1}AlM_2, they are mostly positioned between two O atoms (Figure 1d–f). The interfacial chemistry will be addressed later.
In order to have a quantitative assessment of atomic layering at the interfaces, we utilize the atomic density profile, ρ(z) which is defined as [9,10,33]:
ρ(z) = ‹Nz(t)›/(LxLyΔz);
here, Lx and Ly are the in-plane x and y axis of the unit cell, respectively. Additionally, z is the axis perpendicular to the oxide substrate. Δz is the bin width, and Nz(t) is the number of atoms between z − (Δz/2) and z + (Δz/2) at time t. ‹Nz(t)› means the number of atoms during the simulations. We analyzed the layering at the Group 3 atoms segregated Al(l)/γ-Al2O3{1 1 1}AlM interfaces for the equilibrated configurations over 3 ps. The results are plotted in Figure 2. The atomic density profiles of the authentic Al(l)/γ-Al2O3{1 1 1} interfaces are included for comparison.
Figure 2 shows that the frames of the Group 3 atoms segregated interfaces are similar to those of the corresponding Al(l)/γ-Al2O3{1 1 1} interfaces. The substrates’ atoms are well ordered. There is a metal layer terminating the substrates. At both Al(l)/γ-Al2O3{1 1 1}AlM_1 and Al(l)/γ-Al2O3{1 1 1}AlM_2 interfaces, the segregated Group 3 atoms are positioned near the outmost O layer, which is consistent with the observations in Figure 1. However, there are subtle differences at the interfaces as shown in Figure 2. The formed Group 3 atoms’ peaks at the Al(l)/γ-Al2O3{1 1 1}AlM_1 interfaces exhibit larger widths as compared with those at the Al(l)/γ-Al2O3{1 1 1}AlM_2 interfaces. Next, we address such differences in detail.
At the Al(l)/γ-Al2O3{1 1 1}AlM_1 interfaces, the Sc atoms are positioned at the top of the terminating Al layer, forming a new peak (Figure 2b). The Y atoms form a peak and a shoulder at the bottom of the 1st Al layer (Figure 2c), whereas the La atom form a broad peak at the lower part of the 1st Al layer (Figure 2d). The distance between the Group 3 atoms and the 1st Al subpeak increases with increasing of the main quantum number n.
At Al(l)/γ-Al2O3{1 1 1}AlM_2 interface, the segregated Group 3 atoms form a single peak at the top of the terminating Al layer (Figure 2f–h). Consequently, the single terminating layer at the authentic interface (Figure 2e) splits into two. The spacing between the original terminating Al peak and the Group 3 atoms’ peak increases with increasing n.
In brief, the simulations infer high stability of the segregated Sc, Y and La atoms at the Al(l)/γ-Al2O3{1 1 1} interfaces. The segregated Group 3 atoms are positioned in-between the terminating and 1st Al layers. The peak widths of the terminating layers increase with the main quantum number n of the segregated Group 3 atoms. The substrate surfaces, especially at the Al(l)/γ-Al2O3{1 1 1}AlM_2 interfaces, become rougher. Consequently, prenucleation potency at the segregated interfaces becomes weaker, and this deteriorating is more severe at the Al(l)/γ-Al2O3{1 1 1}AlM_2 interfaces.
We here continue to analyze the interfacial chemical bonding. Figure 3 shows the schematic bonding between the terminating metal atoms and the outmost O atoms in the substrates at the interfaces. We also have made statistics of the time averaged interfacial bonds for over 3 ps. The results are plotted in Figure 4.
There is rich variety in the interfacial chemistry. At the Al(l)/γ-Al2O3{1 1 1}AlM_1 interfaces, the Group 3 atoms are dominantly positioned at the top of O (52.5% for Sc, 58.3% for Y and 41.3% for La) and some on the O triangles (29.3% for Sc, 21.9% for Y and 29.9% for La) (Figure 3a–c and Figure 4c). This is different from that at the authentic Al(l)/γ-Al2O3{1 1 1}Al_1 interface, where only about 16% are positioned at the top of O and nearly 70% on the O triangles [8]. There are about 10% to 20% Group 3 atoms are positioned at the O bridges (Figure 4d).
At the Al(l)/γ-Al2O3{1 1 1}AlM_2 interface most of the Sc and Y atoms are positioned at the O triangles (>80%) (Figure 3d–f and Figure 4d), similar to the terminating Al at the authentic interface [8]. This is consistent with the observations in Figure 1. Meanwhile, for M = La, the rate of La at the O triangles is notably lower (50.0%) than those at the Sc and Y segregated interfaces. However, the rate of the atoms at the O bridges are high (~40%). This change of La atom positioning from O triangles to O bridges may be due to its large atomic size.
Atomic arrangement in the terminating metal layer adjacent to the liquid/substrate interface determines the potency of the substrate to nucleate a solid phase in the liquid [34]. We analyzed the atomic arrangement of the terminating metal layer using time averaged atomic positions, and the results are shown in Figure 5.
The Group 3 atoms show a stronger localized nature than the nearby Al atoms. Figure 5 shows that the degree of localization increases with increasing main quantum number, n of the Group 3 atoms. For M = Sc (Figure 5i), localization is limited to the terminating layer and the 1st Al layer exhibits delocalized characteristics. Y and La atoms show strong localization, which in turn result in highly localized Al atoms in the 1st and 2nd layers.
Figure 5 shows that a certain degree of disordering of the Al atoms in the 1st layer at the Sc segregated interfaces. The Al atoms in the 2nd layers at the interfaces are more liquid-like. Meanwhile, at the Y and La segregated interfaces, the Al atoms at the 1st layer exhibit complex behaviors: on one hand they are localized, on the other hand these layers contain large number of vacancies, rendering the 1st layer of Al being atomically rough. The rough 1st layer causes disordering and delocalization of the Al atoms in the 2nd layers. The Al atoms in the 3rd layer and beyond become completely delocalized (not shown here).
We analyzed statistically the numbers of atoms at the layers nearby the interfaces. We use the term occupation ratio which is defined as the ratio between number of atoms at the chosen layer and the number of the outmost O layer, Rn = n(M)/n(O). The results are shown in Table 1 which also includes the distances between the selected Al/M (sub)peaks and the outmost O layers.
Here is a summary of the common features of the Al(l)/γ-Al2O3{1 1 1}AlM interfaces: (i) The occupation rates of Al at the termination layer for the Group 3 atoms segregated systems are smaller than that of the corresponding authentic interface; (ii) The sum of the occupation rates (the terminating Al, Group 3 atoms and 1st Al layers) at the Sc segregated interfaces is higher than those at the corresponding authentic interfaces and then decreases with the main quantum number n; (iii) The distances between the outmost O layers and the nearest terminating Al (sub)layer at the Group 3 atoms segregated interfaces are almost constant, whereas the distances between the Group 3 atoms’ peaks and the outmost O layers increase with the main quantum number n. Table 1 also shows differences of the features at the two interfaces.
More specifically, the occupation rate of the termination Al atoms at the Al(l)/γ-Al2O3{1 1 1}AlM_1 interfaces decreases with the main quantum number, meanwhile they are almost constant at the Al(l)/γ-Al2O3{1 1 1}AlM_2 interfaces. The distances between the outmost O layers and the nearest Al terminating sublayer at the Al(l)/γ-Al2O3{1 1 1}AlM_1 interfaces are slightly shorter than that at the authentic interface, whereas the distances between the terminating Al atoms and the outmost O layers at the Al(l)/γ-Al2O3{1 1 1}AlM_2 interfaces are longer than that of the authentic interface.
Table 1 also shows that the number of the recognizable layers at the authentic Al(l)/γ-Al2O3{1 1 1}Al_1 interface (three layers) is smaller than that at Al(l)/γ-Al2O3{1 1 1}Al_2 (three to four layers). However, the numbers of the recognizable layers at the Group 3 atoms segregated interfaces are all between one to three, smaller than that at the authentic interfaces. The segregation of Sc at the Al(l)/γ-Al2O3{1 1 1} roughens the termination layer (Figure 1, Figure 2 and Figure 5). Consequently, the 1st Al layer becomes more liquid-like. The segregations of the larger Y and La atoms cause atomic roughness at the 1st Al layers. Thus, the Al atoms at the 2nd layers show disordering.
To have a better understanding of the interfacial interactions, we performed electronic structure calculations for the Al(l)/γ-Al2O3{1 1 1}AlM interfaces. The obtained electron density distributions at the interfaces are shown in Figure 6.
The O atoms in the substrates have high electronic densities with spherical shapes, which corresponds to their ionic nature due to the high electronegativity value. All the Al atoms in the substrates, in the liquid and at the interfaces exhibit low electron densities (Figure 6). This relates to its low electron affinity and metallic nature. There is a low electron density around the Sc atoms, indicating their metallic/ionic nature. The high electron densities around the Y and La atoms originate from the semi-core electrons. There are clear overlaps between the electron density clouds around the Y/La and the O. This related to the chemical bonding.
Charge transfer between atoms are helpful to understanding about the interfacial interactions. Bader established a unique definition of borders between atoms in different states via electron zero-flux interfaces between atoms [35,36]. We employed the Bader approach and analyzed the charges at the atomic sites at the Al(l)/γ-Al2O3{1 1 1}AlM interfaces. The obtained results are shown in Figure 7.
All the O atoms/ions have the same valence, about −1.3e/O, and Al in the substrates have a valence of +2.0e/Al, being the same as that in the authentic interfaces (Figure 7). This corresponds to the ionic nature of the aluminum oxide. The results indicate covalence between Al and O. Meanwhile, the Al atoms away from the substrates are electronically neutral. The charges of the interfacial Al atoms are positive and the amount of charges decreases with the spacing from the substrates. The Group 3 atoms are also positively charged and their charge values are higher than those at the Al sites with the same spacing to the substrates. This indicates that the Group 3 atoms interact more strongly with the O than the Al atoms/ions do.

4. Discussion

The segregation of the Group 3 metal atoms at the Al(l)/γ-Al2O3{1 1 1} interfaces leads to the formation of M-O bonds. Thus, the segregation belongs to reduction-oxidation (redox) reactions intrinsically. The metals M (=Sc, Y and La) have three valence-electrons. Correspondingly, their oxides have chemical formula, M2O3 (M = Sc, Y and La), being similar to alumina (Al2O3). The formation of the oxides with respect to the elemental solid and O2 molecules is thus, described in the following reactions:
2 M* (solid) + (3/2) O2 = M*2O3 (solid)
The related formation energy, Eform is defined accordingly as:
Eform(M*2O3) = E(M*2O3) − [2 E(M*) + 3/2 E(O2)]
Here, M* = Sc, Y and La, and Al. Eform(M*2O3), E(M*) and E(O2) refer to the calculated total valence electron energies for the oxide, M*2O3, solid M and an O2 molecule, respectively. The obtained formation energy, ΔE has the unit of eV/f.u. (f.u. represents formula unit). Negative values of ΔE in Equation (3) mean the reaction (2) is exothermal. Eform = −ΔH at the ambient conditions when the zero-point energy is ignored.
We can assume a full replacement of the Al atoms in alumina by the group 3 elements (M*) to form M*2O3. The redox reaction can be represented by the following reactions:
Al2O3 + 3 M* = M*2O3 + 3 Al
The related energy differences are:
ΔE = [E(M*2O3) + 3 E(Al)] − [E(Al2O3) + 3 E(M*)]
= [E(M*2O3) − 3 E(M*) − 3/2 E(O2)] − [E(Al2O3) − 3 E(Al) − 3/2 E(O2)]
= Eform(M*2O3) − Eform(Al2O3)
The energy differences, ΔE in Equation (5) can be used to assess the relative strength of the chemical bonding in the Group 3 atoms oxides with respect to that of alumina.
First-principles’ structural optimizations and total-energy calculations were performed for the ground-state α-Al2O3 with a rhombohedral lattice [25,37] and the cubic c-M2O3 (M = Sc, Y and La) structures [37,38,39]. The obtained results for the oxides are listed Table 2. The experimental values in the literature [25,37,38,39] are included in Table 2 for comparison.
The calculated lattice parameters for the elemental solids were presented at the beginning of this section. Our calculations for an isolated O2 molecular produced the triplet solution with O-O bond length being 1.233 Å, which is slightly larger than the experimental value (1.208 Å) [40]. For the M2O3 oxides, the calculations produced lattice parameters slightly larger than the corresponding experimental values with deviations within 1%. It is not unusual that the DFT-GGA approximations overestimate lattice parameters of crystals [28,41].
The calculations showed that the formation energies of the Group 3 metal oxides are notably lower than that of alumina with energy differences with ΔE being lower than −2 eV/f.u. as shown in Table 2. This indicates the redox reactions in Equation (4) are exothermal and strongly favored at the ambient conditions.
At the Al(l)/γ-Al2O3{1 1 1}AlM interfaces, each segregated Group 3 atom has one to three O neighbors. This indicates an energy gain of 0.3 eV to 1.0 eV in the redox reactions.
Recent thermodynamics study indicated the higher stability of the M2O3 (M = Sc, Y and La) than that of alumina at elevated temperatures based on the Ellingham diagrams [42,43]. Thus, the stability of the Group 3 atoms segregated interfaces at high temperatures are understandable. The segregations of the Group 3 elements at the Al(l)/γ-Al2O3{1 1 1} interfaces are also chemically favored at the casting temperature. Similar segregation phenomena have been observed in other systems. For example, the higher stability of ZrB2 than that of TiB2 is the chemistry [44] behind the segregation of Zr atoms at the Al(l)/TiB2{0 0 0 1} interfaces [19,21].
Table 2 also lists the averaged M-O interatomic distances in the oxides (Table 2). We can obtain the ionic radii of the M3+ ions based on the averaged M-O bond lengths in the bulk oxides and the radius of the VI-coordinated O2- ions in the literature (R(O2−) = 1.40 Å [45,46]). The obtained ionic radii increase with the main quantum number, which is in good agreement with the trend in the literature [45]. The dependences of the widths of the terminating metal layers at the Al(l)/γ-Al2O3{1 1 1}AlM interfaces (Figure 2) on the ionic sizes of M3+ ions are plotted in Figure 8.
We find the clear linear relations between the widths of the terminating metal layers at the Al(l)/γ-Al2O3{1 1 1}AlM interfaces and the ionic radii of the M3+ ions.
Recently, it was proposed to utilize the native oxide particles as the nucleation sites for casting light alloys [12,14]. This approach has several advantages over the conventional method which adds potent grain refiners into liquid alloys during solidification: lower manufacture costs, environment-friendly, decreases impurities in the cast parts and reduces harmful particles for further recycling, etc. One successful example is using the native oxide MgO particles as nucleation sites dispersed by the melt shearing technique prior to the casting process. Products of fine and uniform microstructure were obtained in this way [12].
To obtain fine and uniform microstructures of cast products with desirable properties, more uniformly distributed nucleation sites of similar potency are required [12,13,14]. The present study revealed high stability of the Group 3 atoms segregated Al(l)/γ-Al2O3{1 1 1}AlM interfaces. This segregation makes the authentic smooth γ-Al2O3{1 1 1}Al2 substrate rougher and thus less potent. This has the potential to enhance explosive grain initiation during the solidification.
The present study is helpful not only to understand chemical segregation at various oxide substrates [21,47], but also opens a new path to manipulating the solidification process to achieve cast parts/alloys of fine and uniform microstructure and desirable properties. More broadly, the obtained information here may be relevant to segregation of impurities at the grain boundaries in ceramics [48], at the interfaces in ceramic-metal coating and welding materials [49] and in the wetting of oxide surfaces by liquid metals [50,51], etc.

5. Conclusions

We performed ab initio molecular dynamics simulations for the Group 3 elements segregated Al(l)/γ-Al2O3{1 1 1} systems. This study provides the following conclusions:
(1)
The Group 3 element segregated Al(l)/γ-Al2O3{1 1 1} systems exhibit high stability, corresponding to the higher formation energies of the Group 3 metal oxides than that of alumina.
(2)
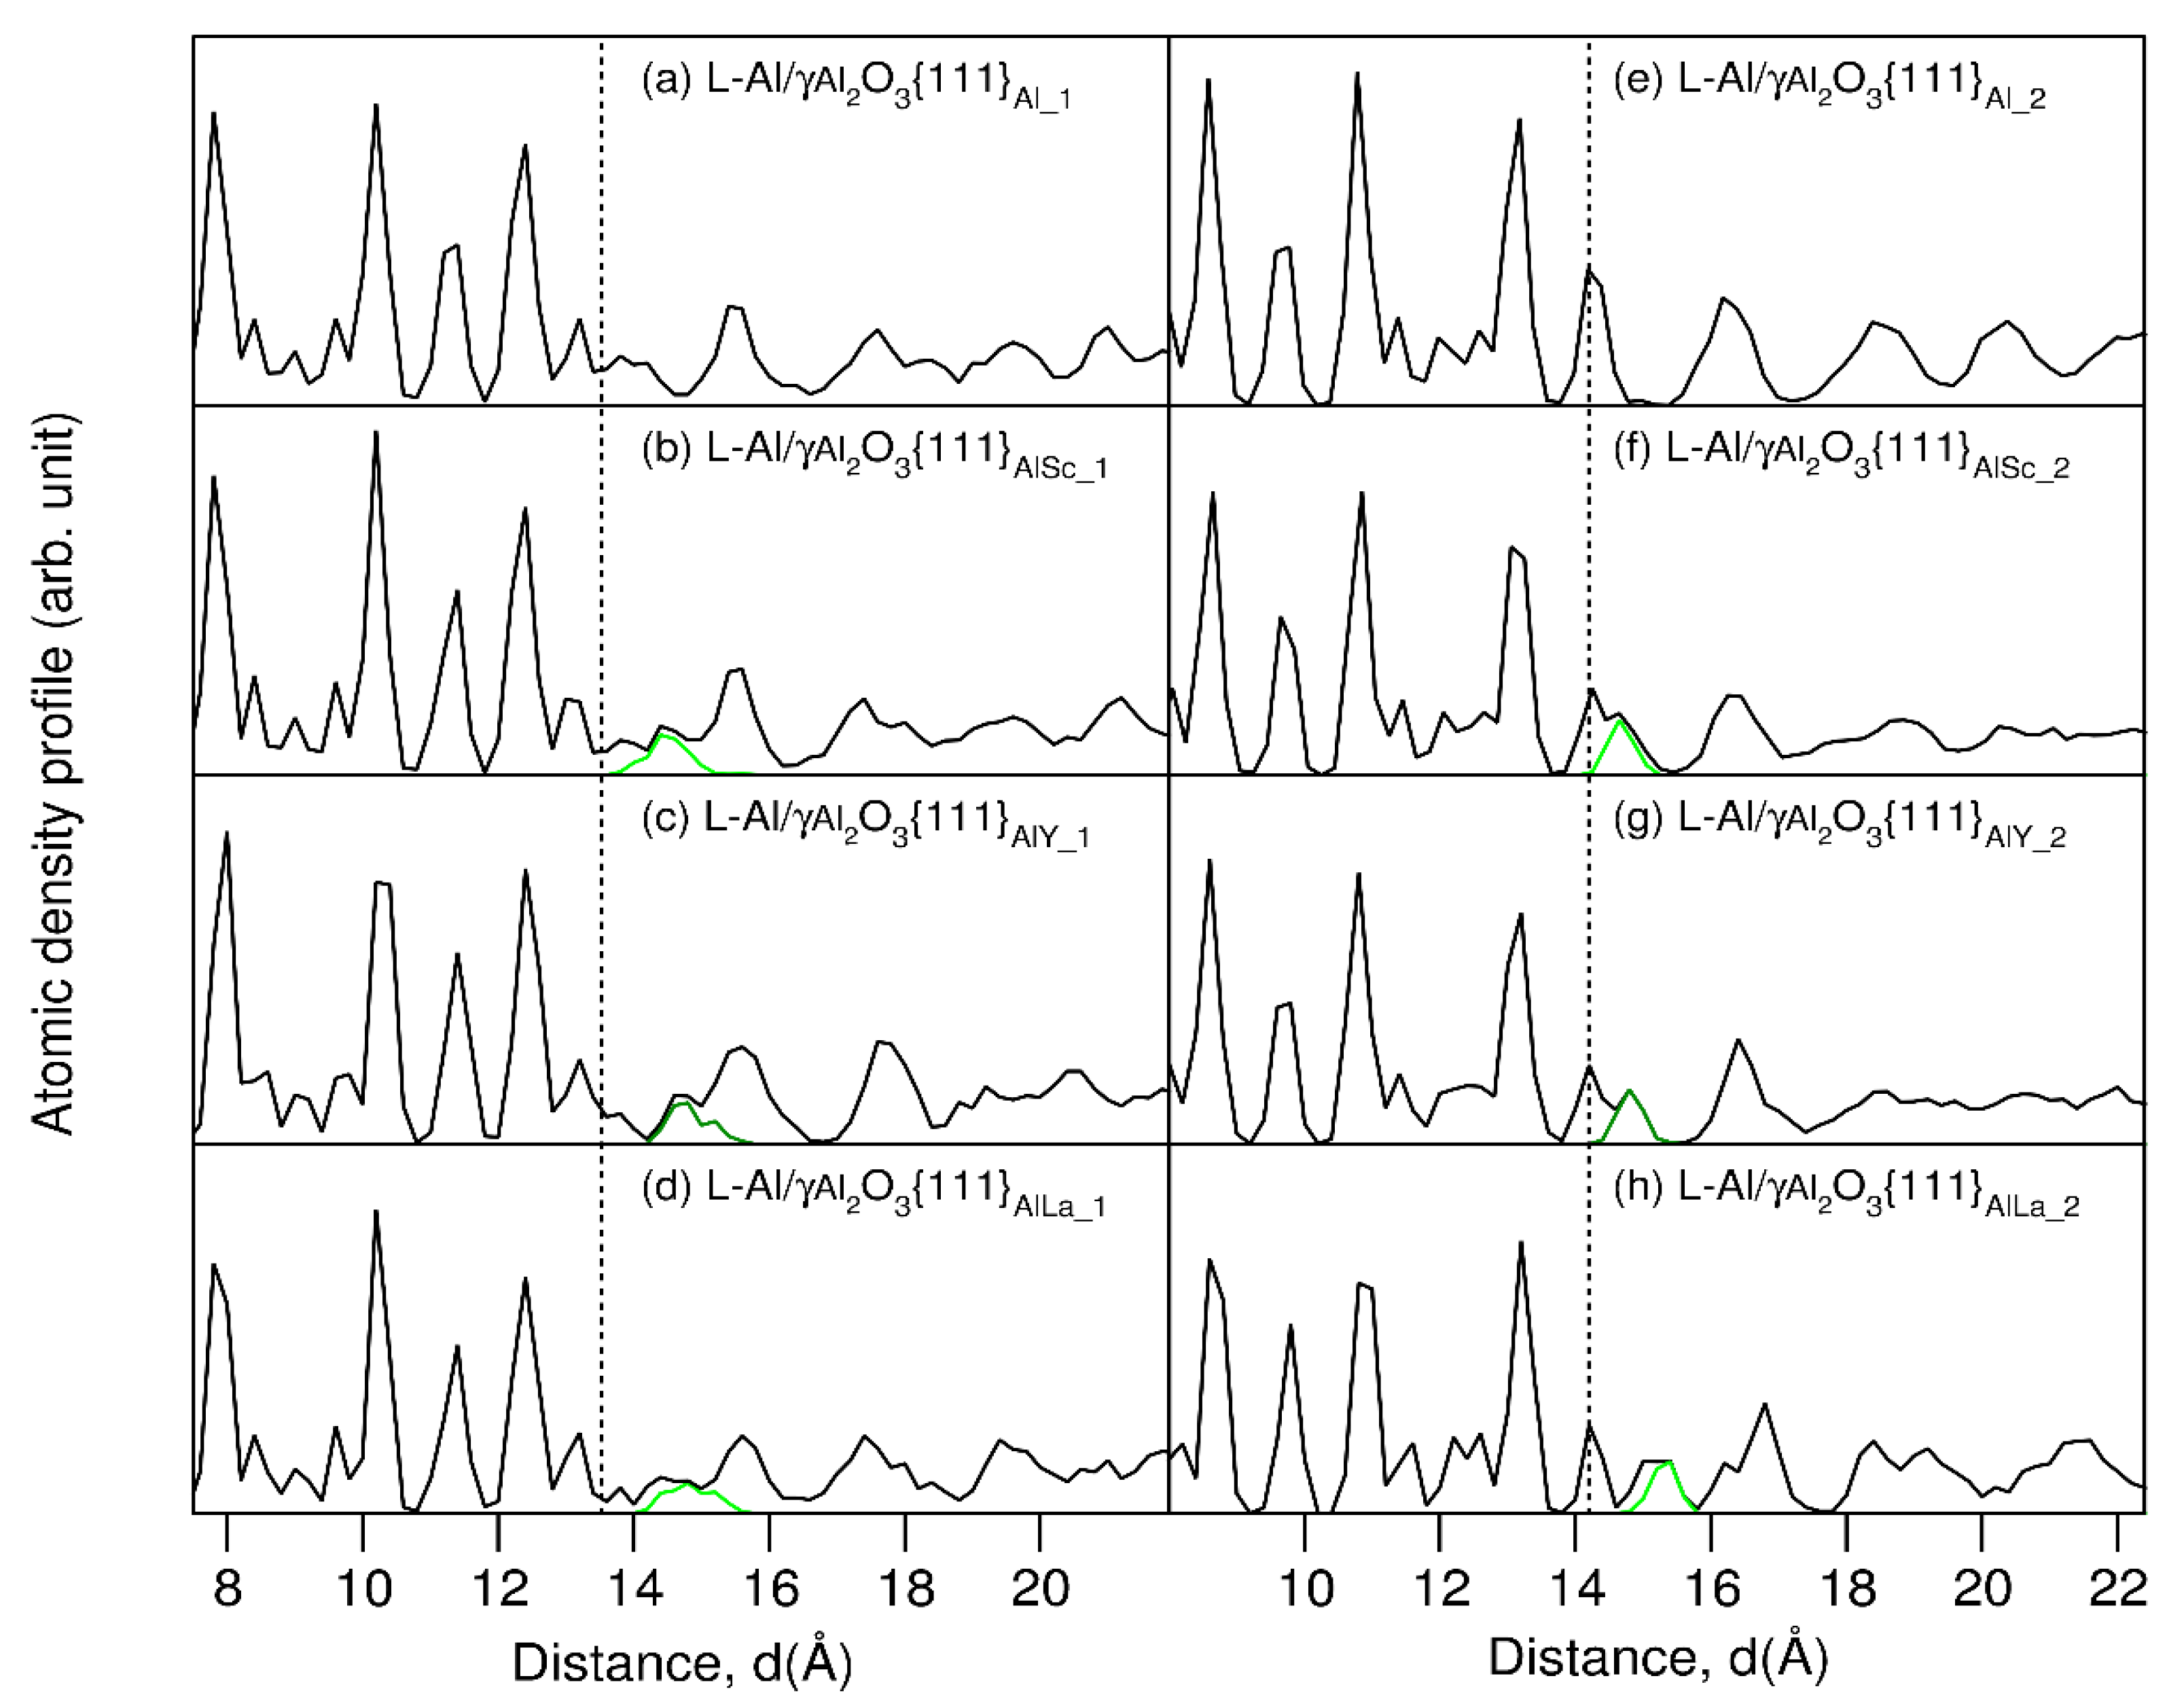
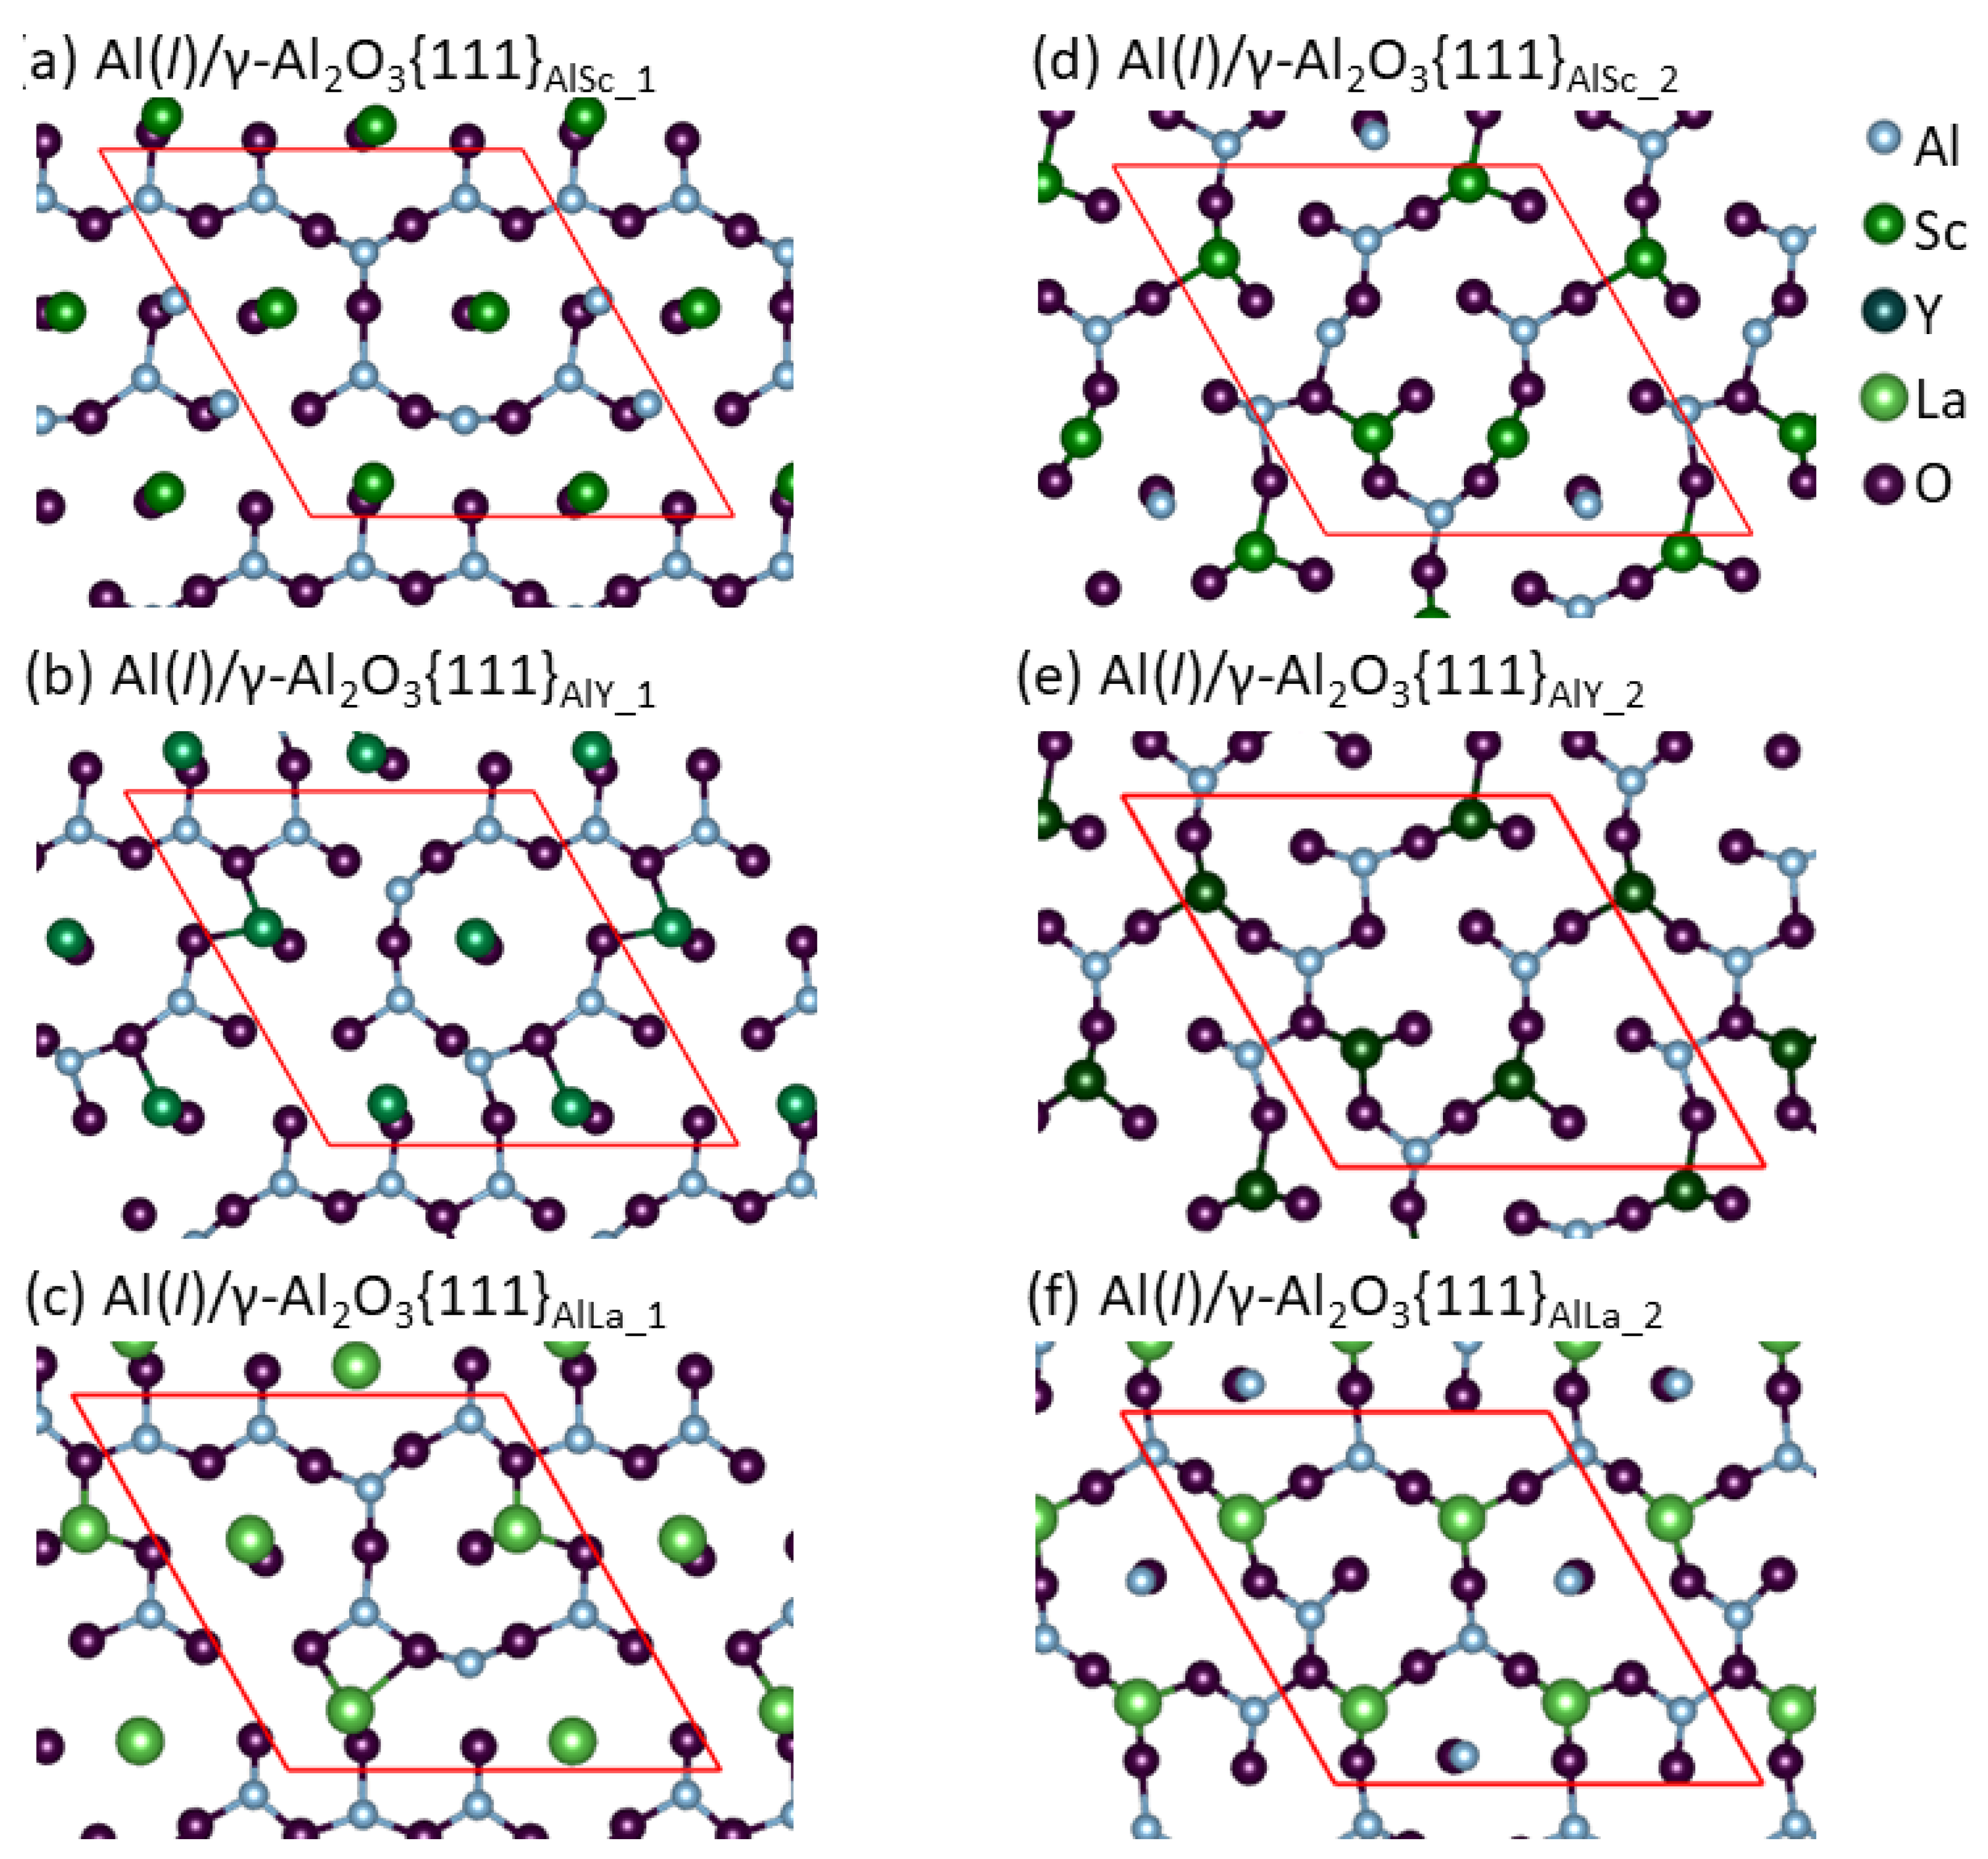
Segregation of the Group 3 atoms causes reconstructions of the metal layers adjacent to the γ-Al2O3{1 1 1} substrates and atomic roughness of the substrate surfaces. The widths of the metal layers are proportional to the ionic radii of the segregated Group 3 ions.
(3)
The segregated Group 3 atoms/ions exhibit strong localization, which corresponds to their strong bonding to the outmost O.
(4)
The atomic ordering (prenucleation) at the Group 3 atoms segregated Al(l)/γ-Al2O3{1 1 1} interfaces is reduced to the same level. This maximizes the number of potential nucleation sites during solidification.

Author Contributions

Conceptualization, C.F. and Z.F.; methodology, C.F.; software, C.F.; validation, C.F.; formal analysis, C.F.; investigation, C.F.; resources, C.F.; data curation, C.F.; writing—original draft preparation, C.F.; writing—review and editing, C.F. and Z.F.; visualization, C.F.; supervision, Z.F.; project administration, Z.F.; funding acquisition, Z.F. All authors have read and agreed to the published version of the manuscript.

Funding

Financial support from EPSRC (UK) under grant number EP/N007638/1 is gratefully acknowledged.

Acknowledgments

We thank Yun Wang for the useful comments.

Conflicts of Interest

The authors declare no conflict of interest.

References

  1. Impey, S.A.; Stephenson, D.J.; Nicholls, J.R. Mechanism of scale growth on liquid aluminium. J. Mater. Sci. Technol. 1988, 4, 1126–1132. [Google Scholar] [CrossRef]
  2. Wang, Y.; Li, H.-T.; Fan, Z. Oxidation of aluminium alloy melt and inoculation by oxide particles. Trans. Indian Inst. Met. 2012, 65, 653–661. [Google Scholar] [CrossRef]
  3. Li, H.-T.; Wang, Y.; Fan, Z. Mechanisms of enhanced heterogeneous nucleation during solidification in binary Al-Mg alloys. Acta Mater. 2012, 60, 1528–1537. [Google Scholar] [CrossRef]
  4. Kim, K. Formation of endogenous MgO and MgAl2O4 particles and their possibility of acting as substrate for heterogeneous nucleation of aluminum grains. Surf. Interface Anal. 2015, 47, 429–438. [Google Scholar] [CrossRef]
  5. Fang, C.M.; Fan, Z. Ab Initio MD Investigation of Prenucleation at Liquid-Metal/Oxide Interfaces: An Overview. Metals 2022, in progress. [Google Scholar]
  6. Verwey, E.J.W. The crystal structure of γ-Fe2O3 and γ-Al2O3. Z. Kristallogr. 1935, 91, 65–69. [Google Scholar] [CrossRef]
  7. Smrčok, L.; Langer, L.; Krestan, J. γ-Alumina: A single crystal X-ran diffraction study. Acta Crystallogr. 2006, C62, i83–i84. [Google Scholar] [CrossRef]
  8. Fang, C.M.; Yasmin, S.; Fan, Z. Interfacial interaction and prenucleation at liquid-Al/γ-Al2O3{1 1 1} interfaces from ab initio molecular dynamics simulations. J. Phys. Commun. 2021, 5, 015007. [Google Scholar] [CrossRef]
  9. Men, H.; Fan, Z. Prenucleation induced by crystalline substrates. Metall. Mater. Trans. A 2018, 49, 2766–2777. [Google Scholar] [CrossRef]
  10. Fang, C.M.; Men, H.; Fan, Z. Effect of substrate chemistry on prenucleation. Metall. Mater. Trans. A 2018, 49, 4242–6231. [Google Scholar] [CrossRef]
  11. Men, H.; Fang, C.M.; Fan, Z. Prenucleation at the liquid/substrate interface: An overview. Metals 2022, in progress. [Google Scholar]
  12. Fan, Z.; Mendis, C. (Eds.) Heterogeneous nucleation, grain initiation and grain refinement of Mg-alloys. In Proceedings of the 11th International Conference on Magnesium Alloys and Their Applications, Beaumont Estate, Old Windsor, UK, 24–27 July 2018; p. 7. [Google Scholar]
  13. Fan, Z.; Gao, F.; Jiang, B.; Que, Z.P. Impeding nucleation for more significant grain refinement. Sci. Rep. 2020, 10, 9448. [Google Scholar] [CrossRef] [PubMed]
  14. Fan, Z.; Gao, F. Grain initiation and grain refinement: An overview. Metals 2022, in progress. [Google Scholar]
  15. Kelton, K.F.; Greer, A.L. Nucleation in Condensed Matter: Applications in Materials and Biology; Pergamon Materials Series; Elsevier Ltd.: Oxford, UK; Amsterdam, The Netherlands, 2010. [Google Scholar]
  16. Cibula, A. The grain refinement of aluminium alloy castings by addition of titanium and boron. J. Inst. Met. 1951, 80, 1–16. [Google Scholar]
  17. Greer, A.L.; Bunn, A.M.; Tronche, A.; Evans, P.V.; Bristo, D.J. Modelling of inoculation of metallic melts: Application to grain refinement of aluminium by Al-Ti-B. Acta Mater. 2000, 48, 2823–2835. [Google Scholar] [CrossRef]
  18. Fan, Z.; Wang, Y.; Zhang, Y.; Qin, T.; Zhou, X.R.; Thompson, G.E.; Pennycook, T.; Hashimoto, T. Grain refining mechanism in the Al/Al-Ti-B system. Acta Mater. 2015, 84, 292–304. [Google Scholar] [CrossRef]
  19. Wang, Y.; Fang, C.M.; Zhou, L.; Hashimoto, T.; Zhou, X.R.; Ramasse, Q.M.; Fan, Z. Zr poisoning of TiB2 grain refinement. Acta Mater. 2019, 164, 428–439. [Google Scholar] [CrossRef]
  20. Lide, D.R. (Editor-in-Chief) CRC Handbook of Chemistry and Physics, 84th ed.; CRC Press: Cleveland, OH, USA, 2003; pp. 4–112. [Google Scholar]
  21. Wang, Y.; Wang, S.H.; Fang, C.M.; Que, Z.P.; Hashimoto, T.; Zhou, X.R.; Ramasse, Q.M.; Fan, Z. Manipulating nucleation potency of substrates by interfacial segregation: An overview. Metals 2022, in progress. [Google Scholar]
  22. Wang, Y.; Que, Z.P.; Hashimoto, T.; Zhou, X.R.; Fan, Z. Mechanism for Si poisoning of Al-Ti-B grain refiners in Al alloys. Metall. Mater. Trans. A 2020, 51, 5734–5757. [Google Scholar] [CrossRef]
  23. Easton, M.A.; Qian, M.; Prasad, A.; StJohn, D.H. Recent advances in grain refinement of light metals and alloys. Curr. Opin. Solid State Mater. Sci. 2016, 20, 13–24. [Google Scholar] [CrossRef]
  24. Liu, Z. Review of grain refinement of cast metals through inoculation: Theories and developments. Metall. Mater. Trans. A 2017, 48, 4755–4776. [Google Scholar] [CrossRef]
  25. Fiquet, G.; Richet, P.; Montagnac, G. High-temperature thermal expansion of lime, periclase, corundum and spinel. Phys. Chem. Min. 1999, 27, 103–111. [Google Scholar] [CrossRef]
  26. Kresse, G.; Furthmüller, J. Efficiency of ab-initio total energy calculations for metals and semiconductors using a plane-wave basis set. Comp. Mater. Sci. 1996, 6, 15–50. [Google Scholar] [CrossRef]
  27. Blöchl, P.E. Projector augmented-wave method. Phys. Rev. B 1994, 50, 17953–17978. [Google Scholar] [CrossRef] [PubMed]
  28. Perdew, J.P.; Burke, K.; Ernzerhof, M. Generalized gradient approximation made simple. Phys. Rev. Lett. 1996, 77, 3865–3868. [Google Scholar] [CrossRef] [PubMed] [Green Version]
  29. Monkhorst, H.J.; Pack, J.D. Special points for Brillouin-zone integrations. Phys. Rev. B 1976, 13, 5188–5192. [Google Scholar] [CrossRef]
  30. Brostow, W.; Hagg Lodbland, H.E. Materials: Introduction and Applications; John Wiley & Sons: Hoboken, NJ, USA, 2017. [Google Scholar]
  31. Fang, C.M.; Mohammadi, V.; Nihtianov, S.; Sluiter, M.F.H. Stability, geometry and electronic properties of BHn (n = 0 to 3) radicals on the Si(001)3 × 1:H surface from first-principles. J. Phys. Cond. Matter 2020, 32, 235201. [Google Scholar] [CrossRef]
  32. Arblaster, J.W. Selected Values of the Crystallographic Properties of the Elements; ASM International: Materials Park, OH, USA, 2018; pp. 118–228. [Google Scholar]
  33. Hashibon, A.; Adler, J.; Finnis, M.W.; Kaplan, W.D. Atomistic study of structural correlations at a liquid-solid interface. Comp. Mater. Sci. 2002, 24, 443–452. [Google Scholar] [CrossRef]
  34. Fan, Z. An epitaxial model for heterogeneous nucleation on potent substrate. Metall. Mater. Trans. A 2013, 44, 1409–1418. [Google Scholar] [CrossRef]
  35. Bader, R.F.W. A quantum-theory of molecular-structure and its applications. Chem. Rev. 1991, 91, 893–928. [Google Scholar] [CrossRef]
  36. Bader, R.F.W. A bonded path: A universal indicator of bonded interactions. J. Phys. Chem. A 1998, 102, 7314–7323. [Google Scholar] [CrossRef]
  37. Wyckoff, R.W.G. The Structure of Crystals, 2nd ed.; Reinhold Publishing Corporation: New York, NY, USA, 1935. [Google Scholar]
  38. Knop, O.; Hartley, J.M. Refinement of the crystal structure of scandium oxide. Can. J. Chem. 1968, 46, 1446–1450. [Google Scholar] [CrossRef]
  39. Hanic, F.; Hartmanová, M.; Knab, G.G.; Urusovskaya, A.A.; Bagdasarov, K.S. Real structure of undoped Y2O3 single crystals. Acta Crystallogr. B 1984, 40, 76–82. [Google Scholar] [CrossRef]
  40. Sutton, L.E. (Ed.) Tables of Interatomic Distances and Configuration in Molecules and Ions; The Chemical Society: London, UK, 1958. [Google Scholar]
  41. Jones, R.O. Density functional theory: Its origins, rise to prominence, and future. Rev. Mod. Phys. 2015, 87, 897–922. [Google Scholar] [CrossRef]
  42. Ellingham, H.J.T. Reducibility of oxides and sulphides in metallurgical processes. J. Soc. Chem. Ind. Trans. Commun. 1944, 63, 125–160. [Google Scholar]
  43. Rafigue, M.M.A. Pyrometallurgy and electrometallurgy of rare earths—Part A: Analysis of metallothermic reduction and its variants. Preprints 2021, 2021030463. [Google Scholar] [CrossRef]
  44. Van Der Geest, A.G.; Kolmogorov, A.N. Stability of 41 metal-boron systems at 0 GPa and 30 GPa from first principles. Calphad 2014, 46, 184–204. [Google Scholar] [CrossRef]
  45. Shannon, R.D. Revised effective ionic radii and systematic studies of interatomic distances in halides and chalcogenides. Acta Cryst. A 1976, 32, 751–767. [Google Scholar] [CrossRef]
  46. Brese, N.E.; O’Keeffe, M. Bond-valence parameters for solids. Acta Crystallogr. B 1991, 47, 192–197. [Google Scholar] [CrossRef]
  47. Ma, S.D.; Dong, Z.H.; Zong, N.F.; Jing, T.; Dong, H.B. Solute-adsorption enhanced heterogeneous nucleation: The effect of Cu adsorption on α-Al at the sapphire substrate. Phys. Chem. Chem. Phys. 2021, 23, 5270–5282. [Google Scholar] [CrossRef]
  48. Bojarski, S.A.; Stuer, M.; Zhao, Z.; Bowen, P.; Rohere, G.S. Influence of Y and La additions on grain growth and the grain-boundary character distribution of alumina. J. Am. Ceram. Soc. 2014, 97, 622–630. [Google Scholar] [CrossRef]
  49. Karakozov, E.S.; Konyshov, G.V.; Musin, R.S. Fundamentals of welding metals to ceramic materials. J. Weld. Intern. 1993, 7, 991–996. [Google Scholar] [CrossRef]
  50. Oh, S.H.; Kauffmann, Y.; Scheu, C.; Kaplan, W.D.; Rühle, N. Ordered liquid aluminium at the sapphire. Science 2005, 310, 661–663. [Google Scholar] [CrossRef] [PubMed]
  51. Kaplan, W.D.; Chatain, D.; Wynblatt, P.; Cater, W.C. A review of wetting versus adsorption, complexions, and related phenomena: The rosetta stone of wetting. J. Mater. Sci. 2013, 48, 5681–5717. [Google Scholar] [CrossRef] [Green Version]
Figure 1. Snapshots of the Al(l)/γ-Al2O3{1 1 1}AlM systems equilibrated at 900 K and at simulation time 6 ps. The chemical bonds between O and the metal atoms are indicated. The segregated Group 3 atoms are positioned between the terminating and the 1st Al layers and bonded to the outmost O atoms. (a) Al(l)/γ-Al2O3{111}AlSc_1, (b) Al(l)/γ-Al2O3{111}AlY_1, (c) Al(l)/γ-Al2O3{111}AlLa_1, (d) Al(l)/γ-Al2O3{111}AlSc_2, (e) Al(l)/γ-Al2O3{111}AlY_2, (f) Al(l)/γ-Al2O3{111}AlLa_2.
Metals 12 01550 g001
Figure 2. Atomic density profiles for the Al(l)/γ-Al2O3{1 1 1}AlM systems equilibrated at 900 K. The black curves are for all atoms and the colored curves are for the Group 3 atoms. The vertical dotted lines represent the terminating metal layer. The segregation of the Group 3 atoms broadens the termination metal layers at Al(l)/γ-Al2O3{1 1 1}AlM_1 and new peaks at Al(l)/γ-Al2O3{1 1 1}AlM_2, roughening the substrates’ surfaces. (a) Al(l)/γ-Al2O3{111}Al_1, (b) Al(l)/γ-Al2O3{111}AlSc_1, (c) Al(l)/γ-Al2O3{111}AlY_1, (d) Al(l)/γ-Al2O3{111}AlLa_1, (e) Al(l)/γ-Al2O3{111}Al_2, (f) Al(l)/γ-Al2O3{111}AlSc_2, (g) Al(l)/γ-Al2O3{111}AlY_2, (h) Al(l)/γ-Al2O3{111}AlLa_2.
Metals 12 01550 g002
Figure 3. Atomic arrangements of the outmost O, the terminating Al and the Group 3 atoms at the Al(l)/γ-Al2O3{1 1 1}AlM interfaces at simulation 6 ps. The red lines represent the in-plane axis. At Al(l)/γ-Al2O3{1 1 1}AlM_1, the Group 3 atoms are dominantly on top of O, whereas at Al(l)/γ-Al2O3{1 1 1}AlM_2, they are positioned mainly on O triangles. (a) Al(l)/γ-Al2O3{111}AlSc_1, (b) Al(l)/γ-Al2O3{111}AlY_1, (c) Al(l)/γ-Al2O3{111}AlLa_1, (d) Al(l)/γ-Al2O3{111}AlSc_2, (e) Al(l)/γ-Al2O3{111}AlY_2, (f) Al(l)/γ-Al2O3{111}AlLa_2.
Metals 12 01550 g003
Figure 4. Statistics for the coordination numbers (CN) of Al and M by O at the Al(l)/γ-Al2O3{1 1 1}AlM interfaces (left, (a,b). The coordination of M by O in right: (c) CN = 1, (d) CN = 2, (e) CN = 3 and (f) CN = 4. Clearly, at Al(l)/γ-Al2O3{1 1 1}AlM_2, the M atoms prefer on top of O triangles (e), whereas at Al(l)/γ-Al2O3{1 1 1}AlM_1 M are positioned dominantly on O (a). The statistics confirms our observations in Figure 3.
Metals 12 01550 g004
Figure 5. Time averaged atomic arrangements of the metal layers at the Al(l)/γ-Al2O3{1 1 1}AlM_1 (A) and at Al(l)/γ-Al2O3{1 1 1}AlM_2 (B) interfaces for 4.5 ps. The silvery spheres represent Al; green, dark-green and light-green ones for Sc, Y or La, respectively. The segregated Group 3 atoms show strong localization. For the large Y and La atoms segregated interfaces, the 1st Al layers contains holes on top of the segregated Y and La atoms. (a) terminating metal atoms, (b) 1st Al atoms, (c) 2nd Al atoms, (i) Al(l)/γ-Al2O3{111}AlSc, (ii) Al(l)/γ-Al2O3{111}AlY, (iii) Al(l)/γ-Al2O3{111}AlLa.
Metals 12 01550 g005
Figure 6. Iso-surfaces of electron density distributions (ρ0(r) = 0.035e/Å3) at the Al(l)/γ-Al2O3{1 1 1}AlM interfaces at 6 ps. The yellow clouds represent the iso-surfaces (the electron density, ρ0(r)). The blue regions represent higher density whereas the white lower density. These Figures show clearly the ionic nature of O and metallic nature of Al, as well as the chemical bonding between the Group 3 atoms and the outmost O. (a) Al(l)/γ-Al2O3{111}AlSc_1, (b) Al(l)/γ-Al2O3{111}AlY_1, (c) Al(l)/γ-Al2O3{111}AlLa_1, (d) Al(l)/γ-Al2O3{111}AlSc_2, (e) Al(l)/γ-Al2O3{111}AlY_2, (f) Al(l)/γ-Al2O3{111}AlLa_2.
Metals 12 01550 g006
Figure 7. Charges at the atomic sites at the Al(l)/γ-Al2O3{1 1 1}AlM interfaces including the authentic ones for comparison. Black spheres represent charges at Al sites, red squares at O and green diamonds at M sites. The constant valence values of the O ions relate to its high electronegativity. The charges at the Group 3 atomic sites are higher than those of Al at the same distances to the outmost Al. (a) Al(l)/γ-Al2O3{111}Al_1, (b) Al(l)/γ-Al2O3{111}AlSc_1, (c) Al(l)/γ-Al2O3{111}AlY_1, (d) Al(l)/γ-Al2O3{111}AlLa_1, (e) Al(l)/γ-Al2O3{111}Al_2, (f) Al(l)/γ-Al2O3{111}AlSc_2, (g) Al(l)/γ-Al2O3{111}AlY_2, (h) Al(l)/γ-Al2O3{111}AlLa_2.
Metals 12 01550 g007
Figure 8. Linear dependences of splitting of the terminating AlM layers on the ionic radius of M3+ in bulk M2O3 (see Table 2). The slope for the Al(l)/γ-Al2O3{1 1 1}AlM_2 interfaces is notably higher than that for γ-Al2O3{1 1 1}AlM_1 interface.
Metals 12 01550 g008
Table 1. Characteristics of the terminating and 1st layers at the Al(l)/γ-Al2O3{1 1 1}M interfaces equilibrated at 900 K.
Interfacef (%) (2)Rn (%) (3)n (Al Layers)
Al(l)/γ-Al2O3{1 1 1}AlM−14.8Lterm(Al)L(M)L1(Al)Sum (4)
Pure Al (1)54.0-72.2126.23
(distance to O) (Å) (5)(1.01)-(3.42)-
M = Sc48.82576.4150.22
(distance to O) (Å) (5)(0.76)(2.04)(3.16)-
M = Y46.32572.3143.61~2
(distance to O) (Å) (5)(0.78)(2.28)(3.22)-
M = La40.62552.5118.12~3
(distance to O) (Å) (5)(0.79)(2.24)(3.34)-
Al(l)/γ-Al2O3{1 1 1}AlM−24.8Lterm(Al)L(M) L1(Al) Sum0
Pure Al (1)58.1-71.9130.0 3~4
(distance to O) (Å) (5)(0.83)-(3.43)-0
M = Sc42.82576.5144.32
(distance to O) (Å) (5)(1.12)(1.50)(3.27)-0
M = Y43.32572.3140.61~2
(distance to O) (Å) (5)(0.98)(1.59)(3.33)-0
M = La43.82554.3123.12~3
(distance to O) (Å) (5)(1.02)(2.08)(3.62)-0
Notes to Table 1: (1) The data at the Al(l)/γ-Al2O3{1 1 1}Al interfaces are included for the sake of comparison. (2) Lattice misfit is defined as f = (dsubdm)/dm × 100 (%), where dsub is the in-plane spacing of the substrate and dm the metal [9,10]. (3) Occupation rate Rn (=n(M)/n(O)) is the ratio of number of metal atoms to that of outmost O atoms). n (Al layers) represents the number pf recognizable Al layers in the liquid. (4) Sum means the sum of the Rn values of the terminating, Group 3 atoms and 1st Al layers. (5) The numbers in the parenthesis represent the distance between the selected Al/M (sub)peak to the outmost O layers.
Table 2. Calculated results (lattice parameters, O-M interatomic distances and formation energies according to Equation (3)) for the ground M2O3 compounds. Experimental data (in the parenthesis) available in the literature [25,37,38,39] are included for comparison. Eform is the formation energy eV/f.u. (M2O3) according to Equation (3), and ΔE to Equation (5). The ionic radii are included (see the text). The effective crystal ionic radii in the literature [45] are included in parenthesis for comparison.
PhaseLattice, Space Grouplattice Paras. (Å)M-O Bonds (Å)
Ionic Radius (Å)
Eform (eV/f.u.)
ΔE (eV/f.u.)
α-Al2O3 Rhom. R-3c(167)a = 4.807 (4.785) [25]
c = 13.116 (12.991)
Al-O: 1.86 (×3),
1.97 (×3)
Aver. 1.92
0.52, (0.675) [45]
−15.10
0.0 eV
c-Sc2O3Cub. Ia-3(206)a = 9.854 (9.8459) [38]Sc1-O: 2.09 (×2),
2.12 (×2), 2.16 (×2)
Sc2-O: 2.12 (×6)
Aver. 2.12
0.72 (0.885) [45]
−17.84
−2.74
c-Y2O3Cub. Ia-3(206) a = 10.654 (10.600) [39] Y1-O: 2.26 (×2),
2.28 (×2), 2.35 (×2)
Y2-O: 2.29 (×6)
Aver. 2.30
0.90 (1.040) [45]
−18.09
−2.99
c-La2O3Cubic. Ia-3(206)a = 11.397 (11.360) [37]La1-O: 2.42 (×2),
2.43 (×2), 2.50 (×2)
La2-O: 2.45 (×6)
Aver. 2.45
1.05 (1.172) [45]
−17.36
−2.27
Publisher’s Note: MDPI stays neutral with regard to jurisdictional claims in published maps and institutional affiliations.

