Article

Influence of Dwell Time and Pressure on SPS Process with Titanium Aluminides

Institute of Forming Technology and Machines, Leibniz University Hannover, 30823 Garbsen, Germany
*
Author to whom correspondence should be addressed.
Metals 2022, 12(1), 83; https://doi.org/10.3390/met12010083
Submission received: 29 November 2021 / Revised: 27 December 2021 / Accepted: 28 December 2021 / Published: 4 January 2022
(This article belongs to the Special Issue Spark Plasma Sintering on Metals and Alloys)

Abstract

:
Spark plasma sintering (SPS) or the field-assisted sintering technique (FAST) is commonly used to process powders that are difficult to consolidate, more efficiently than in the conventional powder metallurgy process route. During the process, holding time and applied holding pressure influence the product’s microstructure and subsequently its properties. In this study, in addition to the temperature impact, the influence of pressure and dwell time on the consolidation behaviour of titanium aluminide (TiAl) powders during the SPS process is investigated. Commercially available pre-alloyed TiAl48-2Cr-2Nb (GE48) and TiAl44-4Nb-0.7Mo-0.1B (TNM) powders were used, which have a high application potential in, for example, the aerospace industry. The results were evaluated based on microstructural analyses, hardness measurements and relative density calculations. It was shown that the investigated parameters significantly influence the sintering results, especially in the low temperature range. Depending on the temperature field in the sample, complete sintering is not achieved if the dwell time is too short in combination with too low a pressure. Above a certain temperature, the impact of holding pressure and holding time is significantly lower.

1. Introduction

Titanium aluminides (TiAl), especially intermetallic γ-based alloys, have a high application potential in the automotive industry, as well as in aerospace engineering, e.g., for the blades of low-pressure turbines. Due to their good high-temperature creep resistance, high specific strength and low density of 3.9–4.2 g/cm3, they can be used as a substitute for titanium and nickel-based alloys [1]. However, due to their brittleness, they are difficult to process; therefore, the SPS process is often used [2].
In the SPS or FAST powder sintering process, in addition to uniaxial loading, electric current (DC) is passed through the tool, which acts as a heat source due to the Joule effect. Heat generation is highly dependent on the electrical resistance of the tool and the material being processed and is locally greatest at the point of highest resistance. During the process, high heating rates of up to 1000 K/min can be realised. The tool material used is often graphite; consequently, pressures of up to 150 MPa can be realised [3]. As graphite reacts with oxygen at temperatures above 600 °C, the process is carried out in a protective atmosphere or under vacuum [4]. By adjusting the temperature, pressure, heating rate and dwell time, the degree of compaction, as well as the microstructure, and consequently the mechanical properties of the final product, can be influenced [3]. For complete compaction, the powder particles are subject to different mechanisms, such as plastic deformation and surface diffusion, caused by surface tension [5].
For some TiAl alloys, there are already various studies on the influence of temperature on the resulting microstructure. For example, Couret et al. [6] adjusted the three basic microstructural morphologies in GE48—near-γ, duplex and lamellar—by selectively varying the holding temperature. Voisin et al. [7] studied the influence of temperature distribution in the powder on the resulting microstructure with an additional FEM simulation. Lagos et al. [8] investigated the densification process with a focus on the development of the microstructure, the influence of temperature and the diffusion of the elements. For TNM, Voisin et al. [9] were also able to set different microstructure morphologies by varying the sintering temperature.
For the SPS process, the influence of dwell time and pressure on the microstructure and relative densities has only been carried out for a few other powder alloys, so far. Safian et al. [10] showed for ZnSe powder that a higher sintering temperature and holding pressure result in an increased density and grain size, with the influence of temperature being significantly greater than that of the holding pressure. Radingoana et al. [11] reported for ZnO an increase in the relative density with increasing pressure, while at the same time the grain size showed a decreasing tendency. They also showed an increase in the relative density with increased temperature, which simultaneously reduced the pressure. Cheng et al. [12] demonstrated an increasing hardness and grain size for TiC with increasing temperature and holding time. In addition, they were able to show that the relative density increases to varying degrees with increasing temperature and dwell time. It is very likely that the parameters studied also influence intermetallic TiAl alloys. Indeed, some of the previous studies were carried out at different dwell times and pressures. However, comparability is not guaranteed because different sample dimensions and tools were used, as well as different methods for determining the actual temperature in the powder.
From the studies with different alloys, it can be deduced that temperature, dwell time and pressure have different effects on the microstructure and the relative density. Consequently, it can be postulated that there is an optimal combination of parameters for GE48 and TNM powder, with which, complete compaction can be achieved with the desired microstructure.
In this work, commercially available pre-alloyed GE48 and TNM powders are processed in the SPS process. The aim is to investigate the influence of dwell time, holding pressure and temperature on relative density, resulting microstructure and resulting hardness, as well as to prove the proposed hypothesis.

2. Materials and Methods

The investigations were carried out using two different γ-based TiAl powder alloys, the frequently researched GE48 and TNM, which, due to its high content of niobium and molybdenum, also has a beta phase. Both alloys have a particle size range from 45 to 150 µm. Their compositions according to the manufacturer are listed in 
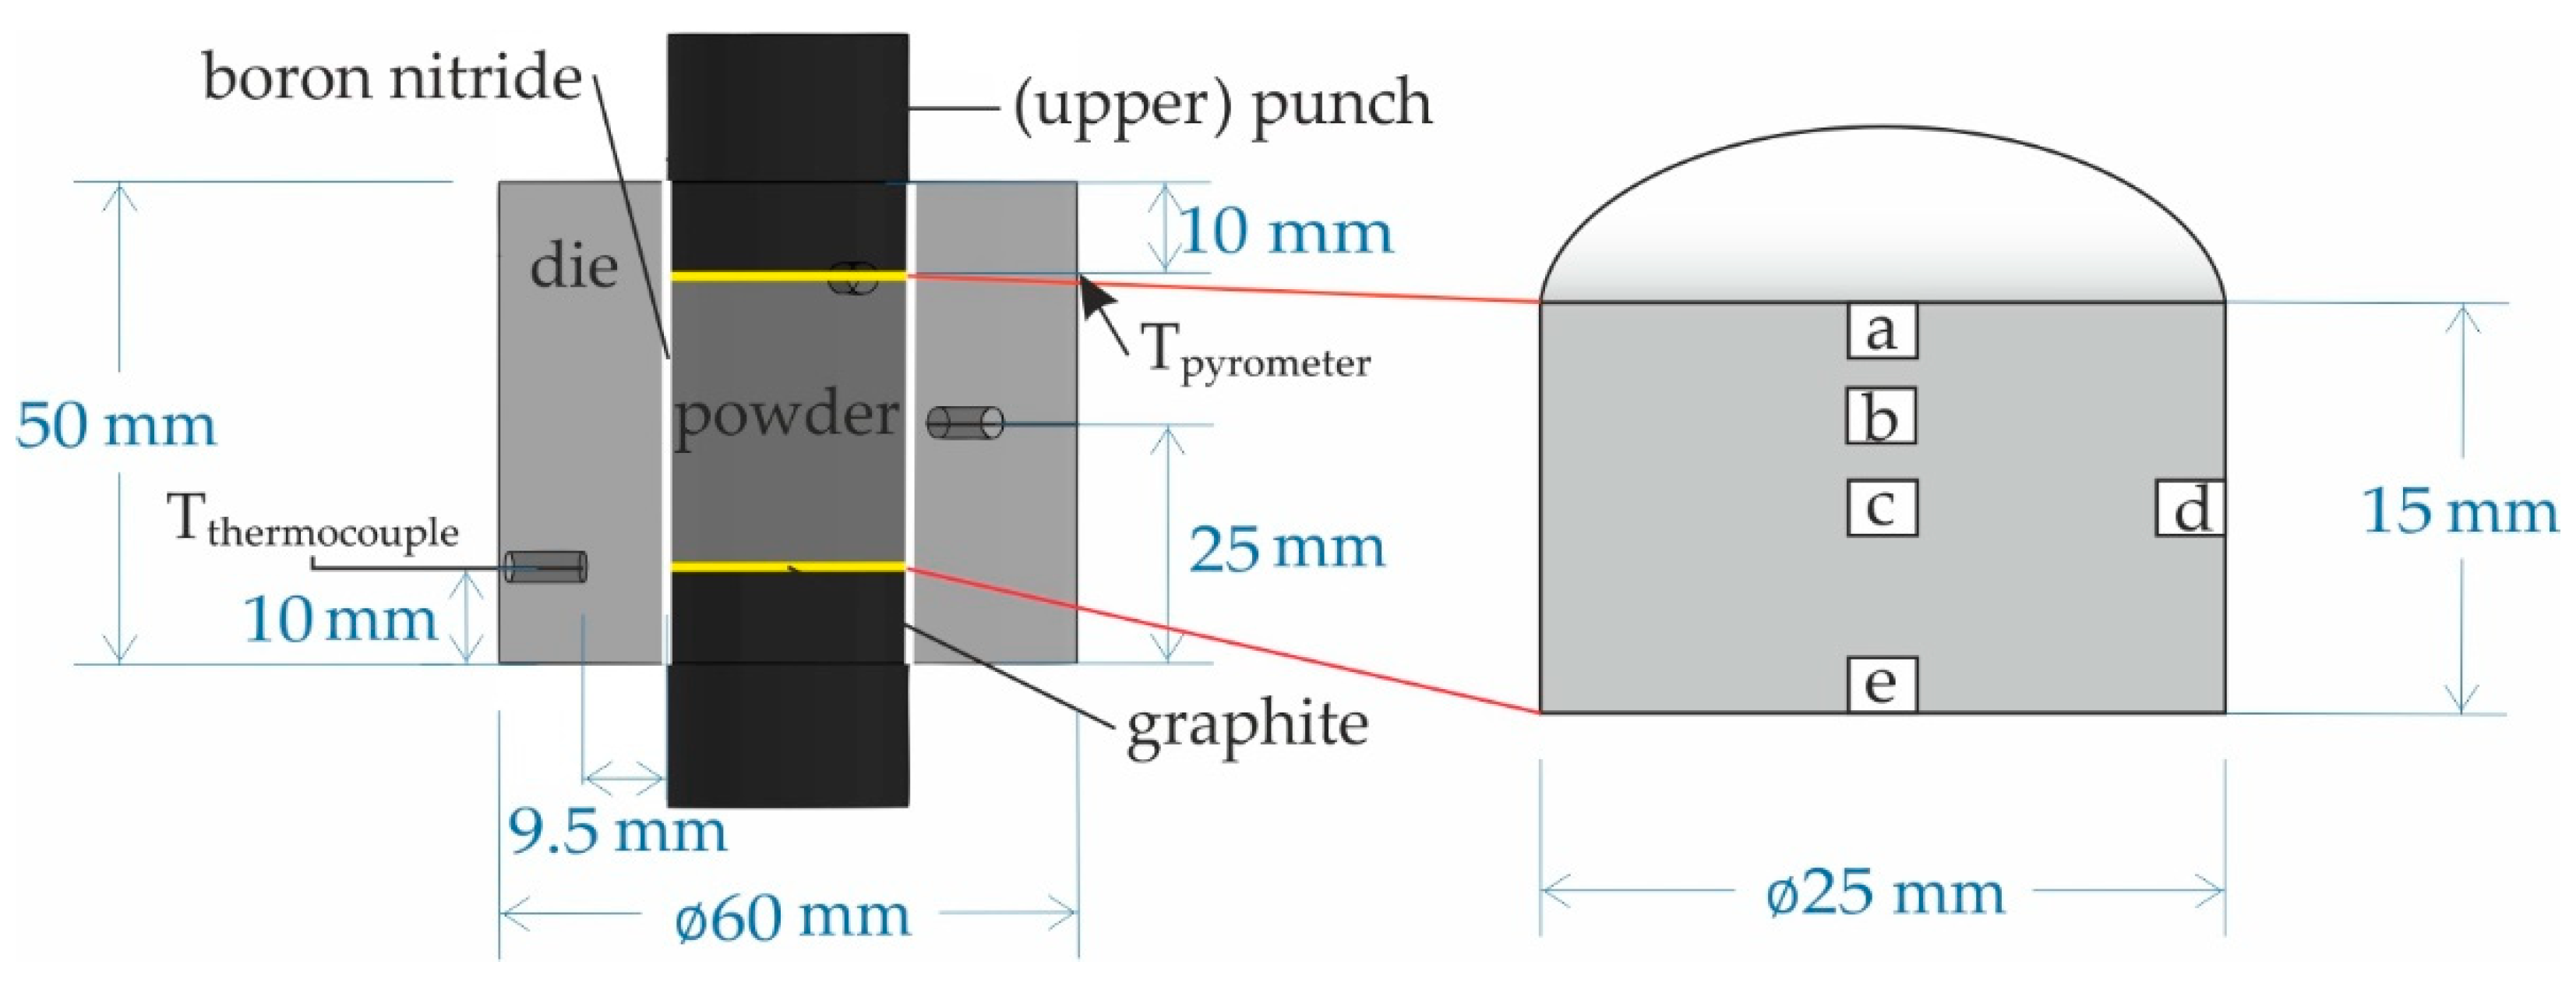
Table 1. All powders were produced by the electrode induction melting gas atomization process (EIGA) and classified under argon gas. The SPS tests were conducted on a sintering press DSP 507 by Dr. Fritsch GmbH and Co. KG using the setup as shown in Figure 1.
The tool material featured was graphite grade 2333 from Mersen Deutschland Suhl GmbH, Suhl, Germany. In order to reduce heat dissipation, the die was covered with a cylindrical carbon-bonded carbon fibre (CBCF) insulation with 62 mm height, 121 mm inner diameter and 181 mm outer diameter (not shown in Figure 1). Before each test, all contact surfaces between powder and tool were sprayed with a release agent to prevent the powder from bonding to the tool and then air-dried. According to preliminary tests [13], a modified release agent strategy was applied. For this, both punch faces were sprayed with graphite, while the die cavity was sprayed with boron nitride. The bottom of the die was closed with a punch, powder was filled in and the top of the die was closed with another punch. In order to manufacture cylindrical compacts with a diameter of 25 mm and a height of 15 mm at 100% compaction, 29.23 g GE48 and 30.56 g TNM powder were required.
In the next step, the powder was pre-compacted at less than 5 MPa pressure on a hydraulic manual press, with both punches protruding equally from the die to ensure that the powder can be heated evenly in the subsequent SPS process. The atmosphere in the SPS chamber was set to fine vacuum at the beginning of the experiments and the same heating rates, 50 K/min up to 900 °C and 20 K/min beyond, were used for all experiments. The holding pressure (30 MPa and 65 MPa) and the dwell time (2 min and 10 min) at each desired temperature were varied. The holding pressure was set directly at the beginning of the process and was not changed during it. The sintering temperature was varied from 1150 °C to 1350 °C for GE48 and from 1150 °C to 1400 °C for TNM, each in 50 °C increments. Information on the sintering temperature refers to the temperature determined in the centre of the powder, unless otherwise stated.
Up to a target temperature of 1160 °C in the die, temperature control was achieved by three type-K thermocouples, which were inserted into 8 mm deep holes in the die wall, 9.5 mm from the powder cavity at 10, 25 and 40 mm axial heights at an angle of 120° to each other (Figure 1 Left). Each thermocouple temperature Tthermocouple mentioned in this report refers to its maximum measured value of the three thermocouples used, which was usually in the middle position. For temperatures measured above 1160 °C, the control was carried out by a pyrometer pointing at the die (Tpyrometer). Before starting an experiment, the pyrometer was adjusted to the die at a distance of 10 mm axially from the upper edge of the die and was not moved during the experiment.
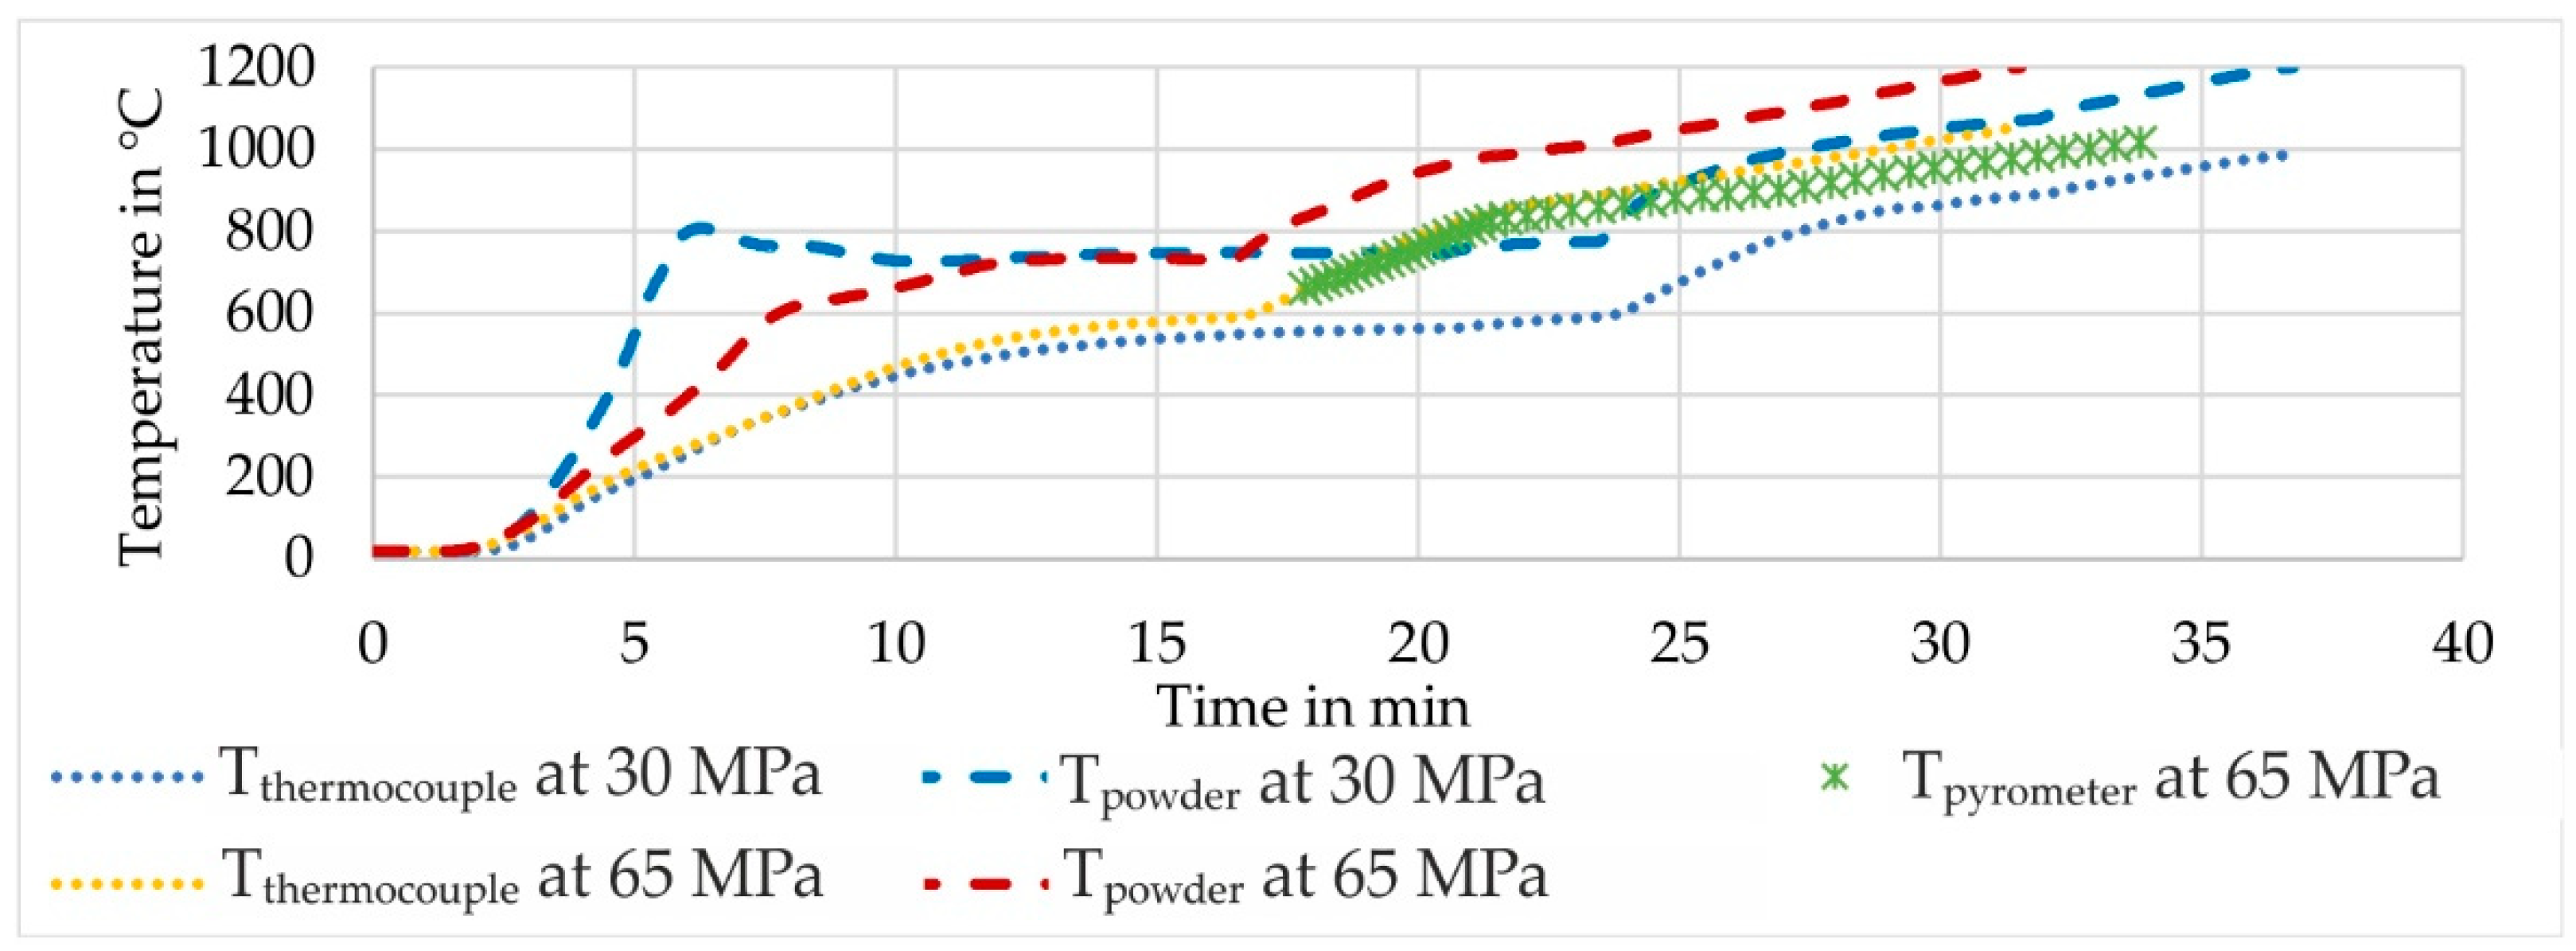
During the experiments, temperature measurement directly in the powder was not feasible. Therefore, correction factors were determined for each powder alloy, with which the actual powder temperature can be concluded, based on Tthermocouple or Tpyrometer. Initial SPS tests were carried out in which a groove was provided in the upper punch through which a suitably bent type-K thermocouple was guided into the centre of the powder. The holding pressure was also varied between 30 MPa and 65 MPa. The tests were carried out until the thermocouple in the powder failed at 1200 °C. Both temperatures Tpowder and Tthermocouple were recorded. Next, the correction factors for temperature measurement with the pyrometer were determined. Further SPS tests, up to Tthermocouple = 1150 °C, were carried out while a pyrometer was aligned on the die. For the determination of Tpyrometer at higher Tthermocouple, a linear equation was set up to describe the temperature correlation.
In order to quantify the influence of dwell time and holding pressure on the compaction and the resulting microstructure, the relative density was first determined. For this, the actual density of the sintered part was calculated by measuring weight and volume (or rather diameter and height) and was then divided by the full density, according to the manufacturer, which is 3.97 g/cm3 for GE48 and 4.15 g/cm3 for TNM [
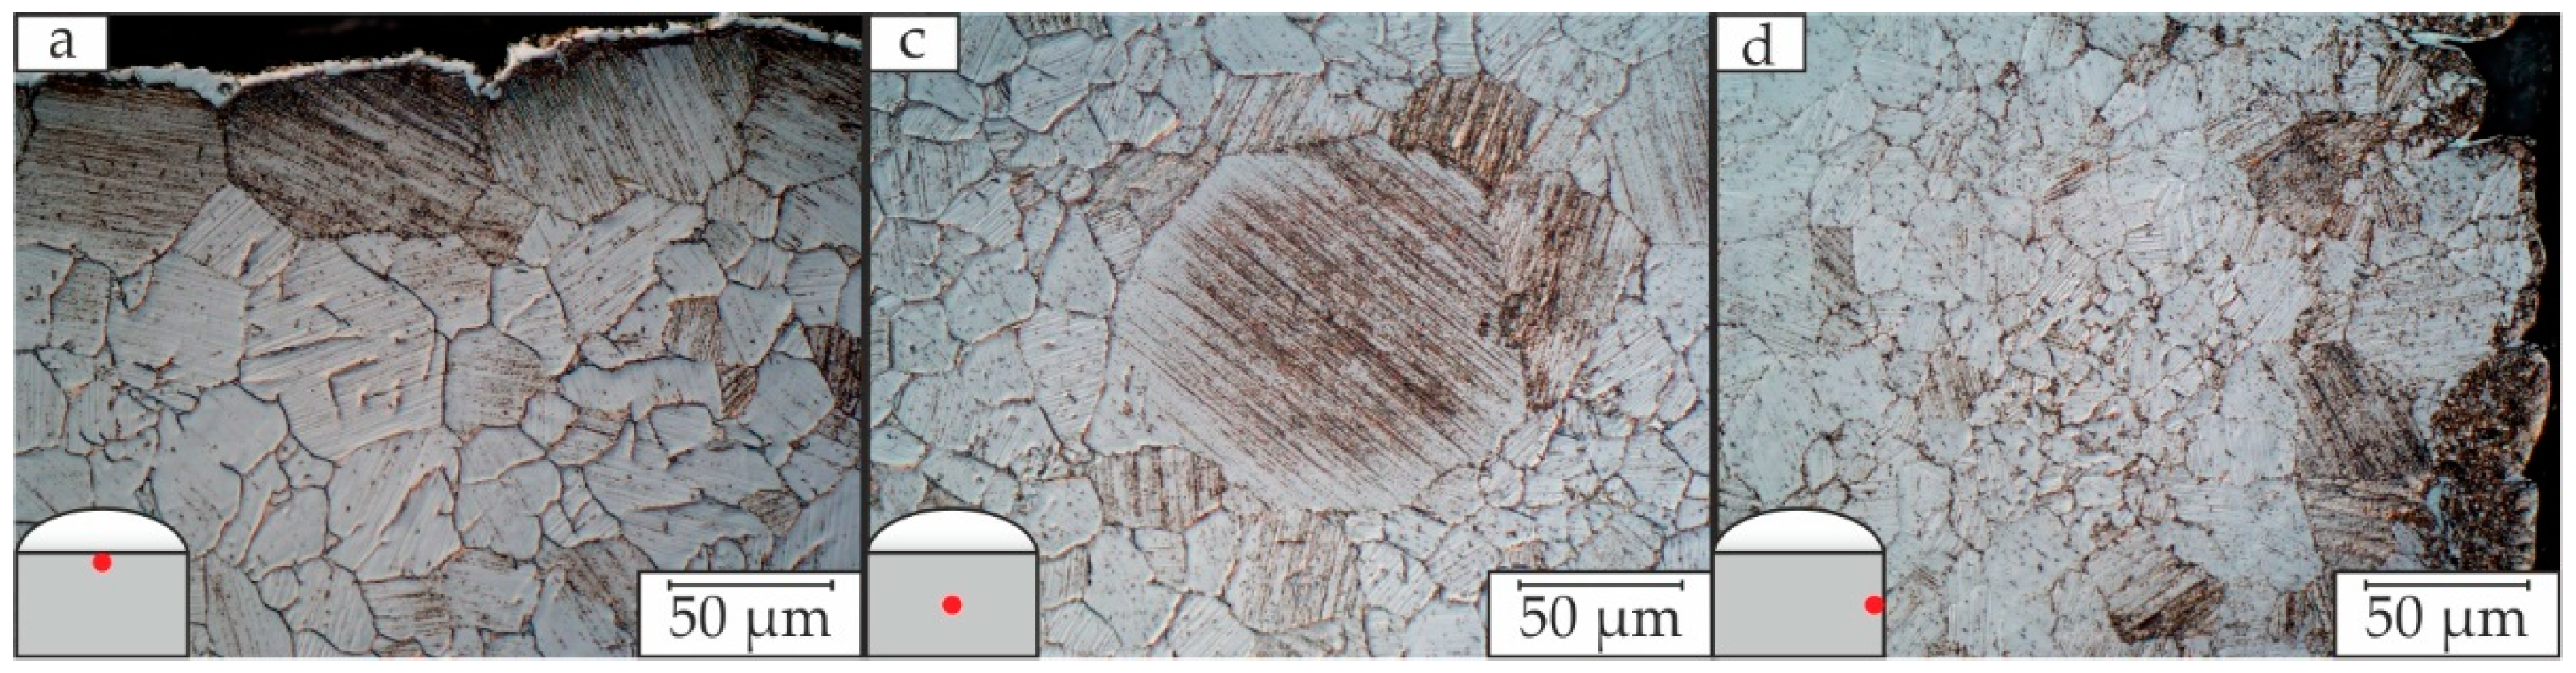
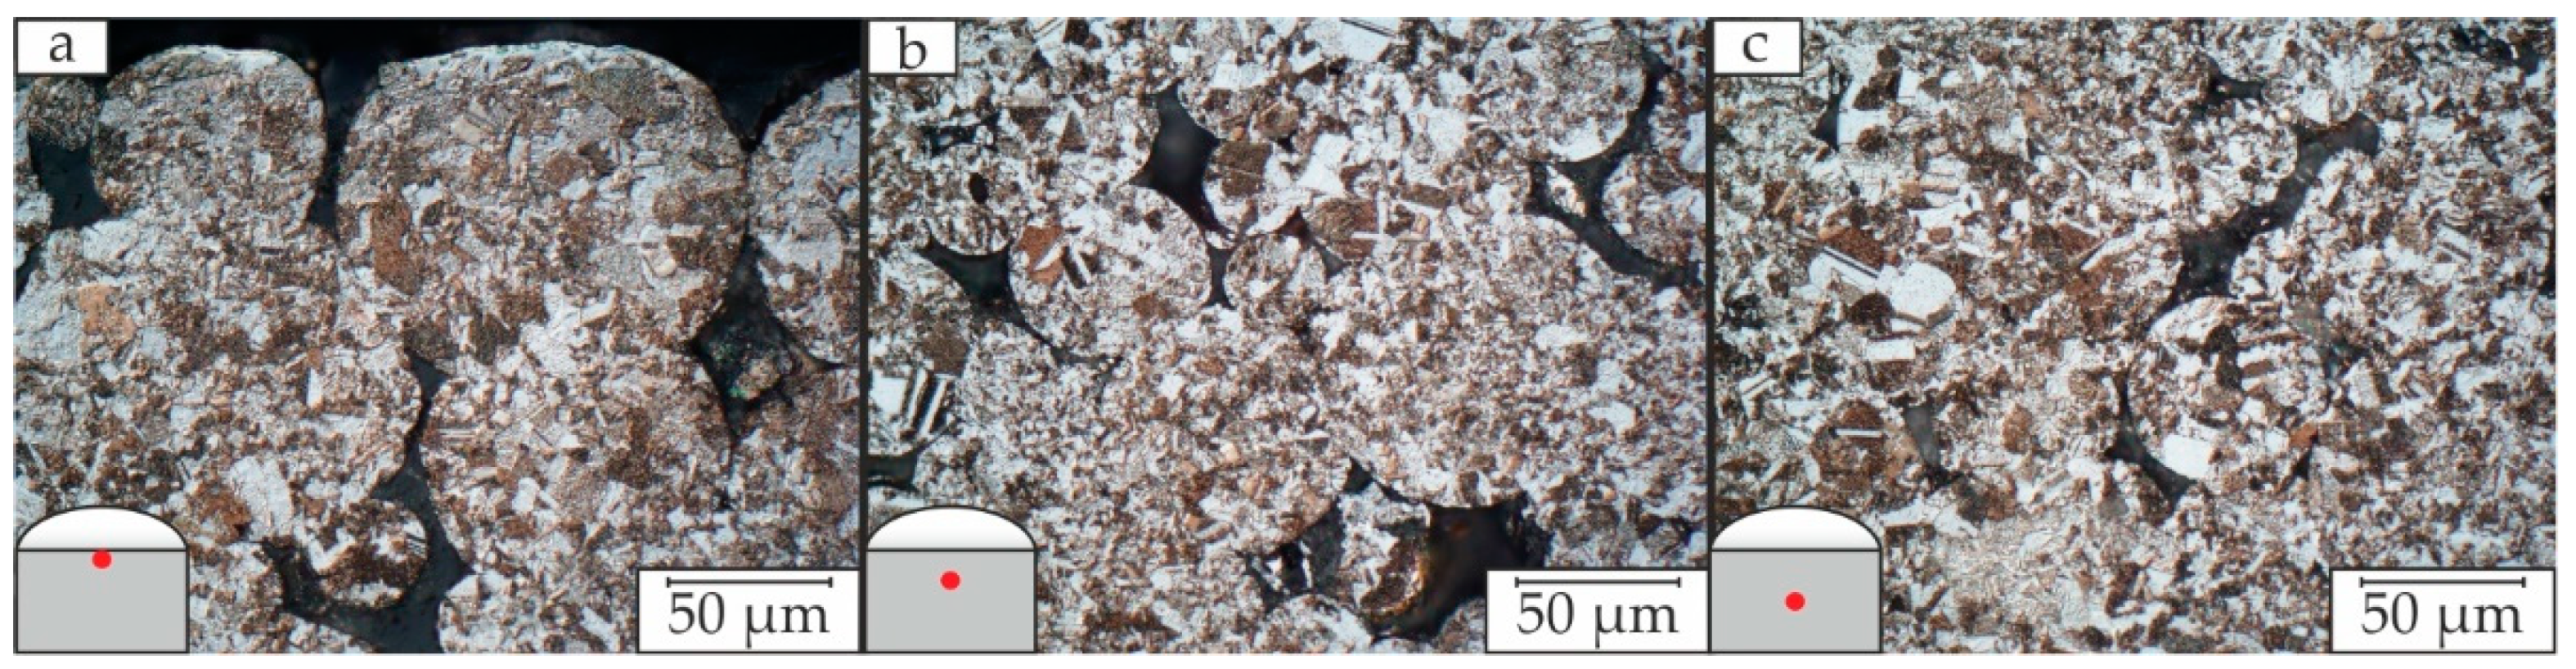
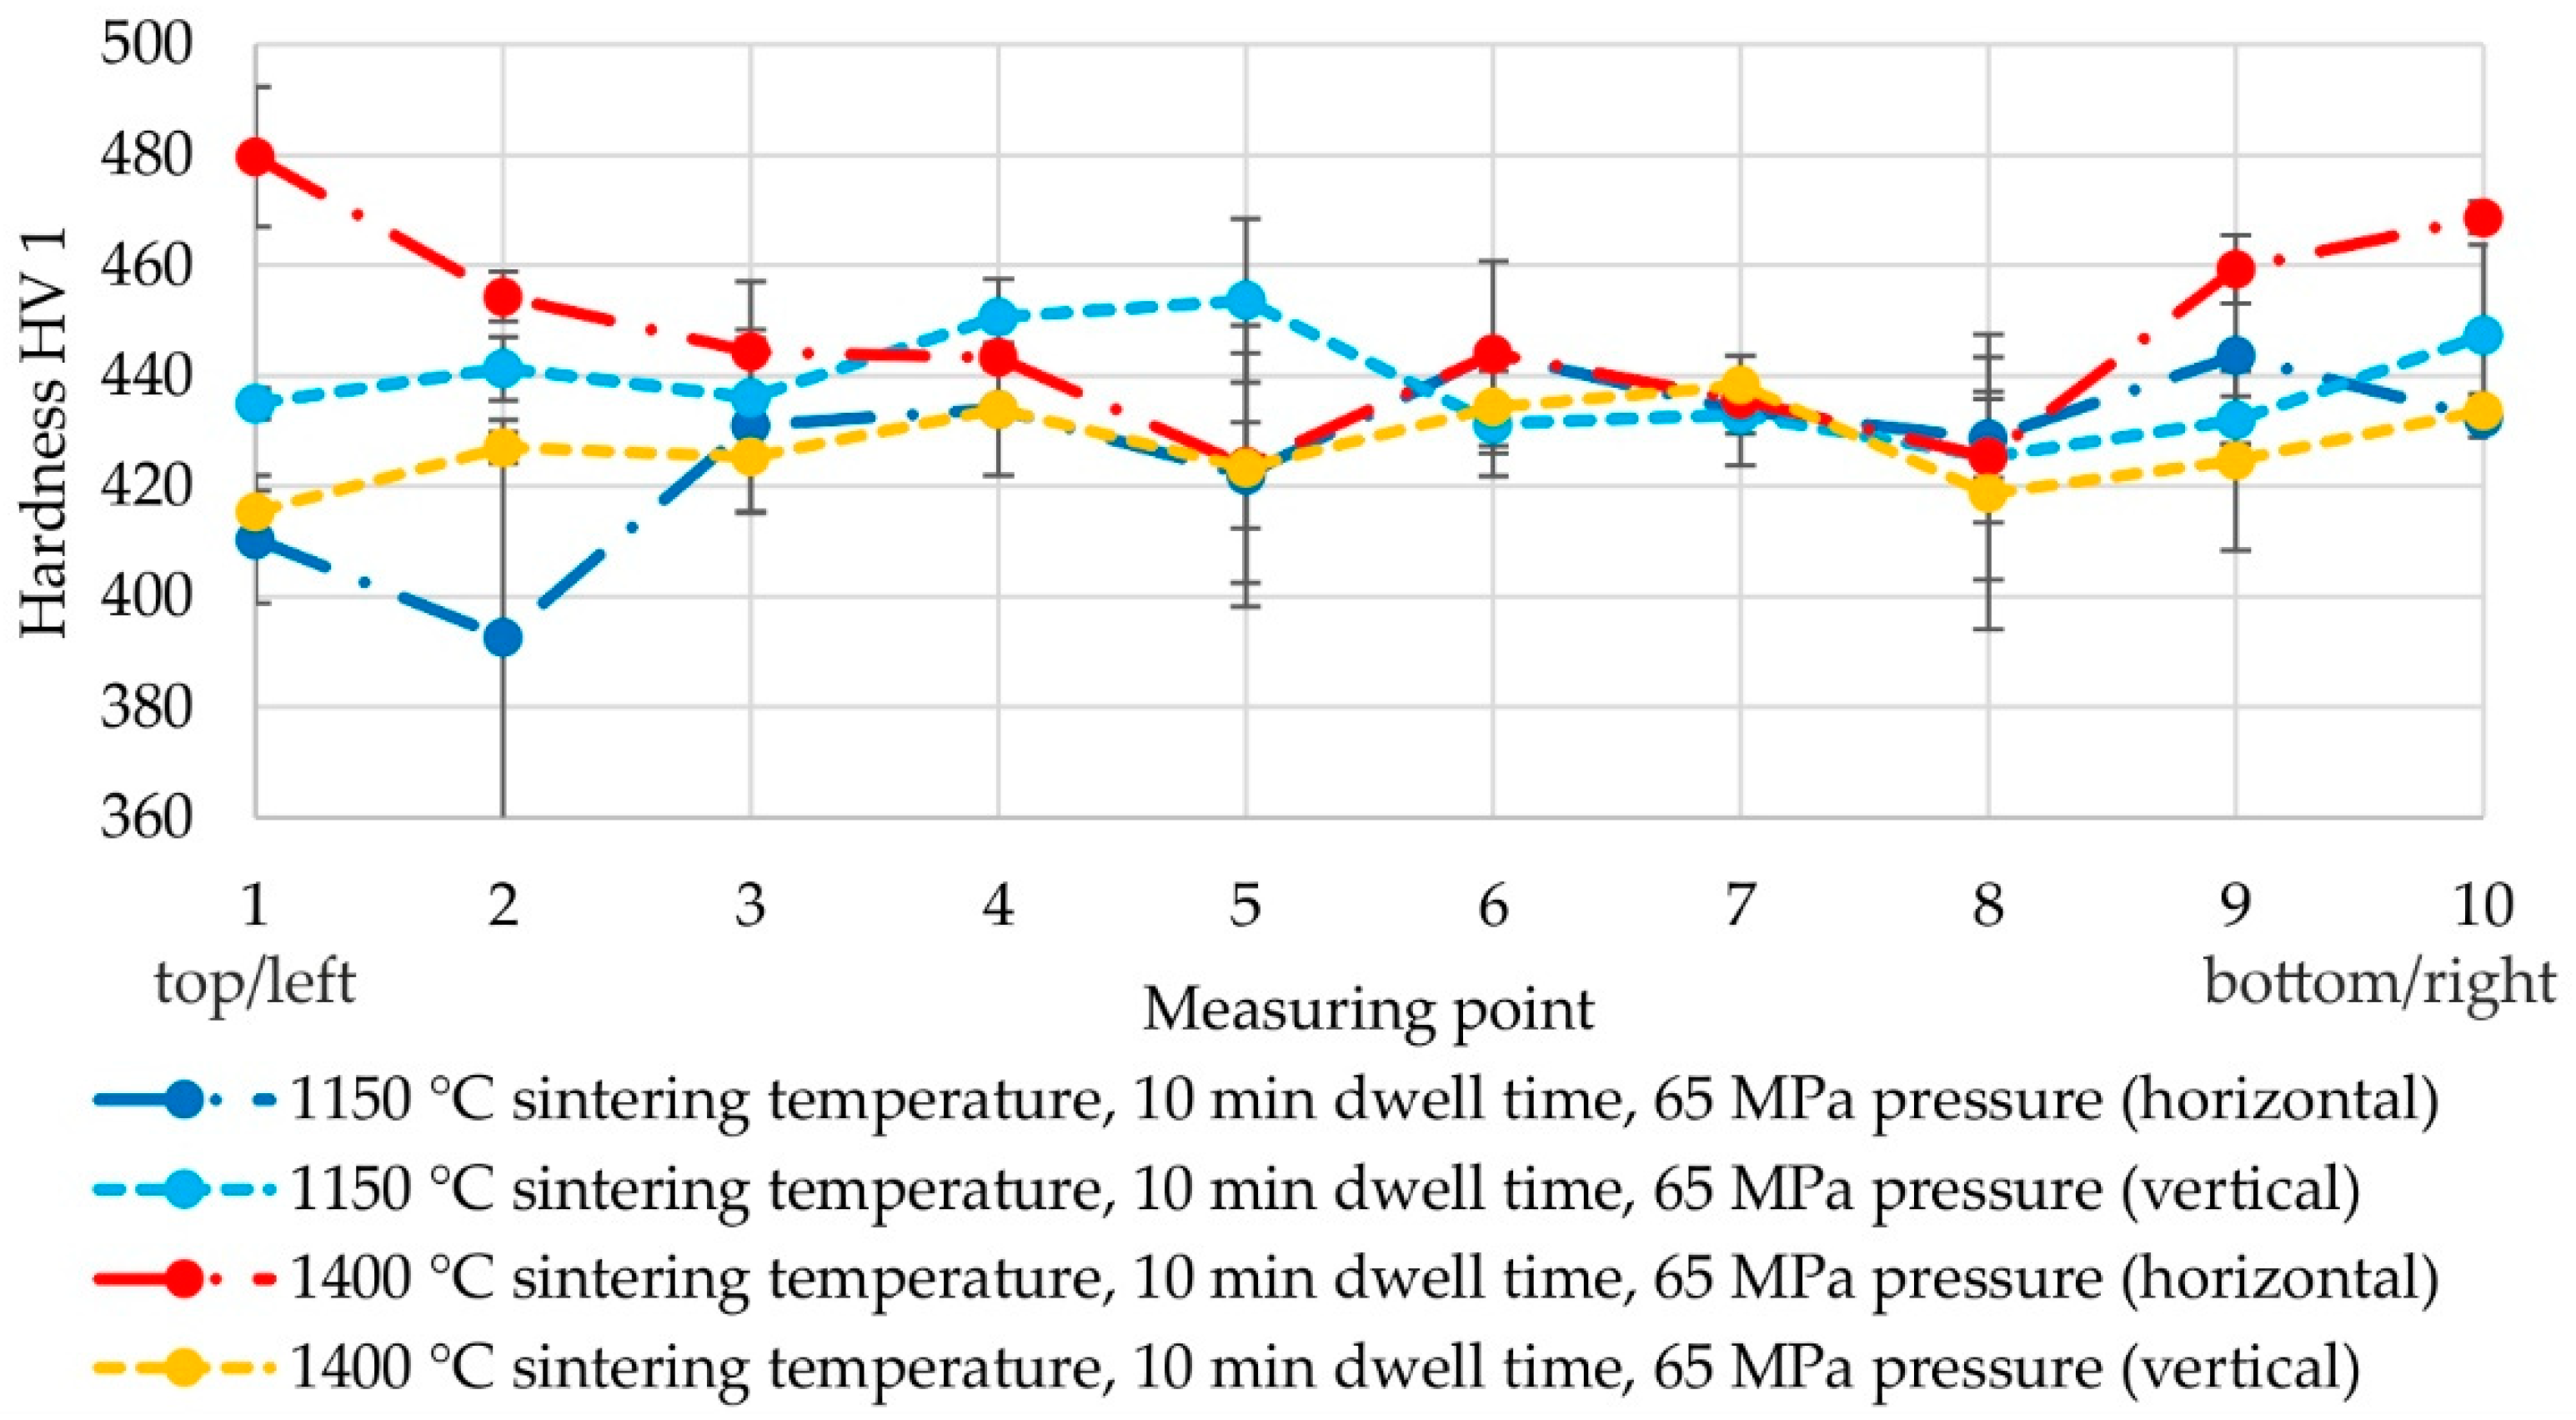
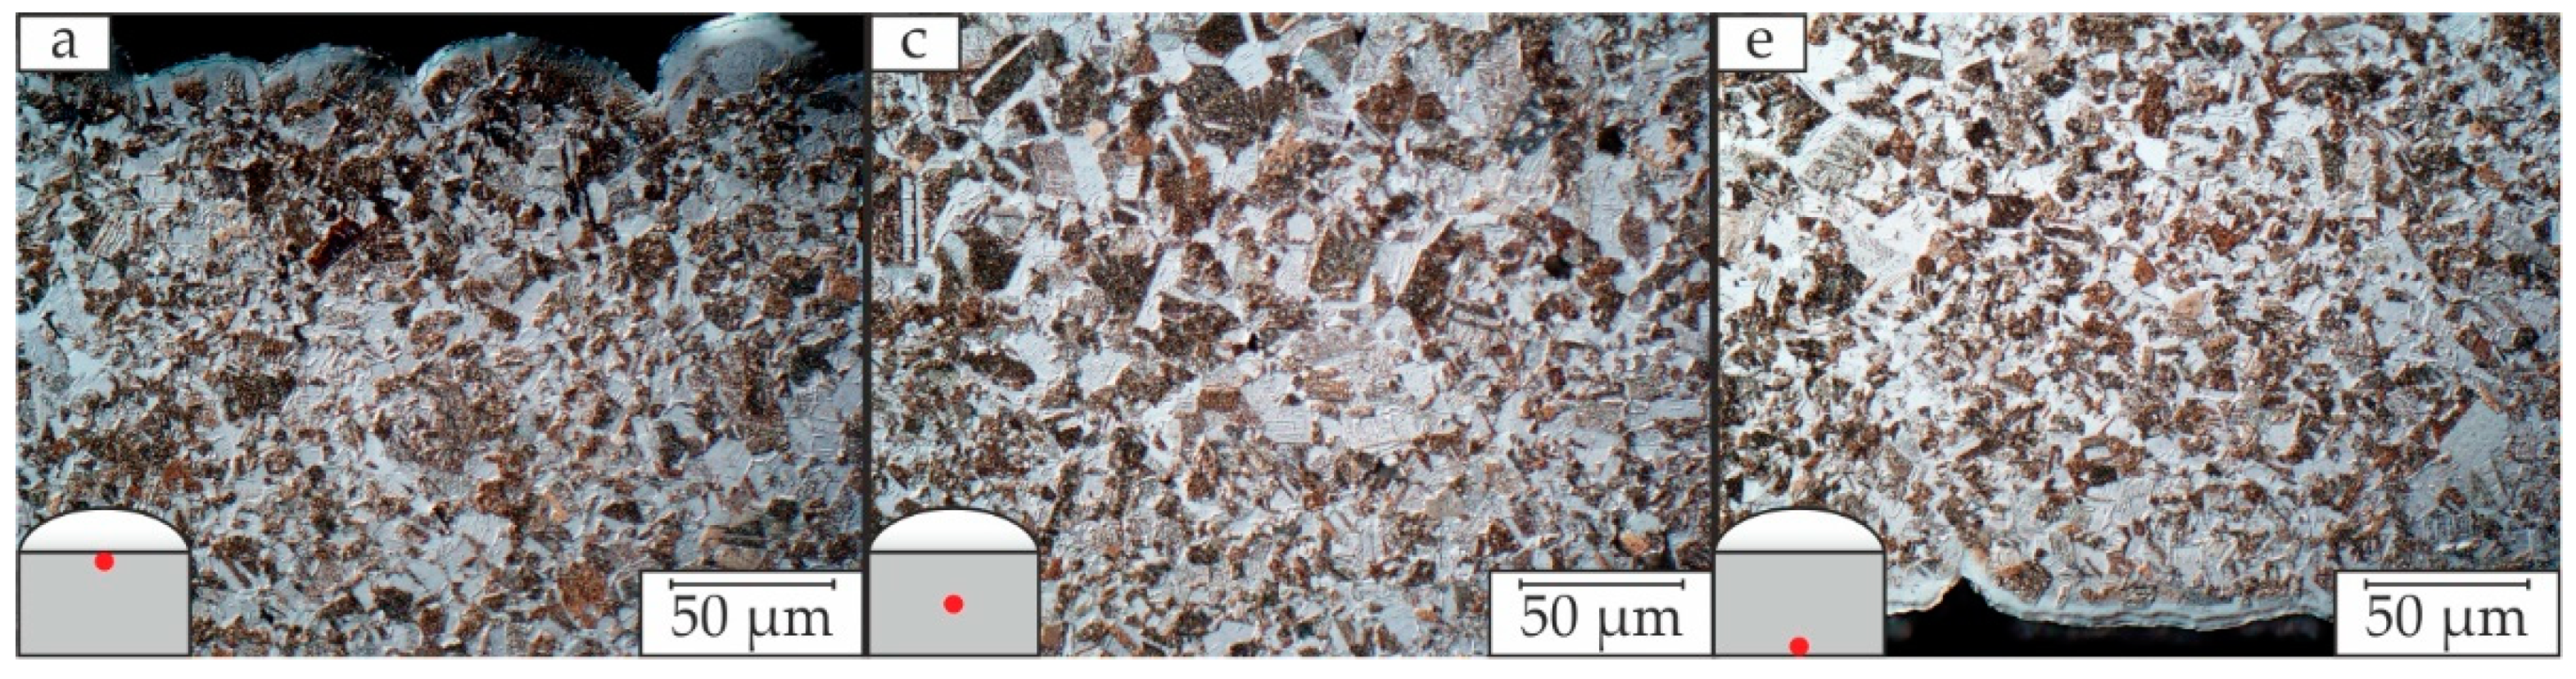
14]. Afterwards, the evaluation was carried out based on Vickers hardness measurements and microstructural analyses in the positions shown in Figure A1 and Figure 1 Right. Therefore, the samples were prepared metallographically and etched according to Kroll (3 mL HF + 6 mL HNO3 + 100 mL H2O) [15]. It was decided to use a hardness measurement method, according to HV1, carried out according to DIN EN ISO 6507-1 (test load 9.807 N), in order to map the influences of pores and the different microstructures.

3. Results and Discussion

3.1. Temperature Correction Factors

Temperature–time diagrams, to determine the correction factors for GE48 and TNM, are shown in Figure 2 and Figure 3. After an initial start-up phase in which the temperature remains at room temperature level, the temperature in the powder rises much faster than in the die. At high temperatures, beyond about 900 °C in the powder, the temperature difference between powder and die is approximately constant for both powders used, regardless of the holding pressure. For GE48, the difference is about 140 °C and for TNM about 250 °C. Consequently, TNM is sintered at a maximum of Tthermocouple = 1150 °C, thus monitoring the temperature with the pyrometer is unnecessary and has not been carried out. In contrast, GE48 is sintered at a maximum of Tthermocouple = 1210 °C, which, after applying the correction factor determined at 65 MPa, corresponds to a temperature of Tpyrometer = 1040 °C. However, the validity of these correction factors is limited to the experimental setup shown.
Due to the release agents used (boron nitride inside the die), the current flows primarily through punch and powder, causing the die to heat up only marginally at most. Mainly, the die is heated by heat conduction from the much hotter powder in its cavity (Figure 2 and Figure 3). Both punches faced water-cooled electrodes, so they were simultaneously cooled. Due to the use of graphite as a release agent between the punches and the powder, the electrical current should predominantly heat the powder as it has a higher resistance. However, when looking at stereo-light microscopic images, a temperature gradient can be assumed (Figure 4). According to this, electrical resistance is greatest at the contact between the punch and the powder [16], thus the greatest heating takes place there. Towards the centre of the sample, the temperature decreases and consequently the grain size decreases. Since the thermocouple wire was guided through the highest temperature point in the powder, it can be assumed that, due to heat conduction in the thermocouple, its measuring tip was warmer than the surrounding powder [17]. The challenge can be met by insulating the thermocouple especially at the hottest point or by reducing the powder-filling height.
Measuring points on the die surface start from the reliable measuring range of the pyrometer at 600 °C (Figure 2). The measuring point, at which the pyrometer is directed, is at the greatest distance from the heat source, the powder, so that the temperature here is also significantly lower. Since Tthermocouple increases at similar rates as Tpowder, regardless of pressure, it can be assumed that Tpyrometer is pressure independent as well. Therefore, the determination of an additional correction factor at 30 MPa pressure was not performed.

3.2. GE48—Microstructure and Hardness

At 1150 °C sintering temperature, 2 min dwell time and 30 MPa pressure, no complete sintering occurs (Figure 5). The black areas in the figure are pores. The relative density, which is 84%, confirms this. Many pores lead to massive fluctuations in hardness measurements (Figure 6), which do not allow any statement on hardness, but only indicate a tendency. After increasing the dwell time to 10 min, the average hardness in vertical direction increases to 281 HV1, the relative density increases to 95%. A longer holding time leads to a more homogeneous temperature distribution, which ultimately results in better sintering and thus in a higher hardness [18]. Increasing pressure and reducing dwell time results in a slightly increased hardness averaging 295 HV1 in the vertical direction with a relative density of 99%. The maximum hardness in the vertical direction (306 HV1 on average) is achieved at the highest dwell time and pressure. A higher contact pressure may have led to stronger contact between powder and tool, allowing the current to flow more evenly between them, causing the powder to heat up more in general [19]. Such an effect could not be observed when determining the correction factor. As already shown in Behrens et al. [13], the release agent used has a great influence on the resulting temperature in the process. In this context, a different layer thickness of release agent may have masked the previously described influence.
After increasing the sintering temperature to 1200 °C, this effect can still be observed, as higher pressures result in higher hardness (Figure 7) and better densification (relative density about 99%). A comparison of horizontal and vertical hardness curves at 2 min dwell time and 30 MPa pressure clearly shows larger fluctuations in the horizontal curve, which increase from the centre to the shell surface of the sample. Thus, a lower temperature is present in the shell surface of the sample than in the remaining area. The microstructure in the outer areas (Figure 8 Top) confirms this, as large pores and even individual powder particles are visible. Consequently, no complete sintering has taken place, resulting in a relative density of about 91% in this case. Observations made during the determination of the correction factors (see Section 3.1 Temperature Correction Factors, Figure 4) regarding a temperature gradient within the sample could be confirmed. At higher pressure, local differences in microstructure and hardness are only marginal. Obviously, there is almost complete sintering (Figure 8 Bottom). The visible pores are only visible on the outermost shell surface (Figure 8 (d)–Bottom) and therefore barely have any influence on the relative density.
In general, up to 1200 °C, a homogeneous near-γ microstructure is present within the sample, regardless of dwell time or pressure.
Above 1250 °C, the relative density is always about 99%, regardless of dwell time and pressure. At 1250 °C, 10 min dwell time and 65 MPa pressure, duplex or lamellar microstructure already forms in the punch-side edge area, which changes into a near-γ microstructure towards the centre of the sample (Figure 9). Consequently, the temperature has decreased in the vertical direction towards the centre of the sample. With shorter dwell times and lower pressures, only a near-γ microstructure is present (Figure A2). Consequently, hardness values are also lower compared with duplex or lamellar microstructure morphology.
At 1300 °C, 10 min dwell time and 65 MPa pressure, a lamellar structure is already visible except on the middle shell surface, at which a near-γ microstructure is visible (Figure 10). At 2 min dwell time and 30 MPa pressure, a lamellar microstructure is also visible in the punch-side edge area, which quickly turns into a duplex microstructure and near-γ in the middle of the sample (Figure A3). As expected, near-γ also develops in the horizontal edge region. Hardness profiles reflect this behaviour. In the area of lamellar structure, the hardness is at its maximum, with 326 HV1, while in the near-γ area in the centre of the sample it is at its minimum, with 286 HV1. Overall, the hardness tends to increase with increasing dwell time and pressure.
This characteristic does not change at 1350 °C, where a lamellar structure is present throughout every tested parameter combination, except for the 2 min dwell time and 30 MPa pressure in the horizontal edge region (Figure A4). At 10 min dwell time and 65 MPa pressure, a homogeneous lamellar structure is present, which already shows first signs of melting on one of both punch sides (Figure 11). This suggests different depths of both punches during the process. This problem could be counteracted with a floating die, as this would allow two-sided pressing to be realized [20]. With this parameter combination, the average hardness in vertical direction reaches its maximum with 334 HV1.

3.3. TNM—Microstructure and Hardness

At 1150 °C sintering temperature, 2 min dwell time and 30 MPa pressure, many pores are present in the entire sample cross-section (Figure 12), resulting in a relative density of about 84%. Due to the many large pores, a hardness measurement has not been carried out. Short dwell time combined with low pressure were not sufficient for complete sintering. The large single pore in the powder particle (Figure 12 (c) results from the atomisation process [21]. By increasing the pressure to 65 MPa, higher compression occurs [22], so that the relative density rises to about 88%. After an additional increase in dwell time to 10 min, the relative density even rises to over 99% and almost complete sintering is achieved (Figure A5). Owing to the longer dwell time, the powder heats up more homogeneously, which leads to more complete sintering.
With an increase in temperature by 50 °C (1200 °C), 2 min dwell time and 30 MPa pressure, poor sintering is only evident in the area of the middle shell surface (Figure 13). The relative density of about 94% confirms incomplete sintering.
Up to 1250 °C sintering temperature, at 2 min dwell time and 30 MPa pressure, a duplex structure is evident; whereas, at a dwell time of 10 min and a pressure of 65 MPa, this is only the case up to 1200 °C. Consequently, the increased pressure combined with longer dwell time affected the temperature and caused a higher temperature inside the sample compared to 2 min dwell time and 30 MPa pressure. Presumably, the higher pressure led to more contact between the powder and the tool, which allowed more current to flow through the powder, thus heating it more effectively. The longer dwell time then only led to a more even distribution of the temperature. At 1250 °C sintering temperature, 10 min dwell time and 65 MPa pressure, a duplex structure is only present in the area of the horizontal edges, whereas a laminar structure is already present in the other parts of the area (Figure 14).
With an increase in temperature of 50 °C (1300 °C), 2 min dwell time and 30 MPa pressure, a laminar structure is predominant except for the horizontal sample area (Figure A6 Top), while at 10 min dwell time and 65 MPa pressure a laminar structure is already present everywhere (Figure A6 Bottom). Just as at 1250 °C sintering temperature, the longer dwell time combined with higher pressure probably led to better heating of the sample, which reflects in a different structure. Beyond 1300 °C, the relative density is always over 99%, regardless of dwell time and pressure. At 1400 °C sintering temperature, 2 min dwell time and 30 MPa pressure, a lamellar microstructure is present in the entire sample cross-section (Figure A7).
As with the GE48 powder, incomplete sintering occurred especially in the area of the middle shell at low sintering temperatures, which indicates a low temperature. A possible cause for the temperature gradient could be the heat transfer to the die. In contrast, there are no pores on the punch-side edge area, as the temperature was highest there due to the greater resistance, resulting in complete sintering.
The average hardness in vertical direction increases only marginally with rising temperature from 427 HV1 at 1150 °C to 439 HV1 at 1400 °C (Figure 15). In contrast to the GE48 samples, the hardness at the edge of the sample is similar to that in the centre of the sample. The hardness tends to increase slightly with higher holding pressure. It can be assumed, however, that both microstructural morphologies set in the tests have similar hardness values. However, the dependence is by far not as distinct as with GE48 powder and, in addition, the absolute hardness values are significantly higher than with GE48 powder.

4. Conclusions

For the GE48 powder and a sintering temperature of 1150 °C, both relative density and hardness rise with increasing dwell time and pressure. When increasing the temperature, this effect weakens; pores are only present in horizontal edge areas. From 1250 °C upwards, there is almost complete sintering, regardless of dwell time and pressure. At a dwell time of 10 min and a pressure of 65 MPa, a lamellar structure begins to form at the edge of the punches, which, towards the centre of the sample, is first a duplex and then a near-γ structure. With an increase in temperature to 1300 °C, near-γ is exclusively present in the horizontal edge region, while at 1350 °C, a laminar structure is present everywhere. At 2 min dwell time and 30 MPa pressure, the same characteristics can be achieved with temperatures, which are 50 °C higher. As expected, the hardness increases from near-γ to duplex to lamellar structure up to 326 HV1.
With the TNM powder, at the lowest tested temperature, dwell time and lowest pressure, the sample is permeated with pores and the relative density is only 84%. When increasing the temperature, pores are only visible in the horizontal edge area. At 1300 °C, a lamellar structure forms except for the horizontal edge area, which only extends over the entire sample cross-section from 1350 °C upwards. At the maximum dwell time and pressure, these phenomena will occur with temperatures, which are 50 °C lower. The hardness ranges from 427 to 439 HV1.
The contact and consequently the current flow between tool and powder have improved due to higher pressure, which results in higher heating. However, there is still a temperature gradient across the sample cross-section, which decreases with rising sintering temperature and dwell time [16].
The results show that, with a lower temperature and, at the same time, a higher holding pressure and dwell time, a similar result can be achieved as with a higher temperature and a lower pressure and dwell time. Thus, the hypothesis that there is an optimal combination of parameters which could bring about every desired type of microstructure for each material could not be confirmed. Nevertheless, it could be demonstrated that a similar result can be achieved with different parameters.

Author Contributions

Conceptualization, B.-A.B. and K.B.; methodology, A.H.; validation, K.B., J.P. and A.H.; investigation, A.H.; writing—original draft preparation, A.H.; writing—review and editing, K.B., J.P. and A.H.; visualization, A.H.; supervision, B.-A.B., K.B. and J.P.; project administration, B.-A.B.; funding acquisition, B.-A.B. All authors have read and agreed to the published version of the manuscript.

Funding

Funded by the Deutsche Forschungsgemeinschaft (DFG, German Research Foundation)—Project-ID 394563137—SFB 1368.

Data Availability Statement

The data presented in this study are available in the article.

Conflicts of Interest

The authors declare no conflict of interest.

Appendix A

Figure A1. Position and quantity of the hardness measurements carried out.
Metals 12 00083 g0a1
Figure A2. Microstructure in defined positions a, c and e according to Figure 1 Right of a GE48 sample sintered at 1250 °C, with 2 min dwell time and 30 MPa pressure.
Metals 12 00083 g0a2
Figure A3. Microstructure in defined positions a, b and c according to Figure 1 Right of a GE48 sample sintered at 1300 °C, with 2 min dwell time and 30 MPa pressure.
Metals 12 00083 g0a3
Figure A4. Microstructure in defined positions a, c and e according to Figure 1 Right of a GE48 sample sintered at 1350 °C, with 2 min dwell time and 30 MPa pressure.
Metals 12 00083 g0a4
Figure A5. Microstructure in defined positions a, c and d according to Figure 1 Right of a TNM sample sintered at 1150 °C, with 10 min dwell time and 65 MPa pressure.
Metals 12 00083 g0a5
Figure A6. Microstructure in defined positions a, c and d according to Figure 1 Right of a TNM sample sintered at 1300 °C, with 2 min dwell time and 30 MPa pressure (Top) and 10 min dwell time and 65 MPa pressure (Bottom).
Metals 12 00083 g0a6
Figure A7. Microstructure in defined positions a, c and d according to Figure 1 Right of a TNM sample sintered at 1400 °C, with 2 min dwell time and 30 MPa pressure.
Metals 12 00083 g0a7

References

  1. Annamalai, A.R.; Srikanth, M.; Varshney, R.; Ashokkumar, M.Y.; Patro, S.K.; Jen, C.-P. Microstructure Evolution and Mechanical Properties of Spark Plasma Sintered Manganese Addition on Ti-48Al-2Cr-2Nb Alloys. Metals 2020, 10, 1577. [Google Scholar] [CrossRef]
  2. Yamaguchi, M.; Inui, H.; Ito, K. High-temperature structural intermetallics. Acta Mater. 2000, 48, 307–322. [Google Scholar] [CrossRef]
  3. Martins, D.; Grumbach, F.; Simoulin, A.; Sallot, P.; Mocellin, K.; Bellet, M.; Estournès, C. Spark plasma sintering of a commercial TiAl 48-2-2 powder: Densification and creep analysis. Mater. Sci. Eng. A 2018, 711, 313–316. [Google Scholar] [CrossRef] [Green Version]
  4. Guillon, O.; Gonzalez-Julian, J.; Dargatz, B.; Kessel, T.; Schierning, G.; Räthel, J.; Herrmann, M. Field-Assisted Sintering Technology/Spark Plasma Sintering: Mechanisms, Materials, and Technology Developments. Adv. Eng. Mater. 2014, 16, 830–849. [Google Scholar] [CrossRef]
  5. Mondalek, P.; Silva, L.; Bellet, M. A Numerical Model for Powder Densification by SPS Technique. Adv. Eng. Mater. 2011, 13, 587–593. [Google Scholar] [CrossRef] [Green Version]
  6. Couret, A.; Voisin, T.; Thomas, M.; Monchoux, J.-P. Development of a TiAl Alloy by Spark Plasma Sintering. JOM 2017, 69, 2576–2582. [Google Scholar] [CrossRef] [Green Version]
  7. Voisin, T.; Durand, L.; Karnatak, N.; Le Gallet, S.; Thomas, M.; Le Berre, Y.; Castagné, J.-F.; Couret, A. Temperature control during Spark Plasma Sintering and application to up-scaling and complex shaping. J. Mater. Processing Technol. 2013, 213, 269–278. [Google Scholar] [CrossRef]
  8. Lagos, M.A.; Agote, I. SPS synthesis and consolidation of TiAl alloys from elemental powders: Microstructure evolution. Intermetallics 2013, 36, 51–56. [Google Scholar] [CrossRef]
  9. Voisin, T.; Monchoux, J.-P.; Hantcherli, M.; Mayer, S.; Clemens, H.; Couret, A. Microstructures and mechanical properties of a multi-phase β-solidifying TiAl alloy densified by spark plasma sintering. Acta Mater. 2014, 73, 107–115. [Google Scholar] [CrossRef]
  10. Safian, S.; Zakeri, M.; Rahimipour, M.R.; Rahbari, A.; Irom, E. Influence of SPS parameters on the density and hardness of zinc selenide. Int. J. Mater. Res. 2016, 107, 948–953. [Google Scholar] [CrossRef]
  11. Radingoana, P.M.; Guillemet-Fritsch, S.; Olubambi, P.A.; Chevallier, G.; Estournès, C. Influence of processing parameters on the densification and the microstructure of pure zinc oxide ceramics prepared by spark plasma sintering. Ceram. Int. 2019, 45, 10035–10043. [Google Scholar] [CrossRef] [Green Version]
  12. Cheng, L.; Xie, Z.; Liu, G.; Liu, W.; Xue, W. Densification and mechanical properties of TiC by SPS-effects of holding time, sintering temperature and pressure condition. J. Eur. Ceram. Soc. 2012, 32, 3399–3406. [Google Scholar] [CrossRef]
  13. Behrens, B.A.; Heymann, A. Investigation on temperature control in the SPS process with titanium aluminides. In Proceedings of the METAL 2021, Brno, Czech Republic, 26–28 May 2021; pp. 1089–1094. [Google Scholar]
  14. Behrens, B.A.; Brunotte, K.; Bohr, D. Experimental Investigation of Endogenous Lubrication during Cold Upsetting of Sintered Powder Metallurgical Components. KEM 2018, 767, 163–170. [Google Scholar] [CrossRef]
  15. Seeger, J.; Klein, J.; Mecking, H. Farbmetallographie an den intermetallischen Phasen γ-TiAl und α2-Ti3Al Colour Metallography of the Intermetallic Phases γ-TiAl und α2-Ti3Al. Pract. Metallogr. 1990, 27, 236–241. [Google Scholar] [CrossRef]
  16. Wei, X.; Giuntini, D.; Maximenko, A.L.; Haines, C.D.; Olevsky, E.A. Experimental Investigation of Electric Contact Resistance in Spark Plasma Sintering Tooling Setup. J. Am. Ceram. Soc. 2015, 98, 3553–3560. [Google Scholar] [CrossRef]
  17. Rizika, J.W.; Rohsenow, W.M. Thermocouple Thermal Error. Ind. Eng. Chem. 1952, 44, 1168–1171. [Google Scholar] [CrossRef]
  18. Guillon, O. Effects of Applied Stress and Heating Rate in Field Assisted Sintering. In Sintering: Mechanisms of Convention Nanodensification and Field Assisted Processes; Castro, R.H.R., Ed.; Springer: Berlin/Heidelberg, Germany, 2013; pp. 195–213. ISBN 9783642310096. [Google Scholar]
  19. Grasso, S.; Sakka, Y.; Maizza, G. Pressure Effects on Temperature Distribution during Spark Plasma Sintering with Graphite Sample. Mater. Trans. 2009, 50, 2111–2114. [Google Scholar] [CrossRef] [Green Version]
  20. Barkov, L.A.; Samodurova, M.N.; Zakirov, R.A.; Latfulina, Y.S. Device for One- and Two-Sided Molding of Refractory Metal Powders Into Electric-Arc Melting Electrode Workpieces. Metallurgist 2018, 61, 917–921. [Google Scholar] [CrossRef]
  21. Ternovoi, Y.F.; Tsipunov, A.G.; Kuratchenko, S.B.; Kuimova, O.M.; Kondakova, K.V. Pore formation in atomized powders. Sov. Powder Metall. Met. Ceram. 1985, 24, 10–13. [Google Scholar] [CrossRef]
  22. Borkar, T.; Banerjee, R. Influence of spark plasma sintering (SPS) processing parameters on microstructure and mechanical properties of nickel. Mater. Sci. Eng. A 2014, 618, 176–181. [Google Scholar] [CrossRef]
Figure 1. Experimental setup (Left) and positions of morphology images a to e in the sample (Right).
Metals 12 00083 g001
Figure 2. Temperature–time diagram of GE48 to determine correction factors.
Metals 12 00083 g002
Figure 3. Temperature–time diagram of TNM to determine correction factors.
Metals 12 00083 g003
Figure 4. Stereographic image of sintered GE48 powder.
Metals 12 00083 g004
Figure 5. Microstructure in defined positions a, b and c according to Figure 1 Right of a GE48 sample sintered at 1150 °C, with 2 min dwell time and 30 MPa pressure.
Metals 12 00083 g005
Figure 6. Hardness profiles in vertical direction from top to bottom of the samples of GE48, sintered at 1150 °C.
Metals 12 00083 g006
Figure 7. Hardness profiles in vertical and horizontal direction from top or left to bottom or right of the samples of GE48, sintered at 1200 °C.
Metals 12 00083 g007
Figure 8. Microstructure in defined positions a, c and d according to Figure 1 Right of GE48 samples sintered at 1200 °C, with 2 min dwell time and 30 MPa pressure (Top) and 10 min dwell time and 65 MPa pressure (Bottom).
Metals 12 00083 g008
Figure 9. Microstructure in defined positions a, c and e according to Figure 1 Right of a GE48 sample sintered at 1250 °C, with 10 min dwell time and 65 MPa pressure.
Metals 12 00083 g009
Figure 10. Microstructure in defined positions a, c and d according to Figure 1 Right of a GE48 sample sintered at 1300 °C, with 10 min dwell time and 65 MPa pressure.
Metals 12 00083 g010
Figure 11. Microstructure in defined positions c, d and e according to Figure 1 Right of a GE48 sample sintered at 1350 °C, with 10 min dwell time and 65 MPa pressure.
Metals 12 00083 g011
Figure 12. Microstructure in defined positions a, c and d according to Figure 1 Right of a TNM sample sintered at 1150 °C, with 2 min dwell time and 30 MPa pressure.
Metals 12 00083 g012
Figure 13. Microstructure in defined positions a, c and d according to Figure 1 Right of a TNM sample sintered at 1200 °C, with 2 min dwell time and 30 MPa pressure.
Metals 12 00083 g013
Figure 14. Microstructure in defined positions a, c and d according to Figure 1 Right of a TNM sample sintered at 1250 °C, with 2 min dwell time and 30 MPa pressure (Top) and 10 min dwell time and 65 MPa pressure (Bottom).
Metals 12 00083 g014
Figure 15. Hardness profiles in vertical and horizontal direction from top or left to bottom or right of samples of TNM, sintered at 1150 °C and 1400 °C.
Metals 12 00083 g015
Table 1. Chemical composition of GE48 and TNM powder.
AlloyTi
in wt.%
Al
in wt.%
Cr
in wt.%
Nb
in wt.%
Mo
in wt.%
B
in wt.%
GE4859.6033.002.604.80--
TNM60.0728.60-9.002.300.03
Publisher’s Note: MDPI stays neutral with regard to jurisdictional claims in published maps and institutional affiliations.

