
Fatigue Assessment of Inconel 625 Produced by Directed Energy Deposition from Miniaturized Specimens

 ,
,  ,
, 

Abstract
1. Introduction
2. Materials and Methods
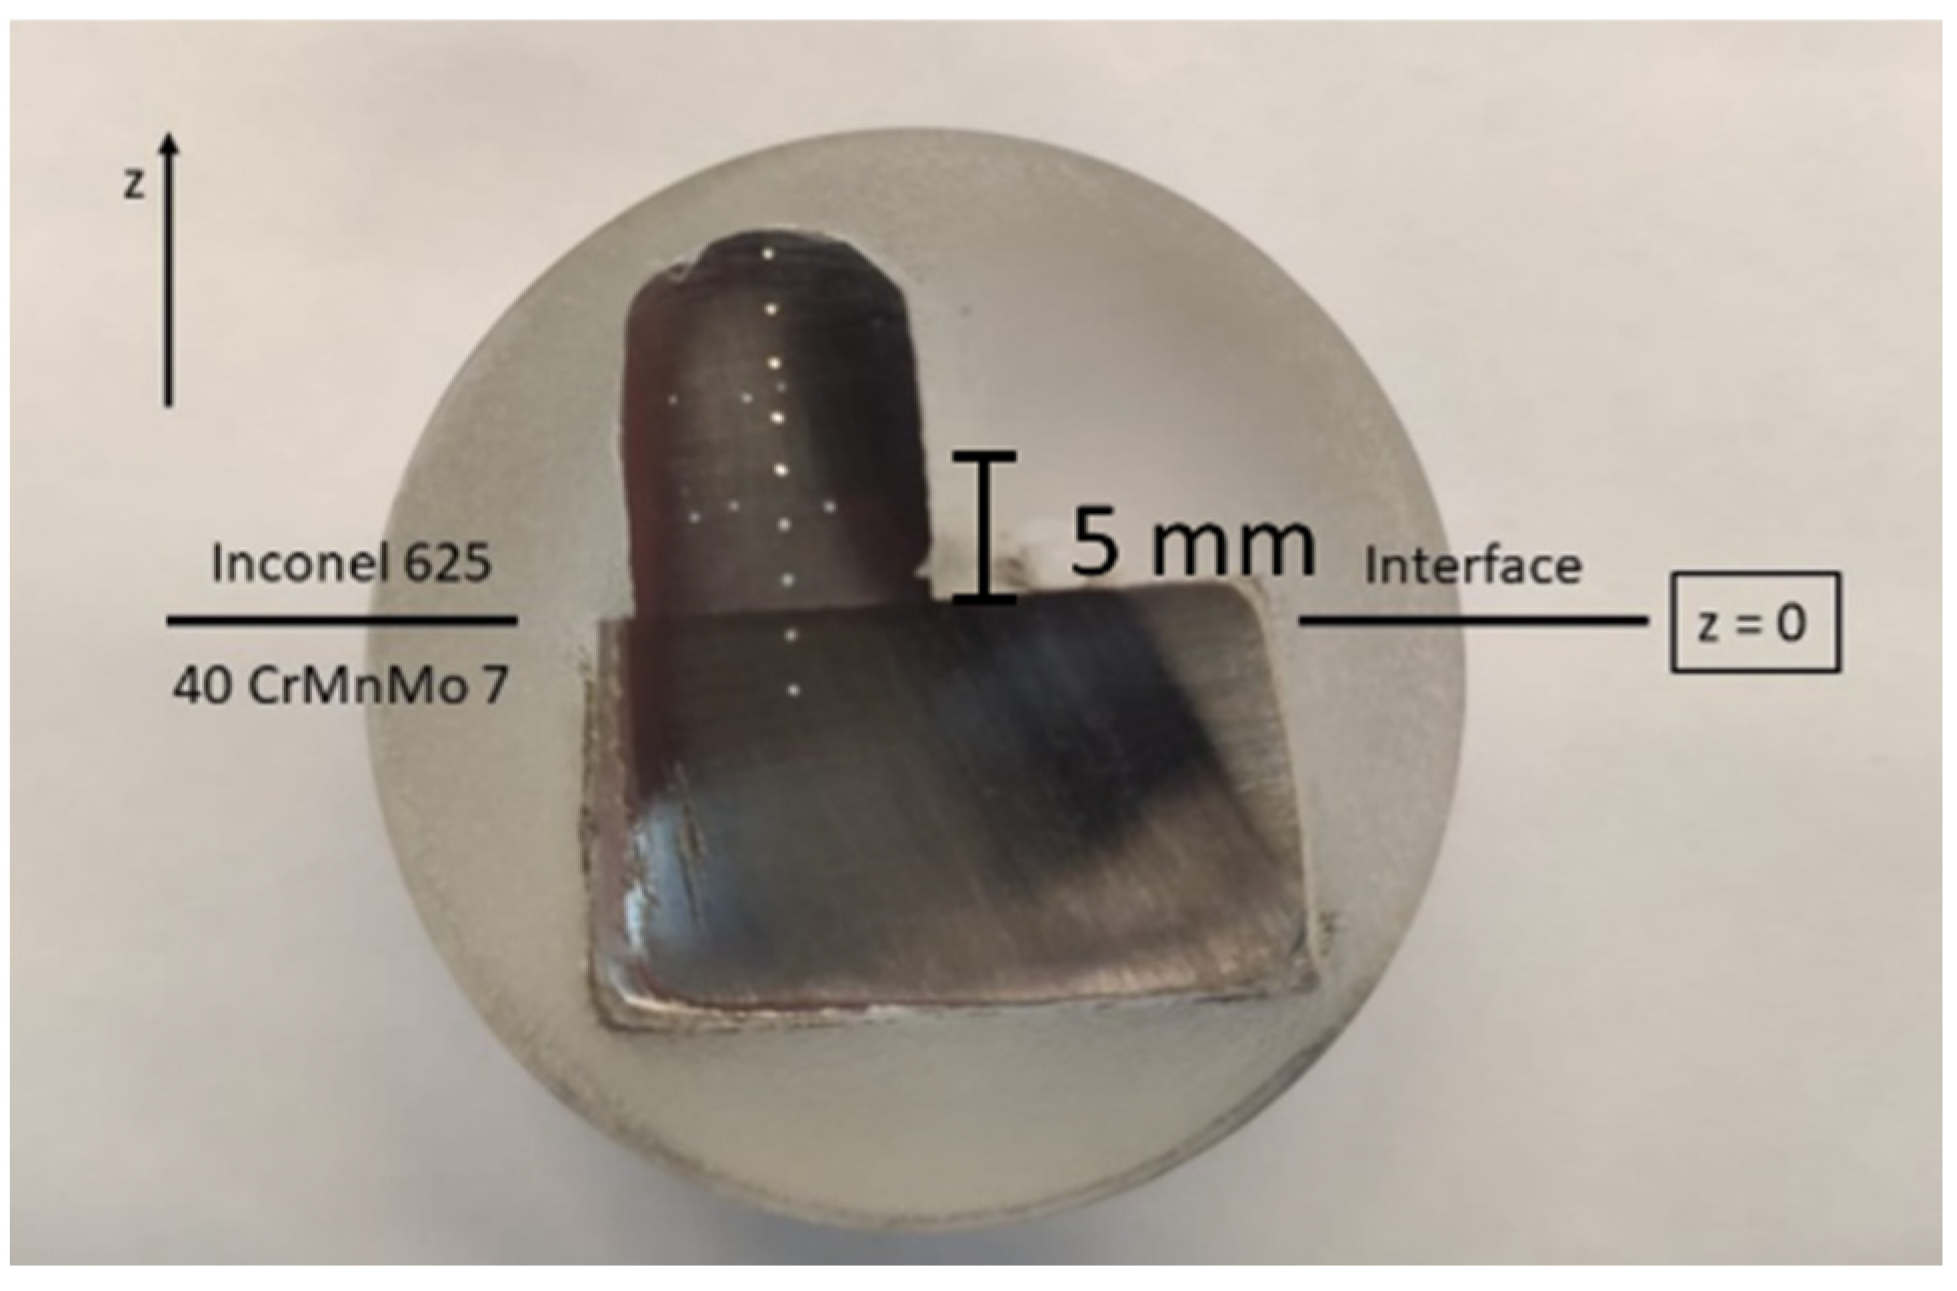
2.1. Samples Manufacturing
2.2. Metallography
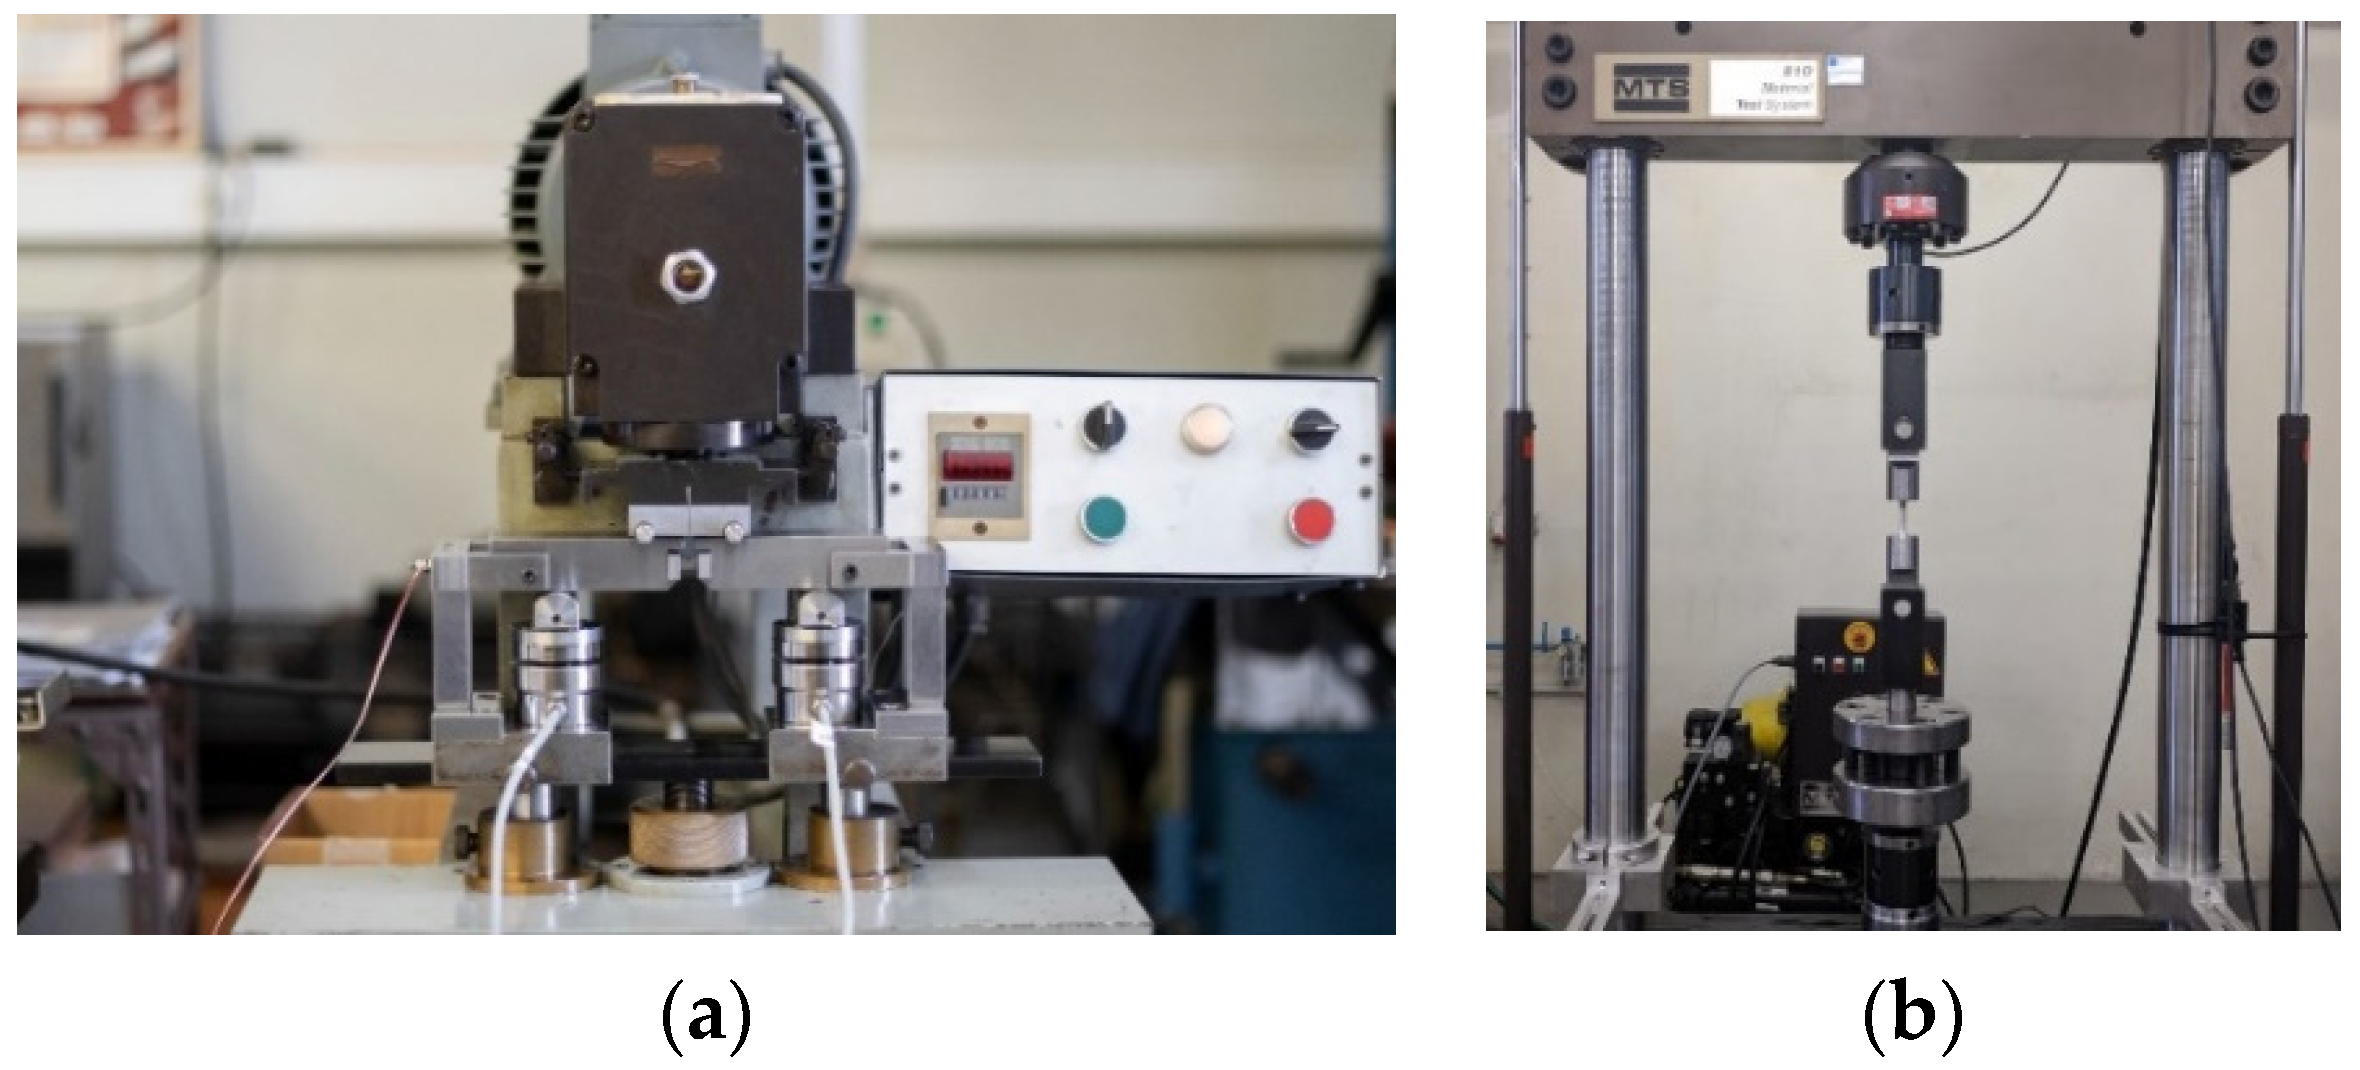
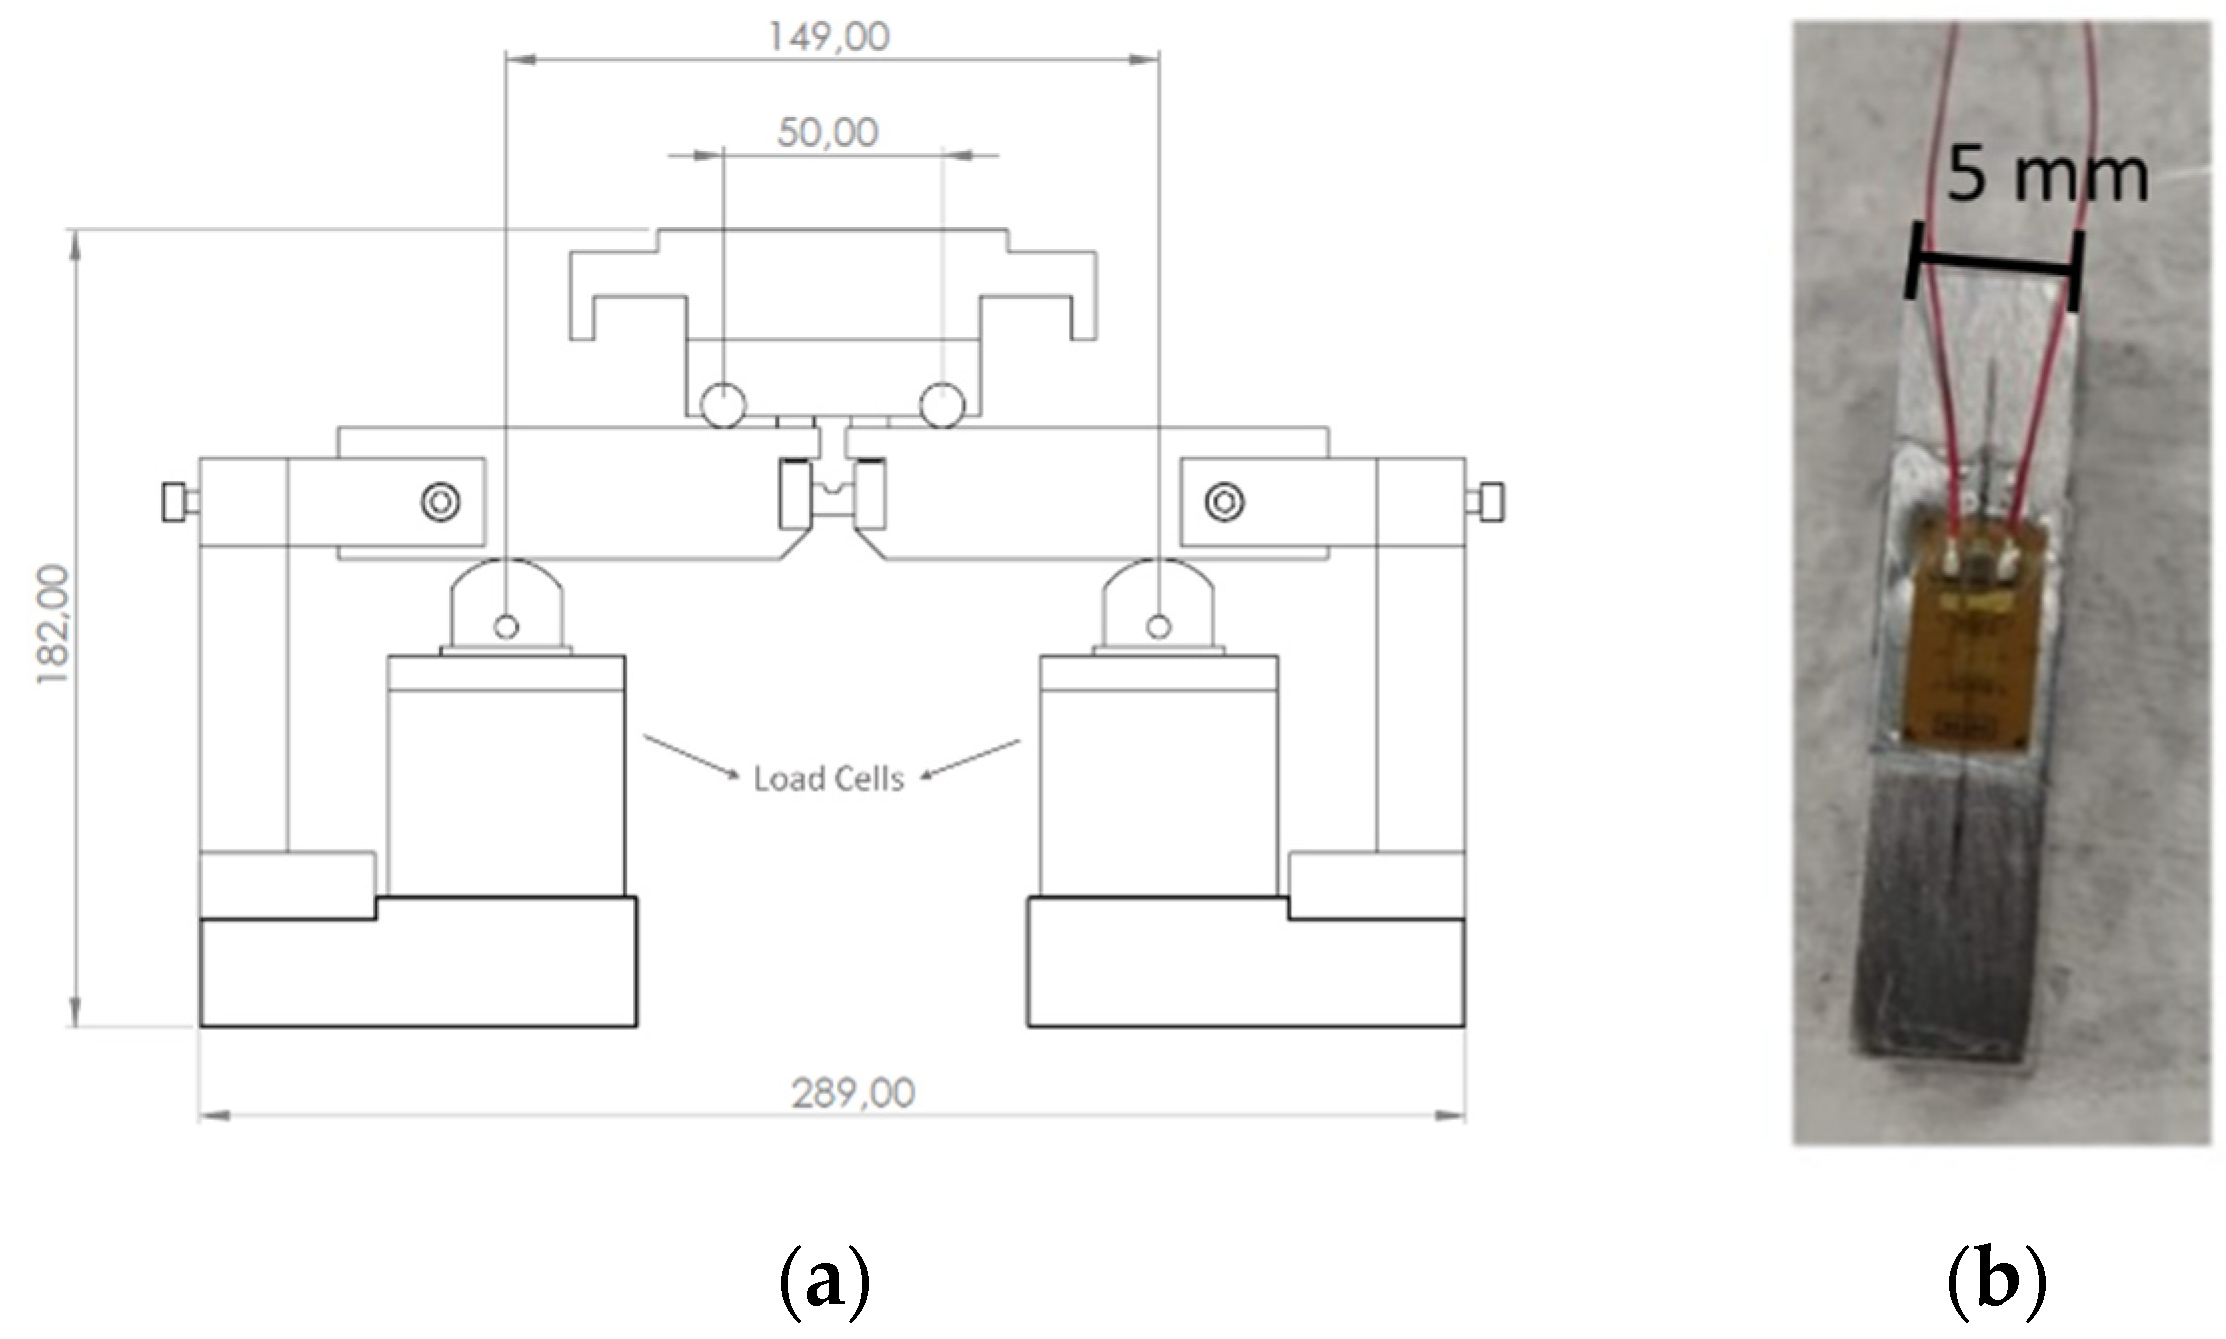
2.3. Fatigue Tests
2.4. Tensile and Hardness Tests
2.5. Numerical Model of the Miniature Specimen Fatigue Test Setup and Calibration
3. Results and Discussion
3.1. Microstructural Investigation
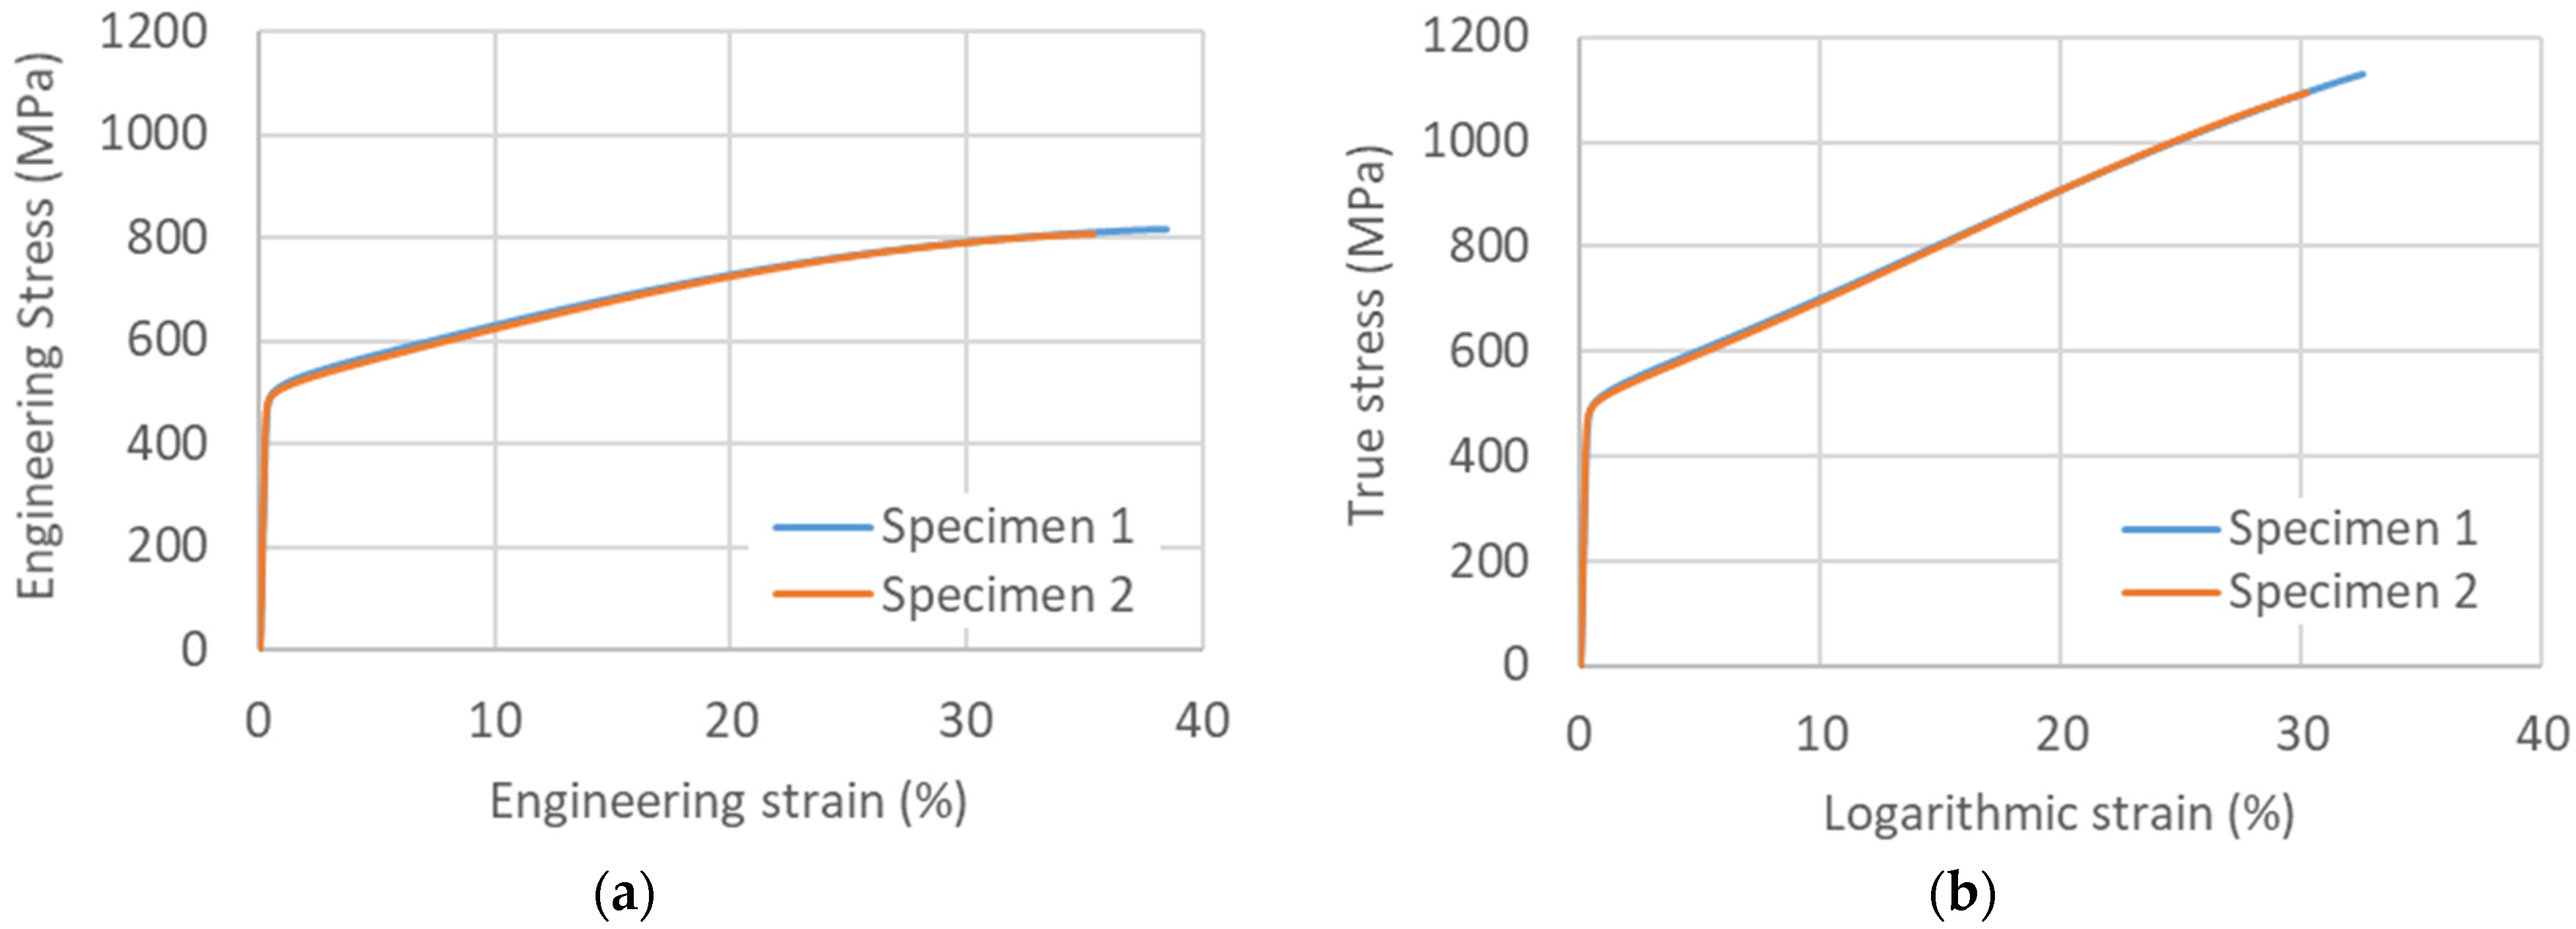
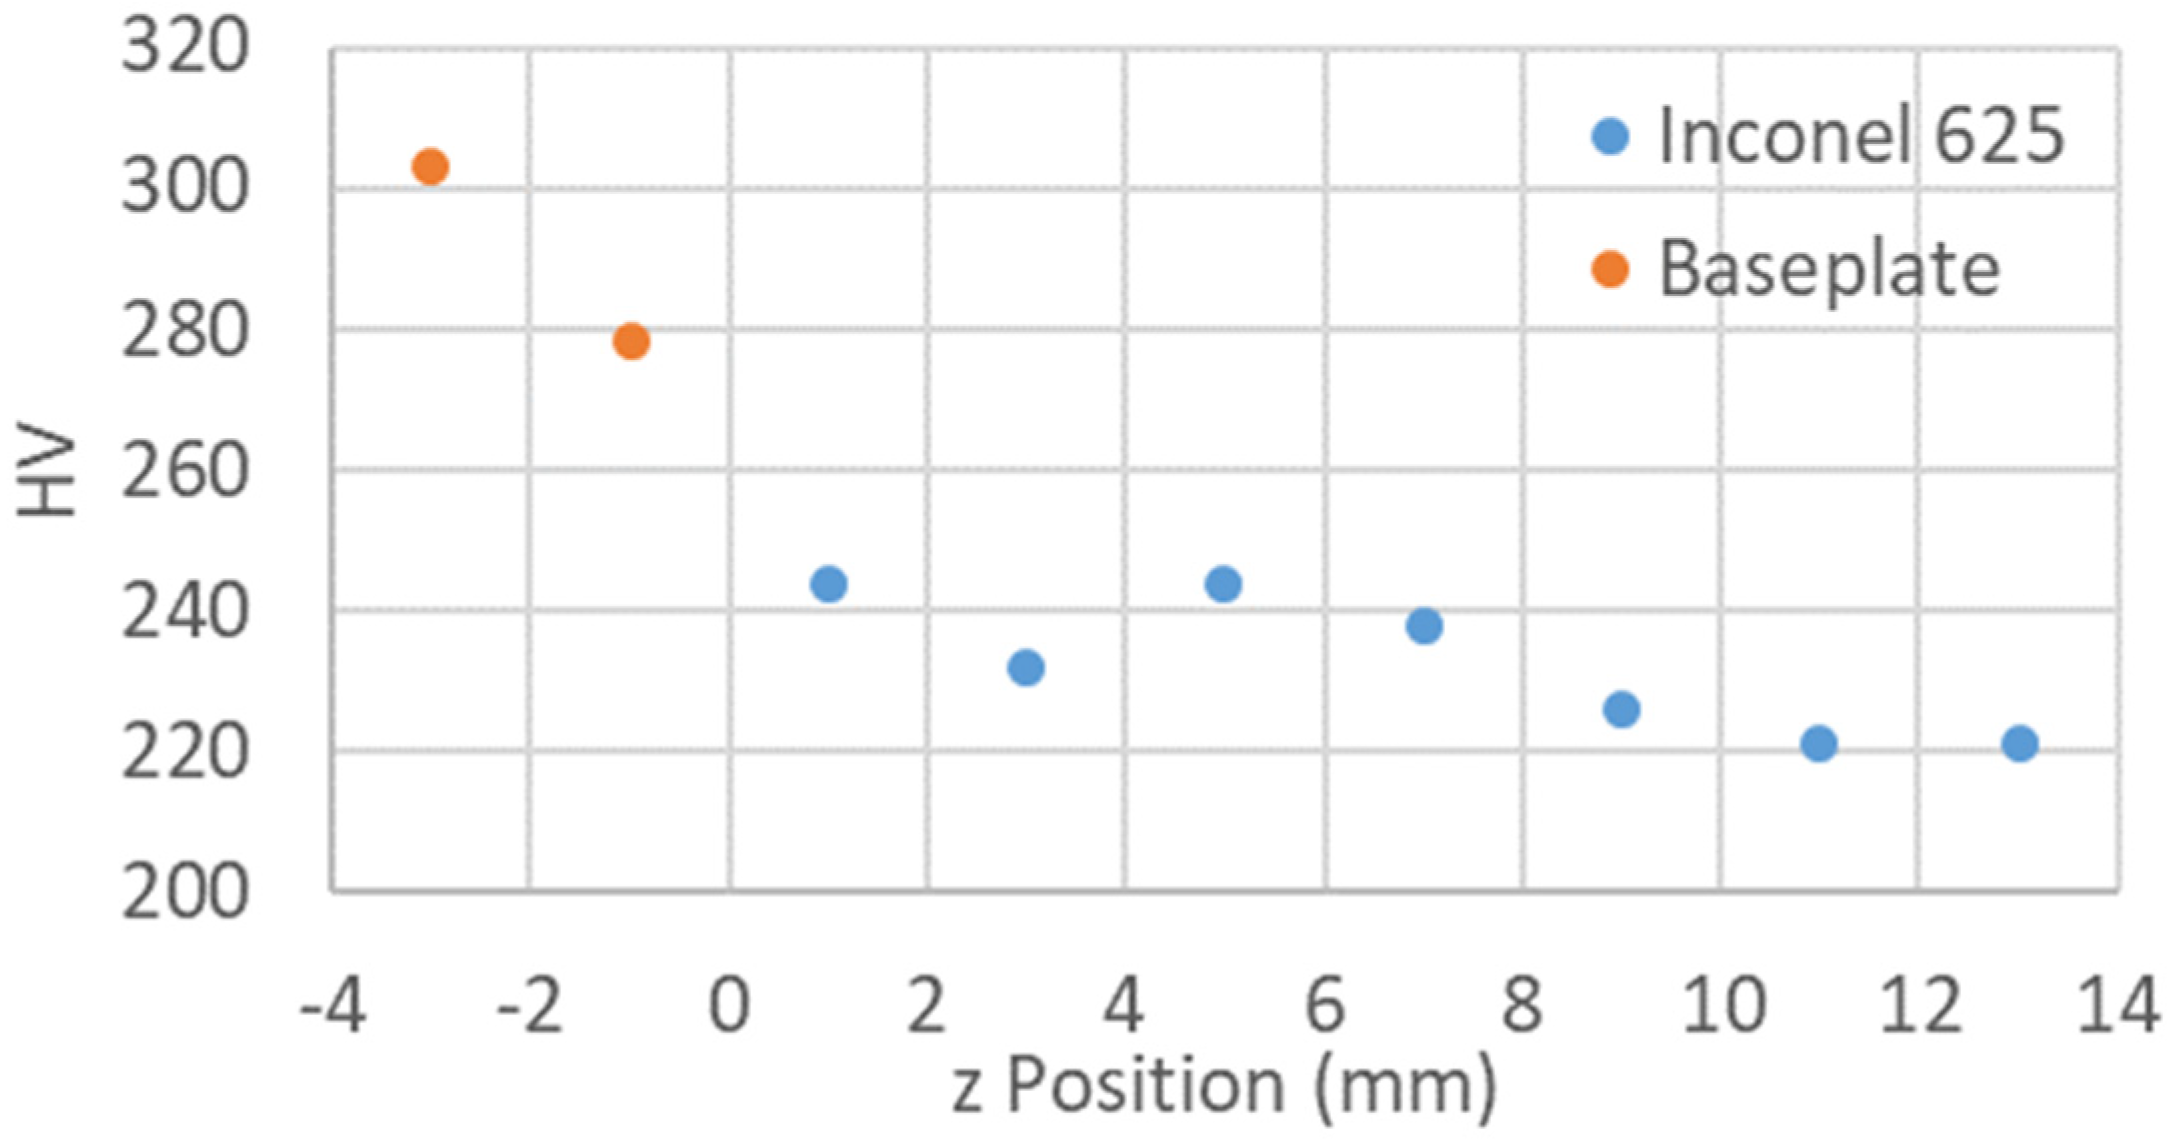
3.2. Tensile Testing and Hardness Results
3.3. Numerical Model Calibration
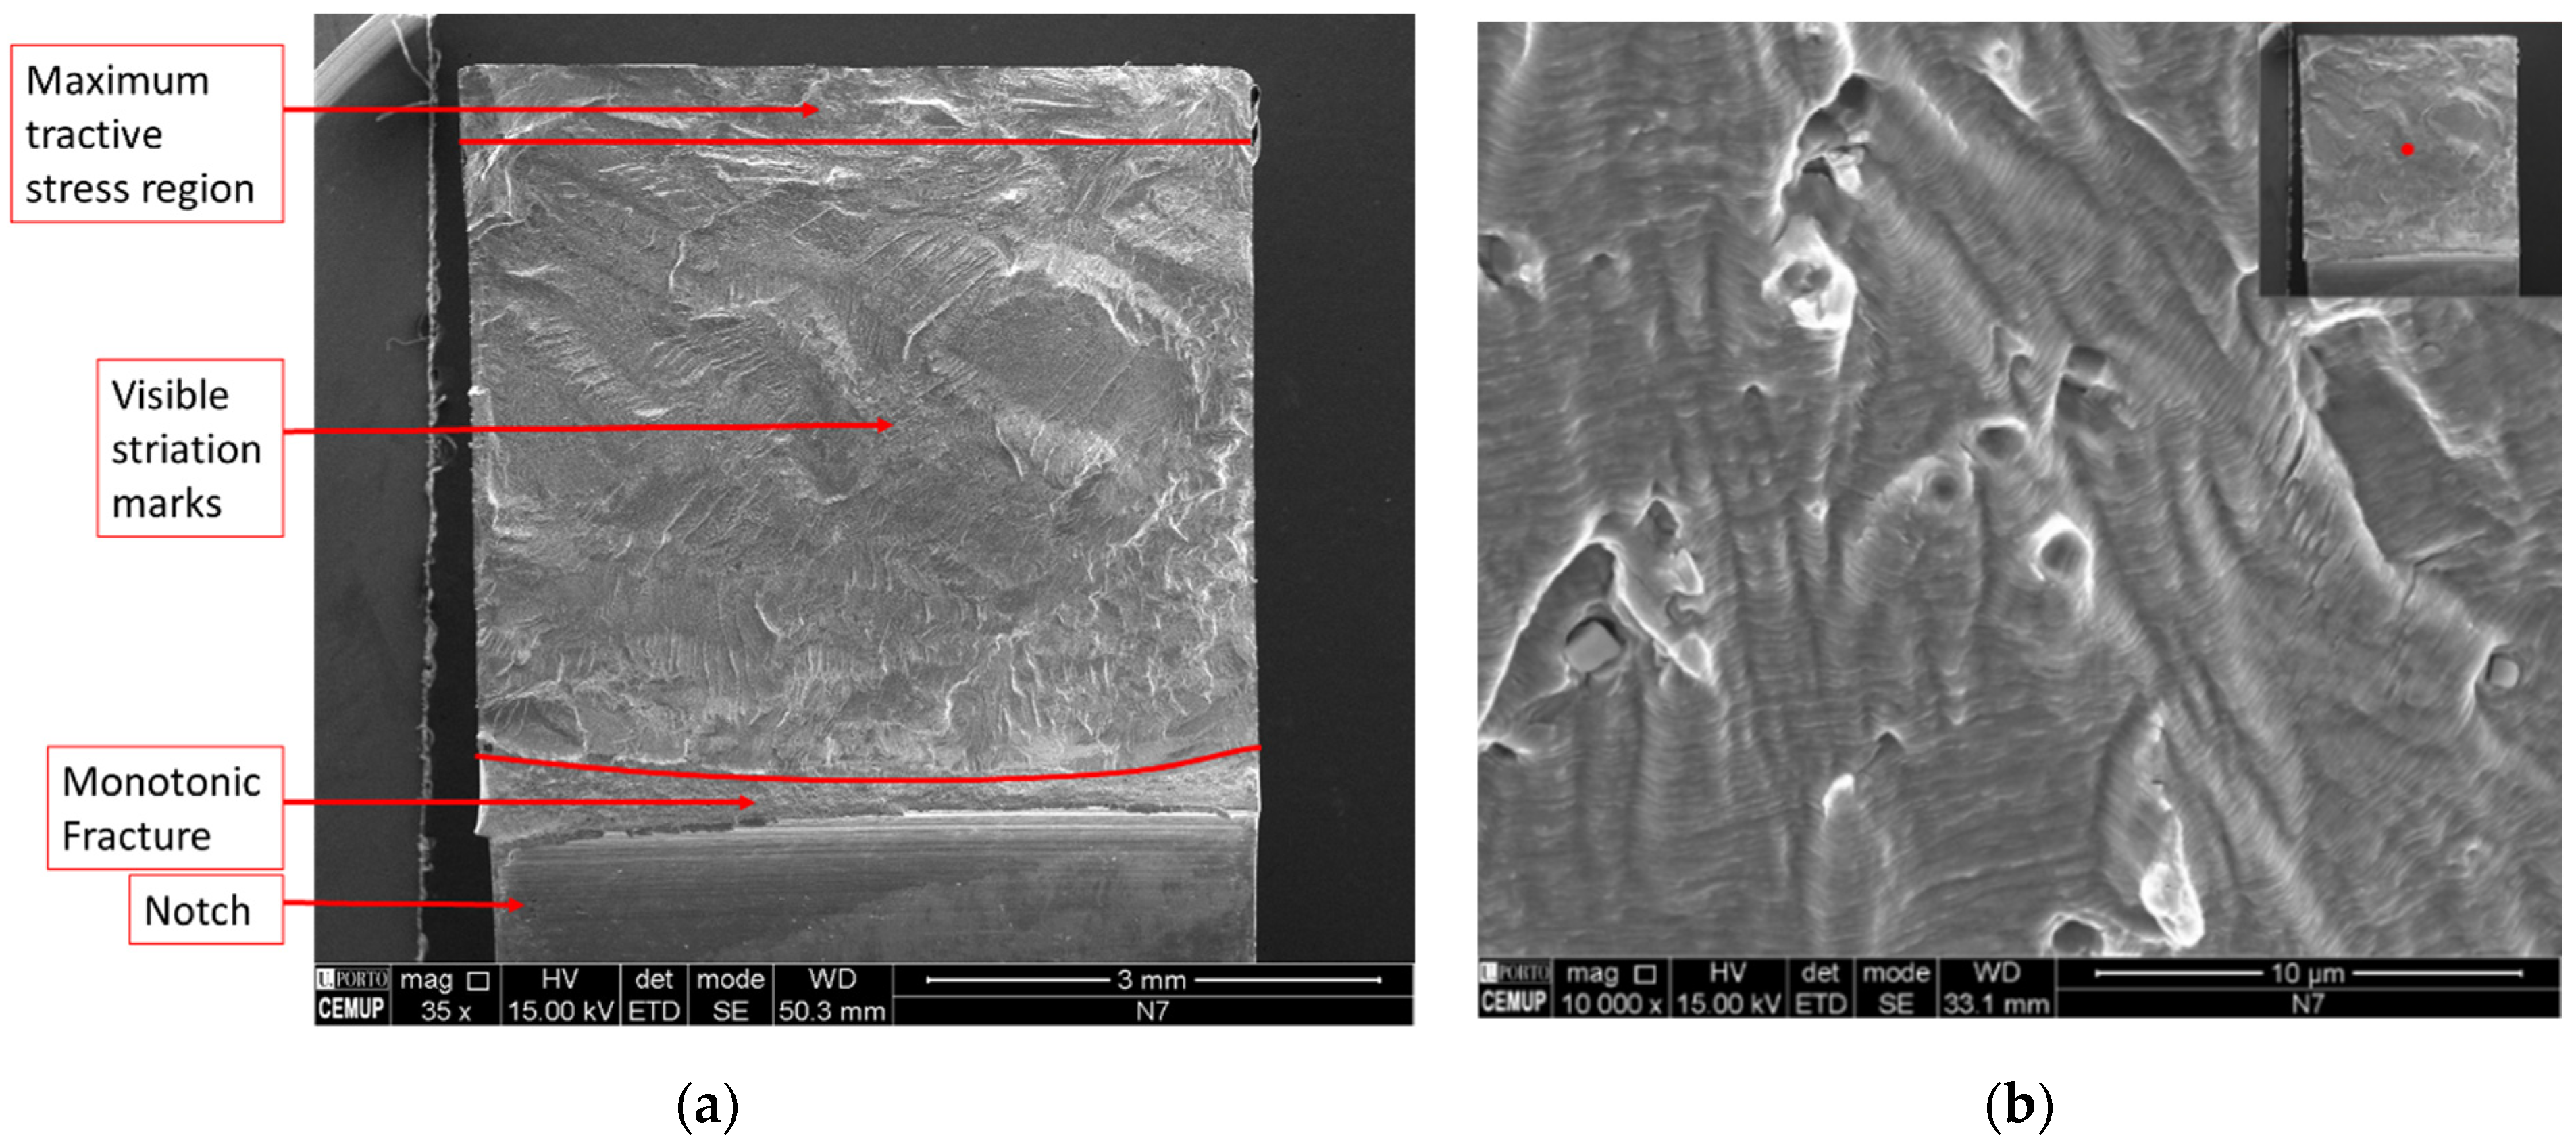
3.4. High-Cycle Fatigue Behaviour
4. Conclusions
Author Contributions
Funding
Conflicts of Interest
References
- Kumar, S. Additive Manufacturing Processes; Springer: North York, ON, Canada, 2020; pp. 1–2. [Google Scholar] [CrossRef]
- Ferreira, I.A. Fibre-Reinforced Thermoplastic Composite Parts Produced by Additive Manufacturing: A Comprehensive Characterization Study. Ph.D. Thesis, Faculdade de Engenharida da Universidade do Porto, Porto, Portugal, 2020. [Google Scholar]
- Prakash, K.S.; Nancharaih, T.; Rao, V.S. Additive Manufacturing Techniques in Manufacturing—An Overview. Mater. Today Proc. 2018, 5, 3873–3882. [Google Scholar] [CrossRef]
- Dehghan-Manshadi, A.; Bermingham, M.; Dargusch, M.; StJohn, D.; Qian, M. Metal injection moulding of titanium and titanium alloys: Challenges and recent development. Powder Technol. 2017, 319, 289–301. [Google Scholar] [CrossRef]
- Panjan, P.; Čekada, M.; Kirn, R.; Soković, M. Improvement of die-casting tools with duplex treatment. Surf. Coat. Technol. 2004, 180–181, 561–565. [Google Scholar] [CrossRef]
- Bourell, D.L.; Frazier, W.; Kuhn, H.; Seifi, M. Additive Manufacturing Processes; ASM International: Novelty, OH, USA, 2020. [Google Scholar] [CrossRef]
- Kim, M.J.; Saldana, C. Thin wall deposition of IN625 using directed energy deposition. J. Manuf. Process. 2020, 56, 1366–1373. [Google Scholar] [CrossRef]
- Rombouts, M.; Maes, G.; Mertens, M.; Hendrix, W. Laser metal deposition of Inconel 625: Microstructure and mechanical properties. J. Laser Appl. 2012, 24, 052007. [Google Scholar] [CrossRef]
- Dubiel, B.; Sieniawski, J. Precipitates in Additively Manufactured Inconel 625 Superalloy. Materials 2019, 12, 1144. [Google Scholar] [CrossRef] [PubMed]
- Dinda, G.; Dasgupta, A.; Mazumder, J. Laser aided direct metal deposition of Inconel 625 superalloy: Microstructural evolution and thermal stability. Mater. Sci. Eng. A 2009, 509, 98–104. [Google Scholar] [CrossRef]
- Nguejio, J.; Szmytka, F.; Hallais, S.; Tanguy, A.; Nardone, S.; Godino Martinez, M. Comparison of microstructure features and mechanical properties for additive manufactured and wrought nickel alloys 625. Mater. Sci. Eng. A 2019, 764, 138214. [Google Scholar] [CrossRef]
- Kim, K.-S.; Kang, T.-H.; Kassner, M.E.; Son, K.-T.; Lee, K.-A. High-temperature tensile and high cycle fatigue properties of inconel 625 alloy manufactured by laser powder bed fusion. Addit. Manuf. 2020, 35, 101377. [Google Scholar] [CrossRef]
- Pereira, F.G.L.; Lourenço, J.M.; Nascimento, R.M.D.; Castro, N.A. Fracture Behavior and Fatigue Performance of Inconel 625. Mater. Res. 2018, 21, 1–13. [Google Scholar] [CrossRef]
- Konečná, R.; Nicoletto, G.; Kunz, L.; Bača, A. Microstructure and directional fatigue behavior of Inconel 718 produced by selective laser melting. Procedia Struct. Integr. 2016, 2, 2381–2388. [Google Scholar] [CrossRef]
- Konečná, R.; Kunz, L.; Nicoletto, G.; Bača, A. Long fatigue crack growth in Inconel 718 produced by selective laser melting. Int. J. Fatigue 2016, 92, 499–506. [Google Scholar] [CrossRef]
- Nicoletto, G. Smooth and notch fatigue behavior of selectively laser melted Inconel 718 with as-built surfaces. Int. J. Fatigue 2019, 128, 105211. [Google Scholar] [CrossRef]
- Maciel, D.A. Fatigue Behaviour of Inconel 625 produced by Directed Energy Deposition. Master’s Thesis, Faculty of Engineering of the University of Porto, Porto, Portugal, 2020. [Google Scholar]
- Nicoletto, G. Anisotropic high cycle fatigue behavior of Ti–6Al–4V obtained by powder bed laser fusion. Int. J. Fatigue 2017, 94, 255–262. [Google Scholar] [CrossRef]
- ASTM, E466-21; Standard Practice for Conducting Force Controlled Constant Amplitude Axial Fatigue Tests of Metallic Materials. ASTM International: West Conshohocken, PA, USA, 2021.
- Smith, K.N.; Watson, P.; Topper, T.H. A stress-strain function for the fatigue of materials. J. Mater. 1970, 5, 767–778. [Google Scholar]
- ASTM, E8-21; Standard Test Methods for Tension Testing of Metallic Materials. ASTM International: West Conshohocken, PA, USA, 2021.
- Abela, A.E. High Cycle Fatigue of Additively Manufactured Inconel 625. Master’s Thesis, Georgia Institute of Technology, At-lanta, GA, USA, 2020. [Google Scholar]
- Anam, A. Microstructure and Mechanical Properties of Selective Laser Melted Superalloy Inconel 625. Ph.D. Thesis, University of Louisville, Louisville, KY, USA, 2019. [Google Scholar] [CrossRef][Green Version]
- Poulin, J.-R.; Kreitcberg, A.; Terriault, P.; Brailovski, V. Fatigue strength prediction of laser powder bed fusion processed Inconel 625 specimens with intentionally-seeded porosity: Feasibility study. Int. J. Fatigue 2019, 132, 105394. [Google Scholar] [CrossRef]
- Koutiri, I.; Pessard, E.; Peyre, P.; Amlou, O.; De Terris, T. Influence of SLM process parameters on the surface finish, porosity rate and fatigue behavior of as-built Inconel 625 parts. J. Mater. Process. Technol. 2018, 255, 536–546. [Google Scholar] [CrossRef]
- Avery, D.Z.; Rivera, O.G.; Mason, C.J.T.; Phillips, B.J.; Jordon, J.B.; Su, J.; Hardwick, N.; Allison, P.G. Fatigue Behavior of Solid-State Additive Manufactured Inconel 625. JOM 2018, 70, 2475–2484. [Google Scholar] [CrossRef]
- Kashaev, N.; Horstmann, M.; Ventzke, V.; Riekehr, S.; Huber, N. Comparative study of mechanical properties using standard and micro-specimens of base materials Inconel 625, Inconel 718 and Ti-6Al-4V. J. Mater. Res. Technol. 2013, 2, 43–47. [Google Scholar] [CrossRef]


| Hatch Spacing (mm) | Layer Thickness (mm) | Laser Spot Diameter (mm) | Laser Power (W) | Powder Feed Rate (g/min) |
|---|---|---|---|---|
| 1.8 | 1.7 | 2.5 | 1800 | 12 |
| Scanning Speed (mm/s) | Shield Gas Flow Rate (L/min) | Carrier Gas Flow Rate (L/min) | Shield Gas | Carrier Gas |
| 6 | 26 | 2.5 | Argon | Argon |
| Young Modulus (GPa) | Yield Stress, 0.2% (MPa) | Engineering Ultimate Tensile Strength (MPa) | True Ultimate Tensile Strength (MPa) |
|---|---|---|---|
| 190 | 496 | 810 | 1100 |
| Material | Young Modulus (GPa) | Deviation (%) | Yield Stress, 0.2% (MPa) | Deviation (%) | Ultimate Tensile Strength (MPa) | Deviation (%) |
|---|---|---|---|---|---|---|
| Present Work | 190 | - | 496 | - | 810 | - |
| Wrought [11] | 184 | 3 | 482 | 3 | 955 | −18 |
| SLM [11] | 245 | −29 | 652 | −31 | 925 | −14 |
| DED [11] | 223 | −17 | 723 | −46 | 1073 | −32 |
| Material | Elongation (%) | Deviation (%) | HV | Deviation (%) | - | - |
| Present Work | 37 | - | 232 | - | - | - |
| Wrought [11] | 41 | −11 | 260 | −12 | - | - |
| SLM [11] | 32 | 14 | 313 | −35 | - | - |
| DED [11] | 26 | 30 | 315 | −36 | - | - |
| Young Modulus of Gripping System (GPa) | Young Modulus of Specimen (GPa) | Bolt Pre-Load (kN) | Friction Coefficient | Bolt Nominal Diameter (mm) |
|---|---|---|---|---|
| 190 | 196 | 10 | 0.15 | 5 |
| Plastic Strain (%) | True Stress (MPa) |
|---|---|
| 0.00 | 496 |
| 0.29 | 505 |
| 0.49 | 513 |
| 0.99 | 532 |
| 1.79 | 551 |
| 7.49 | 665 |
| 29.69 | 1100 |
| Material | m | Δσc (MPa) | Δσc Deviation (%) |
|---|---|---|---|
| DED, machined (present work) | 8.85 | 692 | - |
| SLM, polished * [22] | 7.23 | 516 | −25.4 |
| SLM, polished [23] | 11.09 | 970 | 40.2 |
| SLM, polished * [24] | 17.15 | 884 | 27.7 |
| SLM, polished [25] | 2.27 | 358 | −48.3 |
| Solid state AM, polished [26] | 4.65 | 450 | −35.0 |
| Hot rolled, polished * [27] | 6.60 | 672 | −2.9 |
| Hot rolled and annealed, polished [13] | 4.07 | 464 | −32.9 |
Publisher’s Note: MDPI stays neutral with regard to jurisdictional claims in published maps and institutional affiliations. |
© 2022 by the authors. Licensee MDPI, Basel, Switzerland. This article is an open access article distributed under the terms and conditions of the Creative Commons Attribution (CC BY) license (https://creativecommons.org/licenses/by/4.0/).
Share and Cite
Klein Fiorentin, F.; Maciel, D.; Gil, J.; Figueiredo, M.; Berto, F.; de Jesus, A. Fatigue Assessment of Inconel 625 Produced by Directed Energy Deposition from Miniaturized Specimens. Metals 2022, 12, 156. https://doi.org/10.3390/met12010156
Klein Fiorentin F, Maciel D, Gil J, Figueiredo M, Berto F, de Jesus A. Fatigue Assessment of Inconel 625 Produced by Directed Energy Deposition from Miniaturized Specimens. Metals. 2022; 12(1):156. https://doi.org/10.3390/met12010156
Chicago/Turabian StyleKlein Fiorentin, Felipe, Duarte Maciel, Jorge Gil, Miguel Figueiredo, Filippo Berto, and Abílio de Jesus. 2022. "Fatigue Assessment of Inconel 625 Produced by Directed Energy Deposition from Miniaturized Specimens" Metals 12, no. 1: 156. https://doi.org/10.3390/met12010156
APA StyleKlein Fiorentin, F., Maciel, D., Gil, J., Figueiredo, M., Berto, F., & de Jesus, A. (2022). Fatigue Assessment of Inconel 625 Produced by Directed Energy Deposition from Miniaturized Specimens. Metals, 12(1), 156. https://doi.org/10.3390/met12010156