Article

Infrared Thermography for Investigation of Surface Quality in Dry Finish Turning of Ti6Al4V

by
Manuela De Maddis
1,
Vincenzo Lunetto
1,
Valentino Razza
2 and
Pasquale Russo Spena
1,*
1
Department of Management and Production Engineering, Politecnico di Torino, c.so Duca degli Abruzzi 24, 10129 Torino, Italy
2
Istituto Italiano di Tecnologia, Via Morego 30, 16163 Genova, Italy
*
Author to whom correspondence should be addressed.
Metals 2022, 12(1), 154; https://doi.org/10.3390/met12010154
Submission received: 10 October 2021 / Revised: 10 January 2022 / Accepted: 11 January 2022 / Published: 14 January 2022

Abstract

:
The machining of titanium alloys always raises issues because of their peculiar chemical and physical characteristics as compared to traditional steel or aluminum alloys. A proper selection of parameters and their monitoring during the cutting operation makes it possible to minimize the surface roughness and cutting force. In this experimental study, infrared thermography was used as a control parameter of the surface roughness of Ti6A4V in dry finish turning. An analysis of variance was carried out to determine the effect of the main cutting parameters (cutting speed and feed rate) on the surface roughness and cutting temperature. In the examined range of the machining parameters, cutting speed and feed were found to have a primary effect on the surface roughness of the machined parts. Cutting speed also significantly affected the temperature of the cutting region, while feed was of second order. Higher cutting speeds and intermediate feed values gave the best surface roughness. A regression analysis defined some models to relate the cutting temperature and surface roughness to the machining parameters. Infrared thermography demonstrated that the cutting temperature could be related to roughness.

1. Introduction

In recent years, dry machining has had an increasing role in cutting operations to cope with more severe environmental regulations and to reduce the costs of lubricant fluids. Therefore, many efforts have been made to improve machining conditions, and advanced cutting tool materials and optimized geometry have been designed to reduce friction at the cutting region and, hence, to prolong tool life and improve the surface roughness of parts. Titanium and its alloys are among the metals that suffer more from cutting conditions because of their peculiar physical, chemical, and thermal properties, including low elastic modulus, high chemical reactivity, and poor thermal conductivity [1,2]. These features badly affect chip removal operations since they reduce the surface quality of machined parts, limit production rates, and accelerate tool wear. For these reasons, abundant amounts of lubricant fluids are often used to machine Ti-alloyed components, and many studies have been focused on assessing the effects of lubrication conditions on machinability and, especially, on improving tool life and workpiece surface quality [3,4,5,6]. The major shortcomings of lubricant fluids are their harmful environmental impact, their potential health hazards for human operators (i.e., aerosols caused by liquid evaporations during the cutting process) [7], and their cost. Some studies have aimed at overcoming these issues by adopting different approaches [8,9,10,11,12] based on the following: (i) more environmentally friendly lubricants based on vegetable oils; (ii) minimum quantity lubrication (MQL) (i.e., the feeding of a properly metered amount of oil, as a liquid or spray, directly to the cutting region); (iii) cryogenic lubricants (e.g., liquid nitrogen, mixtures of air and oil); and (iv) dry machining.
Dry machining is surely the most eco-friendly and safe solution because it does not involve any sort of lubricant nor dangerous cryogenic means, and it also limits energy consumption. The main drawbacks of the complete absence of lubrication are the more limited tool life, cutting speed, feed, and feed rate as compared to traditional lubricant-based machining processes. In addition, the high temperatures that can be reached at the tool/workpiece interface have a harmful influence on the surface quality of machined parts; for instance, owing to excessive tool wear or metal oxidation. For these reasons, the dry machining of Ti6Al4V is normally a prerogative of finishing operations, which can allow the obtaining of proper surface roughness without lubricants through the use of coated tool inserts. Often, this is achieved with similar or even better results than under flood or mist environments [10].
During the cutting process, almost all the energy involved during the plastic deformation associated with the cutting phenomenon is dissipated as heat. In this regard, the primary shearing zone has the largest effect, whereas the secondary and tertiary shearing zones have a more limited influence. The friction between the tool and workpiece, and the chip and the tool rake/flank, also contribute to raising the temperature in the cutting region. The thermal effect has key importance in metal machining with tool life and surface quality, which depend essentially on the maximum temperature achieved in the cutting region. Several experimental and analytical methods have been used to determine cutting temperature [13,14,15] with approaches based on metallurgical methods [16,17], thermocouples embedded in cutting tools, and special powders [18], paints [19], and coatings [20]. In this regard, the real-time monitoring and assessment of cutting temperature through infrared thermography is a promising solution to automate machining and predict the surface quality of machined parts. This system uses thermal cameras to detect the temperature field generated during the cutting operation to evaluate the influence of machining parameters (such as cutting speed, feed, depth of cut, and tool geometry) on friction at the tool/workpiece interface, as well as on tool wear and surface roughness. A thermal camera measures the cutting temperature through the heat radiation emitted by the cutting region. Wide temperature ranges can be detected, from low (<30 °C) to high temperatures (up to 2000 °C), with elevated data acquisition up to thousands of Hz.
Infrared thermography has proven to be a useful tool to acquire further knowledge on the mechanical and thermal aspects involved in the cutting process, which is helpful in terms of controlling and optimizing the cutting performance and quality of the final part [21,22]. Moreover, studies [23,24,25] have also demonstrated the usefulness of thermography in monitoring indirectly tool wear, finding relationships between tool wear and the temperature reached in the cutting region. Based on thermographic data and neural networks, the degree of wear during a turning process can be assessed and classified automatically [24]. Moreover, a similar tool could support the operator in the context of Industry 4.0 and collaborative design [26,27], and even inexperienced operators to predict possible issues during cutting processes. Few works have attempted to use infrared thermography as a tool for predicting surface roughness [25].
In this preliminary study, the influence of cutting speed and feed on the cutting temperature and roughness of the machined parts was evaluated. An infrared thermography technique was used to assess the maximum cutting temperature and its relationship with the surface roughness of Ti6Al4V cylindrical parts in dry finish turning at varying cutting speeds and feed levels. In that way, the monitoring of the maximum temperature could be used to predict the surface roughness of the machined part and to prevent improper cutting conditions such as those caused by excessive tool wear.

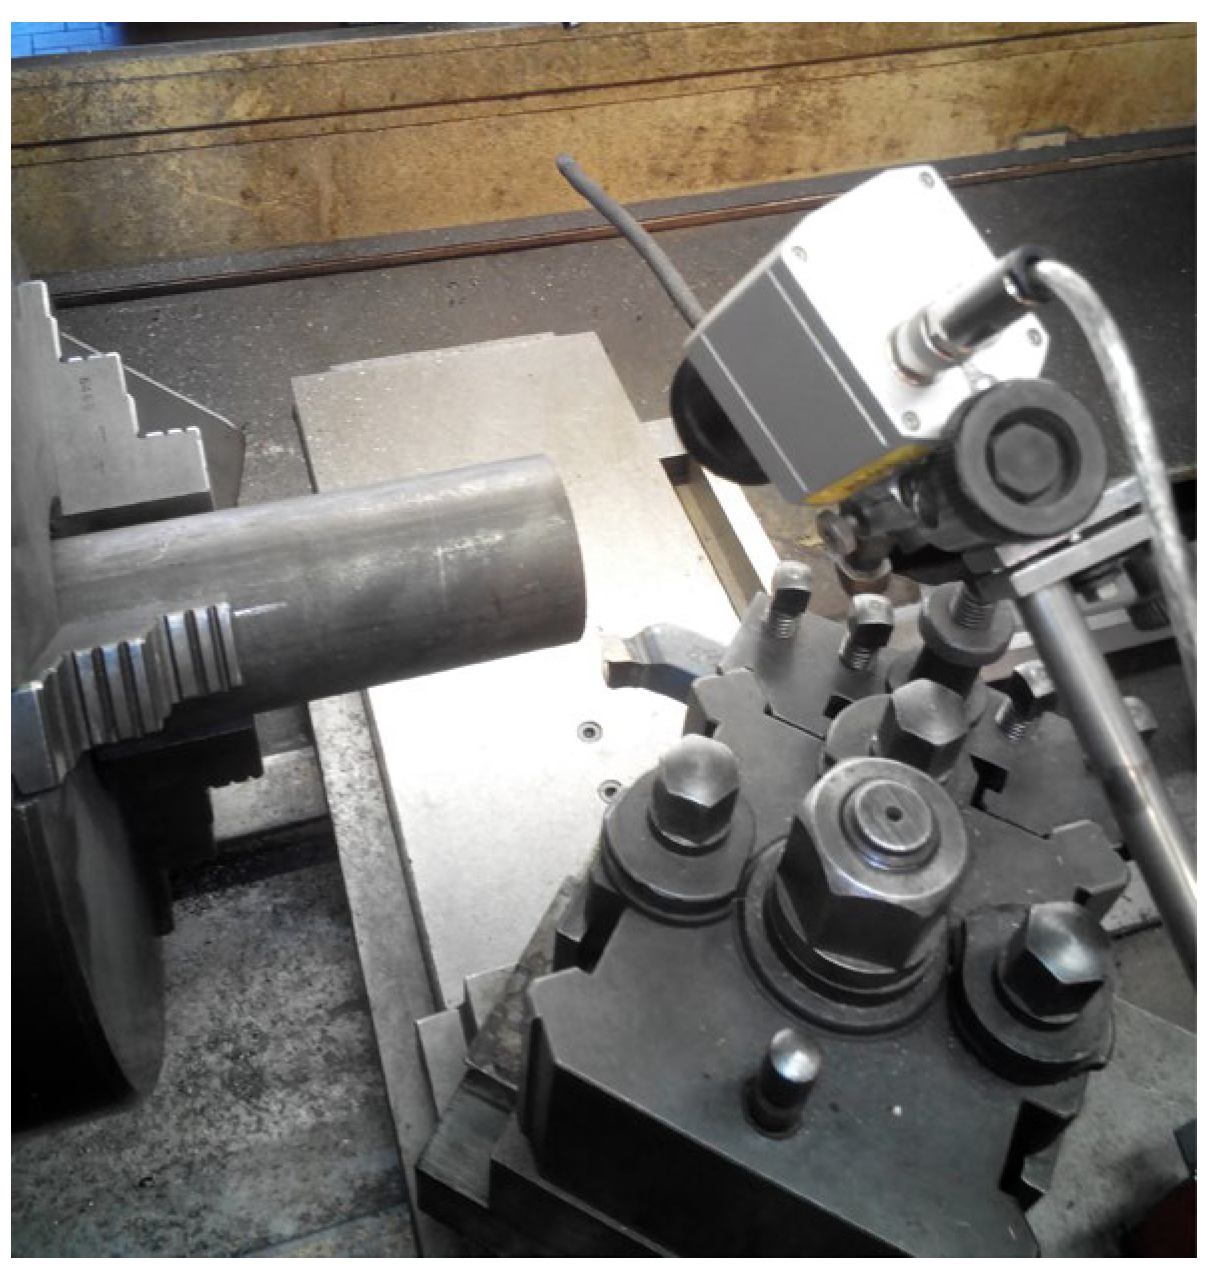
2. Materials and Methods

A commercial Ti6Al4V alloy was selected as the work material for the experimental test. Table 1 reports the nominal chemical composition of the Ti6Al4V alloy, whereas its main mechanical properties are listed in Table 2.
Dry finish turning cutting tests of Ti6Al4V were carried out on cylindrical bars with a diameter of 45.5 mm using an industrial lathe. The cutting length was kept the same for all the experimental runs. The cutting speed and feed were selected as machining parameters to assess their effects on cutting temperature and surface roughness. Based on a series of preliminary experiments, the adopted cutting speed ranged from 15 to 34 m/min, and the feed ranged from 0.03 to 0.065 mm/rev. The depth of cut was kept constant at 0.5 mm for all the experimental runs because this parameter is known to be less influential than the other parameters. A total of 12 experiments were carried out according to the design of Table 3 to determine the influence of the cutting parameters on the surface roughness of the machined part, and then to relate the maximum temperature of the cutting region to roughness. The machining settings (ranges of cutting speed 15–34 m/min, feed 0.03–0.1 mm/rev) used in this study cover the possible range of the dry turning of the Ti6Al4V alloy. The highest cutting speeds and feed values were characterized by significant tool wear.
The cutting tools used in the experimental tests were the Sandvik Coromant mod. Corturn 107 (ISO VBMT 11 03 02-MF 1125) with PVD (Ti,Al)N + (Al,Cr)2O3 coated carbide, Figure 1. This tool combines a good abrasive wear resistance and toughness for the dry finish turning of titanium alloys. New inserts were used in all the 12 experimental runs under a dry cutting environment to make negligible the influence of tool wear on the cutting temperature and surface roughness and, hence, to enable a comparison among the samples machined at different cutting conditions. Each experimental run was repeated three times to ensure consistent results.
An IRtech mod. Radiamatic TImage Mk5 infrared (IR) thermal camera was used to measure the temperature field at the cutting region. The thermal camera was equipped with a thermal uncooled microbolometer sensor (focal plane array, FPA) with a 25 μm × 25 μm size. The noise equivalent temperature difference (NETD) was 0.08 °C, while the spectral range of detection was in the 7.5–13 μm interval. The frame rate of the thermal camera was 120 Hz and the resolution of the detector was 160 pixels × 120 pixels. The camera was equipped with a lens operating from 150 to 900 °C. The thermal camera was located close to the cutting region, as illustrated in Figure 2. The temperature field was recorded in steady-state condition to avoid transient temperature timespan at the beginning and the end of the cutting operation.
The emissivity of the Ti6Al4V alloy was required to measure the temperature of the workpiece during the machining experiments. It was evaluated from room temperature to about 500 °C through a laboratory test. This test consisted of placing some pieces of a sheet of Ti6Al4V over a controlled burning flame at varying intensities (the radiant source was completely covered by the sheets) and distances to heat the sheets at different temperatures. On the other side of the sheets were placed two thermocouples to measure temperature and the camera to detect the thermal emission of the sheets. The emissivity was computed by matching the temperature field detected from the thermal camera to the temperature detected by the thermocouples. The laboratory tests showed that the emissivity of titanium alloys remained constant at 0.31 without an appreciable variation from room temperature to about 500 °C (i.e., it varied by ±0.1 with an unclear trend in this range). This result is coherent with previous works that have determined no variations of titanium emissivity (a consistent range of 0.30–0.35) from room temperature to about 800 °C [29,30,31,32].
For a given temperature measured by the thermocouples, the emissivity test was repeated three times. For all the replications, ±10 °C was the maximum temperature deviation measured by the thermal camera. Both the temperature and the humidity of the environment were measured at the beginning of the experiment and assumed to be constant throughout the test campaign. The reflected temperature was determined using the reflector method recommended by the ISO 18434-1 standard.
The surface roughness on the machined samples was evaluated as the average mean height of the surface profile (Ra) using a stylus profilometer. Roughness measurements were performed on metal surfaces obtained from three distinct tests performed for the same cutting condition and then averaged for each experimental run.
An analysis of variance (ANOVA) was performed to assess the statistical significance of the cutting speed and feed rate, and their influence on the maximum temperature reached during dry turning and on the surface roughness of the machined parts. The statistical significance of the machining parameters could be evaluated through either the F test or the p-value test. In this ANOVA, the p-value was set at 0.05 to give a statistical significance at a 95% confidence level. Finally, a relationship between the maximum temperature of the cutting region and the surface roughness of the machined part was figured out at varying cutting conditions.

3. Results and Discussion

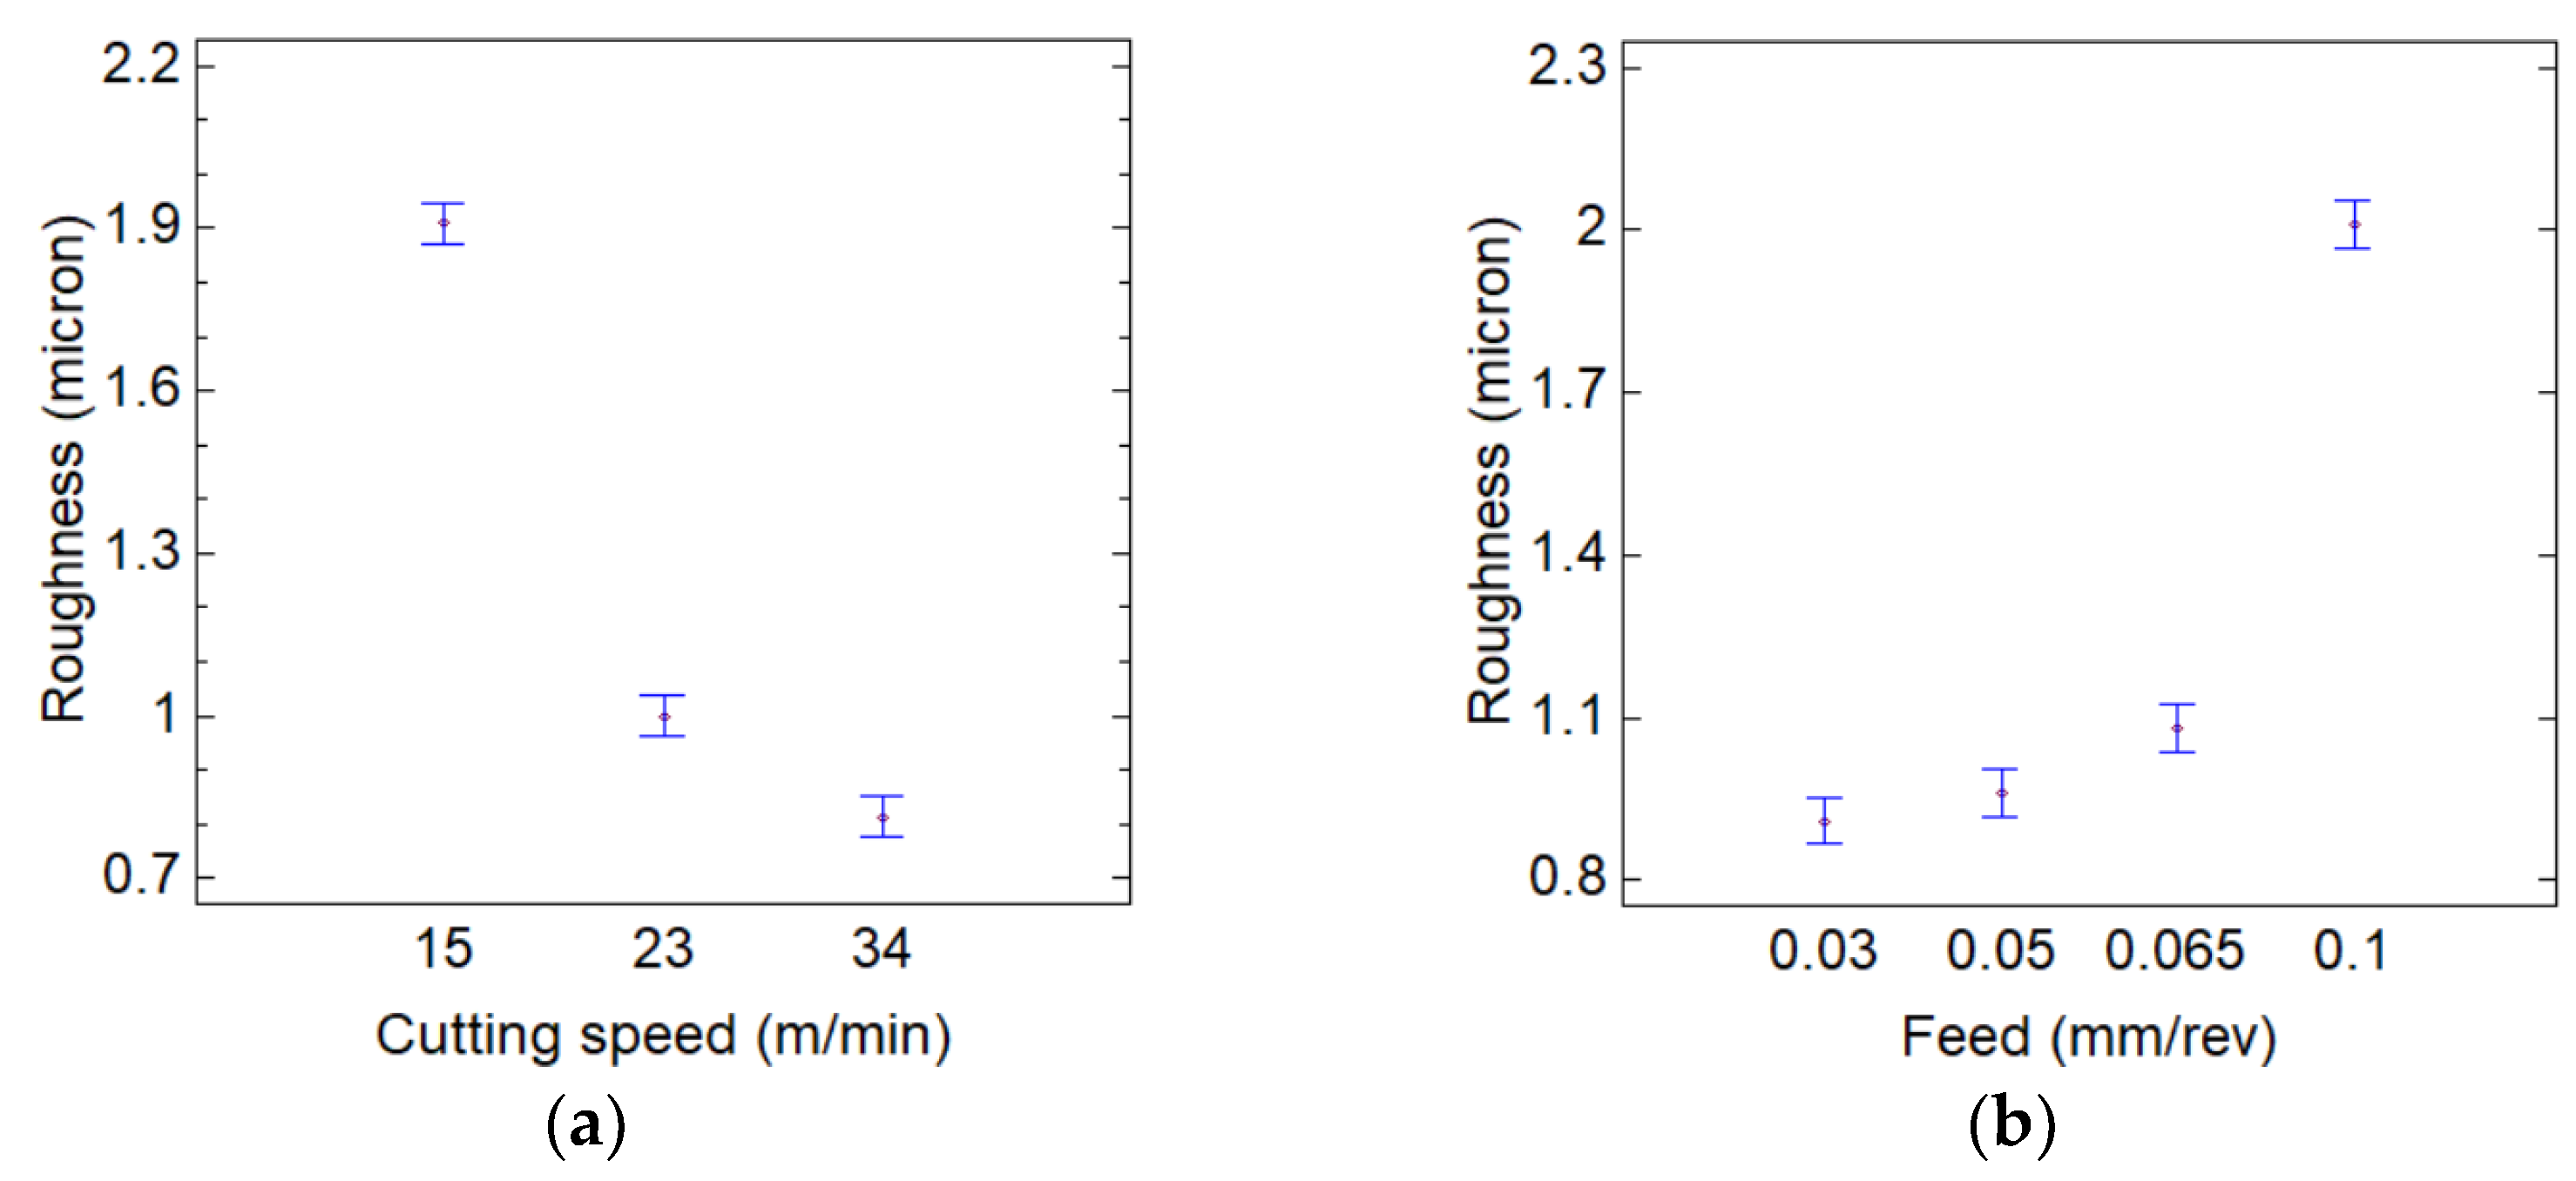
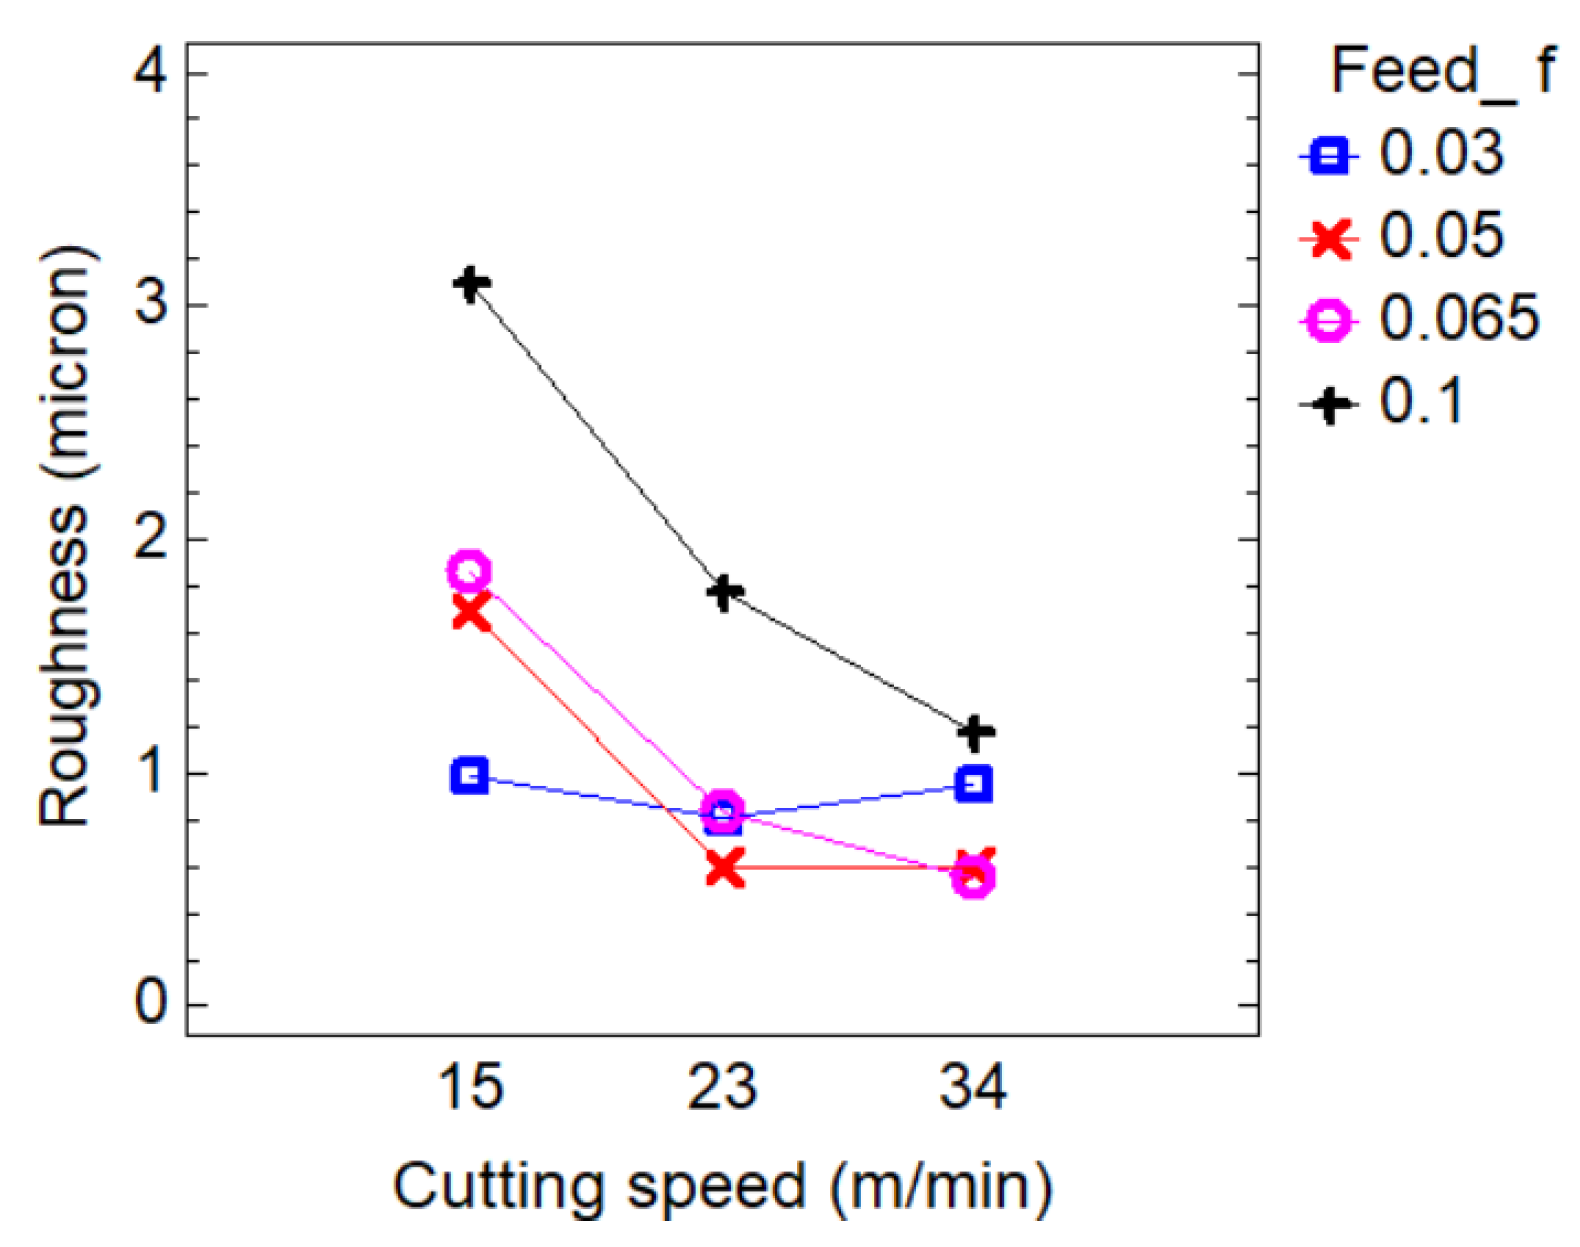
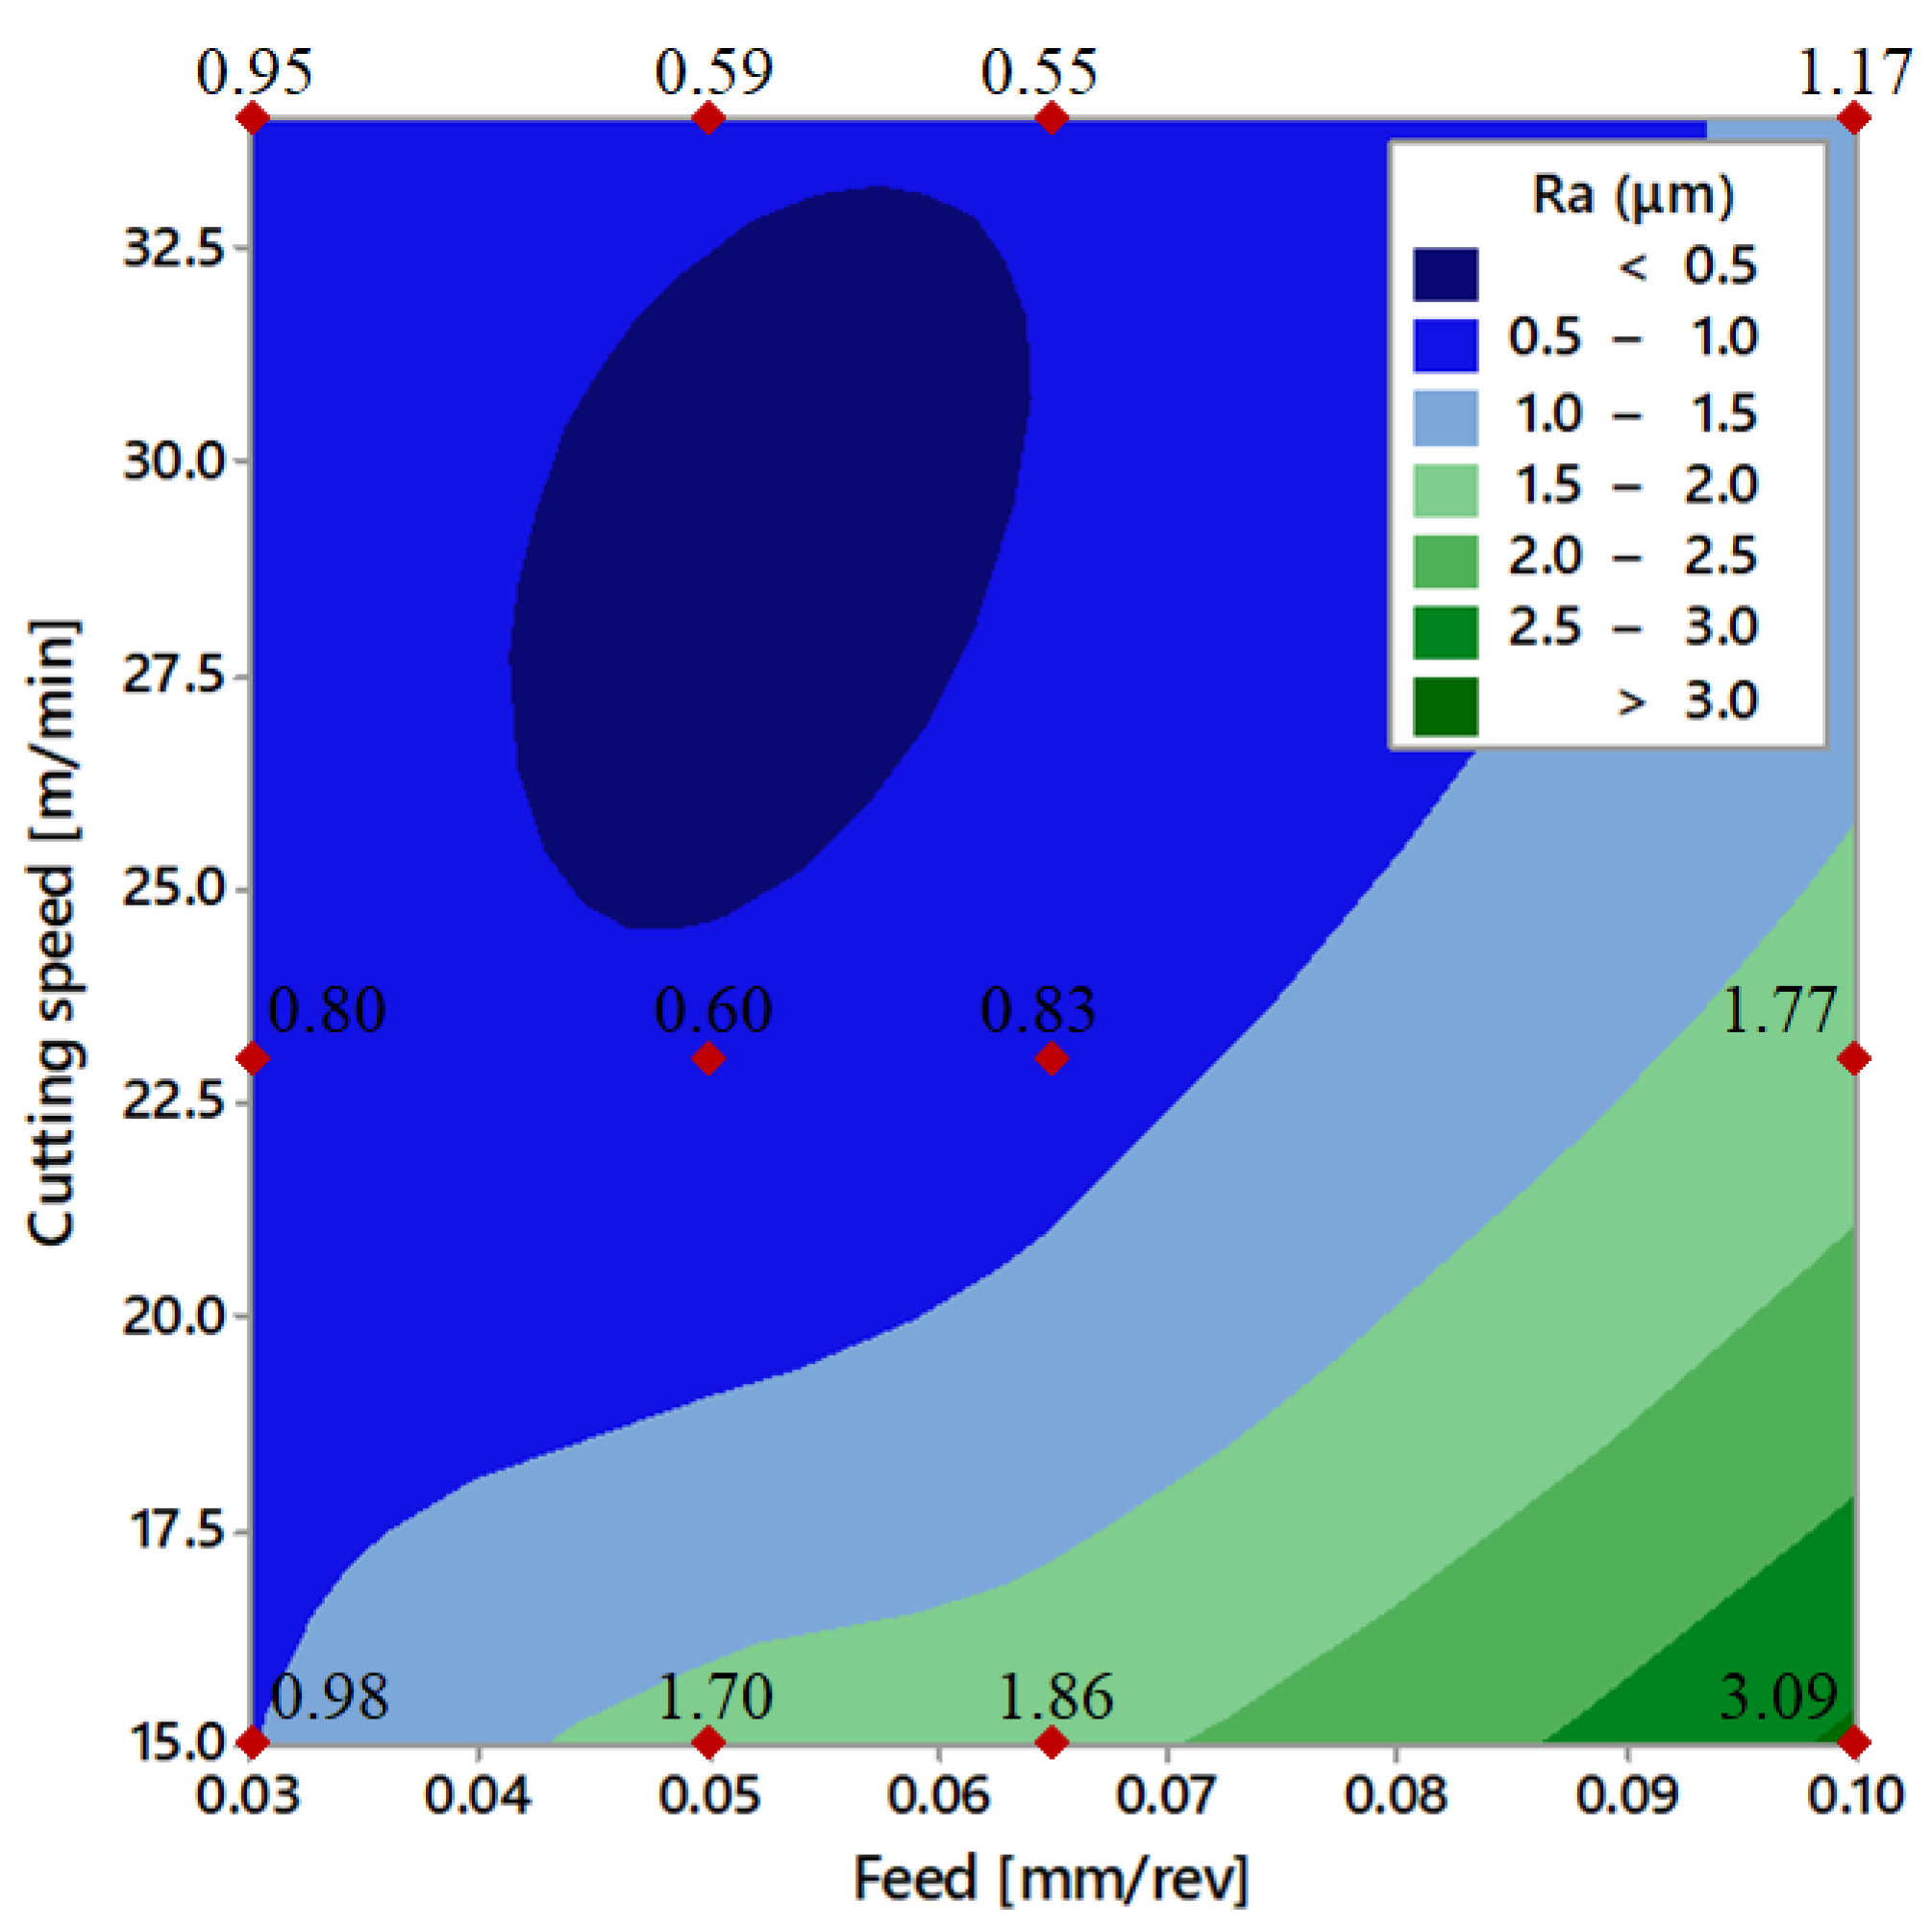
3.1. Effect of the Cutting Parameters on Surface Roughness

The surface finish is a key factor in machining operations. It can influence the machining cost and the mechanical performance of the part, especially under dynamic loading conditions (i.e., fatigue). Table 4 reports the average values of roughness obtained with the experimental dry finish turning settings and the corresponding uncertainty computed as the “maximum deviation” (reported in the table as “±the maximum deviation”) between three replications and the average value for a given set of process parameters. The surface roughness was in the range of 0.55–3.09 μm. The authors did not find an influence of surface roughness on emissivity in such a narrow range of roughness values.
The results of the ANOVA analysis for the surface roughness are reported in Table 5. The ANOVA on the raw data shows that the cutting speed and feed were statistically significant (p-value < 0.0001) for the surface roughness. Both the cutting speed and feed had a strong influence on this feature with a contribution (i.e., how much of the roughness was caused by an individual cutting parameter) of 44.1% and 38.9%, respectively. It can be observed that the combined effect of the cutting speed and feed also contributed (15.5%) to the roughness of the machined parts.
Since the ANOVA analysis only provides the statistical significance of an input parameter but does not determine how it influences the response, the mean responses of the cutting temperature and roughness values were computed to determine the influence of these factors for the design of the experiment of Table 3. The means of the raw data were computed by averaging the roughness and temperature values. The cutting parameters that showed large differences in the temperature and roughness values identified a considerable influence as their levels had changed. Figure 3a,b shows the means plots that depict the variation of surface roughness against cutting speed and feed at varying testing conditions. It can be noticed that increasing the cutting speed resulted in decreased surface roughness, Figure 3a. This effect has been attributed by many authors [25,33,34,35,36,37] to the formation of a build-up edge at the tool tip when machining at a low cutting speed. In such conditions, there is a major tendency towards adhesion between the chip and the tool tip. At higher cutting speeds, the cutting temperature increases, thus reducing the tendency to the build-up edge. Other studies have also suggested that the increase in temperature makes the metal softer and, hence, easier to cut [33,34]. Based on other studies [38,39,40], the amount of the adhered workpiece material decreases with increasing cutting temperatures, thus weakening the friction between the tool surface and the chip. The thermal softening reduces the workpiece strength. Both of these aspects result in a decrease in the cutting force. The decreasing cutting force leads to smaller tool vibrations, thus improving surface roughness.
The surface roughness deteriorated with the increasing of the feed, Figure 3b. The surface roughness changed significantly when the feed was 0.1 mm, whereas its variation was affected little at low feed values. This result is consistent with the conclusions of Pervaiz et al. [10] and Azizi et al. [35]. Azizi et al. stated that the surface roughness increases with the increasing of the feed, and surface roughness is very low at medium cutting speeds. As the feed increases, the thickness of the non-deformed chip increases. This causes an increase in vibration in the cutting tool and consequently negatively affects the surface quality of the workpiece. Akkus et al. [41] also found that feed is an effective parameter for surface roughness since it influenced the vibration of the tool during the cutting of Ti6Al4V alloy. The interaction plot in Figure 4 shows that the combined effect between the cutting speed and feed occurred at the highest value of the feed, 0.1 mm/rev, while it was negligible or absent for the lower values.
The response surface model was used to determine how changes in variables affect the response of interest. A two-order response surface regression equation in uncoded units, which interprets the coefficients using the natural units of each variable, was used to relate the surface roughness of the machined parts to the cutting parameters, as follows:
Ra (μm) = 3.551 − 0.2274 v + 8.49 f + 0.005097 v2 + 295.5 f2 − 1.305 v f
where v is the cutting speed (m/min) and f the feed (mm/rev). The coefficient of determination (R-squared), which is a statistical measure of how close the data are to the fitted regression line, was 96.2%. This equation was only valid within the process parameter ranges of Table 3; outside this range, the corresponding results were not supported by experimental data. The corresponding contour plot is shown in Figure 5 to point out the dependency of the surface roughness on cutting speed and feed. The graph confirms that better roughness values could be obtained with intermediate feed, while larger cutting speeds were required at increasing feed values. This result is consistent with previous studies on the dry machining of titanium alloys. According to Sun et al. [38], the tool nose curvature did not participate completely in cutting for a low feed rate of 0.05 mm/rev. Thus, the surface roughness initially decreased from about 1.1 to 0.9 μm (cutting speed of 60 m/min and cutting depth of 1 mm) with the feed rate increasing from 0.05 to 0.065 mm/rev. For higher feed, the high tool wear was considered to be the main cause for higher roughness values, with a roughness of about 1.4 μm at 0.1 mm/rev. Similar results have also been found in [42,43].

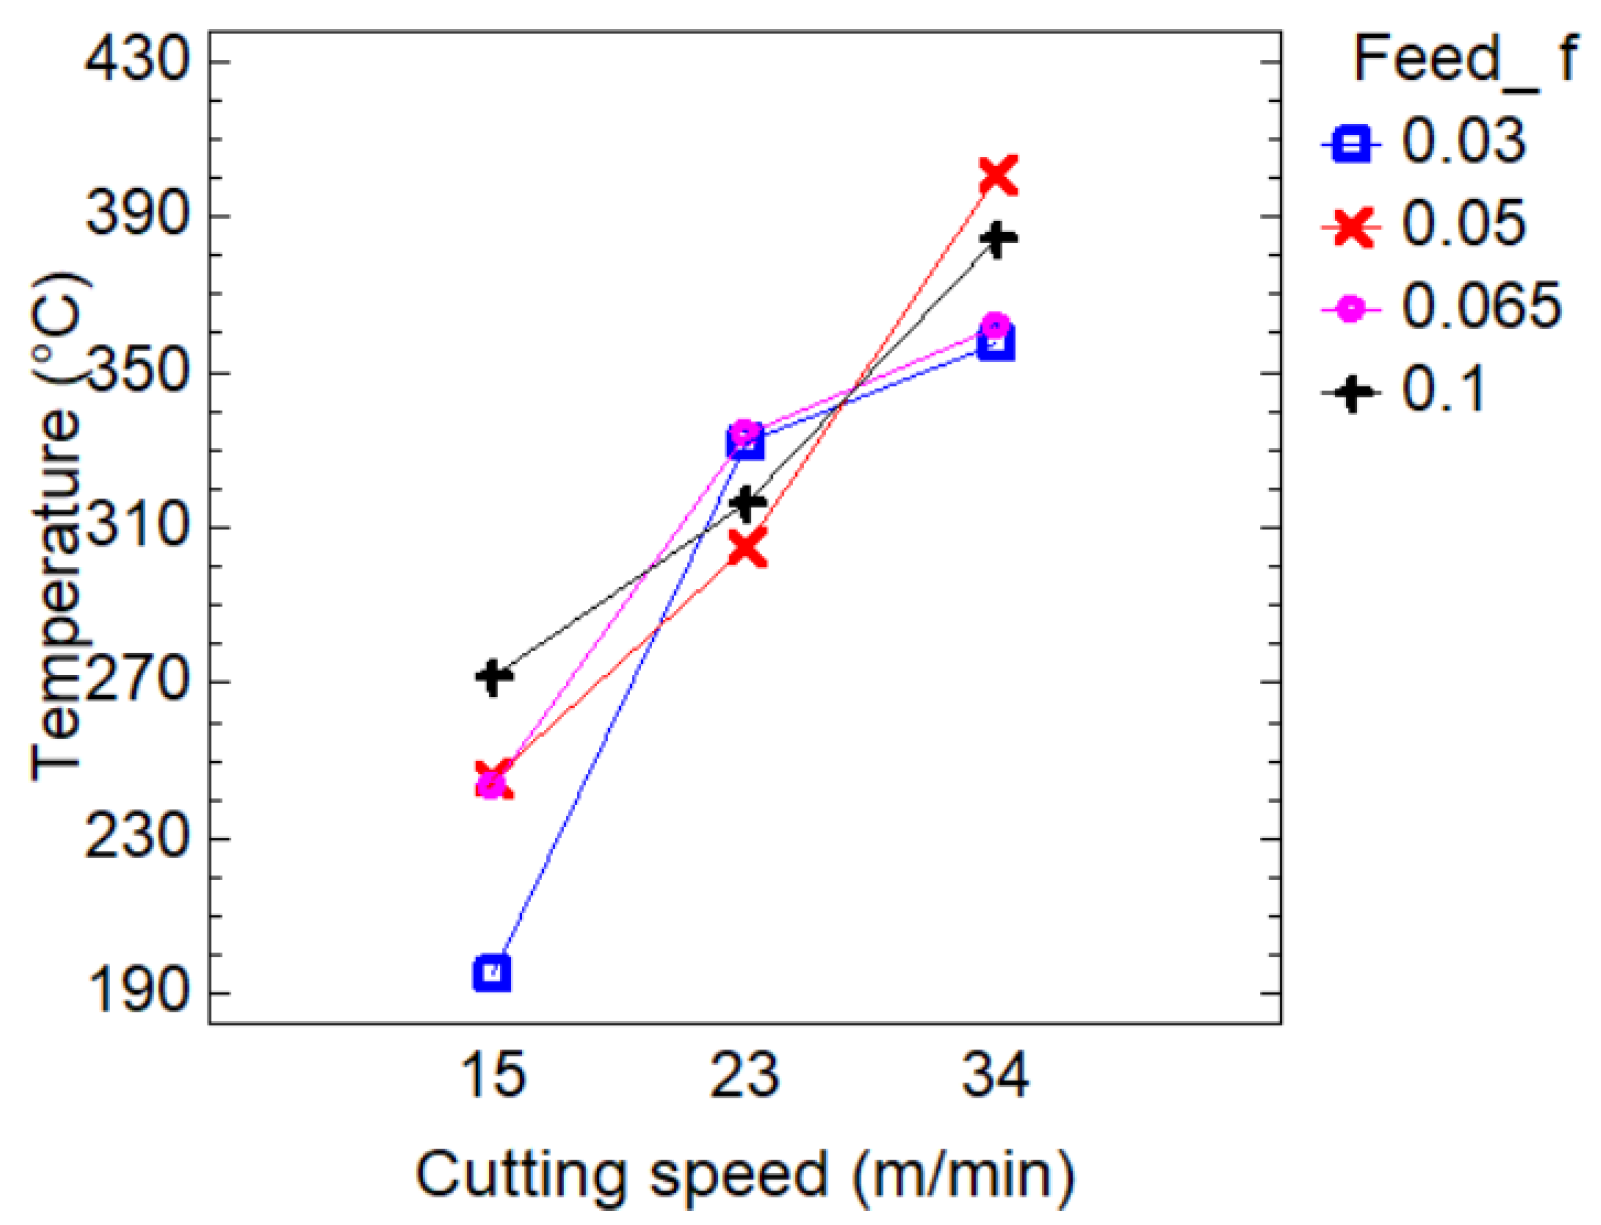
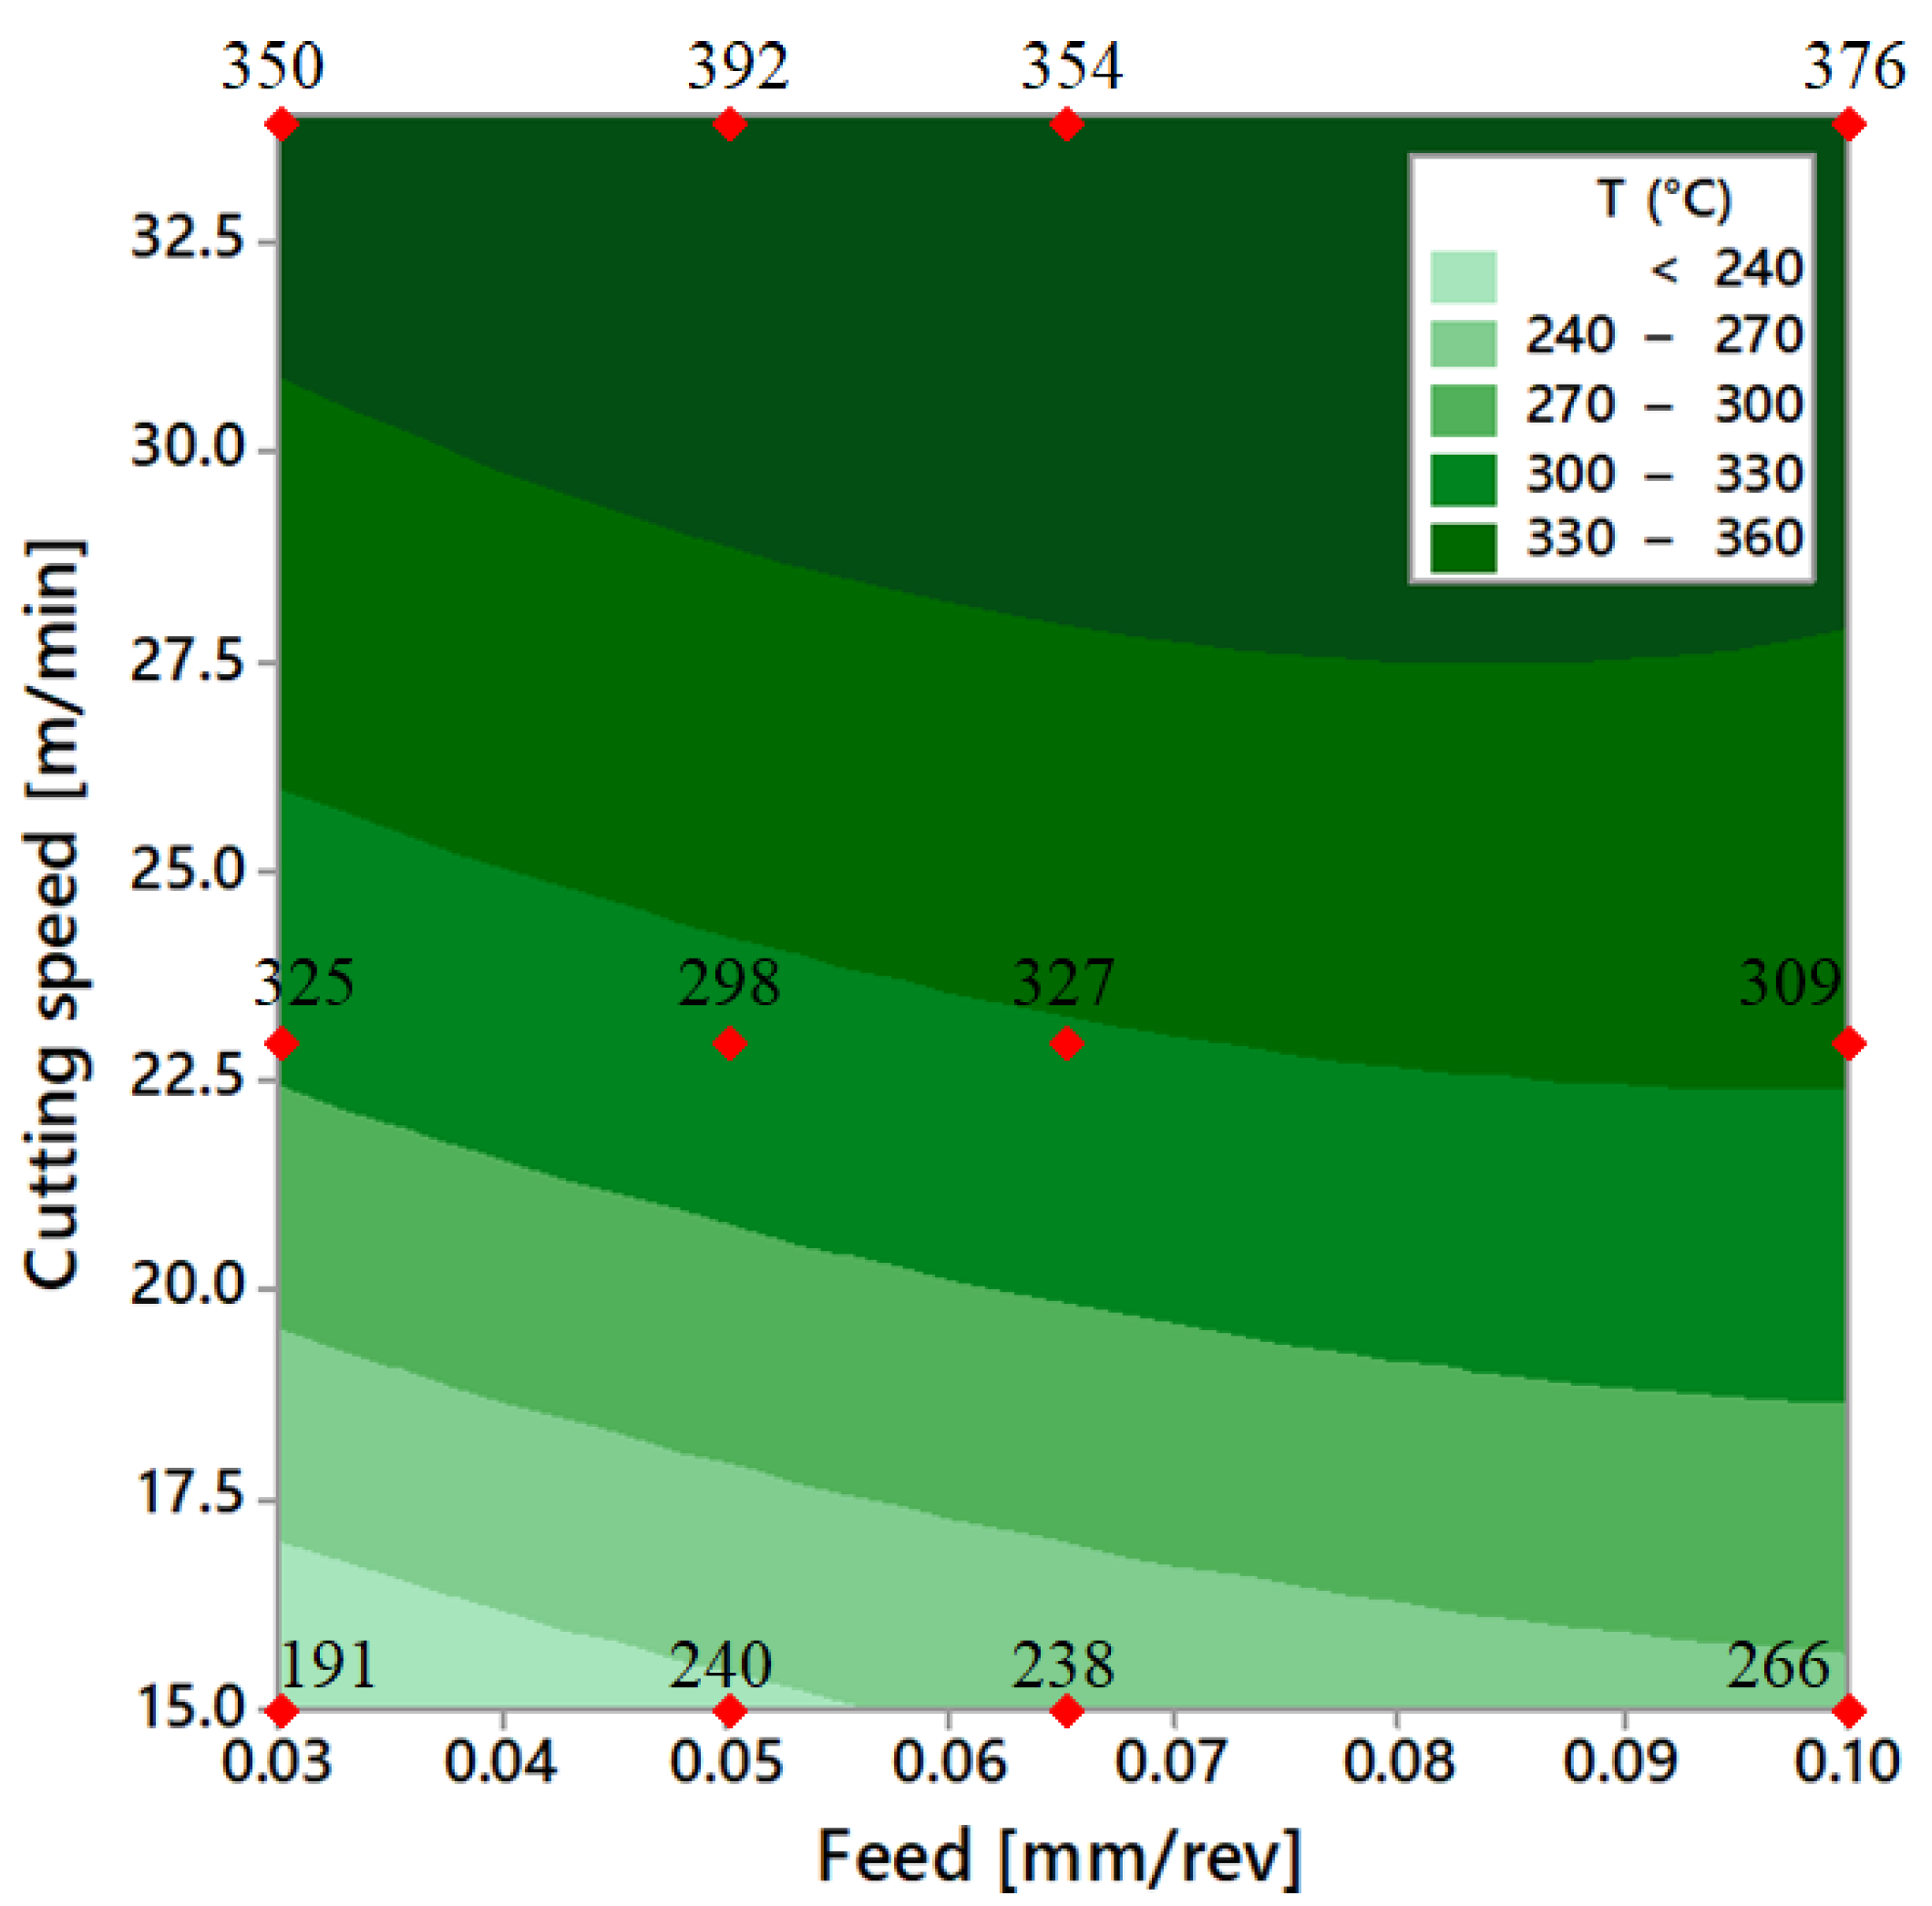
3.2. Effect of the Cutting Parameters on Temperature

Figure 6 shows the typical thermographic image of the tool and workpiece captured during dry turning. The formation of the chip did not allow the accurate measurement of the temperature of the tool–workpiece interface since it either covered that region and/or altered the local emissivity. In the latter case, the heat dissipated by the chip caused an emission of light, which was reflected on the workpiece surface. This gave rise to a noise, which was an unreal increase in temperature in the region where the light had been reflected, with an ensuing incorrect thermal map. These artifacts were difficult to eliminate in the post-processing phase; often, they could not be eliminated at all. In line with the approach taken in similar studies, to overcome these issues, the maximum temperature was evaluated as the temperature on the workpiece surface closest to the tool/workpiece interface (less than 0.5 mm of distance). An oval-shaped region of interest (ROI) was placed on the workpiece, including both the cutting region (hotspot) and part of the uncut workpiece, Figure 6. As soon as the chip detached from the workpiece, the maximum temperature was measured in the ROI. The temporary absence of the metal chip made it possible to avoid its light reflection, thus minimizing the effect of reflected temperature. The maximum temperature measured in the cutting region at varying machining conditions is reported in Table 4, with the corresponding uncertainty computed as the “maximum deviation” (reported in the table as “±the maximum deviation”) between three replications and the average value for a given set of process parameters.
The results of the ANOVA and the contributions of cutting speed and feed for the temperature are reported in Table 6. Both the process parameters were found to be statistically significant, with the cutting speed being the main parameter influencing temperature (84.9%). The contribution of the feed was very limited (2.6%) for the examined setting levels and less than the combined effect of the cutting speed and feed (6.7%).
The influences of cutting speed and feed on surface roughness of Ti6Al4V parts were determined through means plots, Figure 7. An increase in the cutting speed significantly increased the temperature from about 240 to 380 °C. Coherently with the contribution computed by the ANOVA, the effect of feed on temperature was much more limited. When the feed varied from 0.03 to 0.05 mm/rev, the increase in temperature was about 20 °C on average. At higher feed values, the temperature did not change appreciably. Figure 8 shows that there was always an interaction between the cutting speed and feed for the cutting temperature at varying factor levels. The combined effect was more evident at the lowest cutting speed, 15 m/min, with a temperature that increased from about 190 °C to 270 °C when the feed increased from 0.03 to 0.1 mm/rev.
The response surface regression equation in uncoded units, which relates the maximum cutting temperature with the machining parameters, was as follows:
T (°C) = −112.4 + 23.26 v + 2093 f − 0.2830 v2 − 6599 f2 − 35.7 v f
In this case, the coefficient of determination (R-squared) was 89.3%. This equation was only valid within the process parameter ranges of Table 3; outside this range, the corresponding results were not supported by experimental data. The effect of cutting speed and feed on the temperature can be pointed out through the contour plots of Figure 9. As expected, lower temperature values could be obtained when machining with the lower cutting speed and feed values.
A multiple variable analysis was performed to define a relation between the cutting temperature and the surface roughness. The matrix of Table 7 shows Pearson product moment correlations between the cutting temperature and the surface roughness. These correlation coefficients are a measure of the strength of the linear relationship between the two variables. A p-value below 0.05 shows that the relationship between the cutting temperature and roughness was statistically significant at the 95.0% confidence level. A negative correlation coefficient indicates that an increase in the cutting temperature reduced the surface roughness.
The scatterplot of Figure 10 depicts that the surface roughness improved with the cutting temperature. As previously discussed, this could be related to the softening of the material at higher temperatures and the absence of a build-up edge. From the examined data, the use of infrared thermography could be a useful tool to monitor the cutting process and, hence, to optimize machining parameters or to detect improper cutting conditions. This study is going to be extended to examine further cutting conditions in order to establish a strong model that could directly relate the cutting temperature to the surface roughness of Ti6Al4V under dry finishing turning.

4. Conclusions

In this study, the surface roughness and cutting temperature of dry finish turning of Ti6Al4V were evaluated. Infrared thermography was used to detect the maximum temperature of the cutting region. The relationships between the machining parameters and maximum cutting temperature and the surface roughness were determined through ANOVA.
Based on the experimental results, the main conclusions are summarized in the following:
-
ANOVA showed that the machining parameters have a strong influence on the surface roughness of Ti6Al4V alloy under dry finish turning, with the cutting speed having primary effects on these factors;
-
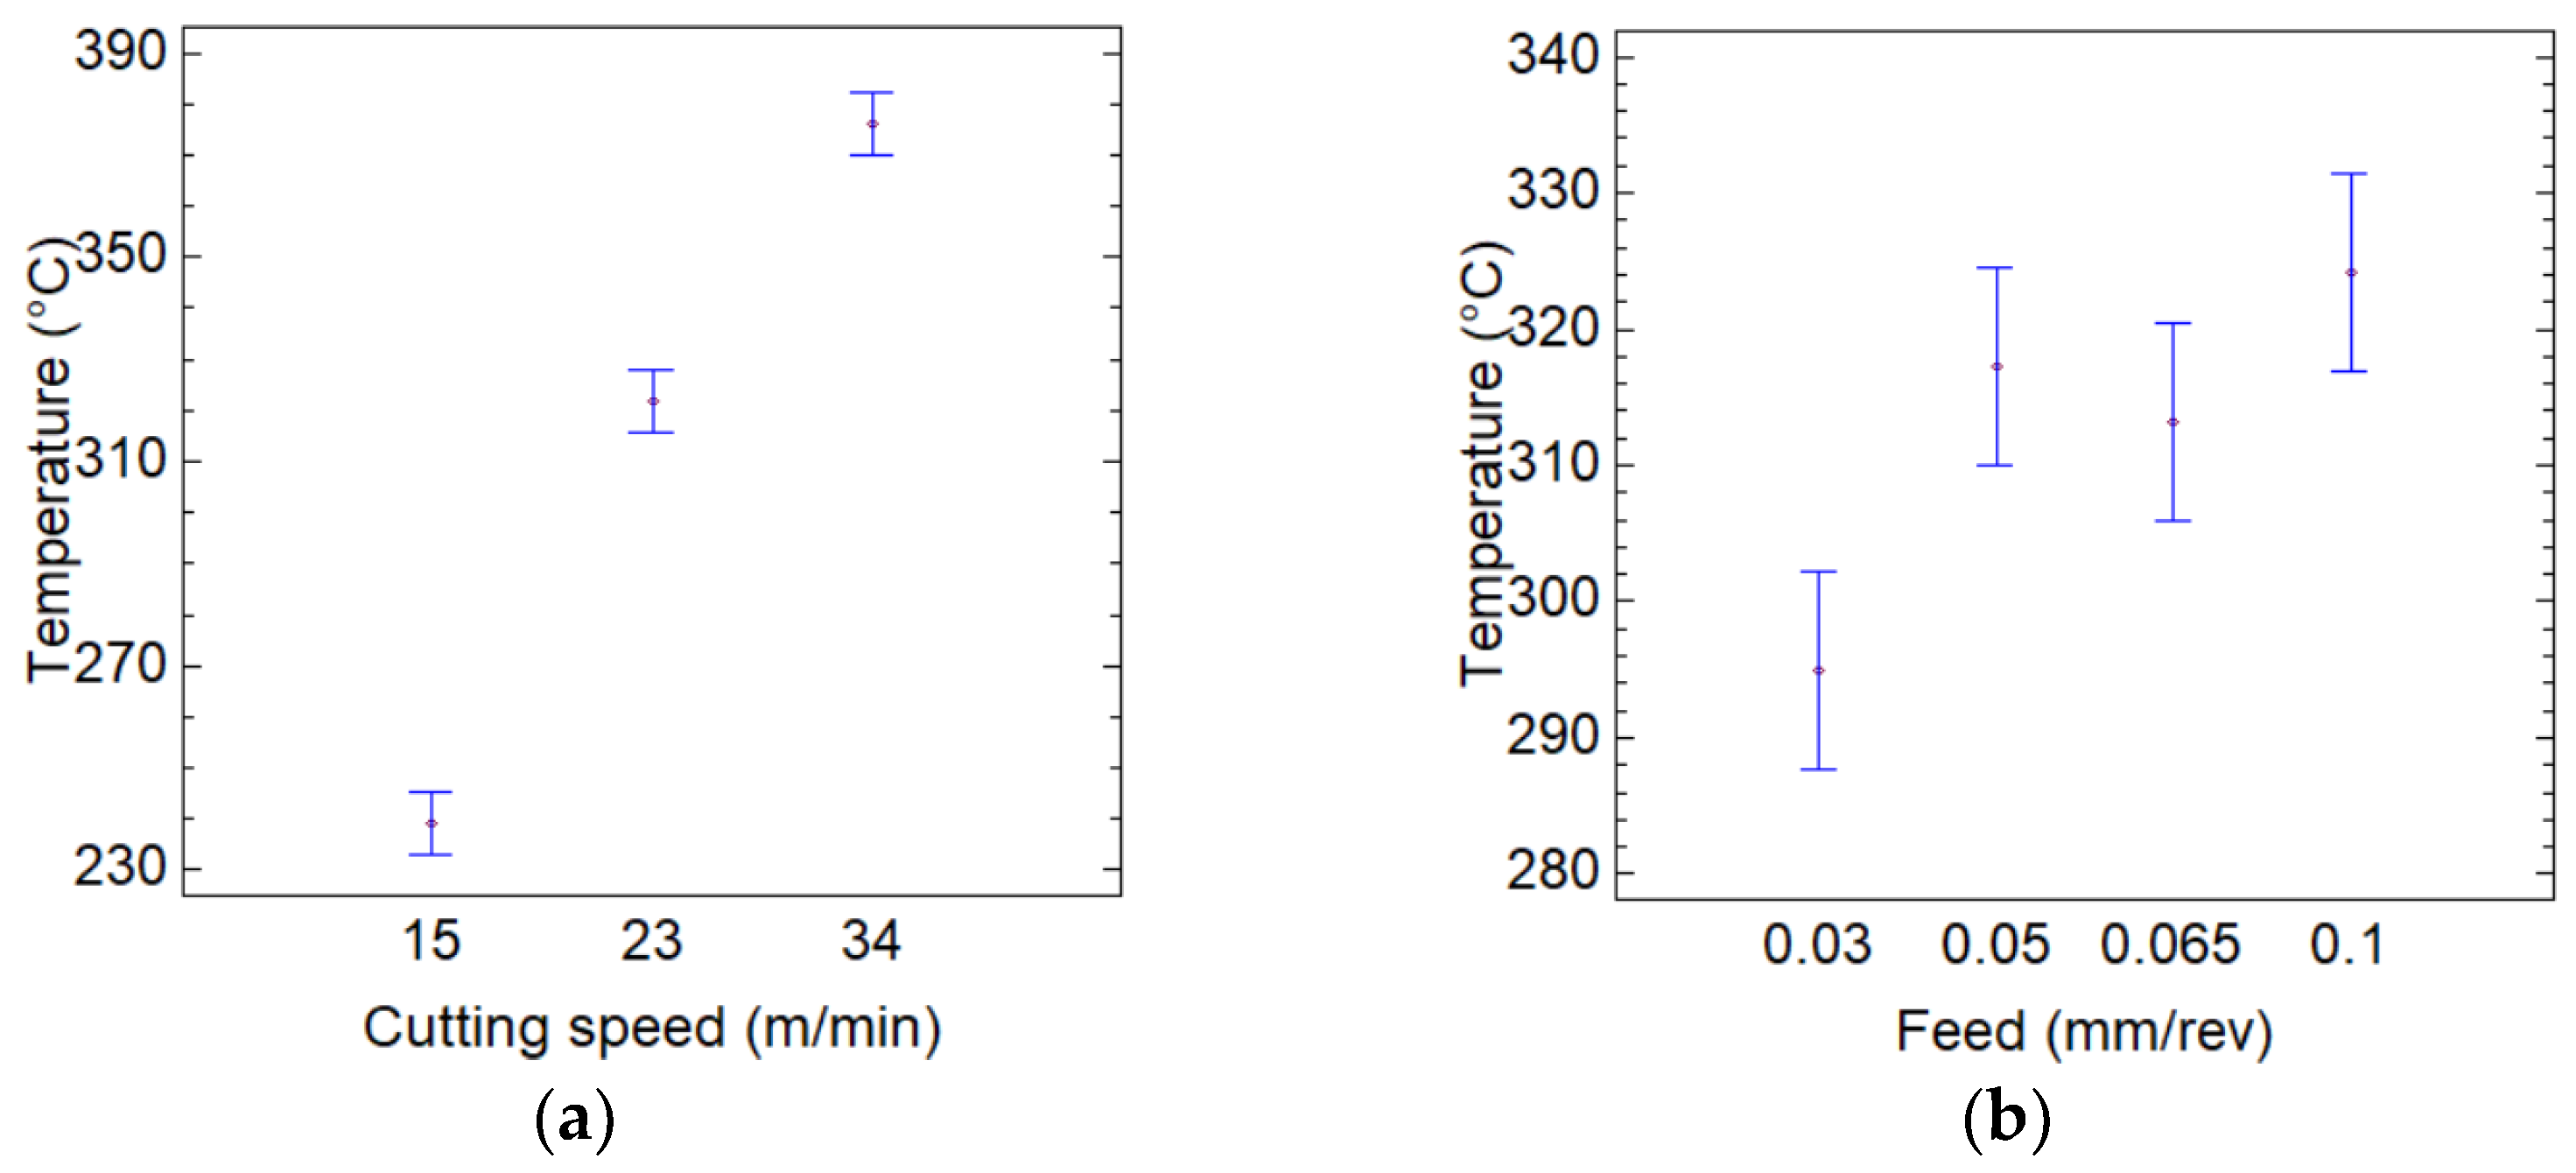
The cutting speed has a predominant influence on the cutting temperature, while the effect of the feed is of second order;
-
The examined experimental settings provide proper surface roughness. The roughness values were reduced by half when the cutting speed moved from 15 to 23 m/min, whereas it remained almost constant for larger cutting speeds. The best roughness surface, of around 0.8 μm, was obtained when the feed was 0.065 mm/rev or lower;
-
A regression analysis defined some models to relate the cutting temperature and surface roughness to the machining parameters;
-
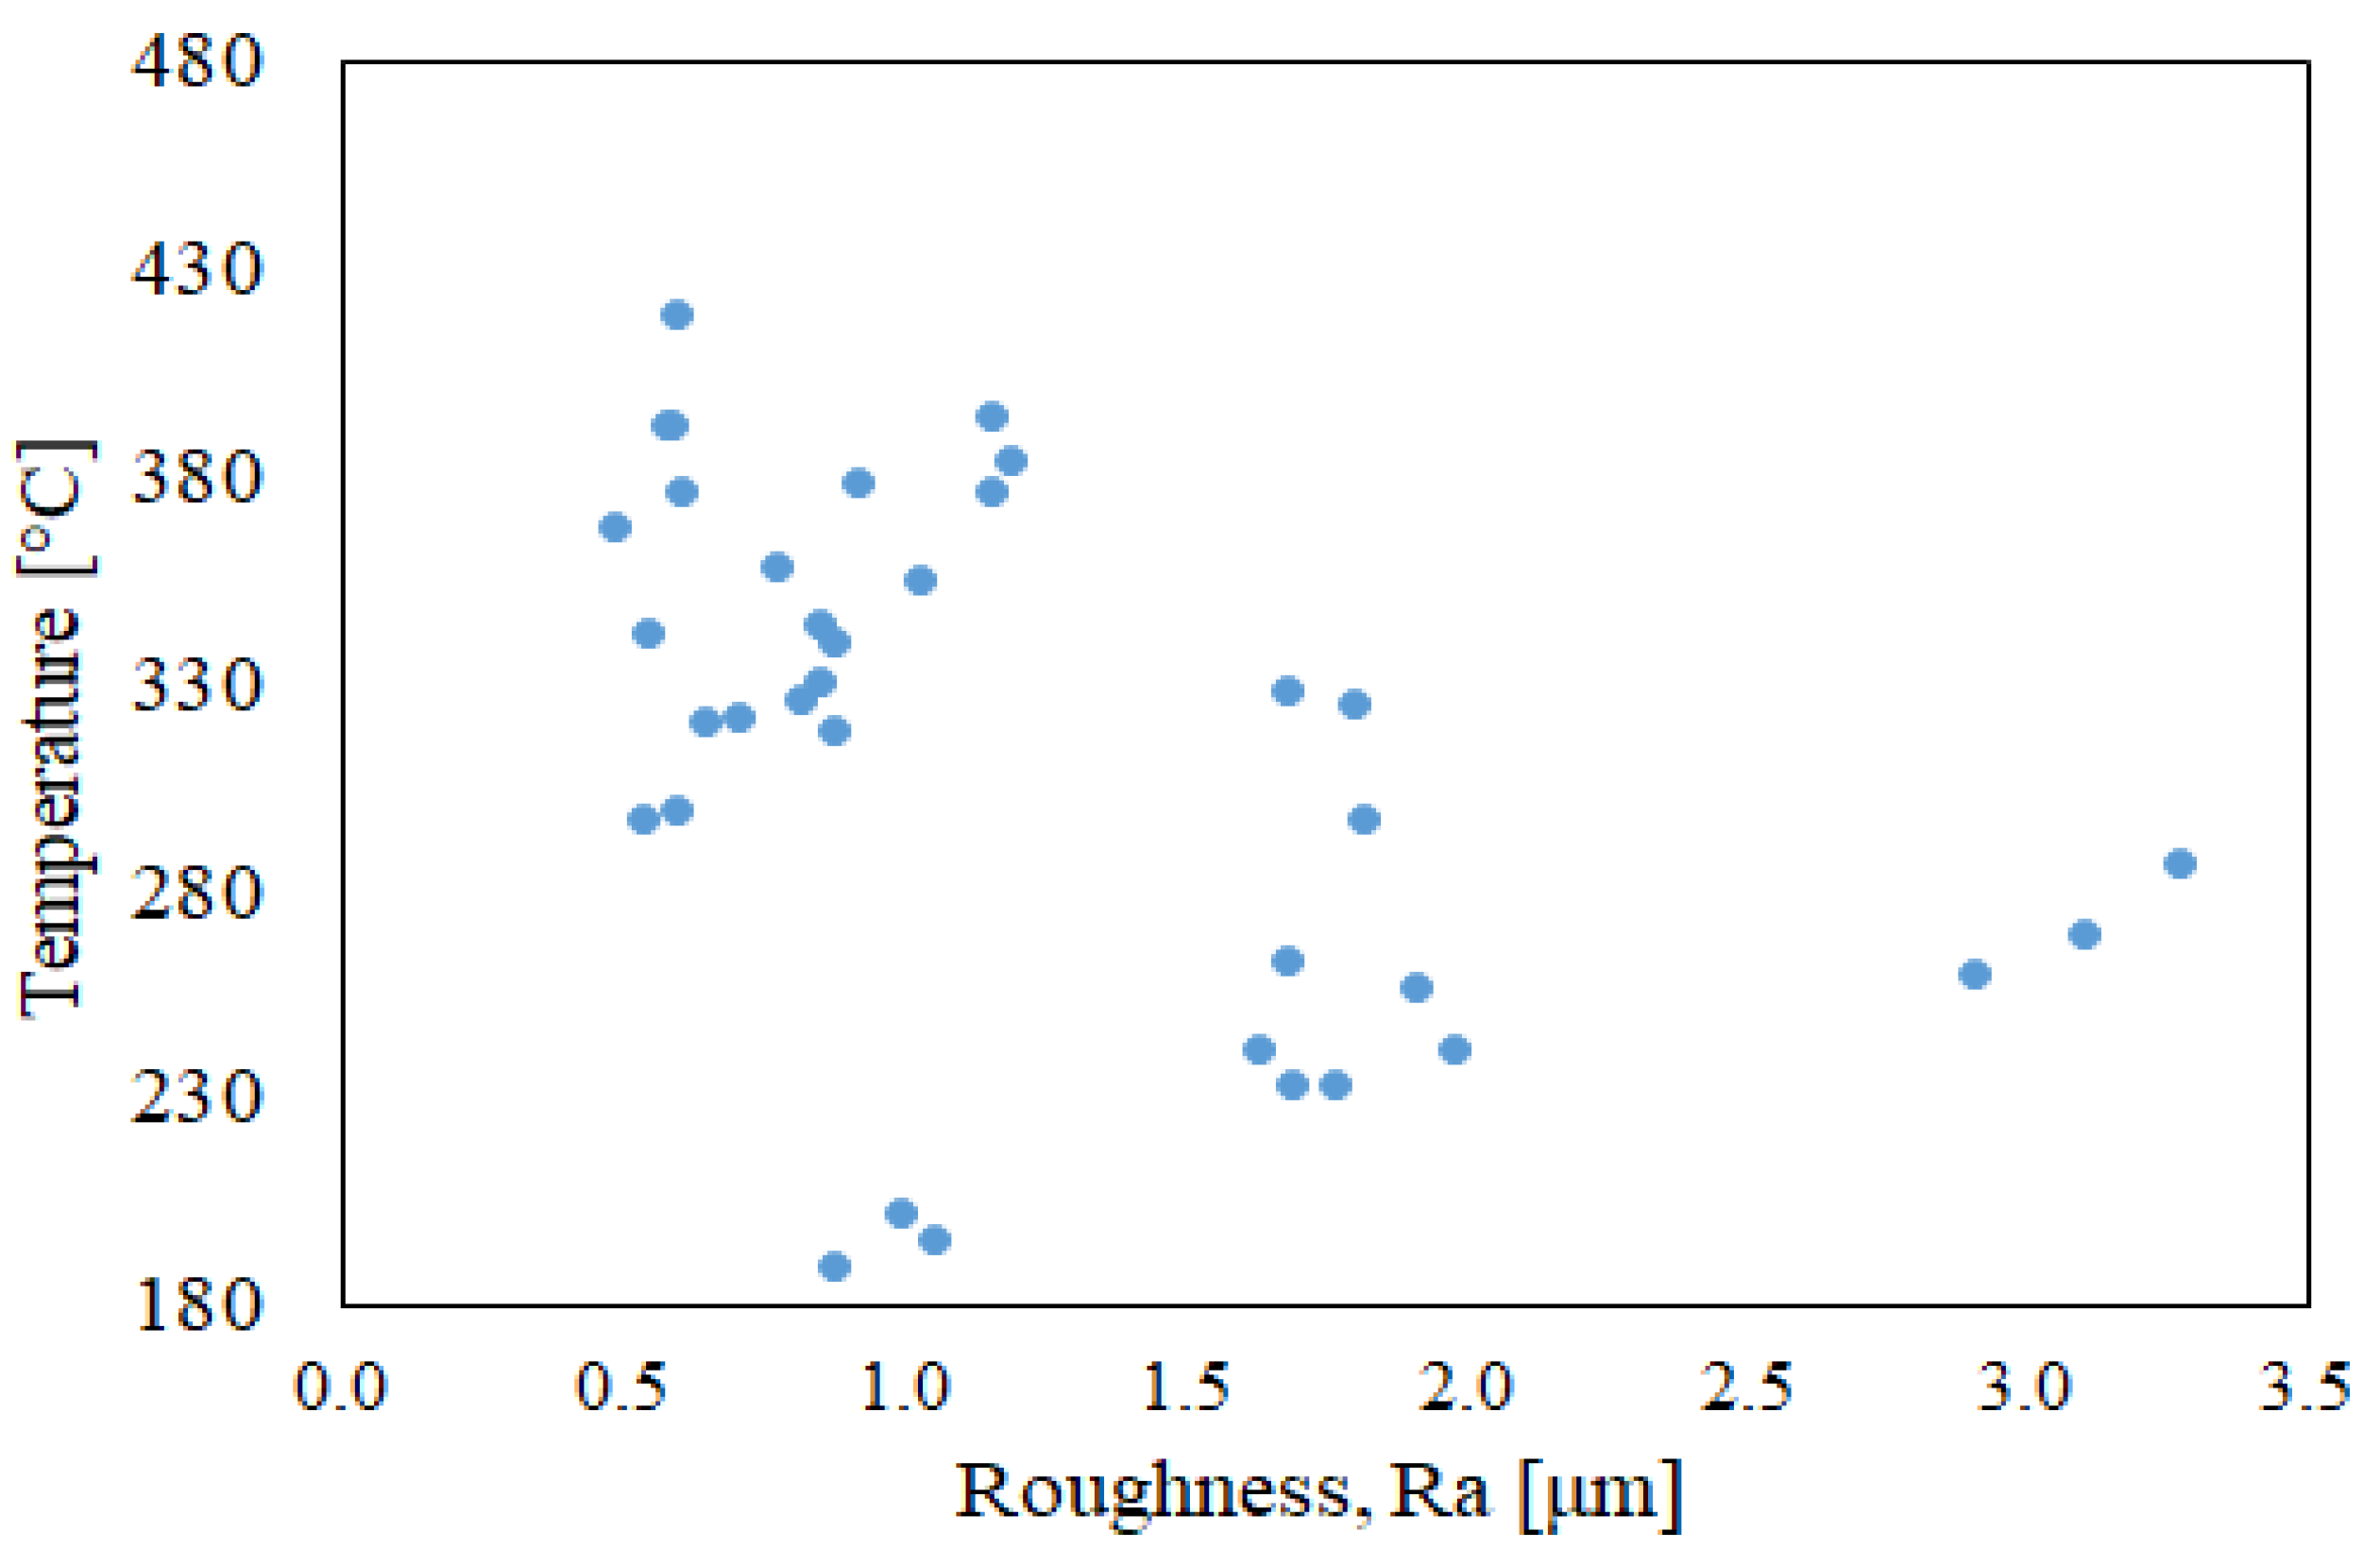
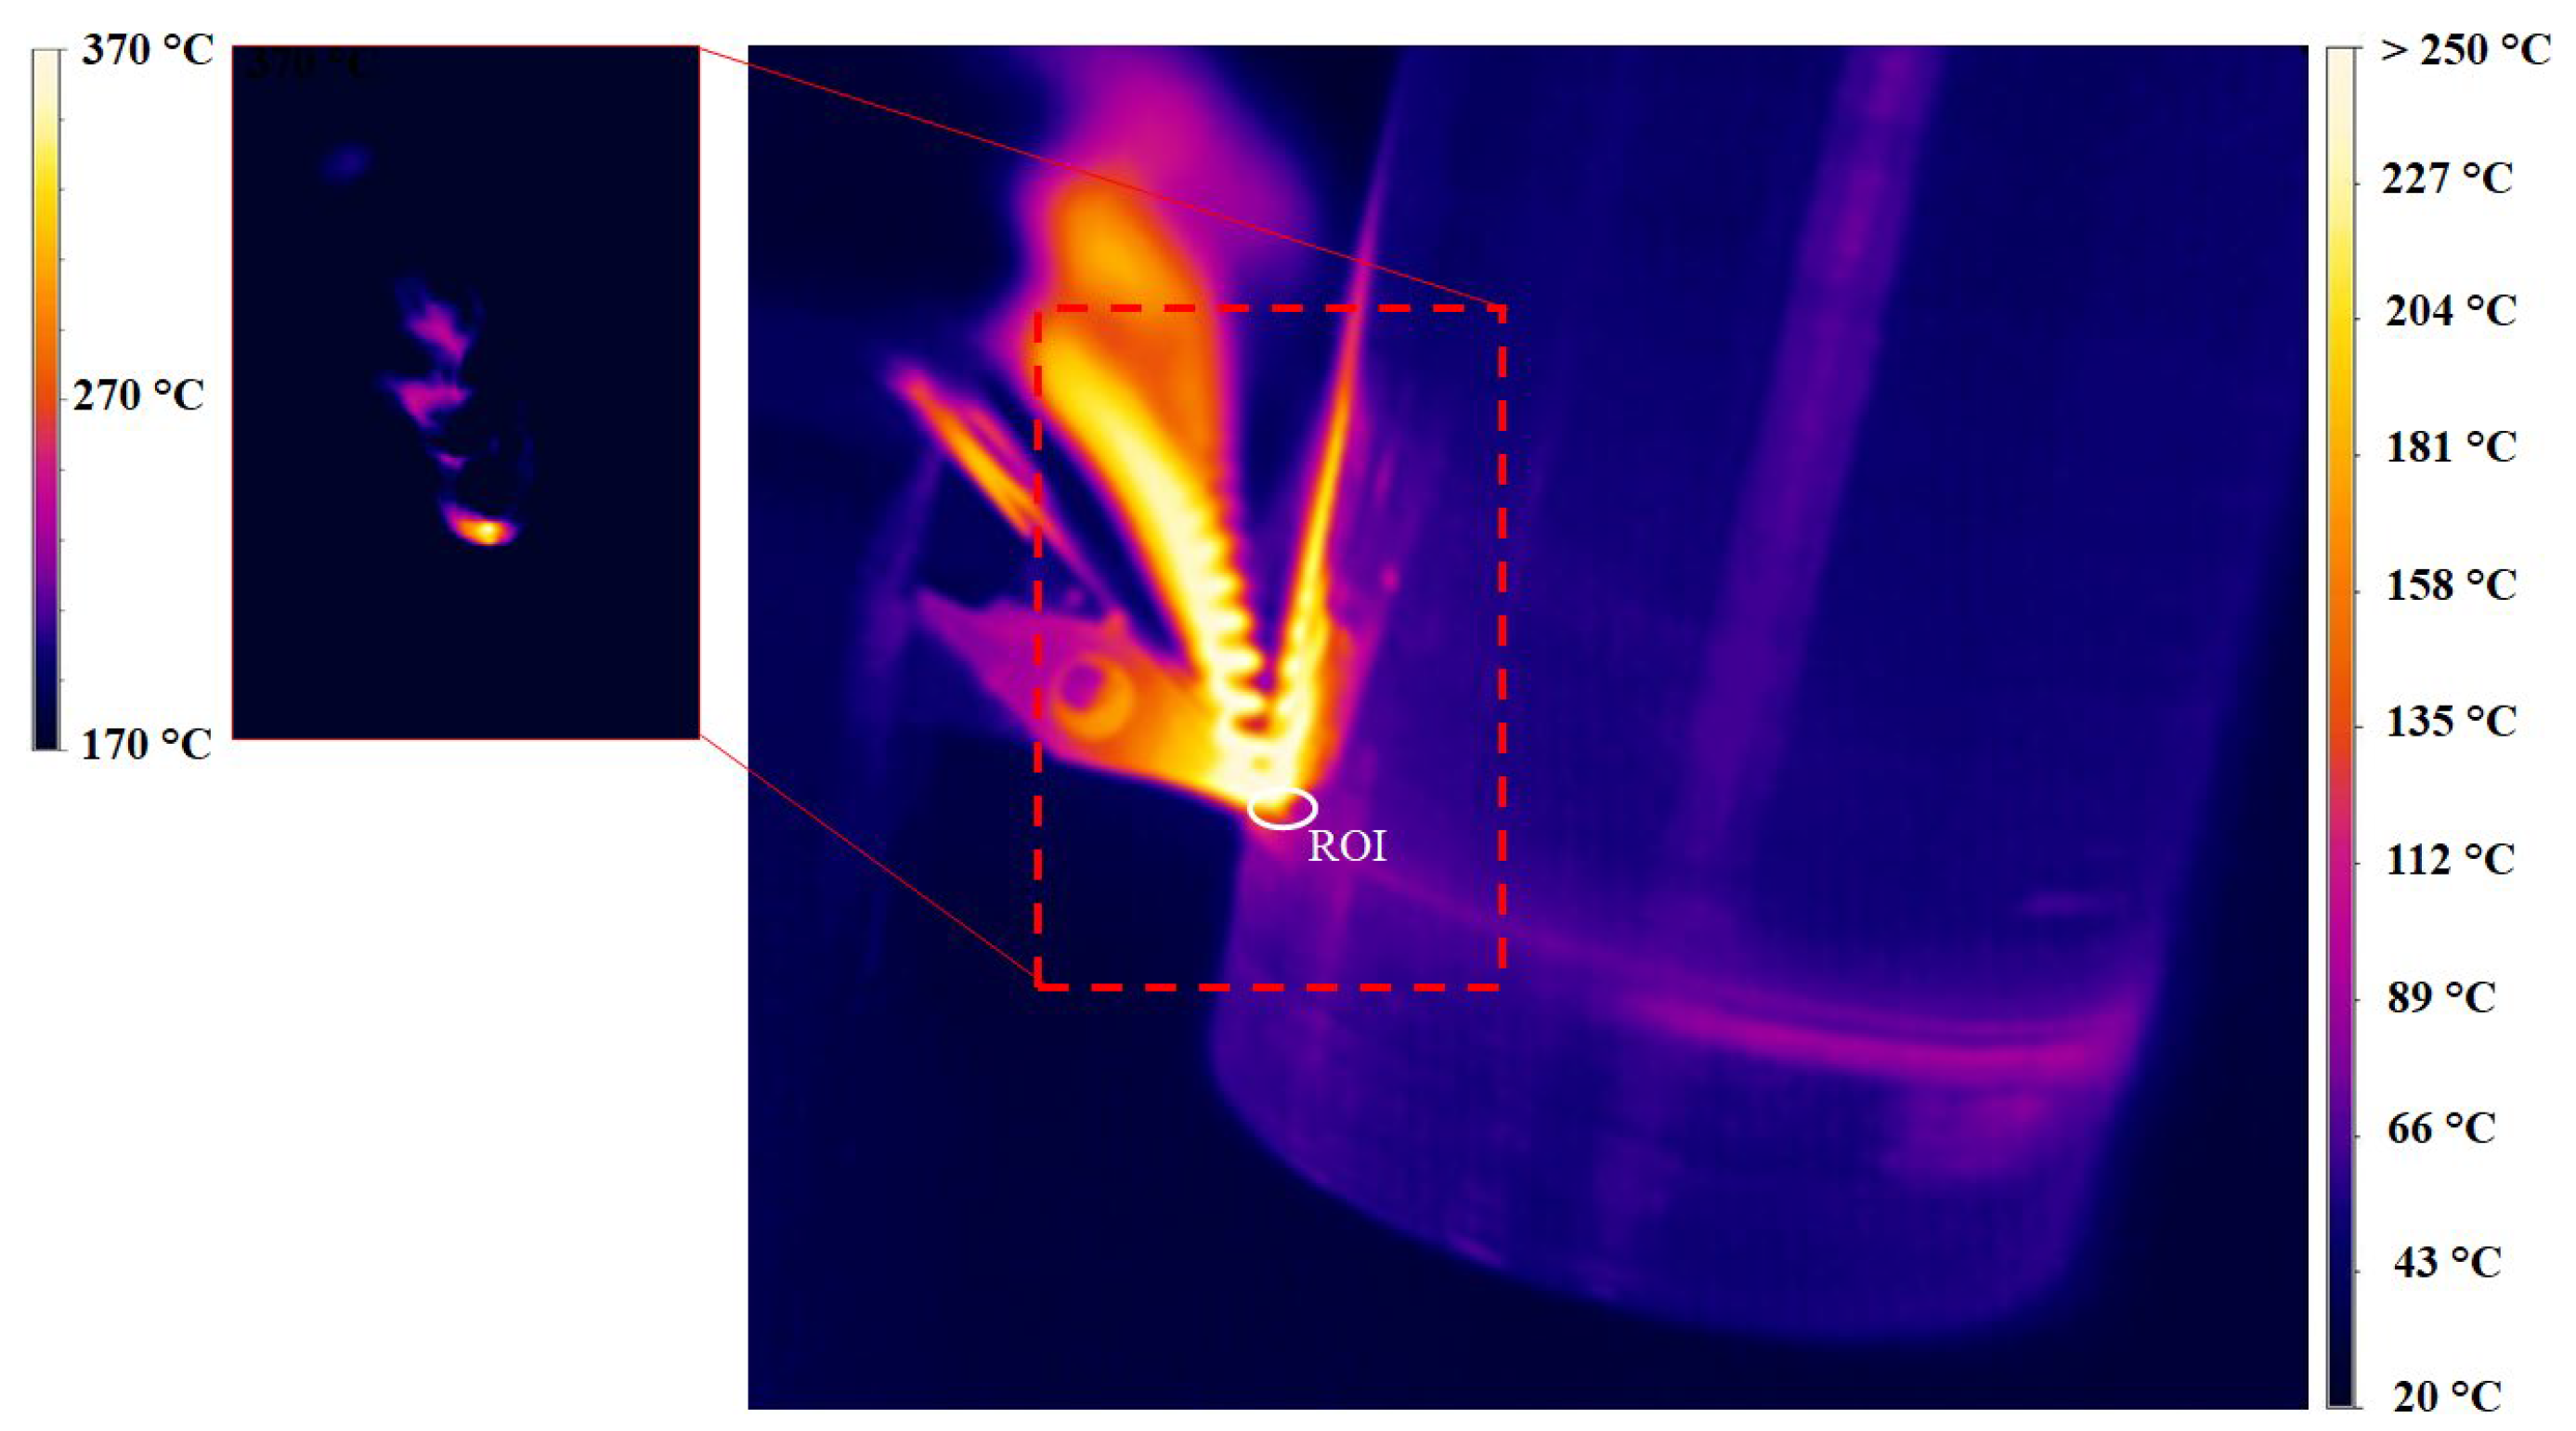
Infrared thermography made it possible to point out a direct relationship between the cutting temperature and the surface roughness.
This study is going to be extended to examine further machining settings, including different tool materials and geometries or the use of more or different sensors for temperature detection (e.g., two thermal cameras, one thermal camera and one pyrometer) to find more accurate relationships between the cutting temperature and the surface roughness of Ti6Al4V during dry turning. The use of infrared thermography can be effectively used to aid in founding a database on the influence of temperature when using different cutting parameters in machining operations. Moreover, there is a high potential for using this technique in the monitoring of the cutting processes, tool wear, and surface roughness of machined parts.

Author Contributions

Conceptualization, M.D.M., P.R.S., V.L. and V.R.; methodology, M.D.M., P.R.S., V.L. and V.R.; software, M.D.M., P.R.S., V.L. and V.R.; experimental testing, M.D.M., P.R.S., V.L. and V.R.; writing—original draft preparation, M.D.M., P.R.S., V.L. and V.R.; writing—review and editing, M.D.M., P.R.S., V.L. and V.R.; supervision, M.D.M. and P.R.S. All authors have read and agreed to the published version of the manuscript.

Funding

This research received no external funding.

Data Availability Statement

Not applicable.

Conflicts of Interest

The authors declare no conflict of interest.

References

  1. Gorynin, I.V. Titanium alloys for marine application. Mater. Sci. Eng. A 1999, 263, 112–116. [Google Scholar] [CrossRef]
  2. Boyer, R.R. An overview on the use of titanium in the aerospace industry. Mater. Sci. Eng. A 1996, 213, 103–114. [Google Scholar] [CrossRef]
  3. Shokoohi, Y.; Khosrojerdi, E.; Rassolian Shiadhi, B.H. Machining and ecological effects of a new developed cutting fluid in combination with different cooling techniques on turning operation. J. Clean. Prod. 2015, 94, 330–339. [Google Scholar] [CrossRef]
  4. Brinksmeier, E.; Meyer, D.; Huesmann-Cordes, A.G.; Herrmann, C. Metalworking fluids-Mechanisms and performance. CIRP Ann.-Manuf. Technol. 2015, 64, 605–628. [Google Scholar] [CrossRef] [Green Version]
  5. Dureja, J.S.; Singh, R.; Singh, T.; Singh, P.; Dogra, M.; Bhatti, M.S. Performance evaluation of coated carbide tool in machining of stainless steel (AISI 202) under minimum quantity lubrication (MQL). Int. J. Precis. Eng. Manuf.-Green Technol. 2015, 2, 123–129. [Google Scholar] [CrossRef] [Green Version]
  6. Jang, D.Y.; Jung, J.; Seok, J. Modeling and parameter optimization for cutting energy reduction in MQL milling process. Int. J. Precis. Eng. Manuf.-Green Technol. 2016, 3, 5–12. [Google Scholar] [CrossRef]
  7. Najiha, M.S.; Rahman, M.M.; Yusoff, A.R. Environmental impacts and hazards associated with metal working fluids and recent advances in the sustainable systems: A review. Renew. Sustain. Energy Rev. 2016, 60, 1008–1031. [Google Scholar] [CrossRef] [Green Version]
  8. Rotella, G.; Dillon, O.W.; Umbrello, D.; Settineri, L.; Jawahir, I.S. The effects of cooling conditions on surface integrity in machining of Ti6Al4V alloy. Int. J. Adv. Manuf. Technol. 2014, 71, 47–55. [Google Scholar] [CrossRef] [Green Version]
  9. Deiab, I.; Raza, S.W.; Pervaiz, S. Analysis of lubrication strategies for sustainable machining during turning of titanium ti-6al-4v alloy. Procedia CIRP 2014, 17, 766–771. [Google Scholar] [CrossRef] [Green Version]
  10. Pervaiz, S.; Deiab, I.; Darras, B. Power consumption and tool wear assessment when machining titanium alloys. Int. J. Precis. Eng. Manuf. 2013, 14, 925–936. [Google Scholar] [CrossRef]
  11. Shyha, I.; Gariani, S.; Bhatti, M. Investigation of Cutting Tools and Working Conditions Effects when Cutting Ti-6al-4V using Vegetable Oil-Based Cutting Fluids. Procedia Eng. 2015, 132, 577–584. [Google Scholar] [CrossRef] [Green Version]
  12. Lin, H.; Wang, C.; Yuan, Y.; Chen, Z.; Wang, Q.; Xiong, W. Tool wear in Ti-6Al-4V alloy turning under oils on water cooling comparing with cryogenic air mixed with minimal quantity lubrication. Int. J. Adv. Manuf. Technol. 2015, 81, 87–101. [Google Scholar] [CrossRef]
  13. Barrow, G. A Review of experimental and theoretical techniques for assessing cutting temperatures. CIRP Ann. 1973, 22, 203–211. [Google Scholar]
  14. Da Silva, M.B.; Wallbank, J. Cutting temperature: Prediction and measurement methods—A review. J. Mater. Process. Technol. 1999, 88, 195–202. [Google Scholar] [CrossRef]
  15. Komanduri, R.; Hou, Z.B. A review of the experimental techniques for the measurement of heat and temperatures generated in some manufacturing processes and tribology. Tribol. Int. 2001, 34, 653–682. [Google Scholar] [CrossRef]
  16. Smart, E.F.; Trent, E.M. Temperature distribution in tools used for cutting iron, titanium and nickel. Int. J. Prod. Res. 1975, 13, 265–290. [Google Scholar] [CrossRef]
  17. Dearnley, P.A. New technique for determining temperature distribution in cemented carbide cutting tools. Met. Technol. 1983, 10, 205–214. [Google Scholar] [CrossRef]
  18. Kato, S.; Yamaguchi, K.; Watanabe, Y.; Hiraiwa, Y. Measurement of temperature distribution within tool using powders of constant melting point. J. Manuf. Sci. Eng. Trans. ASME 1976, 98, 607–613. [Google Scholar] [CrossRef]
  19. Rossetto, S.; Koch, U. Investigation of temperature distribution on tool flank surface. CIRP Ann. 1971, 19, 551–558. [Google Scholar]
  20. Kato, T.; Fujii, H. Temperature measurement of workpiece in surface grinding by pvd film method. J. Manuf. Sci. Eng. Trans. ASME 1997, 119, 689–694. [Google Scholar] [CrossRef]
  21. Artozoul, J.; Lescalier, C.; Bomont, O.; Dudzinski, D. Extended infrared thermography applied to orthogonal cutting. Appl. Therm. Eng. 2014, 6, 441–452. [Google Scholar] [CrossRef] [Green Version]
  22. Suhail, A.H.; Ismail, N.; Wong, S.V.; Abdul Jalil, N.A. Optimization of Cutting Parameters Based on Surface Roughness and Assistance of Workpiece Surface Temperature in Turning Process. Am. J. Eng. Appl. Sci. 2010, 3, 102–108. [Google Scholar] [CrossRef] [Green Version]
  23. Prasad, B.S.; Prabha, K.A.; Kuma, P.V.S.G. Condition monitoring of turning process using infrared thermography technique—An experimental approach. Infrared Phys. Technol. 2017, 81, 137–147. [Google Scholar] [CrossRef]
  24. Brili, N.; Ficko, M.; Klančnik, S. Automatic identification of tool wear based on thermography and a convolutional neural network during the turning process. Sensors 2021, 21, 1917. [Google Scholar] [CrossRef] [PubMed]
  25. Somkiat, T.; Somchart, A.; Sirichan, T. In-Process monitoring and prediction of surface roughness on CNC turning by using response surface analysis. In Proceedings of the 36th International MATADOR Conference, Manchester, UK, 14–16 July 2010; Springer: London, UK, 2010. article code 122836. pp. 213–216. [Google Scholar] [CrossRef]
  26. D’Antonio, G.; Sauza Bedolla, J.; Chiabert, P.; Lombardi, F. PLM-MES integration to support collaborative design. In Proceedings of the International Conference on Engineering Design ICED, Milan, Italy, 27–30 July 2015; 10(DS 80-10). pp. 81–90. [Google Scholar]
  27. Rauch, E.; Russo Spena, P.; Matt, D.T. Axiomatic design guidelines for the design of flexible and agile manufacturing and assembly systems for SMEs. Int. J. Interact. Des. Manuf. 2019, 13, 1–22. [Google Scholar] [CrossRef]
  28. Sandvik Coromant-Turning Tools Catalogue. Available online: www.sandvik.coromant.com (accessed on 28 January 2021).
  29. Vorster, J.V.Z. Temperature Measurement of Titanium During Milling, Final project; Stellenbosch University: Stellenbosch, South Africa, 2010. [Google Scholar]
  30. Yang, J.; Sun, S.; Brandt, M.; Yan, W. Experimental investigation and 3D finite element prediction of the heat affected zone during laser assisted machining of Ti6Al4V alloy. J. Mater. Proc. Techn. 2010, 210, 2215–2222. [Google Scholar] [CrossRef]
  31. Muller, B.; Renz, U. Development of a fast fiber optic two color pyrometer for the temperature measurement of surfaces with varying emissivities. Rev. Sci. Instrum. 2001, 72, 3366–3374. [Google Scholar] [CrossRef]
  32. Conradie, P.J.T.; Oosthuizen, G.A.; Treurnicht, N.F.; Al Shaalane, A. Overview of work piece temperature measurement techniques for machining of Ti6Al4V. S. Afr. J. Ind. Eng. 2012, 23, 116–130. [Google Scholar] [CrossRef] [Green Version]
  33. Ramesh, S.; Karunamoorthy, L.; Palanikumar, K. Measurement and analysis of surface roughness in turning of aerospace titanium alloy (gr5). Measurement 2012, 45, 1266–1276. [Google Scholar] [CrossRef]
  34. Somkiat, T.; Voraman, B. Integration of in-process monitoring and statistical process control of surface roughness on CNC turning process. Int. J. Comp. Integr. Manuf. 2013, 26, 227–236. [Google Scholar] [CrossRef]
  35. Azizi, M.W.; Keblouti, O.; Boulanouar, L.; Yallese, M.A. Design optimization in hard turning of E19 alloy steel by analysing surface roughness, tool vibration and productivity. Struct. Eng. Mech. 2020, 73, 501–513. [Google Scholar] [CrossRef]
  36. Jaffery, S.H.I.; Sheikh, N.; Khan, M.; Mativenga, P. Wear Mechanism Analysis in Milling of Ti-6Al-4V alloy. Proc. Instit. Mech. Eng. Part. B J. Eng. Manuf. 2013, 227, 1148–1156. [Google Scholar] [CrossRef]
  37. Patil, S.; Jadhav, S.; Kekade, S.; Supare, A.; Powar, A.; Singh, R.K.P. The Influence of Cutting Heat on the Surface Integrity during Machining of Titanium Alloy Ti6Al4V. Proc. Manuf. 2016, 5, 857–869. [Google Scholar] [CrossRef] [Green Version]
  38. Sun, F.J.; Qu, S.G.; Pan, Y.X.; Li, X.Q.; Li, F.L. Effects of cutting parameters on dry machining Ti-6Al-4V alloy with ultra-hard tools. Int. J. Adv. Manuf. Technol. 2015, 79, 351–360. [Google Scholar] [CrossRef]
  39. Korkut, I.; Donertas, M.A. The influence of feed rate and cutting speed on the cutting force, surface roughness and tool-chip contact length during face milling. Mater. Des. 2007, 28, 308–312. [Google Scholar] [CrossRef]
  40. Sun, S.; Brandt, M.; Dargusch, M.S. Characteristics of cutting forces and chip formation inmachining of titanium alloys. Int. J. Mach. Tools Manuf. 2009, 49, 561–568. [Google Scholar] [CrossRef]
  41. Akkus, H.; Yaka, H. Experimental and statistical investigation of the effect of cutting parameters on surface roughness, vibration and energy consumption in machining of titanium 6Al-4V ELI (grade 5) alloy. Measurement 2021, 167, 108465. [Google Scholar] [CrossRef]
  42. Che-Haron, C.H. Tool life and surface integrity in turning titanium alloy. J. Mater. Proc. Technol. 2001, 118, 231–237. [Google Scholar] [CrossRef]
  43. Ginting, A.; Nouari, M. Surface integrity of dry machined titanium alloys. Int. J. Mach. Tools Manuf. 2009, 49, 325–332. [Google Scholar] [CrossRef]
Figure 1. (a) Schematic drawings of (a) the Sandvik Coromant mod. CoroTurn®107 cutting tool and (b) the main geometrical features [28].
Metals 12 00154 g001
Figure 2. The experimental setup adopted during the dry finish turning tests of the Ti6Al4V cylindrical parts.
Metals 12 00154 g002
Figure 3. Means plots of the influences of the cutting speed and feed on the surface roughness: (a) roughness vs. cutting speed; (b) roughness vs. feed.
Metals 12 00154 g003
Figure 4. Interaction plot of the combined influence of the cutting speed and feed on the surface roughness.
Metals 12 00154 g004
Figure 5. Contour plot of surface roughness against cutting speed and feed, with experimental data. Red points refer to the roughness experimental data.
Metals 12 00154 g005
Figure 6. Example of a thermographic image captured during the cutting process (with thermal map artifacts due to the light reflection from the chip). The figure also shows the oval-shaped ROI used for the temperature measurements.
Metals 12 00154 g006
Figure 7. Means plots of the influences of the cutting speed and feed on the cutting temperature: (a) temperature vs. cutting speed; (b) temperature vs. feed.
Metals 12 00154 g007
Figure 8. Interaction plot of the combined influence of cutting speed and feed on the cutting temperature.
Metals 12 00154 g008
Figure 9. Contour plot of the cutting temperature against cutting speed and feed, with experimental data.
Metals 12 00154 g009
Figure 10. Scatter plot of the cutting temperature vs. surface roughness.
Metals 12 00154 g010
Table 1. Nominal chemical composition of Ti6Al4V grade alloy.
MaterialChemical Composition (%wt.)
Ti6Al4VCFeAlVTi
<0.08<0.2564bal.
Table 2. Mechanical properties of Ti6Al4V: yield strength (YS); ultimate tensile strength (UTS); elongation at fracture (ef); HRC: Rockwell C hardness.
MaterialMechanical Properties
Ti6Al4VYS (MPa)UTS (MPa)ef [%]HRC
<0.08<0.2564
Table 3. Cutting parameter settings used during the experimental tests. Depth of cut of 0.5 mm for all the tests.
No. RunCutting Speed
(m/min)
Feed
(mm/rev)
1150.03
2150.05
3150.065
4150.1
5230.03
6230.05
7230.065
8230.1
9340.03
10340.05
11340.065
12340.1
Table 4. Maximum temperature (Tmax) detected in the cutting region and surface average roughness of the machined parts (Ra).
No. RunCutting Speed
(m/min)
Feed
(mm/rev)
Tmax
(°C)
Ra
(μm)
1150.03191 ± 60.98 ± 0.07
2150.05240 ± 131.70 ± 0.06
3150.065238 ± 101.86 ± 0.12
4150.1266 ± 113.09 ± 0.15
5230.03325 ± 100.80 ± 0.07
6230.05298 ± 110.60 ± 0.04
7230.065327 ± 180.83 ± 0.04
8230.1309 ± 141.77 ± 0.06
9340.03350 ± 160.95 ± 0.06
10340.05392 ± 130.59 ± 0.01
11340.065354 ± 150.55 ± 0.05
12340.1376 ± 81.17 ± 0.02
Table 5. ANOVA results for surface roughness. Dof: degree of freedom.
ParameterSum of SquaresDofMean SquareF-Ratiop-ValueContribution [%]
Main effects
A: cutting speed8.24224.121505.2<0.000144.1
B: Feed7.27532.425297.3<0.000138.9
Interactions
AB2.94360.490660.15<0.000115.5
Residual0.1957240.00815 1.6
Total (Corrected)18.6635
Tabulated F-ratio at 95% confidence level: F0.05,2,24 = 3.04; F0.05,3,24 = 3.00; F0.05,6,24 = 2.50.
Table 6. ANOVA results for cutting temperature. Dof: degree of freedom.
ParameterSum of SquaresDofMean SquareF-Ratiop-ValueContribution (%)
Main effects
A:cutting speed114,137257,069258<0.000184.9
B: Feed4191313976.320.00262.6
Interactions
AB10,237617067.720.00016.7
Residual530224221 5.8
Total (Corrected)133,86835
Tabulated F-ratio at 95% confidence level: F0.05,2,24 = 3.04; F0.05,3,24 = 3.00; F0.05,6,24 = 2.50.
Table 7. Correlation matrix between the cutting temperature and surface roughness. The number of pairs of data values used to compute each coefficient are in parentheses.
RoughnessTemperature
Roughnesscorrelation−0.4490
sample size(36)
p value0.0006
Temperature−0.4490correlation
(36)sample size
0.0006p-value
Publisher’s Note: MDPI stays neutral with regard to jurisdictional claims in published maps and institutional affiliations.

