Article

Prediction of Cracking Susceptibility of Commercial Aluminum Alloys during Solidification

1
CompuTherm, LLC, 8401 Greenway Blvd, STE248, Middleton, WI 53562, USA
2
Department of Materials Science and Engineering, University of Wisconsin, Madison, WI 53726, USA
*
Author to whom correspondence should be addressed.
Metals 2021, 11(9), 1479; https://doi.org/10.3390/met11091479
Submission received: 31 July 2021 / Revised: 7 September 2021 / Accepted: 14 September 2021 / Published: 17 September 2021
(This article belongs to the Special Issue Calphad Tools for the Metallurgy of Solidification)

Abstract

:
Cracking during solidification is a complex phenomenon which has been investigated from various angles for decades using both experimental and theoretical methods. In this paper, cracking susceptibility was investigated by a simulation method for three series of aluminum alloys: AA2xxx, AA6xxx, and AA7xxx alloys. The simulation tool was developed using the CALPHAD method and is readily applicable to multicomponent alloy systems. For each series of alloys, cracking susceptible index values were calculated for more than 1000 alloy compositions by high-throughput calculation. Cracking susceptible maps were then constructed for these three series of aluminum alloys using the simulated results. The effects of major and minor alloying elements were clearly demonstrated by these index maps. The cooling rate effect was also studied, and it was concluded that back diffusion in the solid can significantly improve the cracking susceptibility.

1. Introduction

Cracking during solidification is one of the most common and serious defects that is observed in castings and welds. Alloys, such as Al alloys, stainless steels, and Ni-base alloys, are susceptible to cracking during solidification. Usually such cracking is referred to as hot tearing [1,2] in casting and solidification cracking [3] in welding. Other names, such as hot cracking, hot shortness, supersolidus cracking, and shrinkage brittleness, are also used in the literature [4,5] to illustrate the phenomena.
Cracking during solidification is a complex process that can be influenced by many factors. As indicated by the review papers in [4,6], many efforts have been devoted to the understanding of the phenomenon since the 1950s. Among these efforts, there is a substantial contribution in using models to predict hot tearing [7,8,9,10], and some of these models have also been applied to solidification cracking in welds. Due to the complexity of the phenomenon, several theories were proposed to describe the phenomenon and variety of models were developed according to these theories. Prokhorov [7] proposed a model based on the theory of deformation of semi-solid body. According to this theory, the main measure for hot tearing is the ductility of the semi-solid body, and hot tear will occur if the strain of the body exceeds its ductility. On the other hand, a theory based on shrinkage-related brittleness concluded that hot tearing occurs if the shrinkage stress exceeds the rupture stress [11,12]. Certainly, there are theories assuming that hot cracking happens at a critical stress [13]. There are also theories that consider the insufficient feeding of liquid during solidification to be the main cause of hot tearing. The criteria derived by Niyama [14] and Feurer [8,15] are based on this assumption.
Among these models, the one proposed by Clyne and Davies [9] was widely accepted. Their hot tearing criterion was developed according to the strain accumulation theory proposed by Pellini [16], who believed that hot tearing is a strain-controlled phenomenon which occurs if the total strain on the hot spot reaches a certain critical value. The criterion proposed by Clyne and Davies [9] for determining the cracking susceptibility of an alloy is the critical time periods spent in the mushy state. In their model, the cracking susceptibility coefficient (CSC) was defined as C S C = t v / t R , where t v represents the time during which the casting is “vulnerable” to cracking and t R is the period when the casting can relieve stress during the solidification process. In their paper [9], t R was defined as the time period when liquid solidifying from 60% to 10%, and t v was defined as the time period when liquid solidifying from 10% to 1%. By using this model, Clyne and Davies [9] successfully correlated alloy composition with cracking susceptibility for some binary alloy systems. In 2006, Yan and Lin [5] extended the capability of this model beyond binary systems and applied it to Al-Cu-Si and Al-Cu-Mg ternary alloys. Yan and Lin’s work is important due to their effort to integrate Clyne and Davies’s model directly with a thermodynamic calculation engine for the purpose of applying such a model to multicomponent alloys.
Another widely used hot tearing criterion was proposed by Rappaz, Drezet, and Gremaud (RDG model) [10], who believed that it is the strain rate instead of strain which determines whether hot cracking will occur. In their model, the hot cracking susceptibility of an alloy was related to the critical strain rate. The RDG criterion was the first model to consider both uniaxial tensile deformation and shrinkage feeding. The original model considered hot tearing in an alloy with columnar grains where the shrinkage strain is fed through solidifying dendrites. Unlike empirical formulas, the RDG model has a physically sound basis. This model was used to study the solidification cracking in some binary aluminum alloys [10,17] which usually exhibited a Λ-shaped curve with a peak hot cracking susceptibility.
Since 2015, Kou and colleagues published a series of papers [18,19,20,21,22,23,24] to predict hot cracking susceptibility in various binary and ternary systems. In the first paper of this series, Kou [18] proposed and derived a criterion for predicting hot cracking. Similar to the RDG model, Kou’s model covers columnar dendritic grains growing in one direction, subjected to tensile deformation normal to the growth direction and liquid feeding opposite to the growth direction. However, as indicated by Kou, his approach is different. Instead of dealing with the mushy zone as a whole as in the RDG model, Kou’s model focuses on the events occurring at the grain boundary (GB). Three factors were considered along the GB between two neighboring columnar dendritic grains: First, separation of grains from each other under tensile strain to cause cracking; second, growth of grains toward each other to bond together to resist cracking; and third, liquid feeding along the GB to resist cracking. According to the conservation of mass in a volume element at the GB near the end of solidification, Kou [18] derived an equation for describing cracking during solidification. From their equation, a crack susceptibility index (CSI), | d T / d ( f s ) 1 / 2 | near the end of solidification was proposed to describe the crack susceptibility given an alloy composition, where T is temperature and f s represents the fraction of solid. The higher the index, the slower grains can grow to bond together to resist cracking. Moreover, higher CSI also makes it more difficult for liquid to feed shrinkage to resist cracking, thus leads to higher chance of cracking.
In their first paper [18], the | d T / d ( f s ) 1 / 2 | is calculated by Δ T / Δ ( f s ) 1 / 2 in the range of 0.87 < f s < 0.94 , (or 0.933 < ( f s ) 1 / 2 < 0.97 ). This range is quite arbitrary and lack of fairness, as for some alloys the maximum | d T / d ( f s ) 1 / 2 | may be out of this range. In that paper, Scheil model was used to calculate the f s T curve without considering back diffusion in the solid. In their second paper [19], max | d T / d ( f s ) 1 / 2 | was introduced as the index of cracking susceptibility. In addition, effect of diffusion in the Al-rich dendrites was studied in their third paper [20]. The three papers published in 2015 [18,19,20] focused on binary systems, including Al-Cu, Al-Si, Al-Mg, Al-Zn, and Al-Sn systems. In their papers published in 2017 [23,24], they applied the same criterion to ternary systems and developed cracking susceptibility maps for the Al-Cu-Mg, Al-Cu-Si, and Al-Mg-Si ternary systems based on the calculated CSI values at 121 alloy compositions for each ternary. These cracking susceptibility maps clearly demonstrate the compositions that are more susceptible to hot cracking. Kou and colleagues [25,26] also developed simple experimental testing approach to validate the predictions, and good agreement was obtained. As pointed out by Kou [18], this index was not used to predict if cracking will actually occur during solidification, but to shed light on predicting the crack susceptibility of an alloy.
From above discussion, it is clearly seen that hot cracking is a complicated process which is affected by many factors. Many models have been developed in the past several decades by assuming one or more key factors which control the cracking. The purpose of this paper is not to judge which model is better but to explore the modeling capability in multicomponent alloy systems. Most of the previous work has been applied to simple alloy compositions such as binary alloys and some ternary alloys [5,27,28,29,30]. Studies of this type have proved very enlightening, yet none of them have gone beyond ternary systems. Recently, Han et. al. [31] studied the cracking susceptibility in the Al-Mg-Cu-Li quaternary system using the criterion developed by Kou [18], which was a good attempt to apply Kou’s criterion to a multicomponent system. Limited by the software and database, they were able to perform simulations using the Scheil model in their work without considering back diffusion in the solid. As indicated by the authors, back diffusion during solidification may have an impact on the initiation or propagation of cracks, therefore diffusion kinetics should be included for better prediction. As we prepare this present paper, Kou’s group published another paper which extended the application of the criterion to the Al-Si-Mg-Cu, Al-Zn-Mg-Cu, and Al-Li-Mg-Cu quaternary systems [32]. In the most recent review paper by Katgeran and colleagues [6], they commented on the criterion of Kou as the simple form of the hot tearing susceptibility index, and it has promise enough to be widely adopted to different alloys and manufacturing processes. In this paper, we will explore the applicability of Kou’s criterion [18,19] to multicomponent aluminum alloys even beyond quaternary systems. Back diffusion in the solid will be taken into account so that the effect of cooling rate can be considered. In the remainder of this paper, we will first give a brief introduction about the CALPHAD method and the simulation tools we have developed using this method including Pandat software [33,34] and PanAluminum database [35]; we will then use these tools to simulate the cracking susceptibility of multicomponent aluminum alloys AA2xxx, AA6xxx, and AA7xxx; the simulated results will be discussed afterwards, and conclusion remarks summarized.

2. Solidification Simulation by the CALPHAD Method

The CALPHAD method, which stands for CALculation of PHAse Diagrams, has become a widely used method for effectively calculating complex phase diagrams of multicomponent systems in the past several decades [36,37,38,39]. The philosophy of this approach is to develop a thermodynamic database for the multicomponent system in question via its constituent binary and ternary systems; the database thus developed can be used to calculate phase equilibria and related properties of the multicomponent system. Modern alloy design requires the use of multiple components to reach the design targets, therefore being able to predict multicomponent phase equilibria is essential. Currently, the CALPHAD approach is the only method that can be used to obtain multicomponent phase diagrams with enough accuracy for practical applications without the need of exhaustive experimental work [40]. Although the CALPHAD method was initially emerged as a method for understanding thermodynamics and phase equilibria of multicomponent systems, the method has been successfully applied to diffusion mobilities in multicomponent systems [41], and mobility databases have been developed using a similar way as that of a thermodynamic database [42]. Recently, the CALPHAD method has expanded its applicability to other phase-related properties, such as molar volumes, elastic constants, and thermal conductivity [43]. Therefore, the CALPHAD approach has in recent years been applied to a broader field of materials science and engineering beyond phase diagrams, such as solidification, coating, joining, and phase transformation. There is no doubt that CALPHAD has played an important role in ICME [44] to significantly reduce the time and cost for developing and deploying new materials.
Two essentials for the successful application of the CALPHAD method are software and phase-based property databases, such as thermodynamic database, mobility database, molar volume database, and other thermophysical property databases. Pandat (version 2021, CompuTherm, Middleton, WI, USA) is a software suite developed by the CALPHAD method. It currently has six modules for thermodynamics/phase diagram calculation (PanPhaseDiagram module), property optimization (PanOptimization module), precipitation simulation (PanPrecipitation module), diffusion simulation (PanDiffusion module), and solidification simulation (PanSolidification module) of multicomponent alloys. A new PanPhaseField module for phase field simulation was also developed and released recently. The module to be used in this paper is the PanSolidification module [45,46], which was designed for the simulation of solidification behavior of multicomponent alloys under a variety of conditions with different cooling rates.
The solidification behavior of an alloy is determined by its solidification path, which describes the phase formation sequence during solidification. The solidification path of an alloy was usually simulated by two approximate models: equilibrium (lever-rule) and non-equilibrium (Scheil-Gulliver) models [47,48]. In the lever rule, complete mixing is assumed in both liquid and solid, which represents an equilibrium case. In the Scheil-Gulliver model, it assumes complete mixing in the liquid, but no diffusion in the solid. While these two models are simple and straightforward, the practical solidification process is much more complicated. To predict the final as-cast microstructure, elemental diffusion in the solid must be considered. In the PanSolidification module, a modified Scheil model was also developed by taking into consideration of back diffusion in the solid. As the PanSolidification module is seamlessly integrated with the thermodynamic calculation engine of Pandat software, it can receive instant update of the needed phase equilibrium data, such as partition coefficient, liquidus slope, and mobility data of the multicomponent alloy under simulation. Therefore, the PanSolidification module can be readily used for the simulation of solidification behavior of multicomponent alloys under variety of solidification conditions.
The PanAluminum [35] database developed at CompuTherm is a combined thermodynamic database and mobility database for multicomponent aluminum alloys. It includes 37 elements and 1033 phases. This database was validated by many aluminum alloys including cast aluminum alloys and wrought aluminum alloys. In the next section, we will use PanSolidification module and PanAluminum database to simulate the cracking susceptibility of three series of aluminum alloys: AA2xxx, AA6xxx, and AA7xxx.

3. Simulation of Hot Cracking Susceptibility of Commercial Aluminum Alloys

The hot tearing tendency is usually expressed by the crack length, or the crack length divided by a certain length of the casting. In a binary system, the cracking tendency is usually represented as a Λ curve, i.e., the cracking tendency increases with the amount of alloying component only to a maximum value, and further increasing of the alloying component leads to the decrease of cracking tendency. The maximum point is believed to correspond to the maximum effective freezing range under given solidification condition. Kou and colleagues [20,21] have studied the Al-Cu, Al-Si, Al-Mg, Al-Zn, and Al-Sn systems. By using Kou’s criterion, their simulated results all demonstrated the Λ curve and the composition showing maximum cracking susceptibility in each binary system corresponds with experimentally observations well. Liu and Kou [24] applied the same criterion to ternary systems and developed the cracking susceptibility maps for the Al-Cu-Mg, Al-Cu-Si, and Al-Mg-Si ternary systems based on the calculated CSI values at various compositions in each ternary. These maps clearly demonstrate the composition regions that are most vulnerable to hot cracking. As indicated in the review paper by Eskin [4], hot cracking susceptibility data have been reported mainly for three series of commercial aluminum alloys, namely, AA2xxx, AA6xxx, and AA7xxx alloys. This is probably because these three series of alloys are more susceptible to hot cracking. As Al-Cu-Mg is the key ternary for AA2xxx series and Al-Mg-Si is the key ternary for AA6xxx series, some simulations will be performed for these two ternaries in this work. The purpose is not to repeat Liu and Kou’s work [24], but to present consistent simulated results throughout this paper. Although all the simulations in Liu and Kou’s paper [24] were performed by using Pandat software and PanAluminum database, the version they used was from a few years ago. As we continue to improve our software and databases, we expect to see some differences between the simulated results of this work and those in Liu and Kou’s paper [24]. More importantly, we want to include more elements, major or minor, into the picture to understand their effects on the hot cracking susceptibility of each series of alloys.

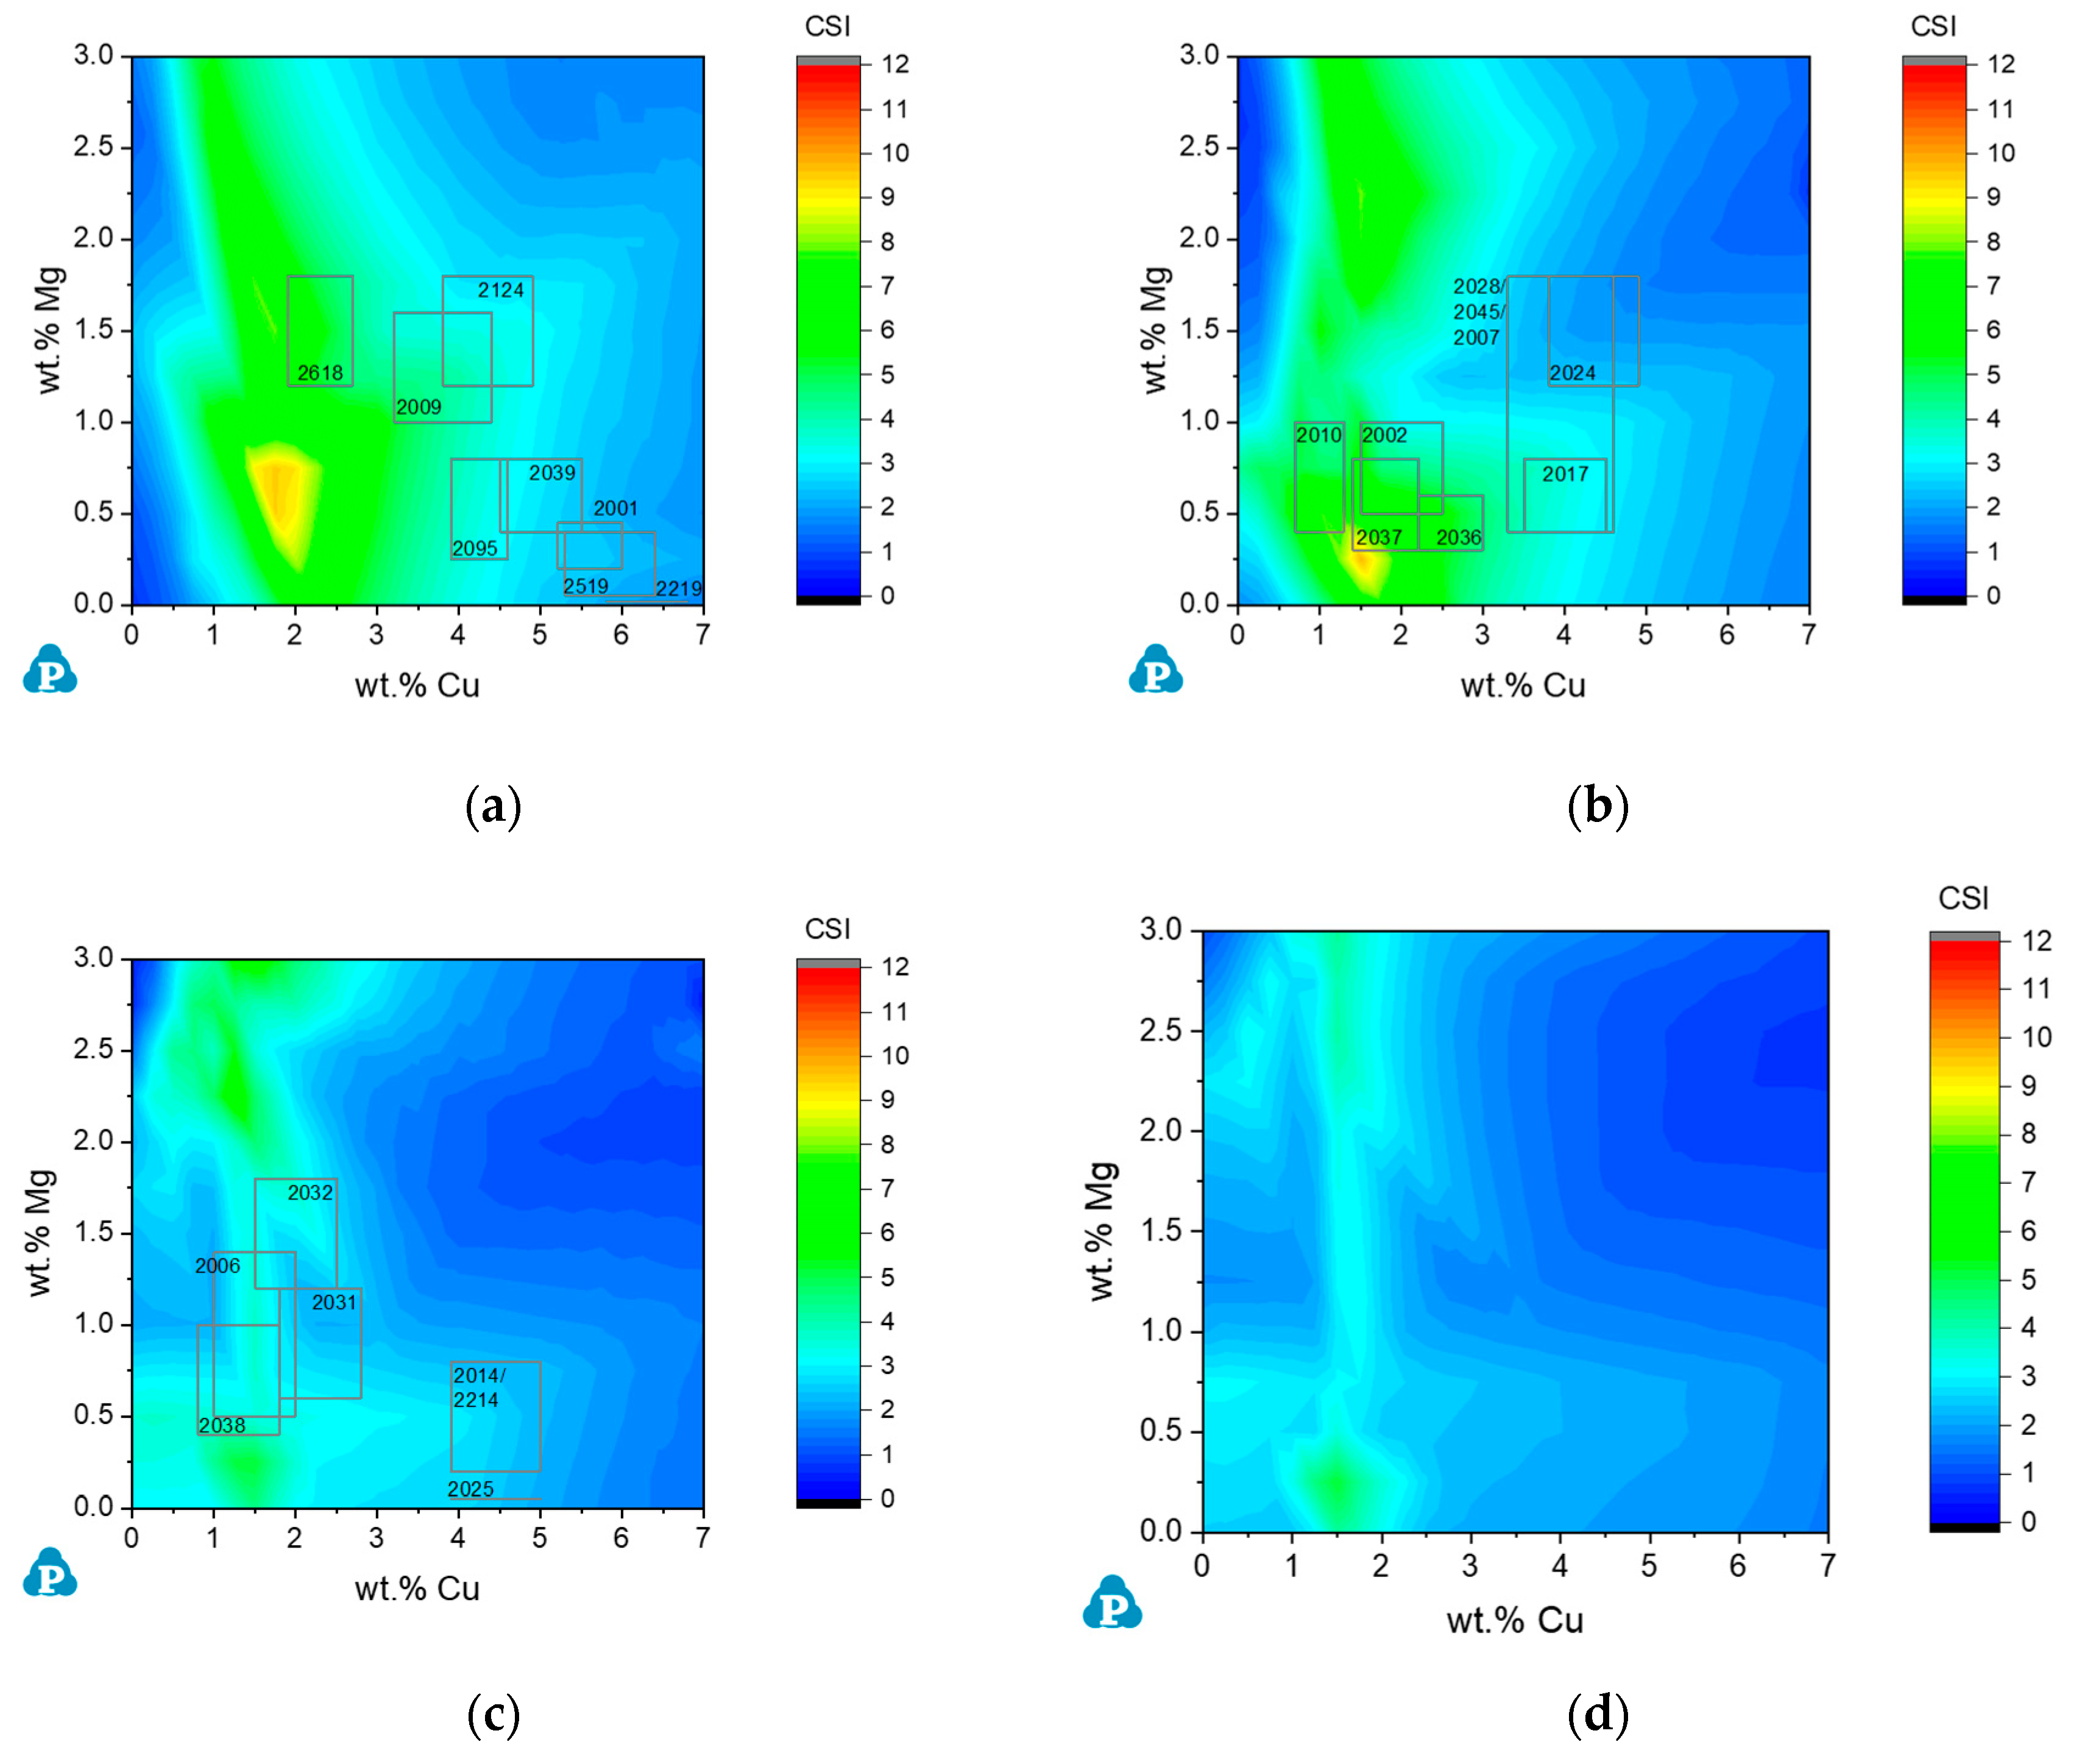
3.1. Hot Cracking Susceptibility of AA2xxx Series

3.1.1. The Al-Cu-Mg Ternary System

Copper is the principal alloying element in the AA2xxx series of alloys and its content varies from 2 to 10 wt%. Copper provides substantial increases in strength and facilitates precipitation hardening. The susceptibility to solidification cracking of aluminum-copper alloys increases with copper content to some extent before the tendency goes down; consequently, some of these alloys can be the most challenging aluminum alloys to weld. The peaks observed in crack susceptibility tests of binary Al-Cu alloys locate between 1 wt% Cu and 5 wt% Cu [49,50,51,52,53] depending on the test conditions. It was observed that cracking peak tends to move to higher copper content when the cooling rate decreases. Liu and Kou [21] explained this phenomenon by back diffusion in the primary solidified phase. Magnesium is the secondary addition in AA2xxx series, and its content can reach 1.5 wt%. In the Al-Cu-Mg ternary system, the composition that is most vulnerable to hot cracking is near Al-2 wt% Cu-1.5 wt% Mg based on the results of cracking susceptibility tests using the ring-casting method [54]. Liu and Kou [24] calculated the cracking susceptibility maps of the Al-Cu-Mg ternary system using their criterion for three solidification simulation conditions: no back diffusion in the solid and with back diffusion under the cooling rates of 100 °C/s and 20 °C/s. Their simulated results demonstrated that the one considering back diffusion in the solid under the cooling rate of 20 °C/s shows the best agreement with the experimental tested data. In this work, we performed simulations for 441 alloys in the Al-5 wt% Cu-5 wt% Mg composition range to obtain their CSI values under the cooling rate of 20 °C/s. Figure 1a shows the hot cracking susceptibility map built by the calculated CSI values. Although not identical, a similar trend is observed as that shown in Liu and Kou’s paper [24]. Figure 1b shows the tested results [54] for the Al-Cu-Mg system.
One may notice that Figure 1a,b shows the highest index as 12. However, note that this is only a coincidence. By Kou’s definition, C S I = max | d T / d ( f s ) 1 / 2 | , therefore the unit of the calculated CSI is °C or K. The experimental data, on the other hand, are measured lengths of cracking with the unit inch or cm. It is therefore meaningless to compare simulated and measured cracking maps by their index values. The most valuable information one can get from such a map is the cracking tendency as a function of alloy composition. Furthermore, note that the calculated CSI values in the Al-Cu-Mg system vary from a few hundred to ~12,000. Figure 1a is plotted by scaling down the calculated CSI values by a factor of 1000. This same rule will apply to all the calculated cracking susceptibility maps in this paper.

3.1.2. Commercial AA2xxx Alloys

In addition to the major alloying elements Cu and Mg, other alloying elements of AA2xxx include 0.05–1.3% Si, 0.05–1.5% Fe, 0.05–1.2% Mn, and some other trace elements, such as Cr, Ni, Zn, and Ti. It would be interesting to compare the crack susceptibility of these AA2xxx alloys using the CSI maps. Figure 2 shows three CSI maps at Al-corner with Cu wt% as abscissa and Mg wt% as ordinate. The content of Si varies from 0.2 wt% (Figure 2a) to 0.6 wt% (Figure 2b), and to 1.2 wt% (Figure 2c). The amounts of Fe and Mn are fixed at 0.6 wt% and 0.5 wt%, respectively. As is clearly demonstrated in Figure 2, Si plays an important role in reducing the cracking susceptibility of AA2xxx alloys. Increasing Si from 0.2 wt% to 0.6 wt% helps to push the composition region with high cracking susceptibility to lower Cu and lower Mg compositions (Figure 2a vs. Figure 2b), while further increasing of Si to 1.2 wt% reduces the highest CSI from 10 to ~6 (Figure 2b vs. Figure 2c). Another interesting phenomenon observed is that adding minor elements Si, Fe, and Mn tends to divide one large composition region with high CSI (the red area in Figure 1a) into two small regions (the yellow areas in Figure 2a,b). Higher Si tends to further segregate these two regions.
The CSI maps, as shown in Figure 2, can be used to compare the cracking susceptibility of some AA2xxx commercial alloys. To do so, some of these commercial alloys are marked in Figure 2a–c. Each rectangular frame outlines the composition spec range of the major alloying elements (Cu and Mg) of the corresponding alloy. It is interesting to see that except for alloy 2037 (Figure 2b), whose spec range touches the region that is most vulnerable to hot cracking, all the other alloys stay away from such areas. In addition to 2037, it is seen from these figures that 2010, 2002, 2036, and 2618 seem to be more vulnerable to hot cracking than other AA2xxx alloys. While these maps provide useful guidance for us to evaluate and compare the cracking susceptibility of AA2xxx series of alloys, these 2D maps only allow us to view composition variations of two components. One should keep in mind that these maps were built at fixed compositions for the minor elements and should be used wisely as the compositions of the minor elements also vary in the commercial alloys. For example, the Si content in AA2002 varies in the range of 0.35 to 0.8 wt%. This alloy is marked in Figure 2b which was established with Si fixed at 0.6 wt%. For a particular AA2002 alloy, it could be more susceptible or less susceptible to hot cracking than that indicated by Figure 2b depending on the exact content of Si in the alloy.
To reveal the effects of Fe and Mn, calculations were performed for a series of alloys in the Al-1.2Si-xCu-yMg (wt%) composition range, and the CSI map is shown in Figure 2d. By comparing Figure 2c and Figure 2d, it is seen that the cracking susceptibility is slightly reduced when Fe and Mn are removed from the AA2xxx alloys.

3.2. Hot Cracking Susceptibility of AA6xxx Series

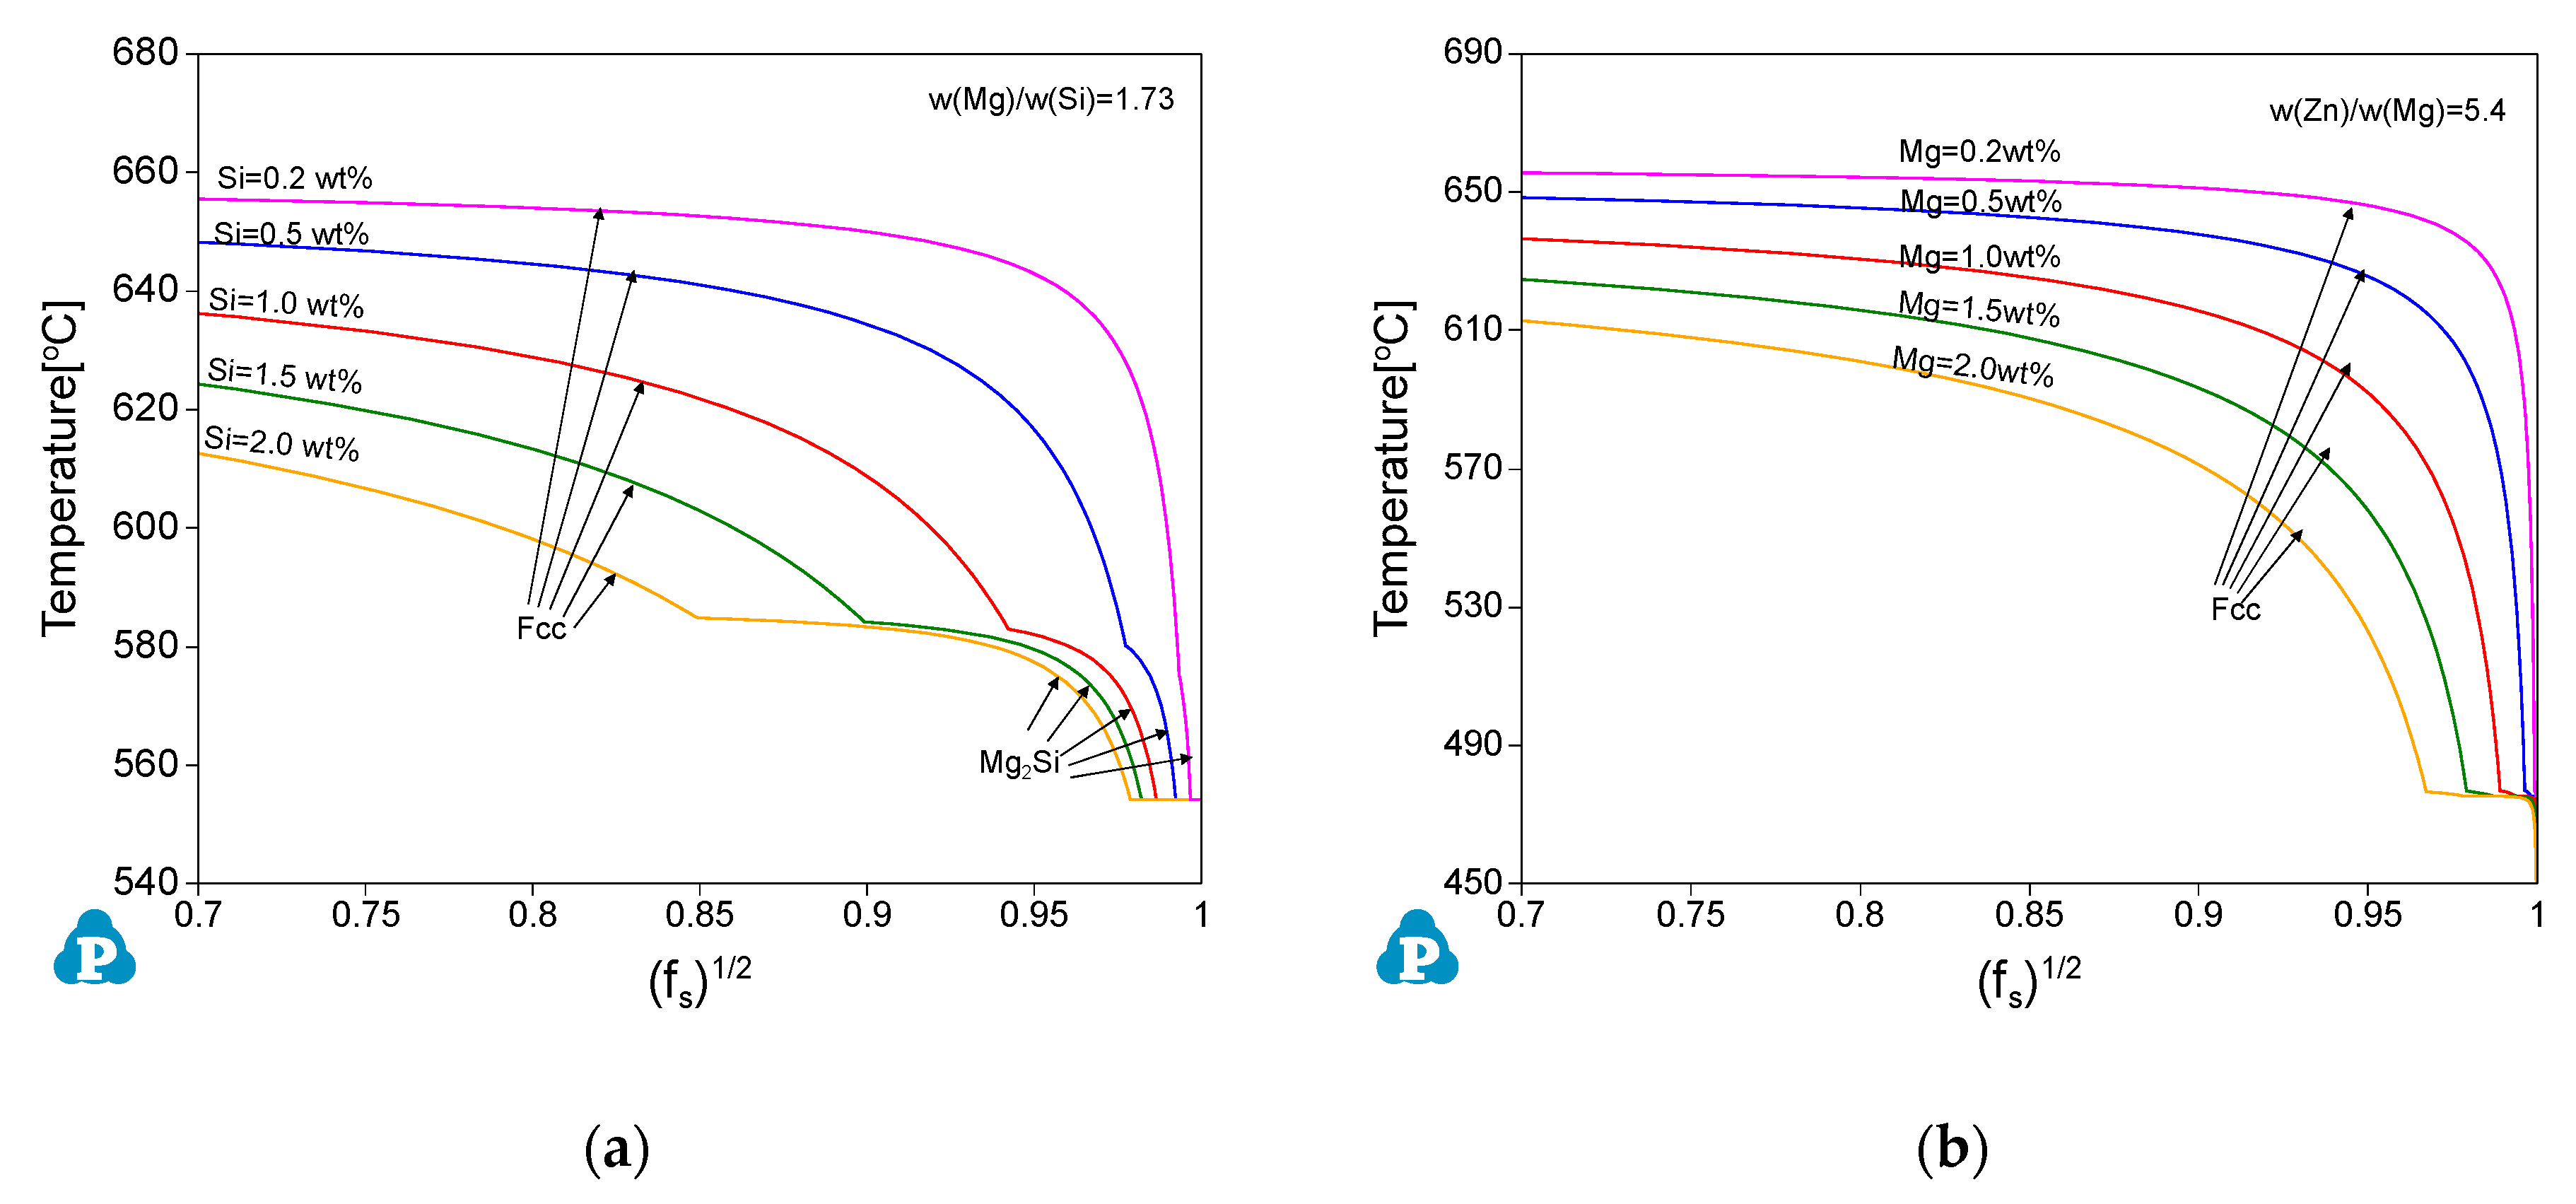
3.2.1. The Al-Mg-Si Ternary System

The major alloying elements in the AA6xxx series of alloys are Si and Mg. Although, as major alloying elements, their amounts are low and rarely exceed 1.2 wt% Mg and 1.5 wt% Si in most AA6xxx alloys, this series of alloys are strengthened due to the formation of Mg2Si precipitates. As w ( Mg ) / w ( Si ) of this compound is approximately 1.73, the addition of Mg and Si usually falls near this ratio to maximize the formation of Mg2Si precipitates. When the ratio is lower than 1.73, excess Si helps to produce higher strength and high formability while leads to less satisfied corrosion resistance. When the ratio is higher than 1.73, excess Mg helps to increase the corrosion resistance but reduces strength and formability.
The susceptibility to solidification cracking in both Al-Si and Al-Mg binary systems shows a Λ shape. In the Al-Si binary, the peak is quickly reached by adding small amount of Si. The reported composition with highest cracking susceptibility in Al-Si is at 0.7 wt% Si [49]. On the other hand, the composition of peak cracking observed in binary Al-Mg alloys varies substantially between 2 wt% Mg [53] and 5 wt% Mg [50]. In this work, the CSI values for a series of alloys in the ranges of Al-10 wt% Si and that of Al-10 wt% Mg were calculated by Scheil model and improved Scheil model considering back diffusion in the solid under the cooling rate of 100 °C/s and 20 °C/s, respectively, as shown in Figure 3. Although similar trend is shown in both figures, i.e., back diffusion in the solid tends to reduce cracking susceptibility and move the cracking peak to higher content of the alloying element, the difference between these two binary systems is obvious. In the Al-Si binary, the effect of back diffusion in the solid is less significant, which moves the cracking peak from 0.375 wt% Si to 0.75 wt% Si and reduces the peak CSI value from 7.5 to 4.5. In the Al-Mg binary, back diffusion in the solid shows significant impact on both the CSI value and the position with highest cracking susceptibility. The cracking peak is at 2.5 wt% Mg when no back diffusion is considered, while it moves to 5.5 wt% Mg when back diffusion is taken into account and the cooling rate is 100 °C/s. The simulated results for these binary systems are in line with the experimental observations.
In the Al-Mg-Si ternary system, the composition that is most vulnerable to hot cracking is near Al-0.4 wt% Mg-0.5 wt% Si based on the results of cracking susceptibility tests using the ring-casting method [55]. Liu and Kou [24] calculated the cracking susceptibility maps of the Al-Mg-Si ternary system using their criterion for three solidification simulation conditions: no back diffusion in the solid, with back diffusion under the cooling rate of 100 °C/s and 20 °C/s, respectively. Their simulated results demonstrated that the one considering back diffusion in the solid under the cooling rate of 100 °C/s showed best agreement with the experimental tested data. In this work, we performed simulations for 441 alloys in the Al-5 wt% Mg-5 wt% Si composition range to obtain their CSI values under the cooling rate of 20 °C/s. Figure 4a is the hot cracking susceptibility map constructed using the calculated CSI values, and Figure 4b shows tested data from in [55] for the Al-Mg-Si system.
An interesting feature shown in Figure 4a is that the composition area that is most vulnerable to solidification cracking seems to have a tail pointing to the direction at certain w ( Mg ) / w ( Si ) ratio. The tail area shown in Figure 4a covers w ( Mg ) / w ( Si ) = 1.6 ~ 2.0 . As w ( Mg ) / w ( Si ) of the Mg2Si compound is approximately 1.73, this tail seems to indicate that the hot cracking problem becomes severe when the contents of Mg and Si are just enough to form Mg2Si compound but decreases with excess of either Mg or Si content.

3.2.2. Commercial AA6xxx Alloys

Copper is also an important alloying element for AA6xxx. The amount of Cu in AA6xxx is usually in the range of 0.2 to 0.4 wt%, while in some alloys it can be as high as 1.2 wt%. Copper provides substantial increases in strength by facilitating solid solution strengthening and precipitation hardening. On the other hand, addition of Cu indeed increases the cracking susceptibility in AA6xxx alloys. Figure 5 shows five CSI maps at Al-corner with Si wt% as abscissa and Mg wt% as ordinate. In Figure 5a–c, the amounts of Fe, Mn, and Zn are fixed at 0.6 wt%, 0.5 wt%, and 0.2 wt%, respectively, while three levels of Cu content (0.2 wt%, 0.5 wt%, and 1.2 wt%) are used to show the effect of Cu on hot cracking of AA6xxx alloys. As is clearly demonstrated in Figure 5a–c, Cu can significantly increase the cracking susceptibility of AA6xxx alloys. It is also seen that Cu pushes the tail with w ( Mg ) / w ( Si ) ratio close to that of the Mg2Si compound to the area richer of Mg. Figure 5d,e is constructed by keeping Cu the same level as that of Figure 5c, while Fe and Mn are excluded in the calculation for building Figure 5d and Zn is also removed for Figure 5e. These two figures are used to understand the effects of minor alloying elements (Fe, Mn, and Zn) on the cracking susceptibility of AA6xxx alloys. By comparing Figure 5d with Figure 5c, it is seen that removing Fe and Mn from the alloys will in general reduce the cracking tendency of AA6xxx alloys. Similar trend is also seen in AA2xxx series of alloys. However, Figure 5e shows that removing the minor amount of Zn from the alloys will increase the cracking susceptibility in some areas.
The CSI maps as shown in Figure 5 can be used to compare the cracking susceptibility of AA6xxx commercial alloys. Again, some commercial AA6xxx alloys are marked in Figure 5a–c with a rectangular outlining the composition spec range of the major alloying components for the corresponding alloy. It is seen that most of these alloys indeed locate in the region near the w ( Mg ) / w ( Si ) = 1.73 ratio to maximize the formation of Mg2Si precipitates and develop better strength. With lower Cu content (<0.5 wt%), this region exhibits higher CSI than the surrounding areas as shown in Figure 5a,b. Although hot cracking tendency gets worse with higher Cu content (1.2 wt%), the composition tail which is most vulnerable to hot cracking is pushed to higher Mg region and leave commercial AA6xxx alloys in the safe area as shown in Figure 5c. Again, one should keep in mind that these maps were built at fixed compositions for the minor elements; therefore, they should be used wisely to evaluate the cracking susceptibility of a certain alloy. For example, AA6092 contains 0.7–1.0 wt% Cu. Figure 5b is for 0.5 wt% Cu and Figure 5c is for 1.2 wt% Cu. The cracking susceptibility of AA6092 will be underestimated by Figure 5b and overestimated by Figure 5c, therefore both maps should be used to give a reasonable evaluation on the cracking tendency of this alloy.
Moreover, note that the maximum CSI value in Figure 4 and Figure 5 is 7, which means that the color varies from blue to red when CSI varies from 0 to 7. The purpose is to clearly demonstrate the composition effect on the cracking susceptibility in the same series of aluminum alloys, i.e., AA6xxx alloy. These color maps cannot be directly compared with those for AA2xxx alloys since the maximum CSI indexes in the two series are different. This point will be discussed in the Discussion section.

3.3. Hot Cracking Susceptibility of AA7xxx Series

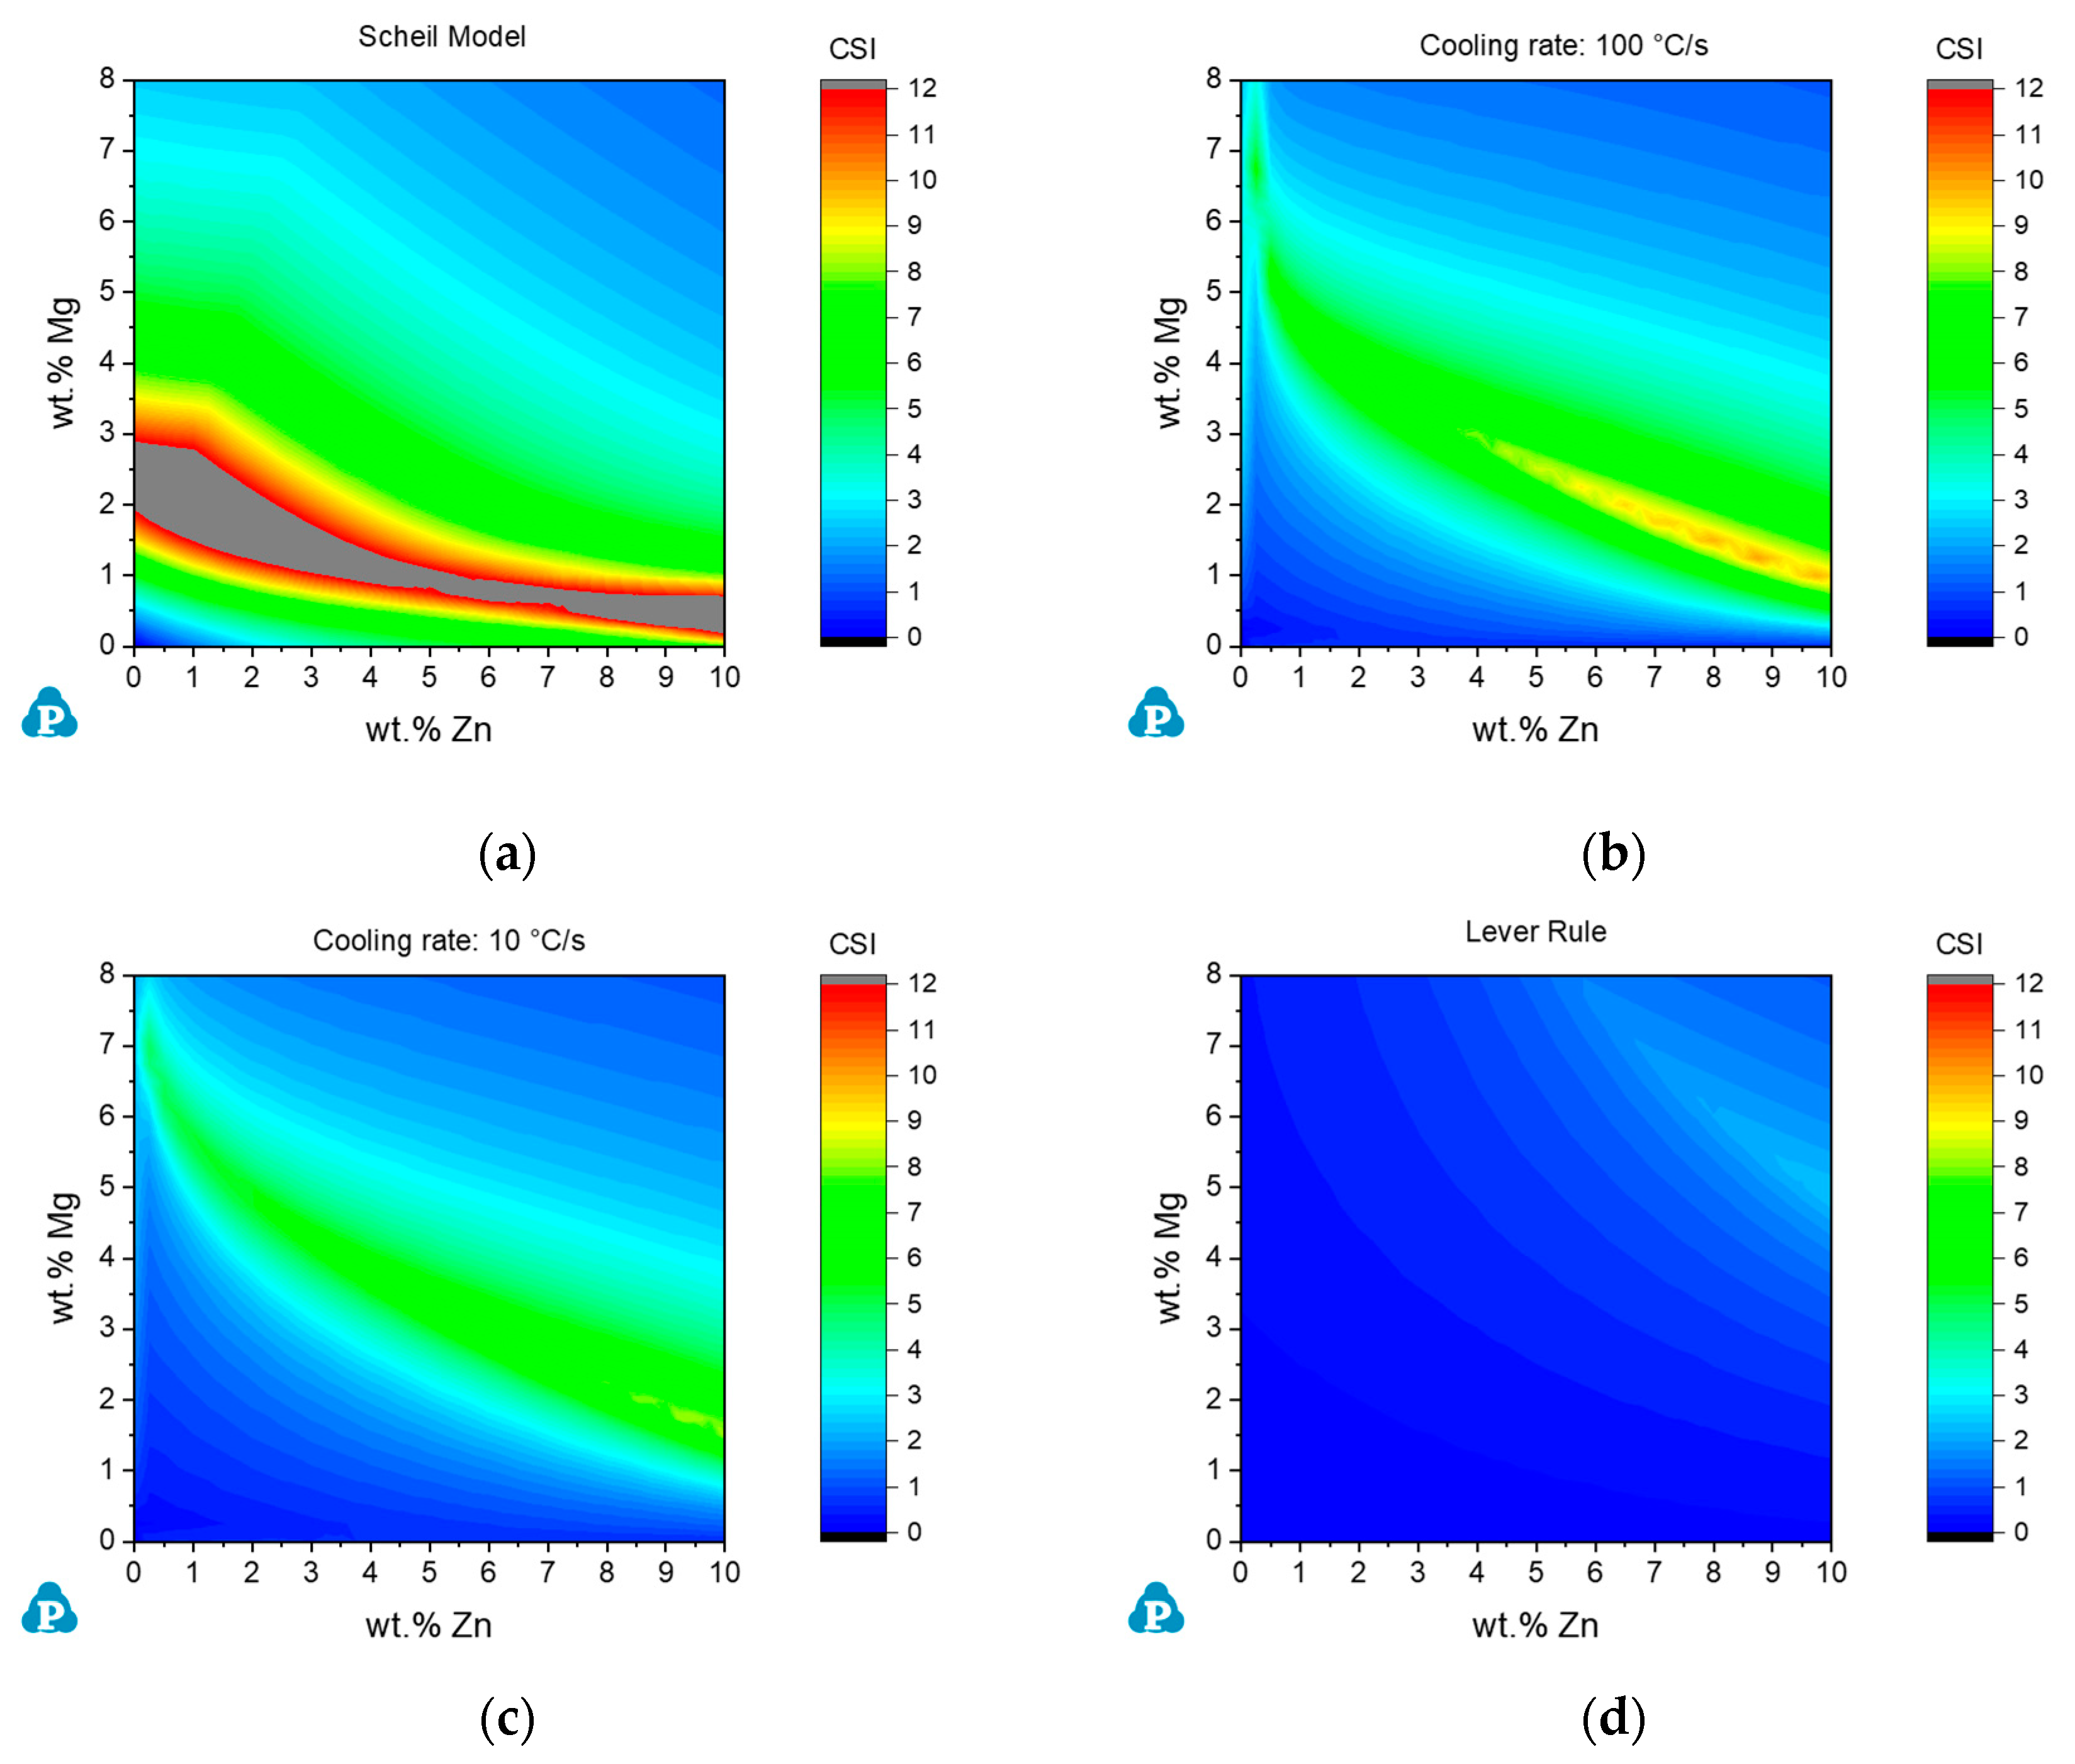
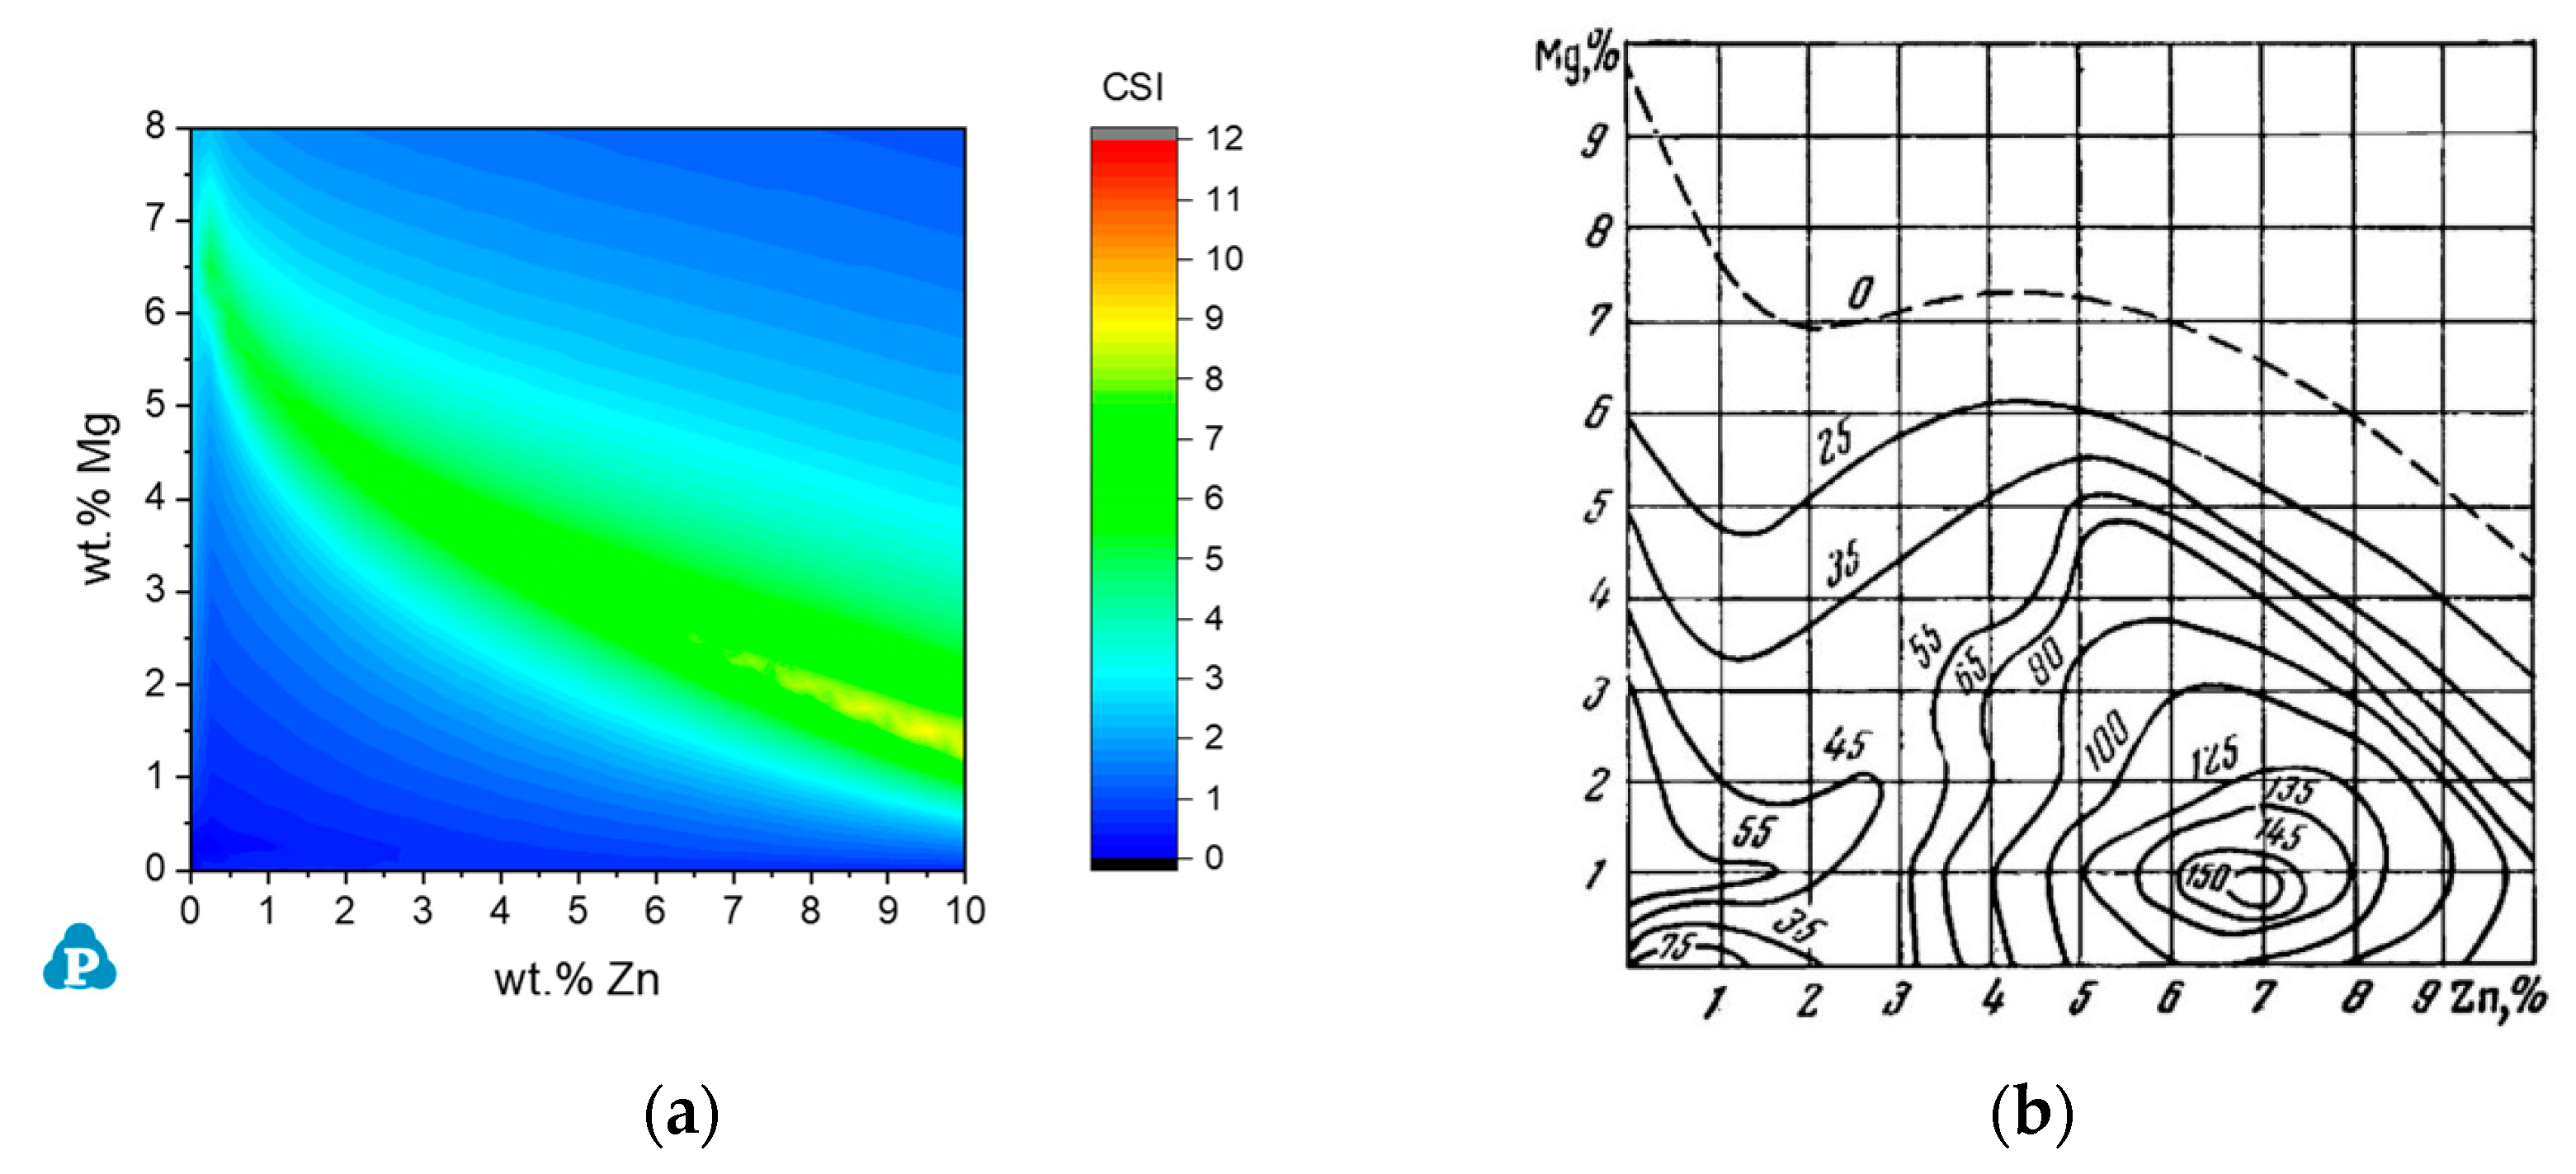
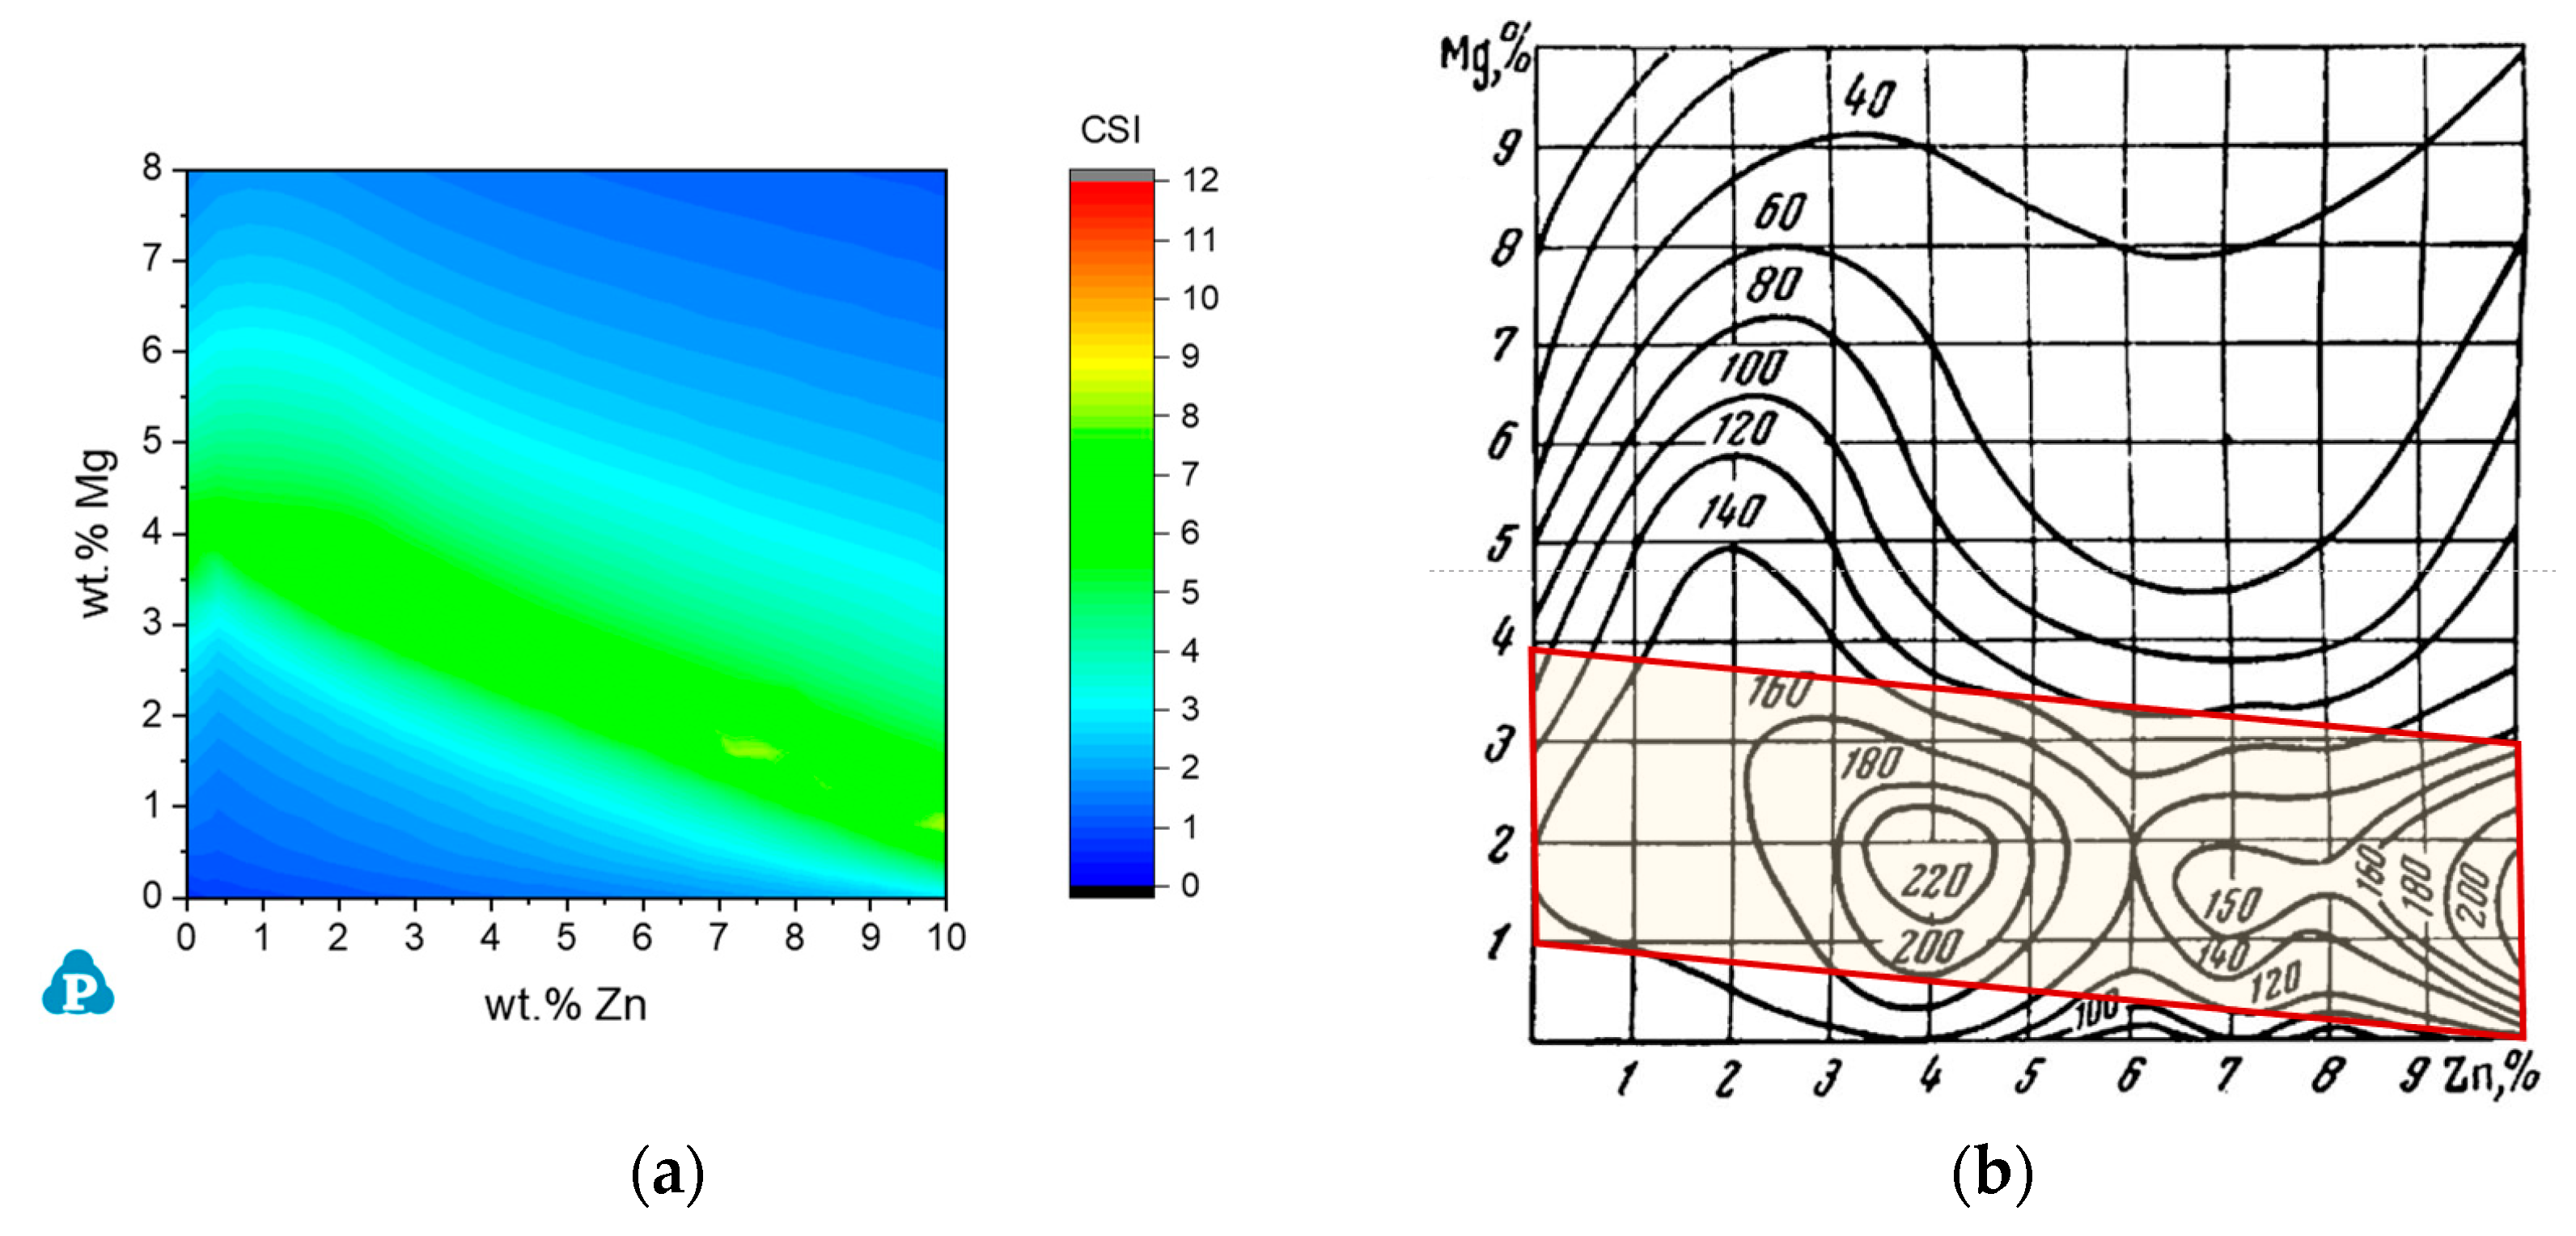
3.3.1. The Al-Zn-Mg System

The major alloying elements in AA7xxx series of alloys are Zn and Mg. The content of Zn may vary from 3 to 10 wt%, while Mg is in the range of 0.7 to 3.4 wt%. The major strengthening phase for this series of alloys is MgZn2. AA7xxx alloys usually have high specific strength, high specific stiffness, high toughness, and excellent processing and welding performance. The susceptibility to solidification cracking in Al-Mg binary shows a Λ shape and the peak cracking observed varies substantially as has been demonstrated in the previous section for AA6xxx alloys. The hot cracking susceptibility in Al-Zn binary is not common. As demonstrated in Liu and Kou’s paper [21], the peak cracking was predicted to occur at 10.5 wt% Zn if no back diffusion in the solid is considered. When back diffusion in the matrix is considered, no peak cracking is observed up to 20 wt% Zn. In other words, the crack susceptibility continues to increase with rising Zn content to 20 wt%, which is consistent with the crack susceptibility curve shown by Pumphrey and Lyons [49]. In this work, simulations are performed for the Al-Zn-Mg system using improved Scheil model considering back diffusion in the solid under the cooling rate of 20 °C/s. The calculated CSI map is shown in Figure 6a. The tested data [56] are also shown in Figure 6b for comparison. As is seen, the tested data show that the region most vulnerable to hot cracking is around the composition of Al-7Zn-1Mg (wt%), while the simulated one shows a narrow yellow composition stripe that is more susceptible to hot cracking.

3.3.2. The Al-Mg-Zn-Cu System

A considerable amount of Cu is added to many AA7xxx alloys to obtain higher strength. This group of AA7xxx alloys are generally called ultra-high-strength aluminum alloys. The cracking susceptibility map of Al-Zn-Mg with 0.5 wt% Cu is calculated by the improved Scheil model considering back diffusion in the solid under the cooling rate of 20 °C/s. It is compared with the experimentally tested data [56] as shown in Figure 7.
By comparing the experimentally tested data [56] of Figure 6b and Figure 7b, it is seen that the addition of 0.5% Cu can significantly impair the hot cracking behavior of Al–Zn–Mg alloys. First, the cracking index increases in the entire composition range, i.e., Al-0–10Mg-0–10Zn (wt%), as shown in these figures. Second, the cracking peak around the composition of Al-7Zn-1Mg (wt%) was separated into two peaks, one at approximately 1.5% Mg and 4% Zn, and the other at approximately 1.5% Mg and 10% Zn. This means that addition of copper widens the composition range of Zn that is more vulnerable to hot cracking. By comparing the simulation results of Figure 6a and Figure 7a, it is seen clearly that the composition region that is vulnerable to cracking is widened and extended to lower Zn composition. At first glance, the simulated hot cracking map in Figure 7a does not seem to correspond with the experimentally observed one in Figure 7b. However, if we draw a line between 0Zn-1Mg and 10Zn-0Mg, and another line between 0Zn-4Mg and 10Zn-3Mg to form a band in Figure 7b, it seems that the cracking susceptibility in this composition band is in general higher than that outside this band. This is what is clearly seen from the simulated cracking map. The difference is that the band obtained by simulation moves to higher Mg composition.

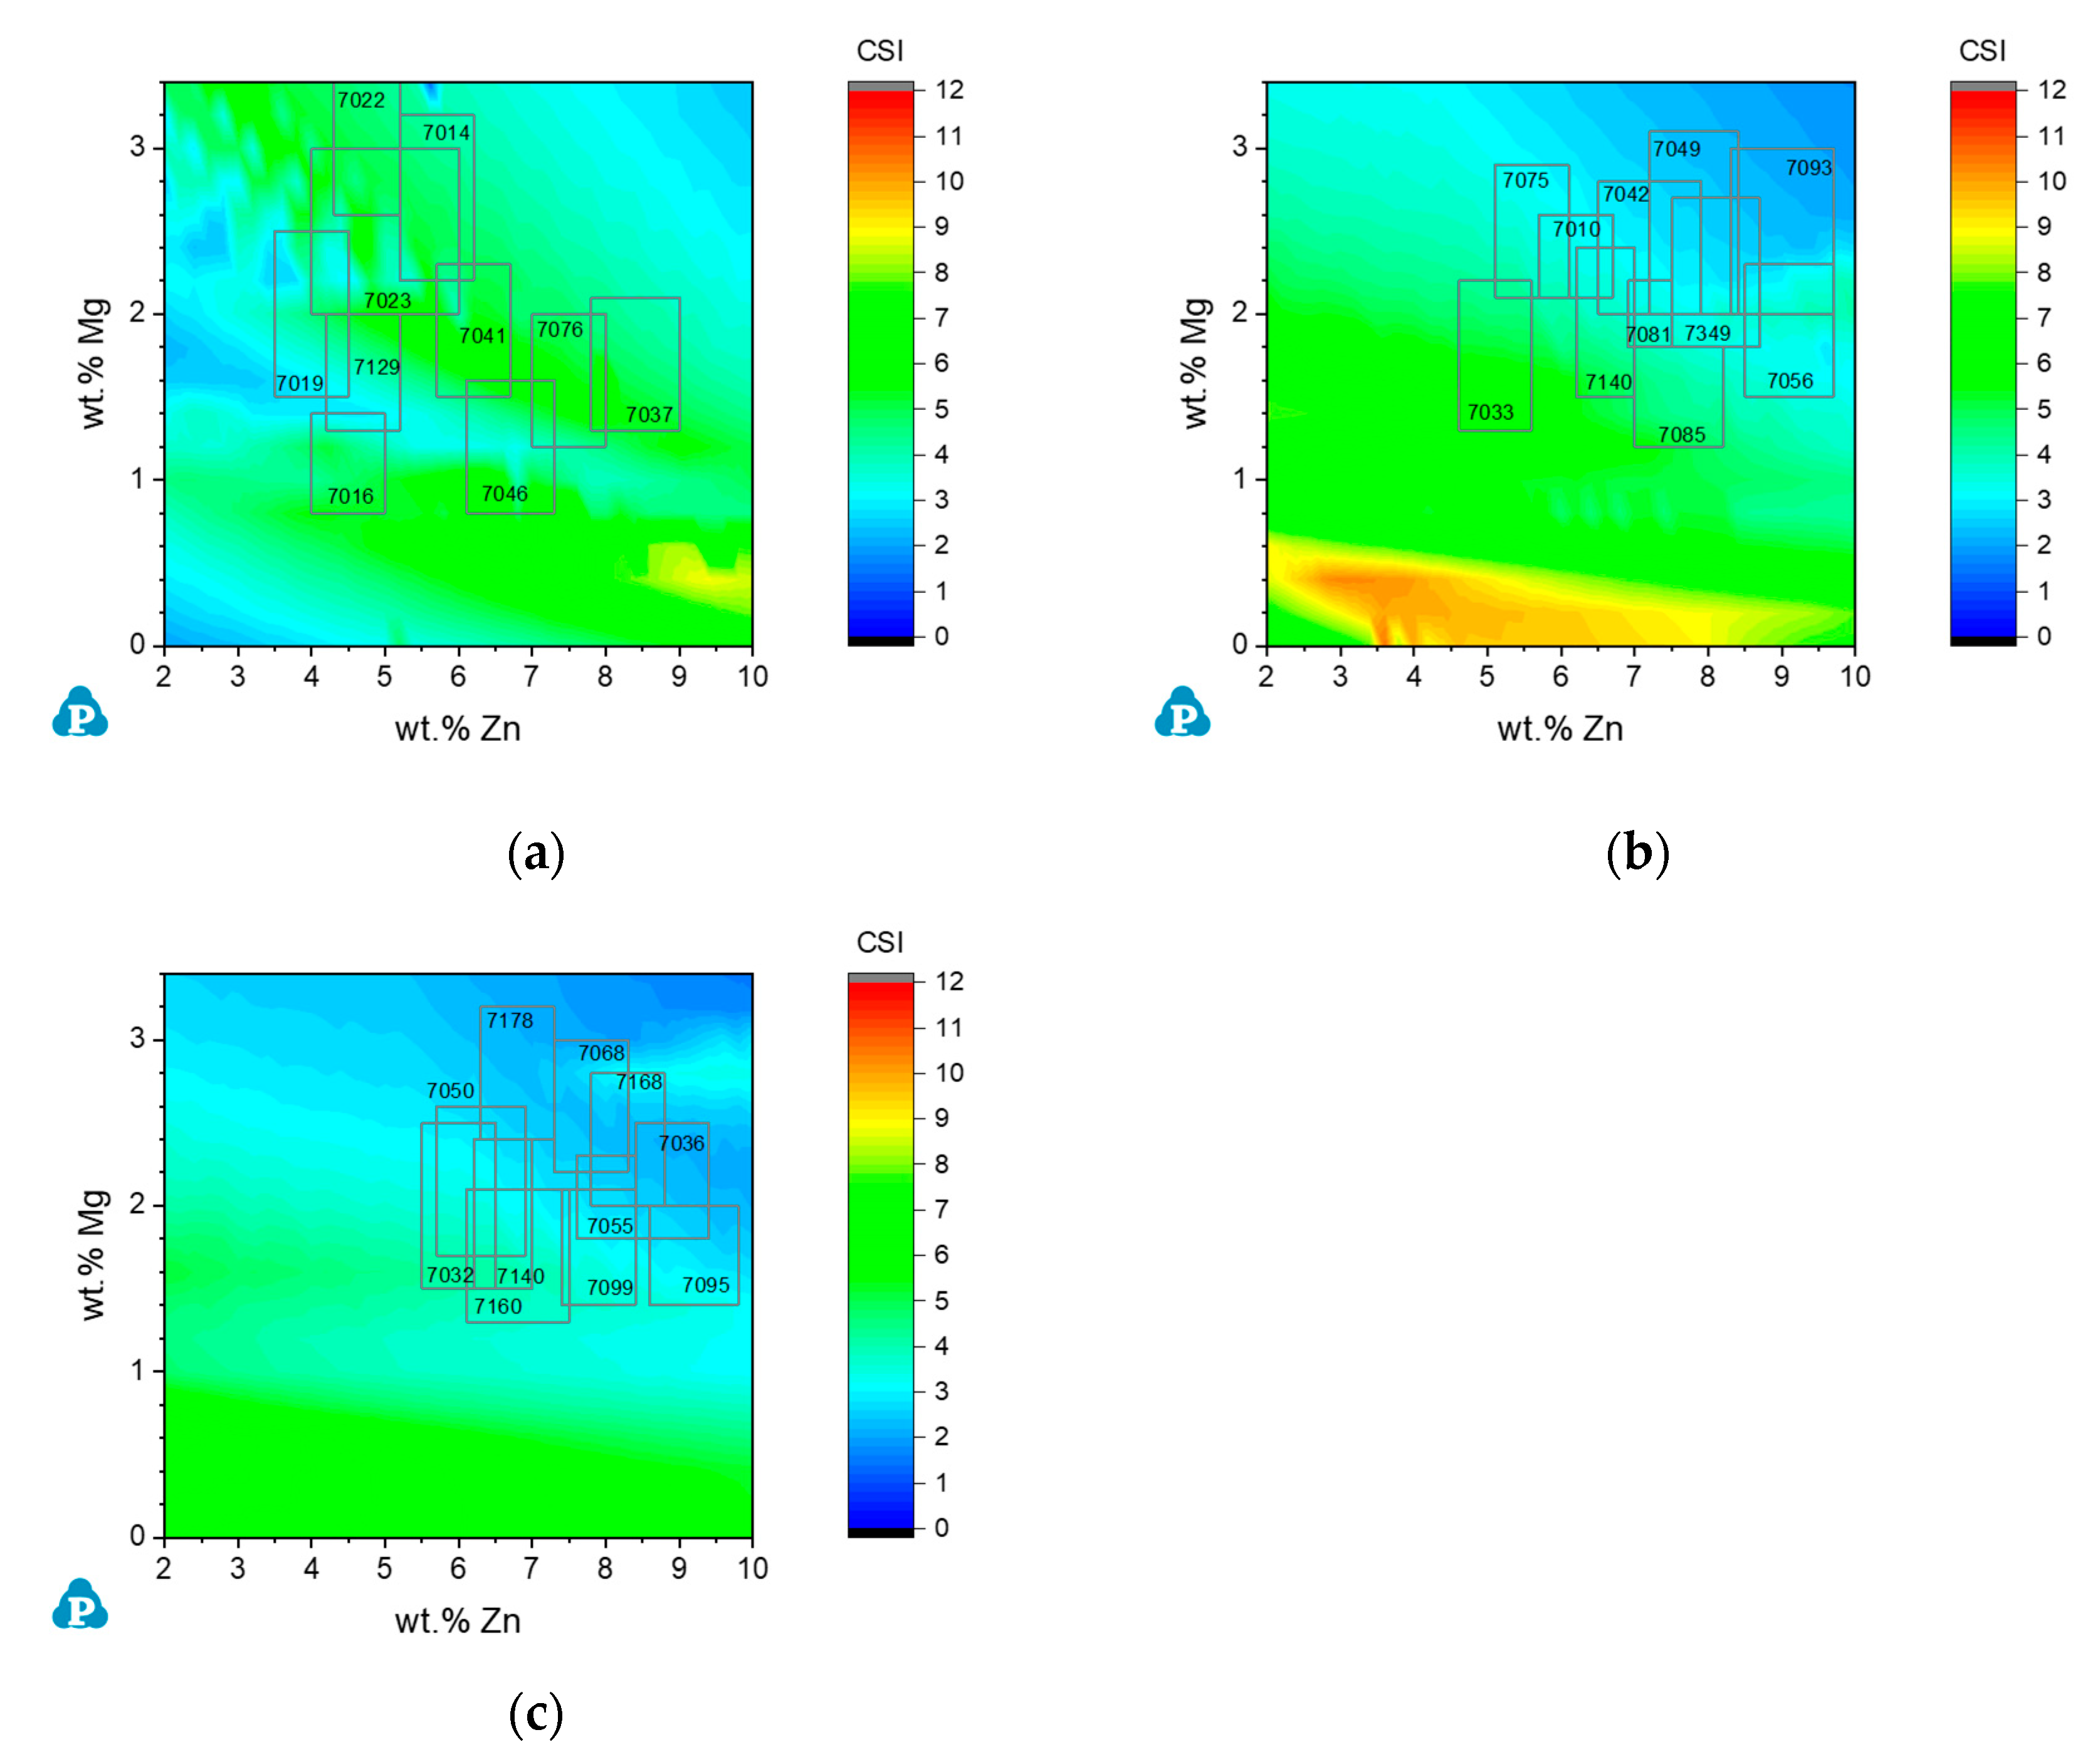
3.3.3. Commercial AA7xxx Alloys

In addition to the major alloying elements Zn, Mg, and Cu, minor alloying elements and impurities in AA7xxx include Si, Fe, Mn, and some other trace elements. It is interesting to compare the cracking susceptibility of these AA7xxx alloys using the CSI maps. Figure 8 shows three calculated CSI maps at Al-corner with Zn wt% as abscissa and Mg wt% as ordinate. The content of Cu varies from 0.5 wt% (Figure 8a) to 1.5 wt% (Figure 8b), and to 2.2 wt% (Figure 8c). The amounts of Si, Fe, and Mn are fixed at 0.2 wt%, 0.3 wt%, and 0.2 wt%, respectively. By comparing Figure 8a with Figure 7a, it is seen that the effects of small amounts of minor alloying elements and impurities cannot be ignored. Small amounts of Si, Fe, and Mn divide the single composition band (as shown in Figure 7a) which is more susceptible to cracking into two areas as shown in Figure 8a. When Cu content increases from 0.5 wt% to 1.5 wt%, the following phenomena are observed. First, the CSI increases in the composition region where Mg content is below 2 wt%, while decreases at the corner with high Mg and Zn contents. Second, although the maximum CSI is higher with higher Cu content (1.5 wt% Cu), the most vulnerable region is pushed to the area with very low Mg content. When Cu content goes even higher, i.e., 2.2 wt% as shown in Figure 8c, the CSI is significantly reduced as compared to that in Figure 8b. The compositions of some commercial AA7xxx alloys are marked in Figure 8a–c. Each alloy has a spec range as shown by a rectangular frame. It is noticed that most of the alloys that contain higher Cu (1.5 wt% or 2.2 wt%) also contain higher Zn and higher Mg; therefore, they tend to locate in the composition area where CSI is low as shown in Figure 8b,c. This is particularly significant for alloys containing 1.5 wt% Cu. On the other hand, those alloys with lower Cu content (0.5 wt%) tend to distribute in wider Zn and Mg composition ranges as shown in Figure 8a. For the selected commercial AA7xxx alloys marked on Figure 8a–c, it is seen that those with higher Cu (2.5 wt%) are least vulnerable to cracking, while those containing lower Cu (0.5 wt%) are more vulnerable to cracking.

4. Discussion

There is no simple answer as to what the cause of hot cracking is. Solidification is a complicated process and there are many factors that work together to cause the cracking. As indicated in the review paper by Eskin et al. [4], these factors include freezing range, dihedral angle, strain, and strain rate. In this study, we applied Kou’s criterion [18] to three series of aluminum alloys: AA2xxx, AA6xxx, and AA7xxx. Cracking susceptibility of each series of alloys has been understood through the CSI maps focusing mainly on the composition effects of major and some minor alloying elements. In this section, simulation results will be discussed by considering other factors, such as cooling rate. Comparison of cracking susceptibility among different series of alloys will also be discussed.

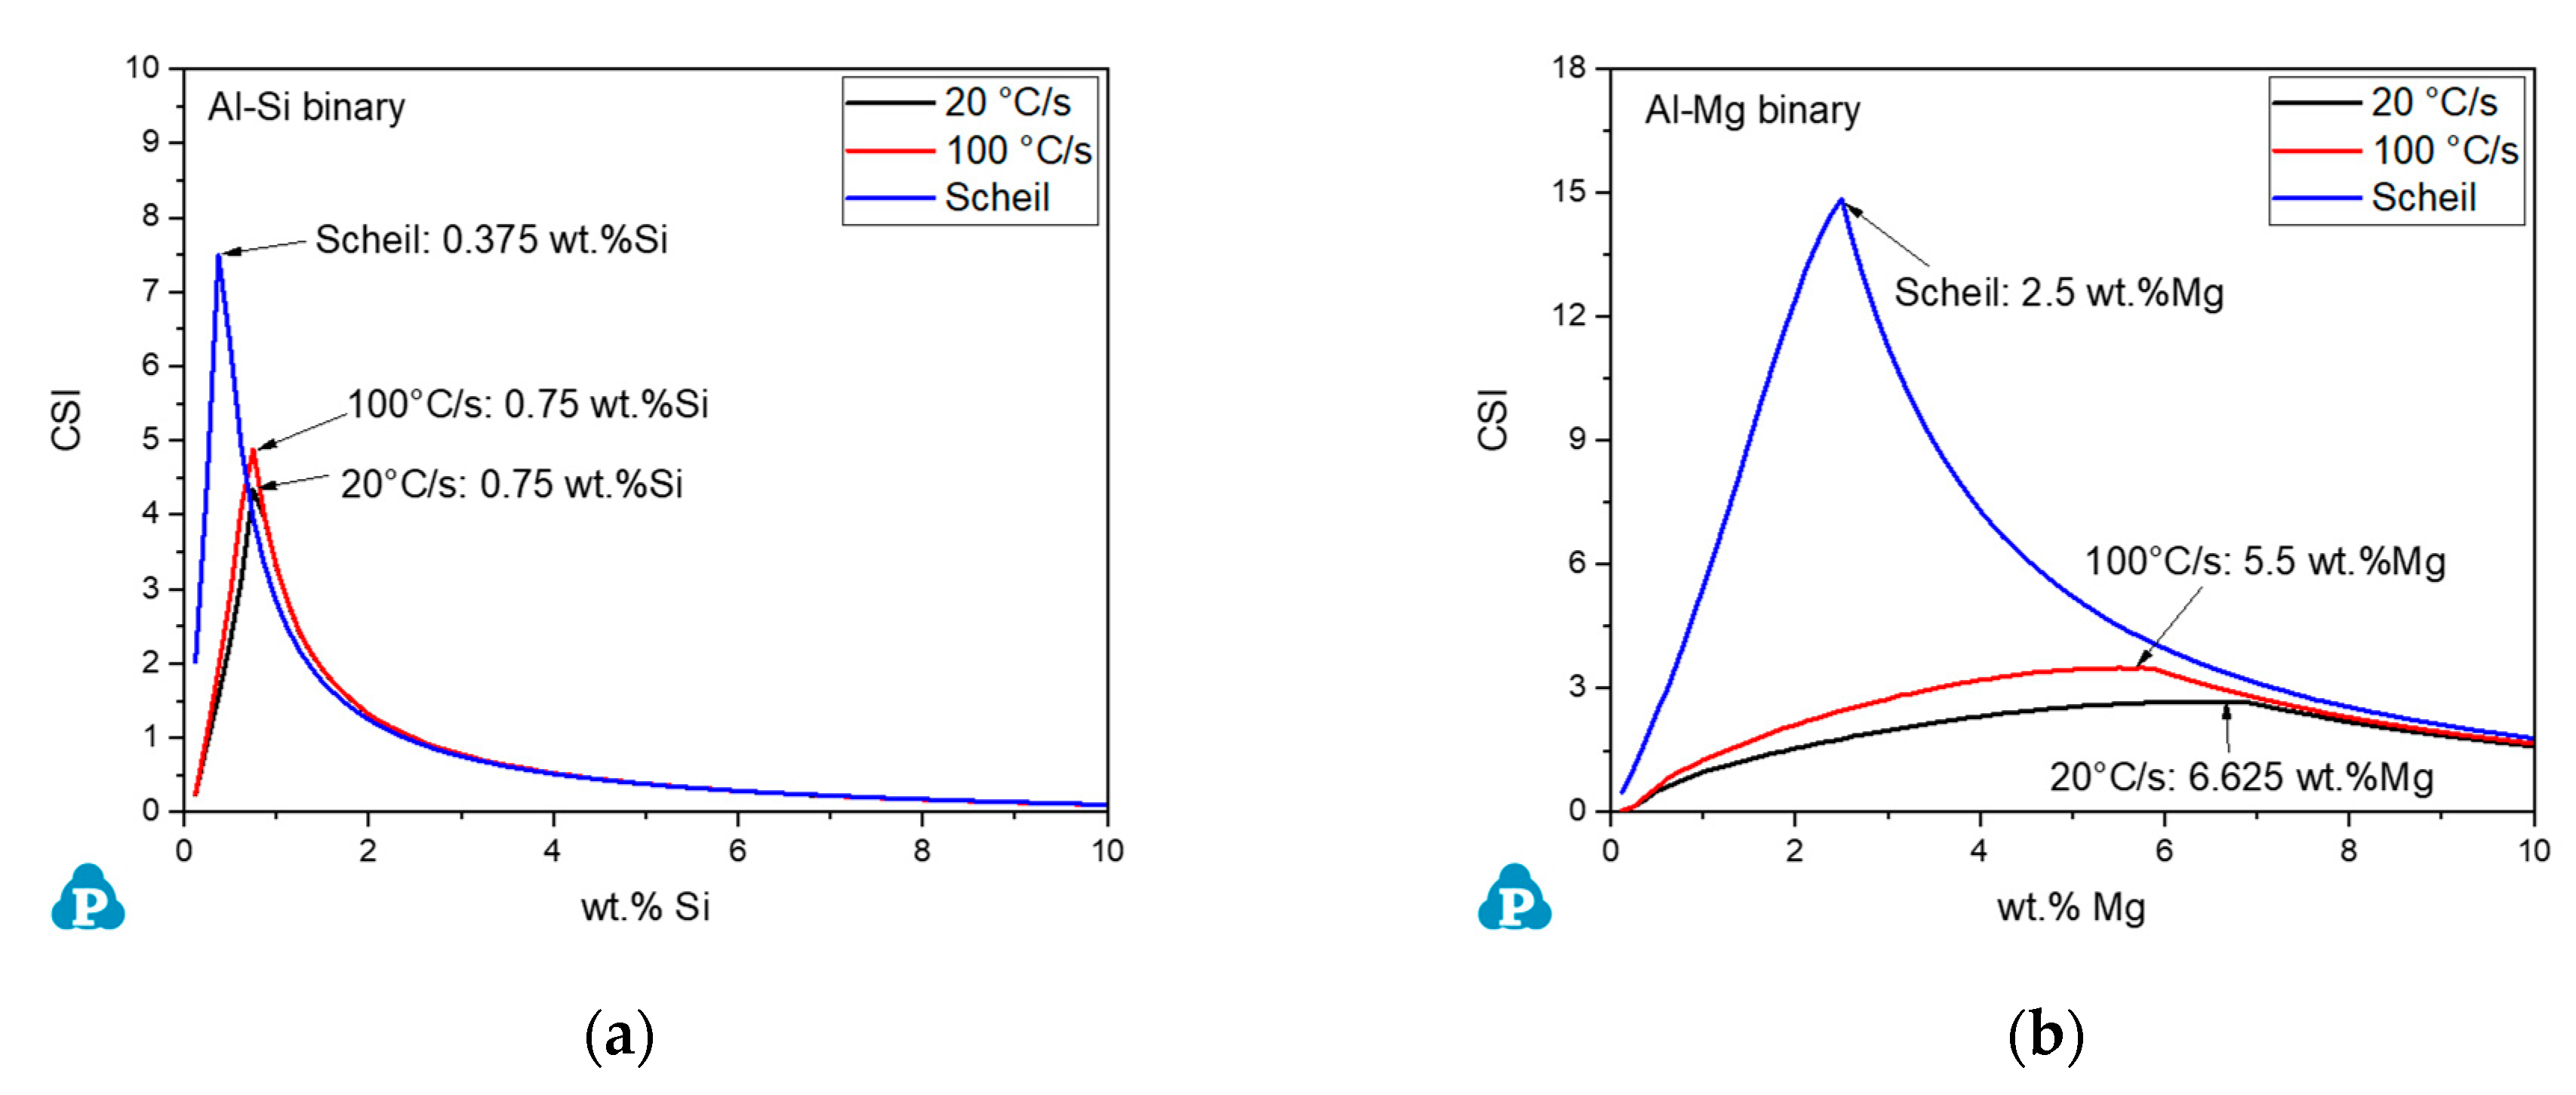
4.1. Effect of Cooling Rate

To understand the effect of cooling rate on cracking susceptibility, simulations are performed for the Al-Zn-Mg system for four solidification simulation conditions: no back diffusion in the solid (Scheil model), with back diffusion under the cooling rate of 100 °C/s and 10 °C/s, respectively, and completely mixing in solid (lever rule) as shown in Figure 9. In this figure, Scheil model simulation represents fast cooling that elements have no chance to back diffuse in the solid, while lever rule simulation represents very slow cooling that diffusion in the solid is complete. The simulated cracking map using Scheil model shows a big composition area with extremely high cracking susceptibility as shown in Figure 9a. The area with gray color means that the CSI value in this area exceeds the maximum index, which is 12 in Figure 9. With the improved Scheil model considering back diffusion in the solid, the cracking susceptibility is significant reduced as shown in Figure 9b,c. The stripe that is most susceptible to cracking follows the composition line from 6Zn-2Mg to 10Zn-1Mg. Higher cooling rate (100 °C/s) leads to slightly higher CSI. The CSI calculated by lever rule is the lowest among all cases. As is seen, back diffusion in the solid plays a significant role in reducing the hot cracking susceptibility. With normal cooling rates, such as between 100 °C/s and 10 °C/s, the cooling rate effect on the solidification cracking susceptibility is not significant.

4.2. Comparison among AA2xxx, AA6xxx, and AA7xxx Alloys

Note that the color scheme adopted for each series of alloys is from deep blue (CSI = 0) to deep red (maximum CSI in the series). This color contrast allows easy comparison of cracking susceptibility for alloys in the same series. However, special attention is needed when comparing cracking susceptibility for alloys from different series. In this paper, the maximum CSI is 12 in both AA2xxx and AA7xxx series of alloys, therefore one can compare these two series of alloys directly by the color of the CSI maps. This is not the case for the AA6xxx series, in which the maximum CSI is 7. On the other hand, as the CSI values are calculated according to the same standard in the entire paper, these values can be compared directly between alloys in different series. From Figure 2, Figure 5, and Figure 8, it is seen that most AA6xxx alloys locate in the composition areas where CSI varies in the range of 3~5, while most AA2xxx and AA7xxx alloys locate in the areas with CSI in the range of 3~8. In this sense, AA6xxx alloys are more resistant to hot cracking among the three series of aluminum alloys.
As mentioned in Section 3.2, an interesting phenomenon observed in the Al-Mg-Si system (AA6xxx series) is that an alloy is more prone to solidification cracking if the Mg/Si alloying ratio in the alloy falls near to the ratio of the Mg2Si compound (~1.73). A composition band formed by w ( Mg ) / w ( Si ) = 1.6 2.0 shows higher CSI as is clearly seen in Figure 4a and Figure 5a,b. As Mg2Si is the major strengthening phase of AA6xxx, many commercial alloys of this series fall in this band area to maximize the formation of Mg2Si precipitates. However, the question is why such a phenomenon was not observed in AA7xxx series of alloys which are strengthened by MgZn2. In other words, why is a composition zone with high CSI not observed in Al-Mg-Zn ternary along the direction of w ( Zn ) / w ( Mg ) = 5.4 ? To explain this difference, solidification paths are simulated by Scheil model for a series of Al-Mg-Si alloys along w ( Mg ) / w ( Si ) = 1.73 and a series of Al-Mg-Zn alloys along w ( Zn ) / w ( Mg ) = 5.4 . By Kou’s definition [18], C S I = max | d T / d ( f s ) 1 / 2 | , which is the maximum slope of the solidification curve. The solidification paths of the Al-Mg-Si alloys are all featured with primary Fcc phase followed by the Mg2Si phase, and maximum slope always happens in the segment when Mg2Si solidifies as shown in Figure 10a. In other words, the Mg2Si phase which forms at the later stage of solidification plays an important role in determining the cracking tendency of the Al-Mg-Si alloys. This is not the case for the Al-Mg-Zn alloys. As is seen in Figure 10b, MgZn2 forms at extremely late stage of solidification ( ( f s ) 1 / 2 > 99 % ) when Mg and Zn contents are low. Although MgZn2 may form sooner when the contents of Mg and Zn are higher, the solidification curve segment for this phase is flat. The CSI for the Al-Mg-Zn alloys is determined by the solidification curve of the Fcc phase instead of the MgZn2 phase. Therefore, no higher cracking tendency is observed in the Al-Mg-Zn system along the direction of forming the MgZn2 phase.

4.3. Effect of Minor Elements on Hot Cracking Behavior of Multi-Component Alloys

As is shown in Section 3, the effects of minor alloying elements, such as Fe, Mn, and Zn, on solidification cracking should not be ignored. In the review paper by Eskin et al. [4], it is indicated that the addition of Ti can significantly reduce the hot cracking susceptibility of Al-Cu-Mg alloys and the most significant effect of Ti is at a magnesium content of 4 wt% [56]. We performed simulations at the cooling rate of 20 °C/s for a group of Al-xCu-4 wt%Mg alloys without Ti and with 0.2 wt% of Ti, respectively, as shown in Figure 11. As is seen, 0.2 wt% Ti has minor effect on the calculated CSI. This is because the criterion by Kou [18] is based on the T ( f s ) 1 / 2 curve. Therefore, the criterion can be used to study the composition effect only when the addition of the element affects the solidification path, i.e., the T ( f s ) 1 / 2 curve. If the addition of an element, even with minor amount, leads to the formation of a new phase which affect the solidification path, then the effect of this element can be significant and well described by the cracking criterion [18]; otherwise, its effect cannot be pinpointed. As indicated by Eskin et al. [4], a small amount of Ti was used to form Al3Ti intermetallic phase at the beginning of solidification and refine the grain size of the matrix solid phase in aluminum alloys. Zr is also found to have similar effect. Such effect cannot be reflected by the criterion used in this work.

5. Conclusions

In this work, the Cracking Susceptible Index (CSI) was used to investigate the cracking susceptibility of three series of aluminum alloys: AA2xxx, AA6xxx, and AA7xxx alloys. The CSI values for more than 1000 alloy compositions were calculated for each series of alloys to build the CSI maps. These maps can be used to understand the effects of major and minor elements on the cracking susceptibility of each series of aluminum alloys. For AA2xxx alloys, the major alloying elements are Mg and Cu. Alloys falling in the composition region Al-0.5–1.5Mg-1.5–2.5Cu (wt%) are more susceptible to hot cracking. Addition of Si can significantly reduce the cracking tendency of AA2xxx alloys. For AA6xxx alloys, Mg and Si are the major alloying elements, and Mg2Si is the major strengthening phase of this series of alloys. As w ( Mg ) / w ( Si ) 1.73 in this compound phase, the alloying ratio Mg/Si for many AA6xxx alloys usually falls near this ratio to maximize the formation of Mg2Si precipitates. An interesting finding of this work is that there is a composition band near this ratio that is more vulnerable to hot cracking. Addition of Cu can significantly impair the cracking resistant for some composition areas in the Al-0–5Mg-0–3Si (wt%) corner, many AA6xxx alloys with high Cu addition were clever enough to stay away from these areas. For AA7xxx alloys, Mg and Zn are the major alloying elements. Yet, the major strengthening phase for AA7xxx alloys, the MgZn2 phase, does not show similar effect to that of the Mg2Si phase in AA6xxx alloys. Addition of Cu impairs the cracking resistivity of some composition areas in the Al-0–3.5Mg-0–10Zn (wt%) corner to a certain level, after that higher Cu helps to improve the cracking resistivity in this composition region. It is also found that most of the AA7xxx alloys locate in the composition region that is less susceptible to solidification cracking.
The effect of back diffusion in the solid was demonstrated in this work. Scheil simulation, which assumes no back diffusion in the solid, demonstrated severe hot cracking susceptibility in large composition region. Lever rule simulation, which assumes complete diffusion in the solid, showed minimum cracking susceptibility. It is concluded that back diffusion can significantly improve the cracking susceptibility. The CSI maps built in this work were obtained by using improved Scheil model considering back diffusion in the solid under the cooling rate of 20 °C/s. Although the cooling rate may vary between a certain range in practice, it was found that the difference resulted by using 20 °C/s or 100 °C/s is not significant.
The effect of minor alloying elements was also demonstrated. It was concluded that the effect of minor alloying elements and impurities should not be ignored. The small amounts of Fe and Mn can slightly impair the cracking tendency of AA2xxx and AA6xxx. It is also concluded that the effect of a minor element can be exhibited only when the minor element can change the solidification path of the alloy. This is because the criterion we used is directly related to the solidification curve. If the effect of the minor element is due to other mechanism, its impact could not be exhibited using this criterion.
The alloy compositions of commercial aluminum alloys were carefully adjusted during the design and development process to meet the targeted properties. The castability is one of the important properties that must be addressed. The CSI maps calculated in this work seem to provide a good proof that these commercial alloys are wisely designed for their castability. While most of these alloys were developed by trial-and-error method, the CSI maps developed in this work can be used as a guidance for future developing work. With the help of these CSI maps, alloy compositions with good castability can be quickly identified. This work, therefore, demonstrates the power of the ICME concept and the simulation tools developed by the CALPHAD method.

Author Contributions

This work is conceptualized by F.Z., C.Z. and S.L.; it is based on the methodology of S.K., all the figures are produced by S.L.; the software is developed by S.C., W.C. and D.L.; it is written by F.Z., it is reviewed and edited by all co-authors. All authors have read and agreed to the published version of the manuscript.

Funding

This work is supported by CompuTherm’s internal fund.

Institutional Review Board Statement

Not applicable.

Informed Consent Statement

Not applicable.

Data Availability Statement

Not applicable.

Conflicts of Interest

The authors declare no conflict of interest.

References

  1. Flemings, M.C. Solidification Processing; McGraw-Hill: New York, NY, USA, 1974. [Google Scholar]
  2. Campbell, J. (Ed.) Castings, 2nd ed.; Butterworth-Heinemann: Oxford, UK, 2003. [Google Scholar]
  3. Kou, S. Welding Metallurgy, 3rd ed.; John Wiley: Hoboken, NJ, USA, 2020. [Google Scholar]
  4. Eskin, D.G.; Suyitno; Katgerman, L. Mechanical Properties in the Semi-Solid State and Hot Tearing of Aluminium Alloys. Prog. Mater. Sci. 2004, 49, 629–711. [Google Scholar] [CrossRef]
  5. Yan, X.; Lin, J.C. Prediction of Hot Tearing Tendency for Multicomponent Aluminum Alloys. Metall. Mater. Trans. B 2006, 37, 913–918. [Google Scholar] [CrossRef]
  6. Li, Y.; Li, H.; Katgerman, L.; Du, Q.; Zhang, J.; Zhuang, L. Recent Advances in Hot Tearing during Casting of Aluminium Alloys. Prog. Mater Sci. 2021, 117, 100741. [Google Scholar] [CrossRef]
  7. Prokhorov, N.N. Resistance to Hot Tearing of Cast Metals during Solidification. Russ. Cast. Prod. 1962, 2, 172–175. [Google Scholar]
  8. Feurer, U. Mathematisches Modell der Warmrissenigung von Binaeren Aluminiumlegierungen. Giesserei Forsch. 1976, 2, 75–80. [Google Scholar]
  9. Clyne, T.W.; Davies, G.J. The Influence of Composition on Solidification Cracking Susceptibility in Binary Alloy Systems. Br. Foundrym. 1981, 74, 65–73. [Google Scholar]
  10. Rappaz, M.; Drezet, J.M.; Gremaud, M. A New Hot-Tearing Criterion. Metall. Mater. Trans. A 1999, 30, 449–455. [Google Scholar] [CrossRef]
  11. Lees, D. The Hot Tearing Tendencies of Aluminium Casting Alloys. J. Inst. Met. 1946, 72, 343. [Google Scholar]
  12. Korolʹkov, A.M. Casting Properties of Metals and Alloys; Consultants Bureau: New York, NY, USA, 1963. [Google Scholar]
  13. Williams, J.; Singer, A. Deformation, Strength, and Fracture Above the Solidus Temperature. J. Inst. Met. 1968, 96, 5–12. [Google Scholar]
  14. Niyama, E. Japan-US Joint Seminar on Solidification of Metals and Alloys. Jpn. Soc. Promot. Sci. 1977, 271–282. [Google Scholar]
  15. Feurer, U. Quality Control of Engineering Alloys and the Role of Metals Science; Delft University of Technology: Delft, The Netherlands, 1977; pp. 131–145. [Google Scholar]
  16. Pellini, W.S. Strain Theory of Hot Tearing. Foundry 1952, 80, 124–133. [Google Scholar]
  17. Drezet, J.M.; Allehaux, D. Application of the Rappaz-Drezet-Gremaud Hot Tearing Criterion to Welding of Aluminium Alloys. In Hot Cracking Phenomena in Welds II; Böllinghaus, T., Herold, H., Cross, C.E., Lippold, J.C., Eds.; Springer: Berlin/Heidelberg, Germany, 2008; pp. 27–45. [Google Scholar]
  18. Kou, S. A Criterion for Cracking during Solidification. Acta Mater. 2015, 88, 366–374. [Google Scholar] [CrossRef]
  19. Kou, S. A Simple Index for Predicting the Susceptibility to Solidification Cracking. Weld. J. 2015, 94, 374–388. [Google Scholar]
  20. Liu, J.; Kou, S. Effect of diffusion on susceptibility to cracking during solidification. Acta Mater. 2015, 100, 359–368. [Google Scholar] [CrossRef] [Green Version]
  21. Liu, J.; Kou, S. Crack Susceptibility of Binary Aluminum Alloys during Solidification. Acta Mater. 2016, 110, 84–94. [Google Scholar] [CrossRef] [Green Version]
  22. Liu, J.; Kou, S. Crack Susceptibility of Binary Aluminum Alloys: Analytical Equations. In Shape Casting: 6th International Symposium; Tiryakioǧlu, M., Jolly, M., Byczynski, G., Eds.; Springer International Publishing: Cham, Switzerland, 2016; pp. 11–18. [Google Scholar]
  23. Liu, J.; Duarte, H.P.; Kou, S. Evidence of Back Diffusion Reducing Cracking during Solidification. Acta Mater. 2017, 122, 47–59. [Google Scholar] [CrossRef] [Green Version]
  24. Liu, J.; Kou, S. Susceptibility of Ternary Aluminum Alloys to Cracking during Solidification. Acta Mater. 2017, 125, 513–523. [Google Scholar] [CrossRef] [Green Version]
  25. Soysal, T.; Kou, S. A Simple Test for Assessing Solidification Cracking Susceptibility and Checking Validity of Susceptibility Prediction. Acta Mater. 2018, 143, 181–197. [Google Scholar] [CrossRef]
  26. Soysal, T.; Kou, S. Effect of Filler Metals on Solidification Cracking Susceptibility of Al Alloys 2024 and 6061. J. Mater. Process. Technol. 2019, 266, 421–428. [Google Scholar] [CrossRef]
  27. Stangeland, A.; Mo, A.; Nielsen, Ø.; M’Hamdi, M.; Eskin, D. Development of Thermal Strain in the Coherent Mushy Zone during Solidification of Aluminum Alloys. Metall. Mater. Trans. A 2004, 35, 2903–2915. [Google Scholar] [CrossRef]
  28. Spittle, J.A.; Brown, S.G.R. Numerical Modelling of Permeability Variation with Composition in Aluminium Alloy Systems and Its Relationship to Hot Tearing Susceptibility. Mater. Sci. Technol. 2005, 21, 1071–1077. [Google Scholar] [CrossRef]
  29. Kool, W.H.; Katgerman, L. Hot Tearing Criteria Evaluation for Direct-Chill Casting of an Al-4.5 Pct Cu Alloy. Metall. Mater. Trans. A 2005, 36, 1537–1546. [Google Scholar] [CrossRef]
  30. Savran, V.I.; Katgerman, L.; Eskin, D.G. Effects of Alloy Composition and Casting Speed on Structure Formation and Hot Tearing during Direct-Chill Casting of Al-Cu Alloys. Metall. Mater. Trans. A 2004, 35, 3551–3561. [Google Scholar] [CrossRef]
  31. Han, J.; Wang, J.; Zhang, M.; Niu, K. Susceptibility of Lithium Containing Aluminum Alloys to Cracking during Solidification. Materialia 2019, 5, 100203. [Google Scholar] [CrossRef]
  32. Liu, J.; Zeng, P.; Kou, S. Solidification Cracking Susceptibility of Quaternary Aluminium Alloys. Sci. Technol. Weld. Join. 2021, 26, 244–257. [Google Scholar] [CrossRef]
  33. Cao, W.; Chen, S.L.; Zhang, F.; Wu, K.; Yang, Y.; Chang, Y.A.; Schmid-Fetzer, R.; Oates, W.A. PANDAT Software with PanEngine, PanOptimizer and PanPrecipitation for Multi-Component Phase Diagram Calculation and Materials Property Simulation. Calphad 2009, 33, 328–342. [Google Scholar] [CrossRef]
  34. Pandat Software. Thermodynamic Calculations and Kinetic Simulations; CompuTherm LLC: Middleton, WI, USA, 2021. [Google Scholar]
  35. PanAluminum. Combined Thermodynamic and Mobility Database of Multicomponent Aluminum Alloys; PanAluminum: Middleton, WI, USA, 2021. [Google Scholar]
  36. Kaufman, L.; Bernstein, H. Computer Calculation of Phase Diagrams; Academic Press: New York, NY, USA, 1970. [Google Scholar]
  37. Saunders, N.; Miodownik, A.P. CALPHAD Calculation of Phase Diagrams: A Comprehensive Guide; Pergamon: New York, NY, USA, 1998. [Google Scholar]
  38. Chang, Y.A.; Chen, S.L.; Zhang, F.; Yan, X.Y.; Xie, F.Y.; Schmid-Fetzer, R.; Oates, W.A. Phase Diagram Calculation: Past, Present and Future. Prog. Mater. Sci. 2004, 49, 313–345. [Google Scholar] [CrossRef]
  39. Lukas, H.L.; Fries, S.G.; Sundman, B. Computational Thermodynamics: The CALPHAD Method; Cambridge University Press: Cambridge, UK, 2007. [Google Scholar]
  40. Kattner, U.R. The CALPHAD Method and Its Role in Material and Process Development. Tecnol. Metal. Mater. Miner. 2016, 13, 3–15. [Google Scholar] [CrossRef]
  41. Andersson, J.O.; Agren, J. Models for Numerical Treatment of Multicomponent Diffusion in Simple Phases. J. Appl. Phys. 1992, 72, 1350–1355. [Google Scholar] [CrossRef]
  42. Campbell, C.E.; Boettinger, W.J.; Kattner, U.R. Development of a Diffusion Mobility Database for Ni-Base Superalloys. Acta Mater. 2002, 50, 775–792. [Google Scholar] [CrossRef]
  43. Campbell, C.E.; Kattner, U.R.; Liu, Z.-K. The Development of Phase-Based Property Data Using the CALPHAD Method and Infrastructure Needs. Integr. Mater. Manuf. Innov. 2014, 3, 12. [Google Scholar] [CrossRef] [Green Version]
  44. National Research Council. Integrated Computational Materials Engineering: A Transformational Discipline for Improved Competitiveness and National Security; The National Academies Press: Washington, DC, USA, 2008. [Google Scholar]
  45. Zhang, C.; Miao, J.; Chen, S.; Zhang, F.; Luo, A.A. CALPHAD-Based Modeling and Experimental Validation of Microstructural Evolution and Microsegregation in Magnesium Alloys During Solidification. J. Phase Equilib. Diffus. 2019, 40, 495–507. [Google Scholar] [CrossRef]
  46. Zhang, F.; Zhang, C.; Liang, S.M.; Lv, D.C.; Chen, S.L.; Cao, W.S. Simulation of the Composition and Cooling Rate Effects on the Solidification Path of Casting Aluminum Alloys. J. Phase Equilib. Diffus. 2020, 41, 793–803. [Google Scholar] [CrossRef]
  47. Gulliver, G.H. The Quantitative Effect of Rapid Cooling upon the Constitution of Binary Alloys. J. Inst. Met. 1913, 9, 120–157. [Google Scholar]
  48. Scheil, E. Remarks on the Crystal Layer Formation. Z. Metallkd. 1942, 34, 70–72. [Google Scholar]
  49. Pumphrey, W.I.; Lyons, J.V. Cracking during the Casting and Welding of the More Common Binary Aluminium Alloys. J. Inst. Met. 1948, 74, 439–455. [Google Scholar]
  50. Rosenberg, R.A.; Flemings, M.C.; Taylor, H.F. Nonferrous Binary Alloys Hot Tearing. AFS Trans. 1960, 69, 518–528. [Google Scholar]
  51. Novikov, I.I. Hot-Shortness of Nonferrous Metals and Alloys. Russ. Cast. Prod. 1962, 4, 167–172. [Google Scholar]
  52. Spittle, J.A.; Cushway, A.A. Influences of Superheat and Grain Structure on Hot-Tearing Susceptibilities of Al-Cu Alloy Castings. Met. Technol. 1983, 10, 6–13. [Google Scholar] [CrossRef]
  53. Cross, C.E.; Olson, D.L. Hot Tearing Model to Assess Aluminum Weldability. Alum. Alloy. Phys. Mech. Prop. 1986, 3, 1869–1875. [Google Scholar]
  54. Pumphrey, W.; Moore, D. Cracking during and After Solidification in Some Aluminium-Copper-Magnesium Alloys of High Purity. J. Inst. Met. 1948, 74, 425–438. [Google Scholar]
  55. Jennings, P.H.; Singer, A.R.E.; Pumphrey, W.I. Hot-Shortness of Some High-Purity Alloys in the Systems Aluminium-Copper-Silicon and Aluminium-Magnesium-Silicon. J. Inst. Met. 1948, 74, 227–248. [Google Scholar]
  56. Novikov, I.I. Hot-Shortness of Nonferrous Metals and Alloys; Defense Technical Information Center: Fort Belvoir, VA, USA, 1968. [Google Scholar]
Figure 1. Al-Cu-Mg cracking susceptibility maps (a) by improved Scheil model considering back diffusion in the solid under the cooling rate of 20 °C/s and (b) experimentally tested data [54] (Reprinted with permission from ref. [24]. Copyright 2017 Elsevier).
Metals 11 01479 g001
Figure 2. Calculated cracking susceptibility index (CSI) maps for AA2xxx alloys: (a) Al-0.6Fe-0.5Mn-0.2Si-xCu-yMg alloys; (b) Al-0.6Fe-0.5Mn-0.6Si-xCu-yMg alloys; (c) Al-0.6Fe-0.5Mn-1.2Si-xCu-yMg alloys; (d) Al-1.2Si-xCu-yMg alloys. Simulation is performed by improved Scheil model considering back diffusion in the solid under the cooling rate of 20 °C/s.
Metals 11 01479 g002
Figure 3. Calculated CSI values in the binary systems: (a) Al-Si alloys and (b) Al-Mg alloys.
Metals 11 01479 g003
Figure 4. Al-Mg-Si cracking susceptibility maps: (a) by improved Scheil model considering back diffusion in the solid under the cooling rate of 20 °C/s and (b) experimentally tested data [55] (Reprinted with permission from ref. [24]. Copyright 2017 Elsevier).
Metals 11 01479 g004
Figure 5. Calculated cracking susceptibility index (CSI) maps for AA6xxx alloys: (a) Al-0.6Fe-0.5Mn-0.2Zn-0.2Cu-xMg-ySi; (b) Al-0.6Fe-0.5Mn-0.2Zn-0.5Cu-xMg-ySi; (c) Al-0.6Fe-0.5Mn-0.2Zn-1.2Cu-xMg-ySi; (d) Al-0.2Zn-1.2Cu-xSi-yMg; (e) Al-1.2Cu-xSi-yMg. Simulation is performed by improved Scheil model considering back diffusion in the solid under the cooling rate of 20 °C/s.
Metals 11 01479 g005
Figure 6. Al-Mg-Zn cracking susceptibility maps: (a) by improved Scheil model with the cooling rate of 20 °C/s and (b) experimentally tested data [56] (Reprinted with permission from ref. [4]. Copyright 2004 Elsevier).
Metals 11 01479 g006
Figure 7. Al-Mg-Zn-0.5Cu cracking susceptibility maps: (a) by improved Scheil model considering back diffusion in the solid under the cooling rate of 20 °C/s and (b) experimentally tested data [56] (Reprinted with permission from ref. [4]. Copyright 2004 Elsevier).
Metals 11 01479 g007
Figure 8. Calculated cracking susceptibility index (CSI) maps for AA7xxx alloys: (a) Al-0.2Si-0.3Fe-0.2Mn-0.5Cu-xZn-yMg; (b) Al-0.2Si-0.3Fe-0.2Mn-1.5Cu-xZn-yMg; (c) Al-0.2Si-0.3Fe-0.2Mn-2.2Cu-xZn-yMg. Simulation is performed by improved Scheil model considering back diffusion in the solid under the cooling rate of 20 °C/s.
Metals 11 01479 g008
Figure 9. Al-Mg-Zn crack susceptibility maps: (a) by Scheil model, (b) by improved Scheil model with the cooling rate of 100 °C/s, (c) by improved Scheil model with the cooling rate of 10 °C/s, and (d) by lever rule.
Metals 11 01479 g009
Figure 10. Solidification paths T   v s   ( f s ) 1 / 2 by Scheil model for (a) Al-Mg-Si alloys along w ( Mg ) / w ( Si ) = 1.73 and (b) Al-Mg-Zn alloys along w ( Zn ) / w ( Mg ) = 5.4 .
Metals 11 01479 g010
Figure 11. Calculated CSI for a series of Al-4Mg-xCu-nTi (n = 0 and 0.2 wt%) alloys.
Metals 11 01479 g011
Publisher’s Note: MDPI stays neutral with regard to jurisdictional claims in published maps and institutional affiliations.

