Abstract
Jerky flow has recently aroused interest as an example of complex spatiotemporal dynamics resulting from the collective behavior of defects in Al- and Mg-based alloys under loading. This paper presents the results of the study of the macroscopic strain localization kinetics in Nickel 200 (99.5 wt % purity). Uniaxial tension of flat samples is monitored at room temperature in the load–unload mode at a constant strain rate and total deformation increment up to 5%. The stress–strain curves reveal jerky flow from the yield point to the formation of the neck. The digital speckle correlation method evidences the movement of localized plastic deformation bands under the conditions of the Portevin–Le Chatelier effect (PLC). It is shown that stress drops during jerky flow in Ni are accompanied by the formation of morphologically simple single PLC bands. It is established that, with an increase in total deformation, the number of PLC bands and their velocity of motion along the sample decrease, while their time period increases. Moreover, an increase in total deformation leads to an increase in the parameters of the force response (i.e., time period and stress drop magnitude). It is found that the criterion of damage for PLC bands as a function of the total strain has a sigmoidal shape.
1. Introduction
Applying mechanical loads induces various phenomena in crystalline solids. Among them, special attention is paid to plastic deformation that may occur far from thermodynamic equilibrium in self-organized structures with decreasing entropy. Almost all the properties of the material, which manifest themselves under loading, are structurally sensitive, i.e., mutually related to self-organization [1,2]. Spontaneous formation of dissipative structures in nonequilibrium systems is one of the unsolved problems of modern solid-state physics. Classical examples when the instability of an initially homogeneous nonequilibrium and nonlinear medium causes the evolution of complex forms of the separation front are diffusion flame fronts, diffusion aggregation of particles, chemical reaction and shock ionization in porous media, bacterial population growth and so on [3,4,5,6]. Another example of nonequilibrium morphogenesis is the spontaneous formation of complex spatiotemporal structures of macroscopically localized plastic deformation in a deformable solid under loading conditions. The dynamics and morphology of strain localization at the macroscale level are usually studied in terms of the Lüders phenomena, serrated flow and Portevin–Le Chatelier (PLC) effects, as well as the neck formation at failure, which occur during active deformation of the material [7,8,9,10,11,12,13,14,15].
Jerky flow has recently aroused interest as an example of complex spatiotemporal dynamics resulting from the collective behavior of defects [16,17]. At the same time, unstable flow is a technologically important problem, since the strain localization in the strips associated with plastic instability worsens the mechanical properties of the structural material and can cause premature corrosion and sudden destruction. Plastic deformation of metals and alloys occurs inhomogeneously at different scale levels [18,19,20]. Most models explaining Portevin–Le Chatelier (PLC) effects are based on the assumption that discontinuous deformation is the result of dynamic strain aging caused by the interaction between mobile dislocations and diffusing impurity atoms [21]. In addition to the typical mechanisms based on the interaction of dislocations and impurity atoms, there are many other interpretations of the PLC effect [22]. In particular, in Ref. [23], the PLC effect and band formation were monitored under uniaxial tension of Ti-12% Mo and Ti-15% Mo titanium alloys at the deformation rate of 0.001 s−1 within a temperature range of 25–350 °C. According to the results from Ref. [23], the stress drop amplitude positively correlates with temperature, but behaves as a negative function of strain and molybdenum content, whereas the number of stress drops shows the opposite trend. In Ref. [24], the PLC effect was studied in room-temperature Al-Mg alloys with different Mg contents (2.3, 4.57 and 6.91 wt %) at various deformation rates. The in situ monitoring of the dynamics of deformation bands via the 3D-DIC method at a speed of 25 frames/s revealed that an increase in the Mg concentration led to a decrease in the spatial correlation of propagating bands. Additionally, the stress drop amplitude increased linearly with the maximum deformation inside the PLC band.
At present, the nature of the spatiotemporal patterns of deformation bands during loading still remains poorly understood [25,26,27,28]. Furthermore, from the perspective of nonlinear dynamics, elucidating the mechanism of spontaneous formation of spatiotemporal (dissipative) structures of macroscopically localized plastic strain under loading is a hot topic. It is worth noting that most experiments have been implemented on flat and cylindrical samples by means of uniaxial tensile testing [29,30,31]. Based on the available experimental data on uniaxial loading, three main types of PLC effects are distinguished: (1) type A, comprising the reappearance and movement of a single (solitary) wave along the sample axis; (2) type B, comprising the emergence and disappearance of deformation bands in an oscillating or intermittent mode and their propagation along the sample (stop-and-go); (3) type C, associated with the random appearance and disappearance of bands along the sample length. Like any classification, the above is to some extent conditional, as the real experiments admit various combinations of these three types [32].
Most studies on jerky flow were carried out on Al- and Mg-based alloys under loading [31,33]. However, the literature data reveal the manifestation of jerky flow in Ni-based alloys [32,34,35]. Thus, in Ref. [34], the inverse dependence of temperature associated with the emergence of drops in the stress–strain curve on the strain rate was obtained for Ni alloys (with a Ni content above 55 wt %). According to Ref. [32], A-type bands are characterized by continuous movement from the gripper of the testing machine along the entire length of the sample, while B-type bands exhibit discontinuous propagation.
Ref. [36] presents the results of experimental investigations into the surface relief of nickel single crystals with the [001] orientation of the compression axis by the methods of interference microscopy, electron backscattering diffraction and X-ray structural analysis. It is revealed that the macrobands are formed by the cooperative shear along systems of octahedral slip planes with the formation of extrusion and intrusion regions. The formation of macrobands and the accumulation of misorientations in them are explained by shear retardation at the boundaries of the deformation domains [37].
The results of local strain development during reversed loading of a nickel-based superalloy with submicron spatial resolution using high-resolution digital image correlation (HRDIC) were presented in [38].
Nickel alloys are used in products that are subjected to a wide range of aggressive media containing acids or hydrogen. These compounds are known for a high degree of heat resistance along with good processability, so the macroscopic heterogeneity of plastic flow is an object of scrutiny. The jerky flow effect manifesting itself under loading is sensitive to various physical parameters such as strain rate, temperature, etc. [32,34]. In this work, new data on plastic strain localization and the PLC effect are acquired on technically pure nickel under the uniaxial tensile test.
2. Materials and Methods
The samples used in the present study were cut from a 2 mm thick cold-rolled sheet of Nickel 200 polycrystalline alloy with a nickel content no less than 99.5% and an initial grain size of 90 μm. Their chemical composition is shown in Table 1. To relieve internal stresses before testing, the specimens were subjected to vacuum annealing at a temperature of 900 °C for 1 h. Nickel samples after 1 h of vacuum annealing at a temperature of 900 °C were found to get a structure composed of polygonal grains with average sizes of 117 μm [39]. The specimen surface was subjected to mechanical polishing and electropolishing in a saturated solution of chromium anhydride in orthophosphoric acid at a voltage of 20 V. After polishing the surface roughness of the samples was 0.08 µm. The surface roughness of the Ni nondeformed samples was measured using a profilometer New View 6200 (Zyga, Germany) (GOST R ISO 4287-2014, ISO 4287:1997). Surface roughness parameter Ra = 0.08 µm (arithmetic mean profile deviation).

Table 1.
Chemical composition (wt %) of the investigated Nickel 200 alloy.
Samples with working part sizes of 50 × 10 mm were tensile on a LFM-125 testing machine (Walter + Bai AG, Switzerland) at a strain rate of 6.67 × 10⁻⁵ s−1 at room temperature [40]. To describe the work-hardening stages using the empirical Ludwik–Hollomon equation [20], the K and n constants of the material were determined from the “true stress–true strain“ curve plotted in double logarithmic coordinates as .
According to the concept of material destruction, and given the accumulation of damage [41,42] along with the hypothesis of elastic energy equivalence [41], the damage parameter Δ was calculated during uniaxial tensile testing in the load–unload mode at the mobile gripper speed of 0.2 mm/min and the interval of 2.5% of the total deformation as
where is the elastic modulus of the material, and is the secant modulus determined by the slope of the straight line in the stress–strain curve at different times of loading (Figure 1a).

Figure 1.
Stress–strain curve of Ni samples with a strain rate of 6.67 × 10⁻⁵ s−1 in the load–unload mode (Sections 1–6 with an increase in total deformation of 5%) used for determination of the damage parameter (a) and visualization of strain localization patterns in the form of PLC bands using DSC method (b).
To observe the strain localization bands, the uniaxial tensile testing was combined with a digital speckle correlation (DSC) method adapted for the study of plastic deformation [43,44,45]. The technique consisted of the statistical analysis of the kinetics of the surface under consideration via the acquisition of laser speckle patterns at a wavelength of 635 nm. The speckle structure as the result of reflections from the surface roughness served as a reference grid for measuring displacement fields and local deformations. The method allows one to restore the field of displacement vectors that occur on the surface of a flat sample at any stage of strain hardening and calculate the components of the plastic distortion tensor [45] as
The images showing the dependences of plastic strain (,,) and rotation tensor components on the x, y coordinates and time t are called strain localization patterns. An example of strain localization patterns in the form of PLC bands at time points t = 220, 224 and 227 s for the first section of total deformations of 0.5% is shown in Figure 1b. The analysis of strain localization patterns is carried out using X-t linear diagrams (where X is the coordinate of the deformation band along specimen length), which enables one to measure the PLC propagation velocity V and the time T of the deformation process.
The probability of stress drop (whose nature is due to the PLC effect) of a certain amplitude D(S) was determined as [32]
where N is the total number of drops, S = Δσ/<Δσ> is the stress drop amplitude that can be found by dividing the drop magnitude by the average of the effective stress and δN(S) is the drop number at a certain stress drop amplitude within the interval δS.
D(S) = (1/N) · δN(S)/δS
3. Results
The parabolic type of stress–strain curve σ(ε) of polycrystalline Ni with a monotonically decreasing work-hardening coefficient θ(ε) demonstrates high plasticity (at the percent elongation of 55%) and the phenomenon of jerky flow of the specimen (Figure 2a), where stress drops are observed after the elastic–plastic transition up to the fracture. Figure 2b shows the magnified fragments of the stress–strain curve σ(ε), corresponding to Sections 1 and 2 in Figure 1a. The magnitude Δσ of the stress drop caused by the PLC effect [32] varies from 0.3 to 5 MPa. The ultimate strength is found to be 460 MPa. The analysis of the stress–strain curve revealed the following stages: the parabolic work hardening with a parabolic index n = 0.5 in the total deformation range ε = 5.27% and the prefailure stages at the total deformations ε = 27.42% (n = 0.4) and ε = 42.55% (n = 0.3).
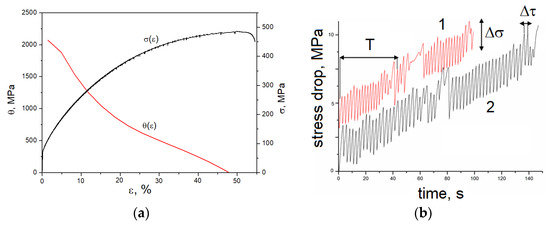
Figure 2.
Stress–strain curve σ(ε) and work-hardening coefficient θ(ε) of Ni samples (a); example of stress drop as a function of time for Sections 1 and 2 (b). The numbers of sections correspond to those from Figure 1a.
It is established that the emergence of PLC bands is associated with stress drops in the stress–strain curve. The kinetics of their formation and propagation in the successive sections of the stress–strain curve with an increase in total deformation to 5% is monitored based on the X-t diagrams shown in Figure 3. Here, the deformation time is postponed along the horizontal axis, and the coordinate of the PLC band along the extension axis corresponds to a vertical axis (a zero coordinate refers to a fixed gripper). At the gripping speed of 0.2 mm/min and at the first initial section below 5% (Figure 3a), the bands originate at a fixed gripper and move at a constant speed across the sample to the opposite edge, where they disappear (Figure 1a). Then, in Sections 2–6 (Figure 3b–e), with the further increase in total deformation to 5%, the process is repeated. At each moment of time, only one PLC band could exist in the deformable sample, however, moving towards either a mobile or stationary gripper of the testing machine.
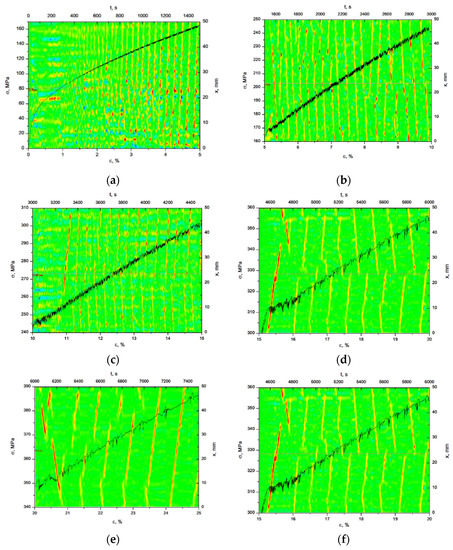
Figure 3.
Sections from the stress–strain curve σ(ε) superposed with kinetic X-t diagrams of the motion of the PLC bands at the total deformation of: (a) 0–5%; (b) 5–10%; (c) 10–15%; (d) 15–20%; (e) 20–25%; (f) 25–30%.
The kinetic diagrams of the propagation of PLC bands in Figure 3 were afterwards superposed with the corresponding sections of the stress–strain curve σ(ε). It is found that stress drops at the jerky flow of Ni are accompanied by the formation of morphologically simple single PLC localization bands, which have been previously detected in Al-Mg alloys under uniaxial tensile [33]. Once such a band reaches the gripper of the testing machine, the stress is reset again, and a new band is formed in the lower part of the sample, propagating either in the same or in the opposite direction with respect to the previous one with an increase in total deformation. As soon as the band arrives at the gripper, the above-described process is repeated. Moreover, after an increase in total deformation to 5% and unloading, each subsequent section of the stress–strain curve σ(ε) (Figure 3) is characterized by a decrease in the number of stress drops of the PLC bands. Nevertheless, each serration of jerky flow corresponds to the range overcome by one PLC band along the working part of the sample; that is, with jerky flow, the PLC bands run over the working part of the sample repeatedly. The movement of the PLC bands continues during work hardening until the fracture of polycrystalline Ni samples.
As can be seen from Figure 3, a complex spatiotemporal set of localization bands spontaneously propagates through the surface of the deformable Ni sample beyond the yield point in the load–unload mode, which is accompanied by the stress drop with an amplitude of several percent. The typical stress drop amplitude under these conditions was Δε ~ 0.1–0.5%, and the waiting time for the drop was Δτ ∼ 2–150 s. After the deformation bands pass through the entire working area of the sample, the strain rate abruptly decays, and the drop is completed.
The parameters of the PLC band patterns and the time structure of the force response of the mechanical system change with an increase in total deformation. Thus, in the first section, it observes periodic stress relief packets, corresponding to the nucleation and propagation of PLC bands (Figure 3a) through the entire sample during T ~ 45 s (Figure 2b, Curve 1). The time interval for the stress drop formation, corresponding to the distance between neighboring maxima σ, is Δτ ~ 2 s at this site.
It is noteworthy that stress drops Δσ less than 0.3 MPa are not able to form a visible localization focus (Figure 2b). The PLC bands begin to form at a total deformation of 1.5% when the drop amplitude Δσ reaches ~1–2 MPa. For a period of time Δτ of a single drop, the PLC band passes a distance along the extension axis of ~2.5–3 mm with an average propagation velocity V ~ 1.2 mm/s. The time period of single PLC bands in Section 1 (Figure 3a), defined as T = L/V (where L is the working length of the sample), is found to be ~45 s, which is determined by the average of the stress drop packet, as shown in Figure 2b (Curve 1).
As can be seen from Figure 2b (Curve 2), after unloading the first section of the σ(ε) curve and reloading Section 2 by 5% of the total deformation, the time interval required for the formation of stress drops increases to Δτ ~ 2.5 s, and the drop amplitude Δσ reaches ~2.5 MPa. In the second section below 10% of the total deformation, periodic stress relief packets are also observed, which correspond to the nucleation and propagation of PLC bands (Figure 3b) through the entire sample during T ~ 80 s (Figure 2b, Curve 2).
It is worth mentioning that the tendency to increase the parameters of the force response (i.e., time period and stress drop magnitude) and the propagation of PLC bands (band propagation time) persists during further tensile loading in the load–unload mode with an increase in total deformation to 5% up to the fracture (Figure 3c–f).
Deformation relief of polycrystalline Ni samples was analyzed in our work [39] via the contact and semicontact methods of atomic force microscopy. The scan area was from 5 to 50 μm depending on the characteristic sizes of the sample. The plastic strain is seen to be heterogeneously distributed for all deformation steps, with slip bands forming to accommodate the plastic deformation. Heterogeneity is also seen at a larger scale for regions of comparable size to the grains. Deformation takes place by the formation of thin shear bands at high angles with the loading direction. The AFM scans of a polycrystalline Ni sample exposed to the tensile total strain 5% reveal a single slip of shear bands along the most favorable crystallographic slip system. The average height of shear band steps was 40 nm, and their width was 1 μm. The slip band length was within the grain size. With a total deformation of 5%, plastic deformation causes a rotation of the surface grains, thereby causing the formation of a deformation relief. An increase in total strain to 10% leads to the intensive formation of shear bands. The bands form in groups with a characteristic band orientation and a regular spacing of a few microns. These groups are seen to cover convex regions of material, which we refer to as deformation domains. The bands in the bulk of the material evolve simultaneously in the dimensions of length, width and depth. As deformation progresses, the intensity of bands increases but the domains remain mostly unchanged. The density of bands also increases. In addition, new deformation domains appear near the edges of existing ones. These complementary deformation domains contain bands at high angles to those in the primary deformation domain. Careful observation reveals that some bands are not straight. In some cases, bands contain undulations. The grains appear to behave as if they were single crystals although, unlike a single crystal, the activation of secondary slip planes occurs only in certain regions of the grain and at small strains, before significant crystal rotation occurs. This is probably a consequence of local stress fluctuations caused by interactions with neighboring grains. The comparison of the obtained results and published data [35,36,37,38] yields the conclusion that a disorientation of 2–8° is obtained due to the development of a cellular substructure typical for nickel under the considered degree of deformation. A disorientation of 8–15° in surface layers in the region of high-intensity wrinkling is achieved due to rotation of the crystalline lattice.
4. Discussion
Synchronous recording of stress–strain curves and kinetic diagrams of the movement of PLC bands allows one to obtain their propagation velocity V, number N and time period T as the functions of the total deformation ε (Figure 4). The motion speed of PLC bands is calculated from the slope of the coordinate dependence on time in the above-presented X-t chronograms (Figure 3). The curve V(ε) of polycrystalline Ni, presented in Figure 5a, has an exponential form, which indicates the difference in the relationships between the propagation speed of PLC bands and the deformation in the corresponding plastic strain stages. The dependence of the number of PLC bands on the total deformation N(ε) of the sample is also described by the exponential function. As can be seen from Figure 4, with an increase in total deformation, there is a decrease in the number of PLC bands and their speed of movement along the sample, while the period T between the PLC bands increases. With a minimum total deformation (beyond the yield point), the propagation velocity of these bands achieves their maxima and then decreases with increasing deformation, arriving at the minimum values at fracture of the specimen.
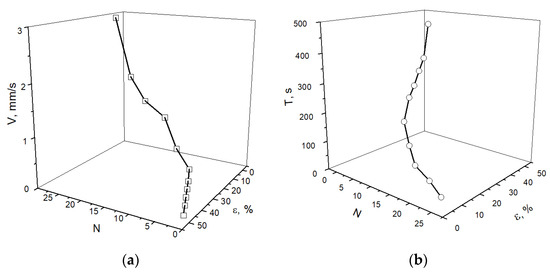
Figure 4.
Propagation velocity V (a) and time period T (b) of PLC bands vs. the number of bands N and the total deformation of the polycrystalline Ni in the load–unload mode.
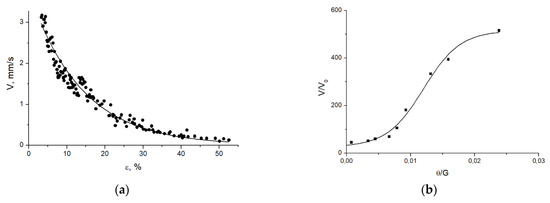
Figure 5.
(a) Propagation velocity V of PLC bands vs. total deformation ε; (b) relative velocity V/V0 of PLC bands vs. work-hardening coefficient θ.
Since the absolute values of the speeds of PLC strips are related to the strain rate, a comparison of the speeds allows one to enter the relative velocity of movement of the band as Vrel = V/V0, where V is the absolute velocity of the PLC band, and V0 is the velocity of motion of the mobile gripper of the testing machine. The difference between the velocity of the PLC bands in the load–unload mode (with an increase in total deformation to 5%) and the velocity of motion of the mobile gripper is found to be ~101–103 times. Furthermore, normalizing the dependence of the relative velocity of the PLC bands on the work-hardening coefficient θ (Figure 2a) by the shear modulus G results in a sigmoidal plot (Figure 5b) with a correlation coefficient R = 0.98, descending with a decrease in the parameter θ.
Thus, the analysis of the evolution regularities of the PLC effect in the plastic metal under consideration reveals an extreme dependence of the propagation rate of the PLC bands on the deformation at room temperature, as well as a sigmoidal dependence on the work-hardening coefficient. This circumstance indicates the possibility of the emergence of macroscopic strain localization and its unstable evolution in a nominally plastic material even at a relatively low level of total deformation.
As can be seen from Figure 3, with an increase in total deformation, the stress drop frequency decreases, and the number of PLC bands decreases. The local work-hardening coefficients after the discharge drop can be estimated from the discontinuous stress–strain curve σ(ε) as Δθ = Δσ/Δε, where Δσ is the stress drop amplitude, and Δε is the relative strain increment between neighboring stress drops. The results reveal that the work-hardening coefficient achieves its maximum after the first drop and then gradually decreases to a minimum value in the region of the maximum strain rate of the sample.
Thus, during the development of a macroscopic strain drop in the load–unload mode (with an increase in total deformation to 5%), the material is temporarily softened. With the spread of PLC bands, the work-hardening coefficient increases again, and the stress drop attenuates. Furthermore, it observes transitions between the numerous PLC bands moving with a high speed (Figure 3a,b) and a small number of bands propagating with lower speeds (Figure 3e,f) (see Figure 5b), which are highlighted in the strain dependences of the work-hardening coefficient in Figure 2a.
It should be noted that the relative strain increment between drops Δε remains almost unchanged during the development of a macroscopic localization band. Taking into account the fact that each drop in the force response is caused by the origin and expansion of one deformation band, it can be concluded that each deformation band carries almost the same strain, and therefore, it can be considered a “quantum” of macroscopically localized plastic strain. At the same time, the stress drop amplitude values Δσ are distributed in a wide range from 0.3 to 5 MPa, and the corresponding histogram has a quasi-hyperbolic profile (Figure 6a).
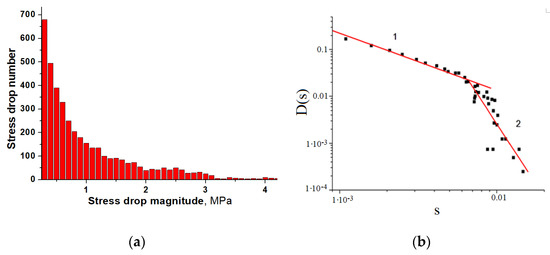
Figure 6.
(a) Statistical distribution of the number of stress drops; (b) statistical distribution function D(S) of the normalized stress drop amplitudes in double logarithmic coordinates.
Figure 6a displays the total number of stress drops from the stress–strain curve along the ordinate axis. For the abscissa axis, all the drops with Δσ > 0.3 MPa were taken into account.
Figure 6b depicts the dependence of the probability density of the drop origin D(S), calculated from Formula (3) and plotted in logarithmic coordinates. The plot can be divided into two linear sections with the slope τ to the s axis (Figure 6b), where Section 1 (τ = 1.22, and the correlation coefficient R is 0.99) corresponds to the stress drop amplitudes Δσ in the range from 0.3 to 2 MPa, and Section 2 (τ = 5.16, and the correlation coefficient R is 0.84) refers to Δσ values from 2 to 5 MPa. This means that the stress drop distribution function obeys the power law D(s) ∼ s−τ. As is known, the power statistics with the index τ ∼ 1 may be a testament to the phenomenon of self-organizing criticality [1], indicating the occurrence of long-range correlations of the dislocation macrokinetics in the deformable alloys [30].
It is worth mentioning that, regardless of the deformation conditions and the material, structural parameters such as dislocation cell size and misorientation angle between the cells, normalized by the most probable values, are described by the same distribution law. This enables one to observe the scaling of recrystallized grain sizes in rolled Ni crystals in Refs. [46,47,48]. The transmission electron microscopy study of structural formation during Ni rolling at room temperature in a compression degree range of 10–97% [46,47] revealed that, at a compression degree of 10%, the main components of the microstructure were weakly disoriented (no more than 1°) equiaxial dislocation cells with a size of about 1 μm. Subsequent rolling of the alloy led to cellular structure instability and the appearance of localization microbands (MBs).
Given the results of Refs. [46,47,48,49,50], it can be argued that scaling of relaxation structural parameters is a common feature of deformable crystalline materials, regardless of the deformation conditions and the material itself. The cells are located both inside and outside the MBs, and the micrograins are mainly concentrated at the MBs. The normalized distribution curves of the rolled Ni cell sizes, adopted from Ref. [46], are shown in Figure 7 (Curve 1). At the same time, adding the normalized sizes of micrograins concentrated at the MBs to the statistical dependence of the cell sizes leads to another dependence plotted in Figure 7 (Curve 2). To analyze the morphological invariance of band structures (Figure 7), observed at different scale levels, the distribution of macroscopic PLC bands by their propagation velocities V in Ni alloy under uniaxial tensile (Curve 3) was constructed by analogy with Curves 1 and 2, where P(V) = (1/<V>)·P(V/<V>) is the probability normalized by the average velocity value <V> [46]. As can be seen from Figure 7, all three distribution curves associated with various types of strain-induced structural formation differ significantly from each other.
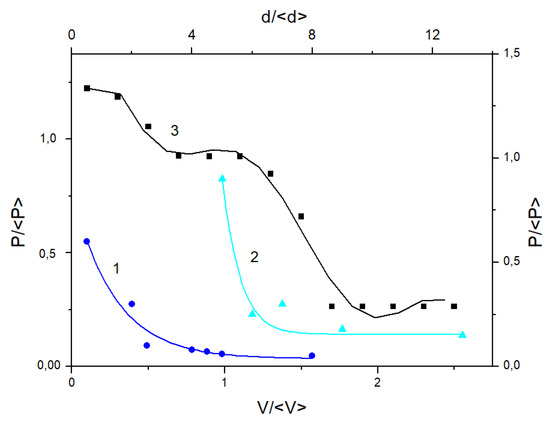
Figure 7.
Normalized by the average size (abscissa) and probability P (ordinate) d-size distribution curves of cell (1) micrograins (2) in Ni after 50% rolling data from [46] and propagation velocity V of the PLC bands (3) in Ni under uniaxial tensile.
According to the commonly accepted mechanism of crystal deformation, plastic flow change is associated with the movement of defects in the crystal structure (i.e., dislocations, disclinations, or vacancies) [20], which can interact with each other, forming a so-called relaxation structure. The elements of this structure contribute to the reduction of internal stresses in local volumes but do not impact the deformation process as a whole due to the creation of additional obstacles for defect motion. Therefore, relaxation structures (cells, polygons, and recrystallized grains) should not be considered synergetic, i.e., emerging as a result of self-organization of the crystal [47]. In this respect, the possibility of strain-induced self-organization of crystals in the form of interconnected elements of the MBs at different scale levels was verified in Ref. [46]. These structural elements were shown to be conducive to the deformation process during the braking of dislocation sliding via excitation of a new deformation mode. Based on numerous experimental results obtained on various materials under different loading conditions, it was shown in Refs. [46,47,48,49,50] that some properties of MBs, on the one hand, and relaxation structure elements (cells, polygons or recrystallized grains), on the other hand, differ to a large extent (Figure 7, Curves 1 and 2). Such properties include self-similarity; that is, the morphological invariance of band structures at different scale levels. Apparently, this is due to the direct influence of band structures of different scale levels on the macroscopic plastic flow of the crystal. Morphological invariance is not characteristic of relaxation structures. The key feature of these laws with respect to a deformable crystal is the possibility of its self-organization in an external mechanical field in the form of structural elements that contribute to the deformation process. As follows from many experimental and theoretical data, such structural elements are exactly MBs at the microscopic level (Figure 7, Curve 2) and PLC bands at macroscopic scale levels (Figure 7, Curve 3). Meanwhile, it is difficult to take into account the influence of the multilevel structure on the strength properties of materials, so most theoretical and experimental studies [46,47,48,49,50] provide only integral information about its contribution to the fracture. Therefore, assessing the impact of structural inhomogeneities is still a challenge, and the attempts made recently by some researchers have been aimed at developing multiscale level models that would take the hierarchical structure of materials into consideration [21,45]. In Ref. [51], the emphasis is placed on determining a number of critical parameters that allow moving to the next level at gathering information about the processes occurring at the previous level. Of particular importance here is the hierarchy of microcracks that determine the stage of damage development before fracture and the kinetics of macroscopic localization bands that are closely related to the stage of plastic flow.
It should be noted that a good deal of research is aimed at the analysis of the hierarchy of microcracks, especially small fatigue cracks. In that regard, three types of microcracks could be identified in Ref. [52], namely: (1) microstructurally short cracks whose size is comparable to that of a metal grain; (2) physically small cracks with the sizes below 500 μm; (3) long cracks larger than 500 μm, described in terms of elastic–plastic fracture mechanics. Furthermore, according to Ref. [52], cracks of the above groups differ with respect to the growth kinetics.
To analyze the degree of damage in this work, the damage parameter was calculated using Formula (1). The graph of the damage parameter as a function of the total deformation shows the process of damage accumulation during tensile of polycrystalline Ni, i.e., according to [41,42], the damage parameter is zero at the initial state and reaches one at fracture. According to the data, the damage parameter of Ni specimens exposed to uniaxial tensile testing in the load–unload mode behaves as the exponential function of the total strain with the correlation coefficient of 0.98. The logarithm plot of the function yields three linear plots for Ni (Figure 8a), which are associated with the accumulation of damage at appropriate stages of plastic flow [51,52]: the formation of microcracks (I), their merge (II) and accelerated development prior to the emergence of macrocracks at fracture (III).
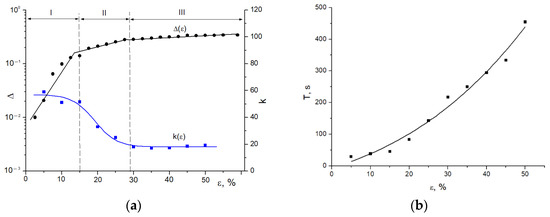
Figure 8.
Dependences of total strain ε during tensile of polycrystalline Ni in the load–unload mode: (a) damage parameter in ln Δ (ε) coordinates and concentration k-criterion of damage for PLC bands in direct coordinates; (b) time period of PLC bands.
The stage-by-stage evolution of damage is also reflected in the strain localization patterns. As shown in Figure 4, the propagation of PLC bands at all stages of loading is characterized by the velocity V and the time period T, determined from the kinetic X-t diagrams (Figure 3). The periodicity of PLC bands as a function of the total deformation T(ε) of polycrystalline Ni takes an exponential form (Figure 8b). Since the width of the PLC front practically remains constant during loading and there is no distance between the single bands, the following relation is applied in this work by analogy with the crack kinetics [52] based on the measured time period T:
where k is the concentration k-criterion of damage, which is the ratio of the frequency ω = 2π/T of the PLC bands to their number N. In Formula (4), the square root of the number √N is used, since the kinetics of the bands is analyzed on the deformable surface, and the total loading time ttot corresponding to the appearance of each PLC band is employed to normalize the frequency.
The concentration criterion k as a function of the total strain has a sigmoidal shape (see Figure 8b), achieving a maximum at the early stage of loading (I), but reaching its minimum critical value at the stage (III) with a further release to the plateau. Thus, the dependence in Figure 8a is qualitative evidence of the fact that the change in the mode of microcrack development is reflected in the kinetics of macroscopic PLC bands. The larger the degree of deformation, the lower the number N of PLC bands, since the main contribution to the damage is made by the merging microdefects. The aforementioned damage characteristics of polycrystalline Ni during tensile in the load–unload mode are a consequence of the different strain hardening processes that are characterized by the work-hardening coefficient impacting the propagation rate of the PLC bands (Figure 5b).
5. Conclusions
In this work, the PLC effect was experimentally detected in technically pure polycrystalline Ni with a constant strain rate in the load–unload mode and an increase in total tensile strain to 5%. The main conclusions derived from this study that can be made are as follows:
- For the first time, PLC localization bands were visualized by the digital speckle correlation method, and their kinetics were studied throughout the plastic flow stages of the material from the yield point to the fracture.
- It is established that the emergence of PLC bands is associated with stress drops in the stress–strain curve. The kinetics of their formation and propagation in the successive sections of the stress–strain curve with an increase in total deformation to 5% is monitored based on the X-t diagrams.
- Synchronous recording of stress–strain curves and kinetic diagrams of the movement of PLC bands allows one to obtain their propagation velocity V, number N and time period T as the functions of the total deformation ε.
- It is found that the parameters of the force response (i.e., time period and stress drop magnitude) and the propagation of PLC bands (band propagation time) increase during further tensile loading in the load–unload mode with an increase in the total deformation to 5% up to the fracture.
- The concentration criterion as a function of the total strain has a sigmoidal shape.
- The propagation velocity and the number of PLC bands as a function of the total strain described by the exponential function. The dependence of the relative velocity of the PLC bands as a function of the work-hardening coefficient θ has a sigmoidal shape.
Author Contributions
Conceptualization, S.A.B.; methodology, M.V.N.; software, M.V.N.; formal analysis, S.A.B.; investigation, M.V.N.; writing—original draft preparation, M.V.N.; writing—review and editing, S.A.B.; visualization, M.V.N.; supervision, S.A.B.; project administration, S.A.B. All authors have read and agreed to the published version of the manuscript.
Funding
The work was performed according to the Government research assignment for ISPMS SB RAS, project, FWRW-2021-0011.
Institutional Review Board Statement
Not applicable.
Informed Consent Statement
Not applicable.
Data Availability Statement
Not applicable.
Acknowledgments
We thank Lev Zuev for helpful discussion of this study.
Conflicts of Interest
The authors declare no conflict of interest.
References
- Bak, P.; Tang, C.; Wiesenfeld, K. Self-organized criticality. Phys. Rev. A 1988, 38, 364–374. [Google Scholar] [CrossRef] [PubMed]
- Loskutov, A.Y.; Vasil’ev, K.A. To the self-organisation problem: A model of formation of the complicated functional systems. Matem. Mod. 2004, 16, 109–122. [Google Scholar]
- Witten, T.A.; Sander, L.M. Diffusion-limited aggregation: Kinetic critical phenomenon. Phys. Rev. Lett. 1981, 47, 1400–1403. [Google Scholar] [CrossRef]
- Daccord, G. Chemical Dissolution of a Porous Medium by a Reactive Fluid. Phys. Rev. Lett. 1987, 58, 479–482. [Google Scholar] [CrossRef] [PubMed]
- Niemeyer, L.; Pietronero, L.; Wiesmann, H.J. Fractal Dimension of Dielectric Breakdown. Phys. Rev. Lett. 1984, 52, 1033–1036. [Google Scholar] [CrossRef]
- Kozlovsky, Y.; Cohen, I.; Golding, V.; Ben-Jacob, E. Lubricating Bacteria Model for Branching Growth of Bacterial Colonies. Phys. Rev. E 1999, 59, 7025–7035. [Google Scholar] [CrossRef]
- Barannikova, S.A.; Danilov, V.I.; Zuev, L.B. Plastic strain localization in Fe-3%Si single crystals and polycrystals under tension. Tech. Phys. 2004, 49, 1296–1300. [Google Scholar] [CrossRef]
- Plekhov, O.A.; Saintier, N.; Naimark, O. Experimental study of energy accumulation and dissipation in iron in an elastic-plastic transition. Tech. Phys. 2007, 52, 1236–1238. [Google Scholar] [CrossRef]
- Barannikova, S.A.; Nadezhkin, M.V.; Mel’nichuk, V.A.; Zuev, L.B. Tensile plastic strain localization in single crystals of austenite steel electrolytically saturated with hydrogen. Tech. Phys. Lett. 2011, 37, 793–796. [Google Scholar] [CrossRef]
- Orlova, D.V.; Barannikova, S.A.; Zuev, L.B. On the kinetics of localized plasticity domains emergent at the pre-failure stage of deformation process. In AIP Conference Proceedings; AIP Publishing: Melville, NY, USA, 2016; Volume 1783, p. 020168. [Google Scholar]
- Tretiakova, T.V.; Vildeman, V.E. Relay-Race Deformation Mechanism during Uniaxial Tension of Cylindrical Specimens of Carbon Steel: Using Digital Image Correlation Technique. Fract. Struct. Integr. 2013, 24, 1–6. [Google Scholar]
- Zuev, L.B. Chernov–Luders and Portevin–Le Chatelier deformations in active deformable media of different nature. J. Appl. Mech. Tech. Phys. 2017, 58, 328–334. [Google Scholar] [CrossRef]
- Barannikova, S.; Zuev, L.; Li, Y. Plastic flow heterogeneity and failure of bimetal material. Int. J. Geomate 2018, 14, 112–117. [Google Scholar] [CrossRef]
- Danilov, V.I.; Zuev, L.B.; Gorbatenko, V.V.; Danilova, L.V.; Orlova, D.V. Autowave Description of Plasticity of Materials with an Unstable Phase Structure at the Macroscale Level. Tech. Phys. 2021, 66, 255–262. [Google Scholar] [CrossRef]
- Zuev, L.B.; Barannikova, S.A. Hall–Petch Relation and the Localized Plasticity Parameters. Russ. Metal. 2020, 4, 265–270. [Google Scholar] [CrossRef]
- Zhang, J.; Yu, Q.; Jiang, Y.; Li, Q. An experimental study of cyclic deformation of extruded AZ61A magnesium alloy. Int. J. Plast. 2011, 27, 768–787. [Google Scholar] [CrossRef]
- Yilmaz, A.J. The Portevin-Le Chatelier effect: A review of experimental findings. Sci. Technol. Adv. Mater. 2011, 12, 1–16. [Google Scholar] [CrossRef] [PubMed]
- Manach, P.Y.; Thuillier, S.; Yoon, J.W.; Coëґ, J.; Laurent, H. Kinematics of Portevin-Le Chatelier bands in simple shear. Int. J. Plast. 2014, 58, 66–83. [Google Scholar] [CrossRef]
- Klusemann, B.; Fischer, G.; Böhlke, T.; Svendsen, B. Thermomechanical characterization of Portevin-Le Chatelier bands in AlMg3 (AA5754) and modeling based on a modified Estrin-McCormik approach. Int. J. Plast. 2015, 67, 192–216. [Google Scholar] [CrossRef]
- Pelleg, J. Mechanical Properties of Materials; Springer: Dordrecht, Germany, 2013. [Google Scholar]
- Lebyodkin, M.A.; Bougherira, Y.; Lebedkina, T.A.; Entemeyer, D. Scaling in the Local Strain-Rate Field during Jerky Flow in an Al-3%Mg Alloy. Metals 2020, 10, 134. [Google Scholar] [CrossRef]
- Luo, S.; Castany, P.; Thuillier, S.; Huot, M. Spatiotemporal characteristics of Portevin-Le Chatelier effect in Ti-Mo alloys under thermo-mechanical loading. Mat. Sci. Eng. A 2018, 733, 137–143. [Google Scholar] [CrossRef]
- Cai, Y.; Yang, S.; Fu, S.; Zhang, D.; Zhang, Q. Investigation of Portevin–Le Chatelier Band Strain and Elastic Shrinkage in Al-Based Alloys Associated with Mg Contents. J. Mat. Sci. Tech. 2017, 33, 580–586. [Google Scholar] [CrossRef]
- Ait-Amokhtar, H.; Vacher, P.; Boudrahem, S. Kinematics fields and spatial activity of Portevine-Le Chatelier bands using the digital image correlation method. Acta Mater. 2006, 54, 4365–4371. [Google Scholar] [CrossRef]
- Tong, W.; Tao, H.; Zhang, N.; Hector, L.G., Jr. Time-resolved strain mapping measurements of individual Portevin–Le Chatelier deformation bands. Scripta Mater. 2005, 53, 87–92. [Google Scholar] [CrossRef]
- Zdunek, J.; Brynk, T.; Mizera, J.; Pakiela, Z.; Kurzydlowski, K.J. Digital image correlation investigation of Portevin-Le Chatelier effect in an aluminium alloy. Mater. Charact. 2008, 59, 1429–1433. [Google Scholar] [CrossRef]
- Zaiser, M. Scale invariance in plastic flow of crystalline solids. Adv. Phys. 2006, 55, 185–245. [Google Scholar] [CrossRef]
- Iliopoulos, A.C.; Nikolaidis, N.S.; Aifantis, E.C. Portevin-Le Chatelier effect and Tsallis nonextensive statistics. Physics A 2015, 438, 509–518. [Google Scholar] [CrossRef]
- Kobelev, N.P.; Lebyodkin, M.A.; Lebedkina, T.A. Role of Self-Organization of Dislocations in the Onset and Kinetics of Macroscopic Plastic Instability. Metall. Mater. Trans. A 2017, 48, 965–974. [Google Scholar] [CrossRef]
- Zhemchuzhnikova, D.; Lebyodkin, M.; Lebedkina, T.; Mogucheva, A.; Yuzbekova, D.; Kaibyshev, R. Peculiar Spatiotemporal Behavior of Unstable Plastic Flow in an AlMgMnScZr Alloy with Coarse and Ultrafine Grains. Metals 2017, 7, 325. [Google Scholar] [CrossRef]
- Cui, C.; Zhang, R.; Zhou, Y.; Sun, X. Portevin-Le Châtelier effect in wrought Ni-based superalloys: Experiments and mechanisms. J. Mater. Sci. Tech. 2020, 51, 16–31. [Google Scholar] [CrossRef]
- Shibkov, A.A.; Gasanov, M.F.; Zheltov, M.A.; Zolotov, A.E.; Ivolgin, V.I. Intermittent plasticity associated with the spatio-temporal dynamics of deformation bands during creep tests in an AlMg polycrystal. Int. J. Plast. 2016, 86, 37–55. [Google Scholar] [CrossRef]
- Fernandez-Zelaia, P.; Adair, B.S.; Barker, V.M.; Antolovich, A.D. The Portevin-Le Chatelier Effect in the Ni-Based Superalloy IN100. Metall Mater. Trans. A 2015, 46, 5596–5609. [Google Scholar] [CrossRef]
- Rai, R.K.; Sahu, J.K.; Paulose, N.D.; Fernando, C. Tensile deformation micro-mechanisms of a polycrystalline nickel base superalloy: From jerky flow to softening. Mater. Sci. Eng. A 2021, 807, 140905. [Google Scholar]
- Stinville, J.C.; Vanderesse, N.; Bridier, F.; Bocher, P.; Pollock, T.M. High resolution mapping of strain localization near twin boundaries in a nickel-based superalloy. Acta Mater. 2015, 98, 29–42. [Google Scholar] [CrossRef]
- Lychagin, D.V.; Alfyorova, E.A.; Tailashev, A.S. Misorientation Development During the Formation of Macrobands in the [001] Nickel Single Crystals. Rus. Phys. J. 2015, 58, 717–723. [Google Scholar] [CrossRef]
- Rubtsov, A.S.; Rybin, V.V. Structural Features of Plastic Deformation at the Flow Stage. Phys. Met. Met. 1977, 44, 611–622. [Google Scholar]
- Atkinson, M.D.; Donoghue, J.M.; da Fonseca, J.Q. Measurement of local plastic strain during uniaxial reversed loading of nickel alloy 625. Mater. Charac. 2020, 168, 110561. [Google Scholar] [CrossRef]
- Shlyakhova, G.V.; Nadezhkin, M.V.; Barannikova, S.A.; Zuev, L.B. Study of Deformation Relief of Polycrystalline Nickel by Atomic Force Microscopy. In AIP Conference Proceedings; AIP Publishing: Melville, NY, USA; Volume 2310, pp. 020308-1–020308-4.
- Barannikova, S.A.; Kosinov, D.A.; Zuev, L.B.; Gromov, V.E.; Konovalov, S.V. Influence of hydrogen on the localization of plastic strain in low-carbon steel. Steel Trans. 2016, 46, 851–854. [Google Scholar] [CrossRef]
- Lemaitre, J.; Desmorat, R.; Sauzay, M. Anisotropic damage law of evolution. Eur. J. Mech.-A/Solids 2000, 19, 187–208. [Google Scholar] [CrossRef]
- Chow, C.L.; Wang, J. An anisotropic theory of elasticity for continuum damage mechanics. Int. J. Fract. 1987, 33, 3–16. [Google Scholar] [CrossRef]
- Sutton, M.A.; Hild, F. Recent Advances and Perspectives in Digital Image Correlation. Exp. Mech. 2015, 55, 1–8. [Google Scholar] [CrossRef]
- Jacquot, P. Speckle Interferometry: A Review of the Principal Methods in Use for Experimental Mechanics Applications. Strain 2008, 44, 57–69. [Google Scholar] [CrossRef]
- Zuev, L.B.; Barannikova, S.A. Autowave physics of material plasticity. Crystals 2019, 9, 458. [Google Scholar] [CrossRef]
- Zasimchuk, E.; Gordienko, Y.; Markashova, L.; Turchak, T. Relaxation Structure Formation in Deformation of Nickel. J. Mater. Eng. Perf. 2009, 18, 947–951. [Google Scholar] [CrossRef]
- Keller, C.; Hug, E.; Feaugas, X. Microstructural size effects on mechanical properties of high purity nickel. Int. J. Plast. 2011, 27, 635–654. [Google Scholar] [CrossRef]
- Godfrey, A.; Hughes, D.A. Scaling of the spacing of deformation induced dislocation boundaries. Acta Mater. 2000, 48, 1897–1905. [Google Scholar] [CrossRef]
- Sethna, J.P.; Coffman, V.R. Scaling in plasticity-induced cell-boundary microstructure: Fragmentation and rotational diffusion. Phys. Rev. B 2003, 67, 184107. [Google Scholar] [CrossRef]
- Székely, F.; Groma, I.; Lendvai, J. Statistic Properties of Dislocation Structures Investigated by X-ray Diffraction. Mater. Sci. Eng. A 2001, 309–310, 352–355. [Google Scholar] [CrossRef]
- Zhao, Y.X.; Gao, Q.; Wang, J.N. Evolution of short fatigue crack lengths and crack density: Two approaches. Fatigue Fract. Eng. Mater. Struct. 2000, 23, 929–941. [Google Scholar] [CrossRef]
- Botvina, L.R.; Gryaznov, E.F. Dynamic fragmentation of shells: Scale effects. Proc. Struct. Integr. 2016, 2, 373–380. [Google Scholar] [CrossRef][Green Version]
Publisher’s Note: MDPI stays neutral with regard to jurisdictional claims in published maps and institutional affiliations. |
© 2021 by the authors. Licensee MDPI, Basel, Switzerland. This article is an open access article distributed under the terms and conditions of the Creative Commons Attribution (CC BY) license (https://creativecommons.org/licenses/by/4.0/).