
Role of NaCl, CO2, and H2S on Electrochemical Behavior of 304 Austenitic Stainless Steel in Simulated Oil Industry Environment


Abstract
:1. Introduction
2. Experimental Procedure
2.1. Materials and Methods
2.2. Potentiodynamic Polarization
2.3. Electrochemical Impedance Spectroscopy (EIS)
2.4. SEM Analysis
2.5. Raman Spectroscopy
3. Results and Discussion
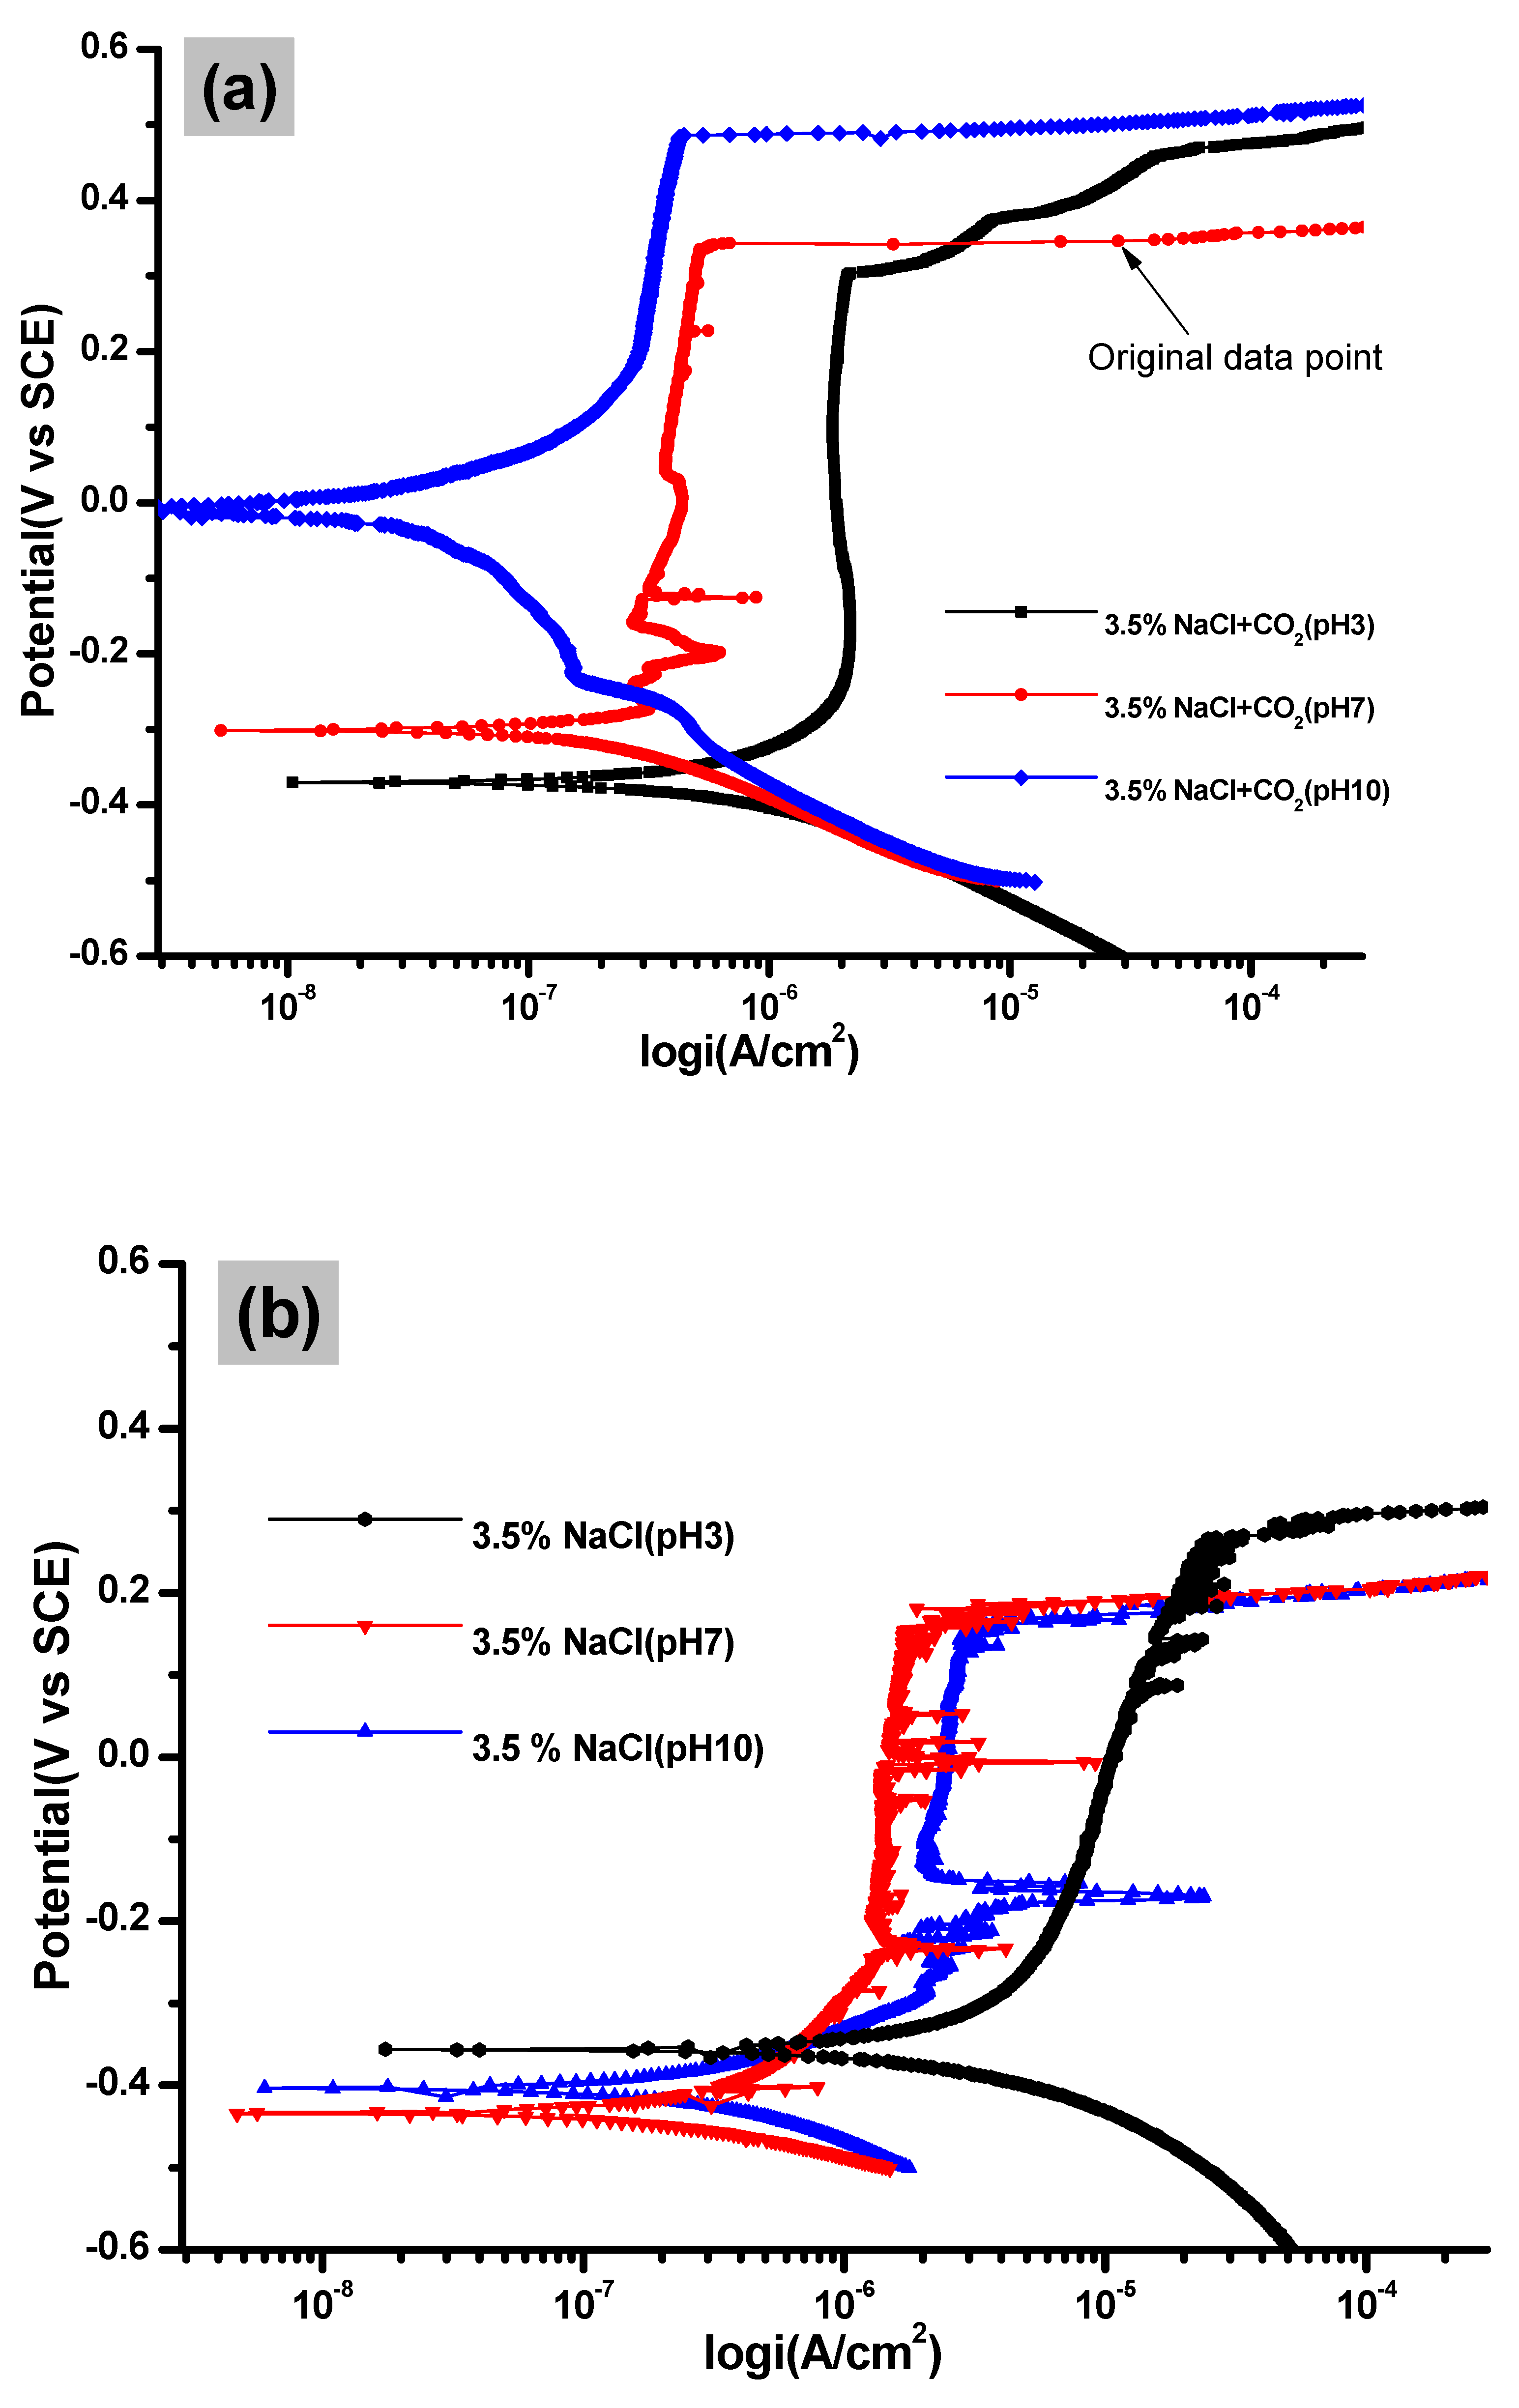
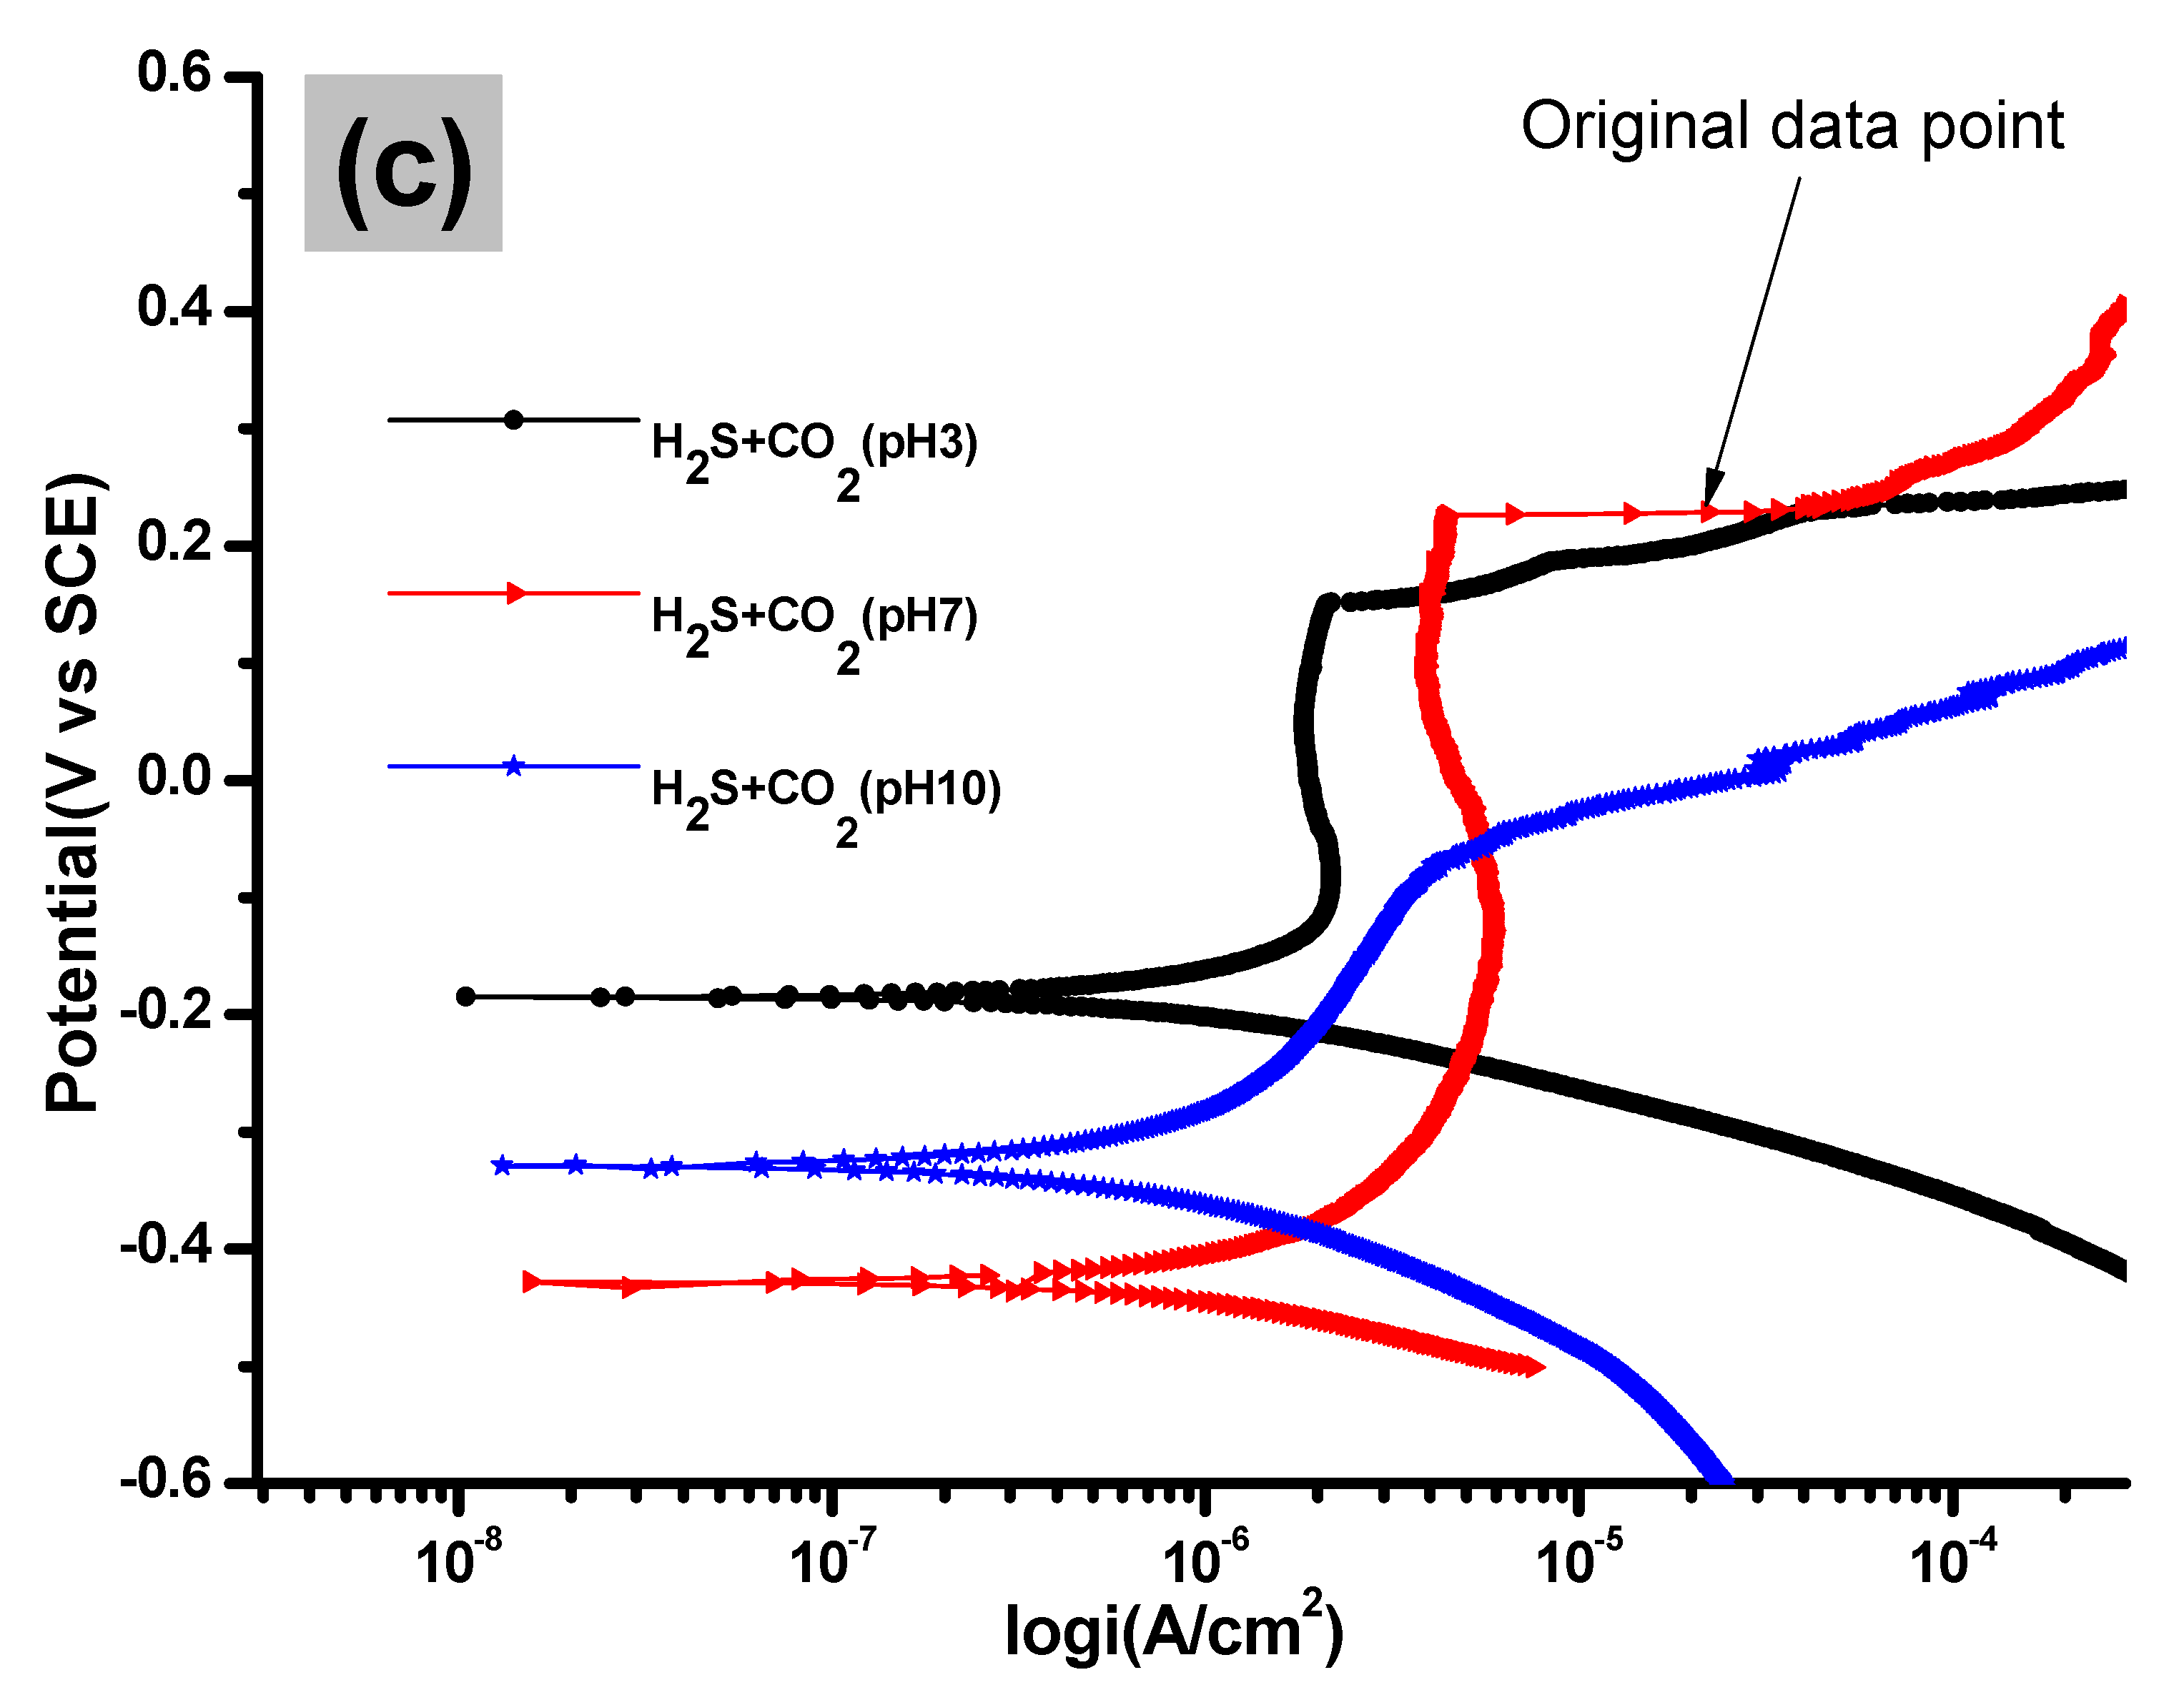
3.1. Potentiodynamic Polarization Analysis
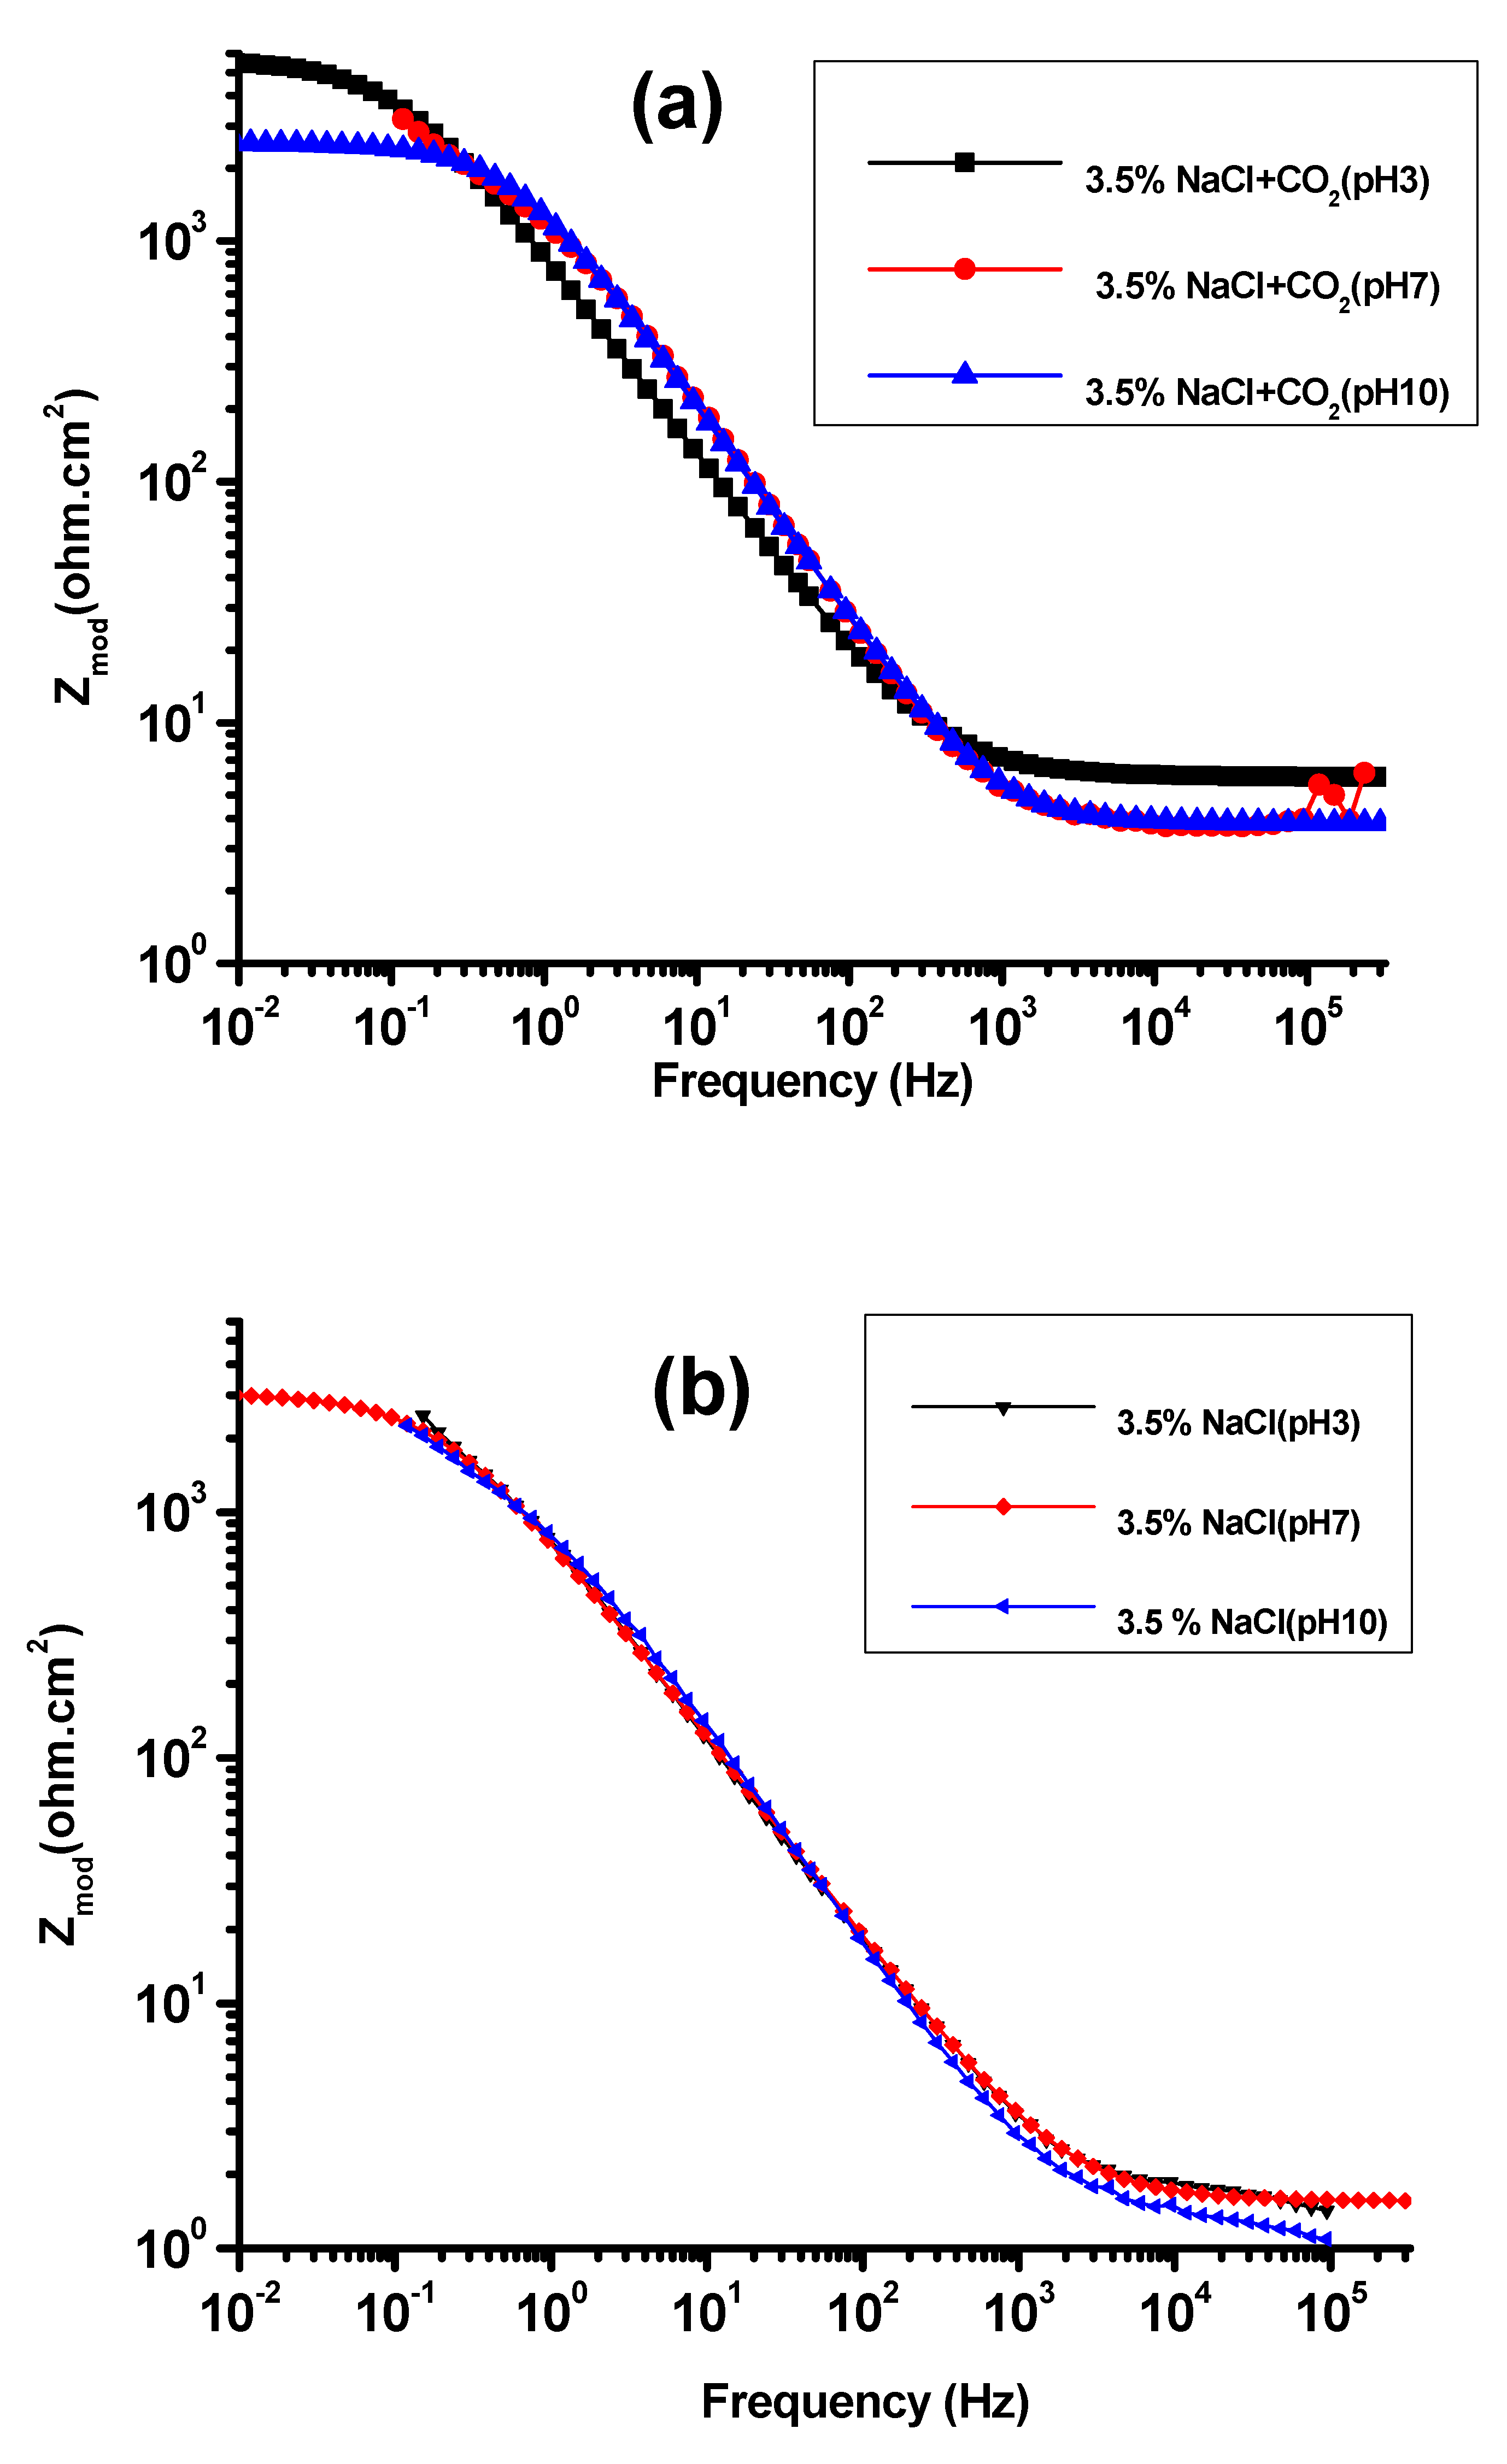
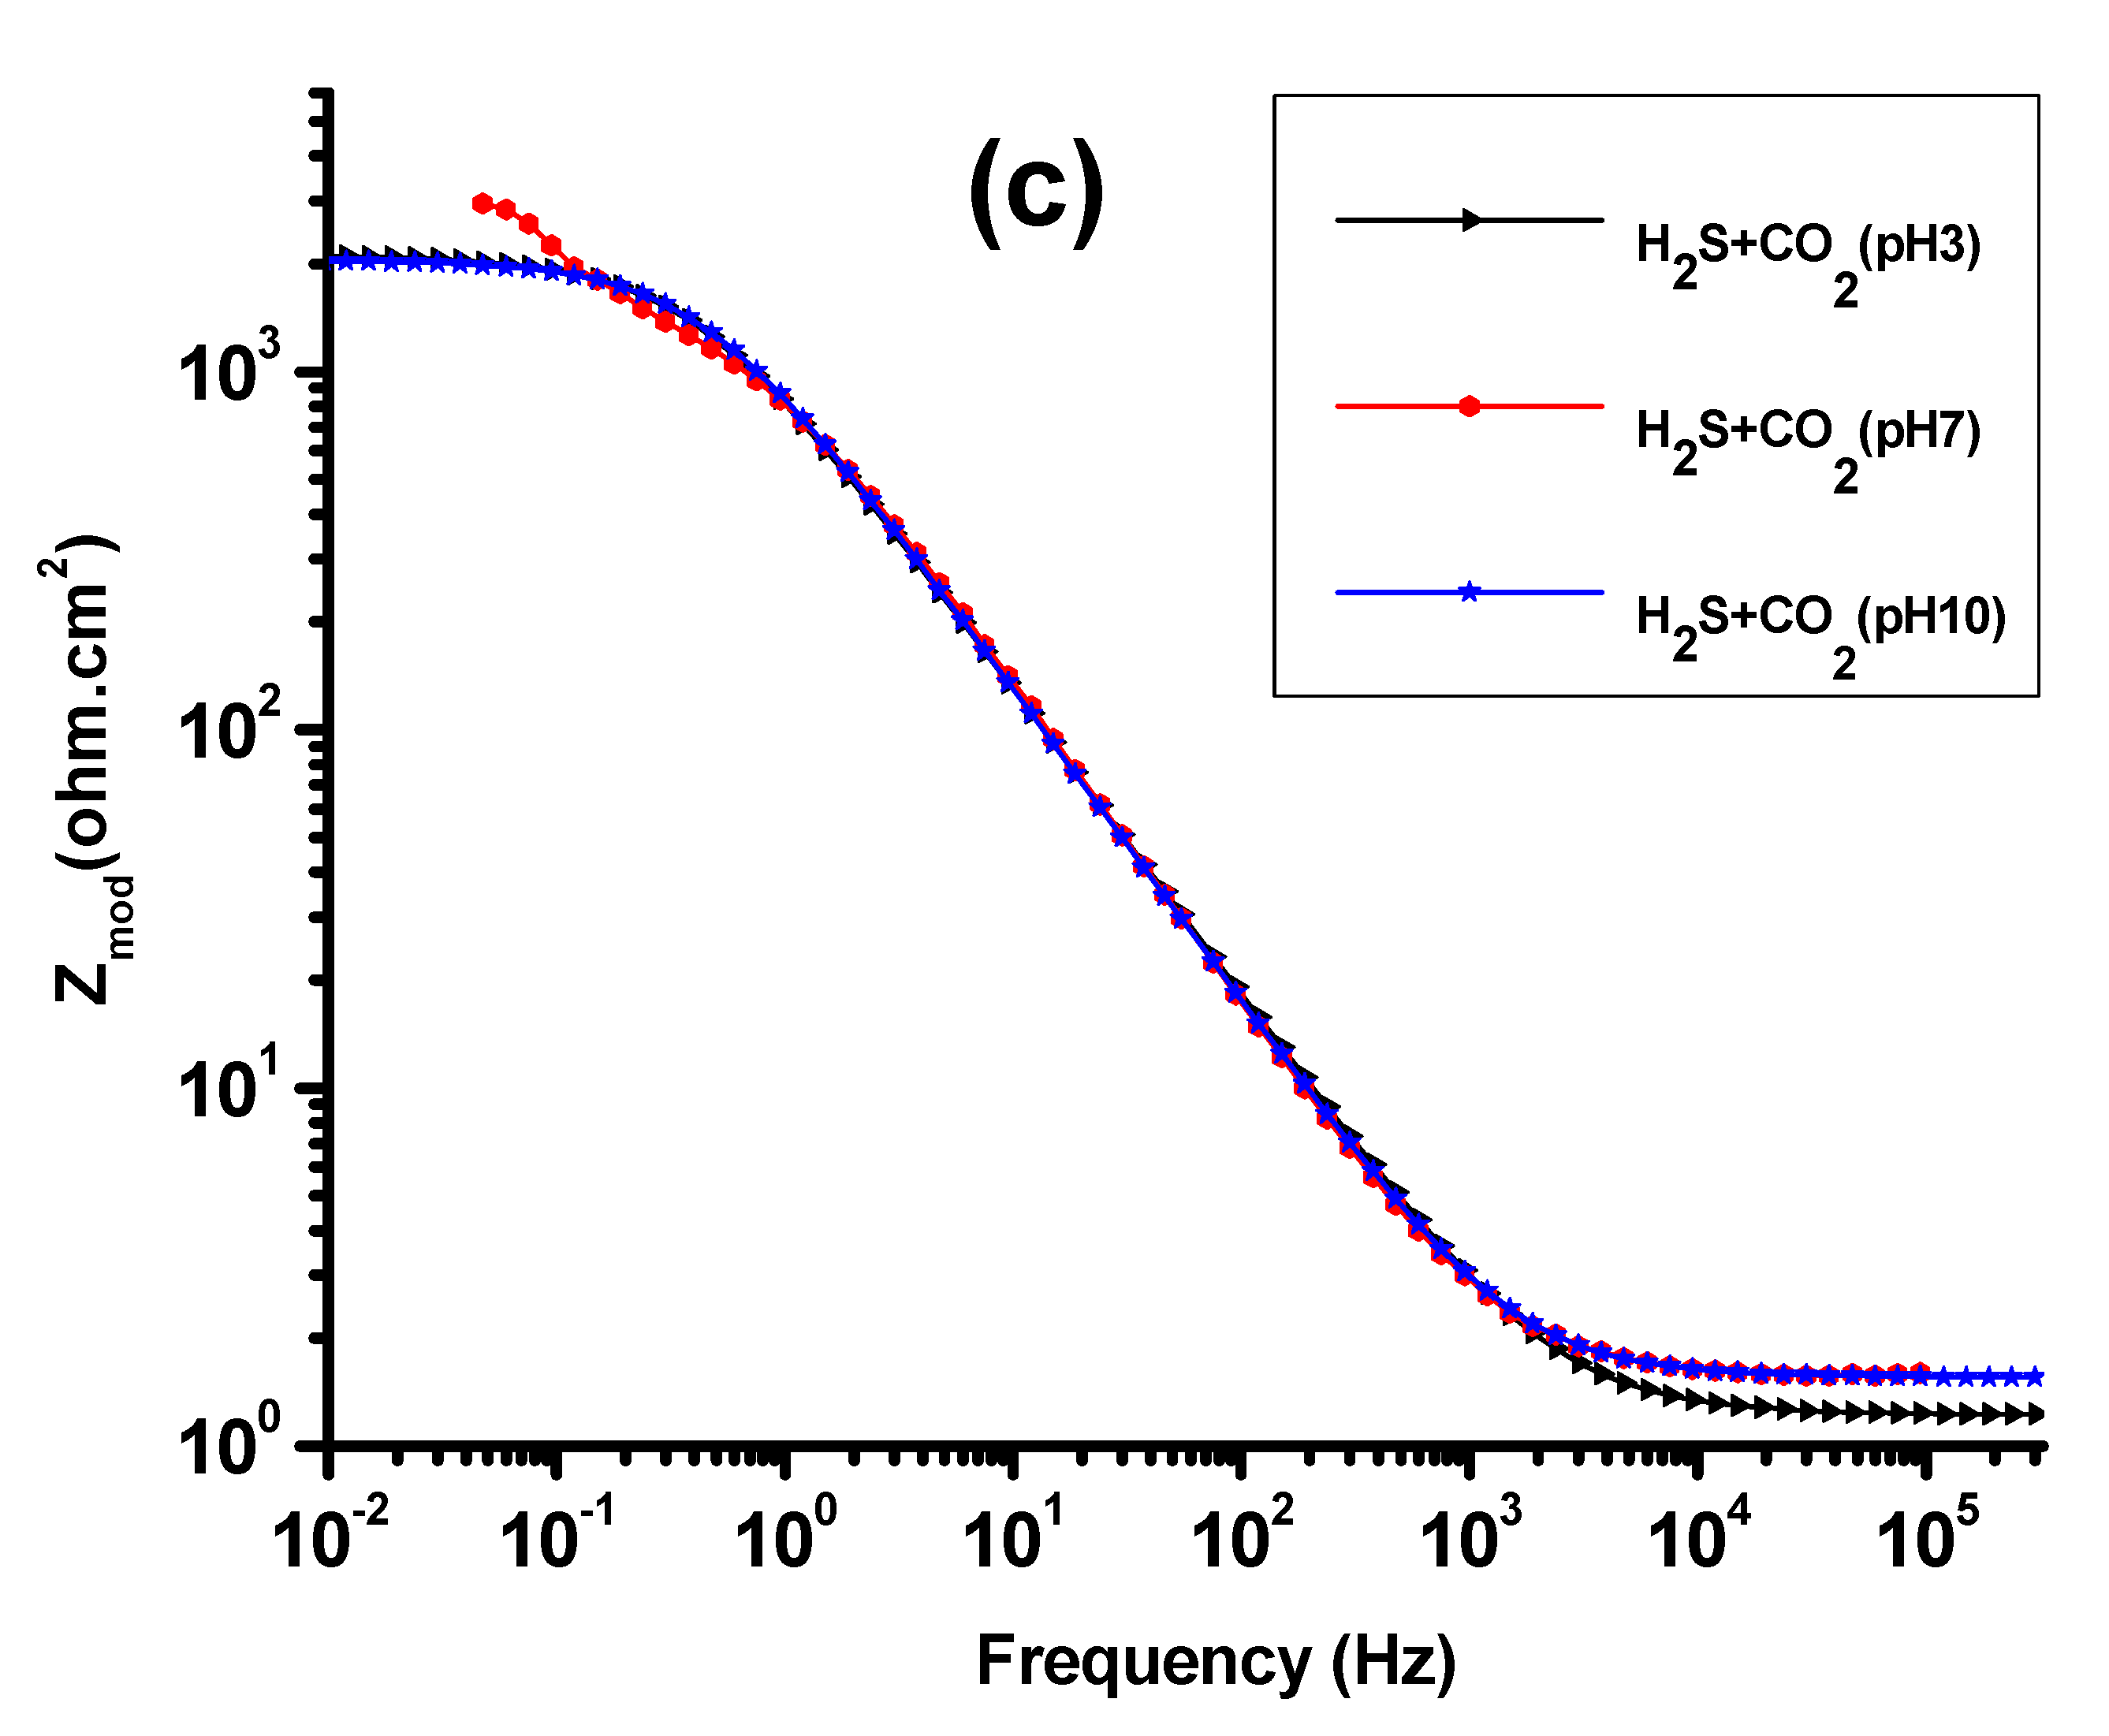
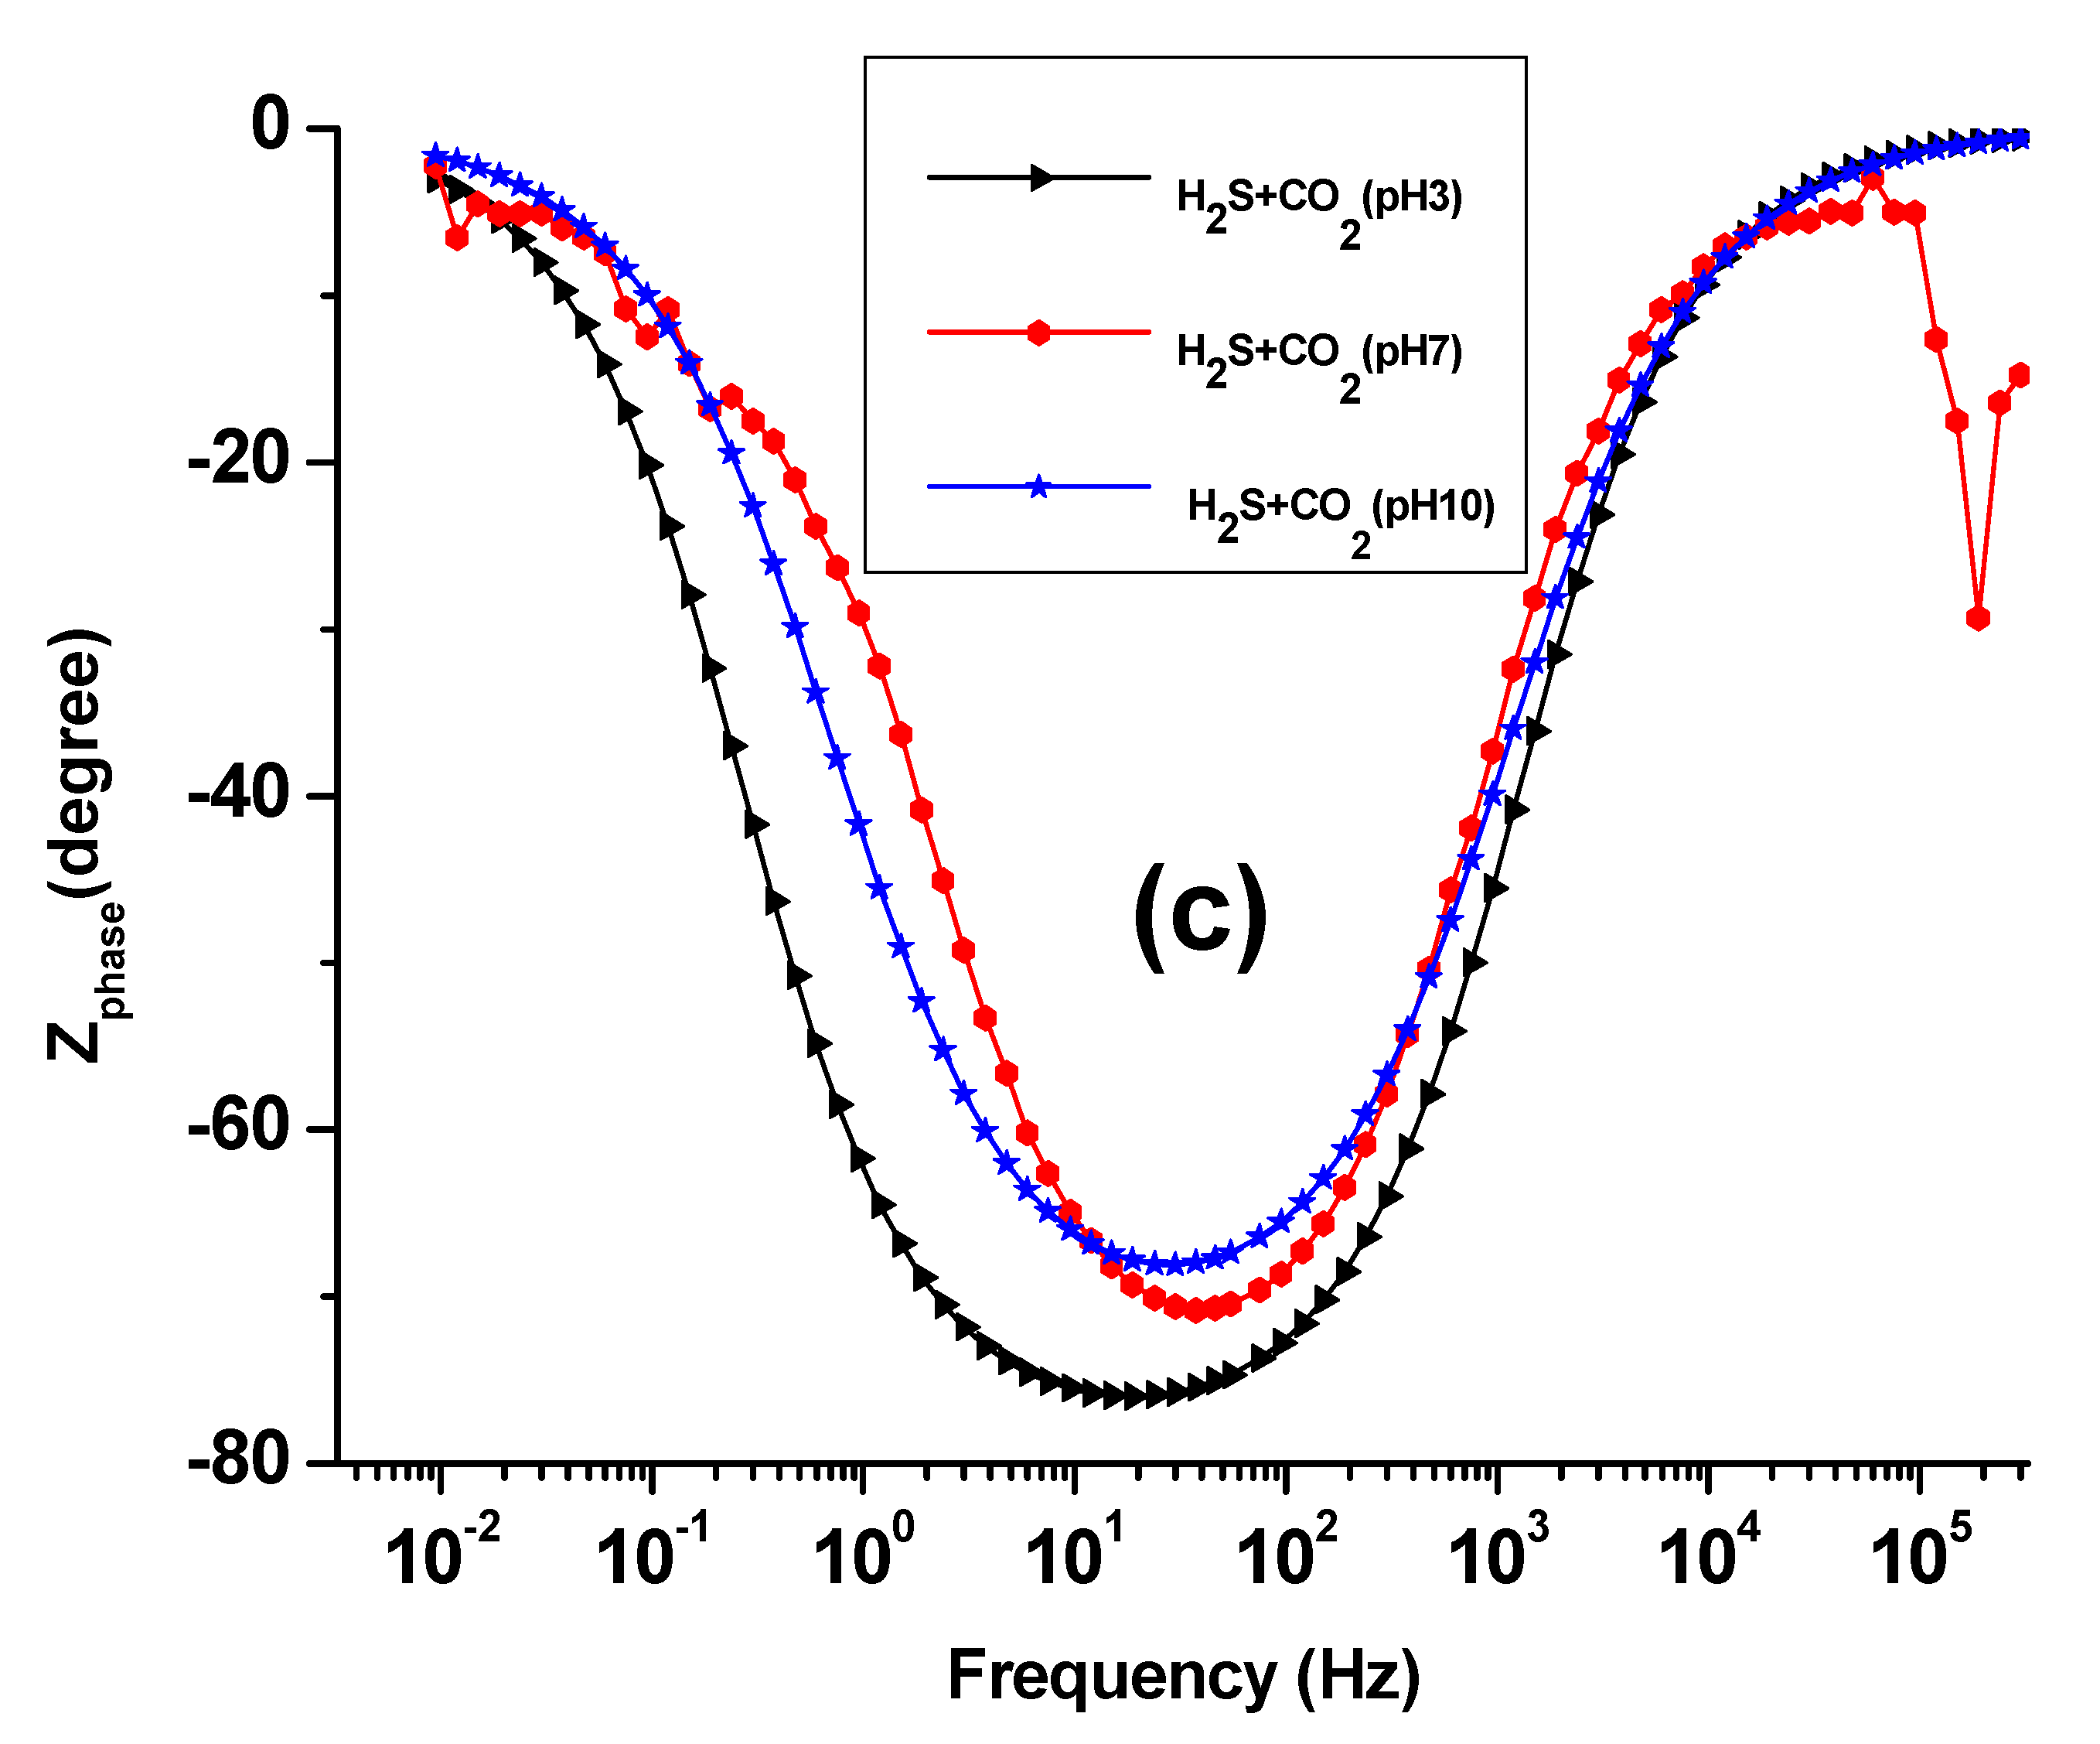
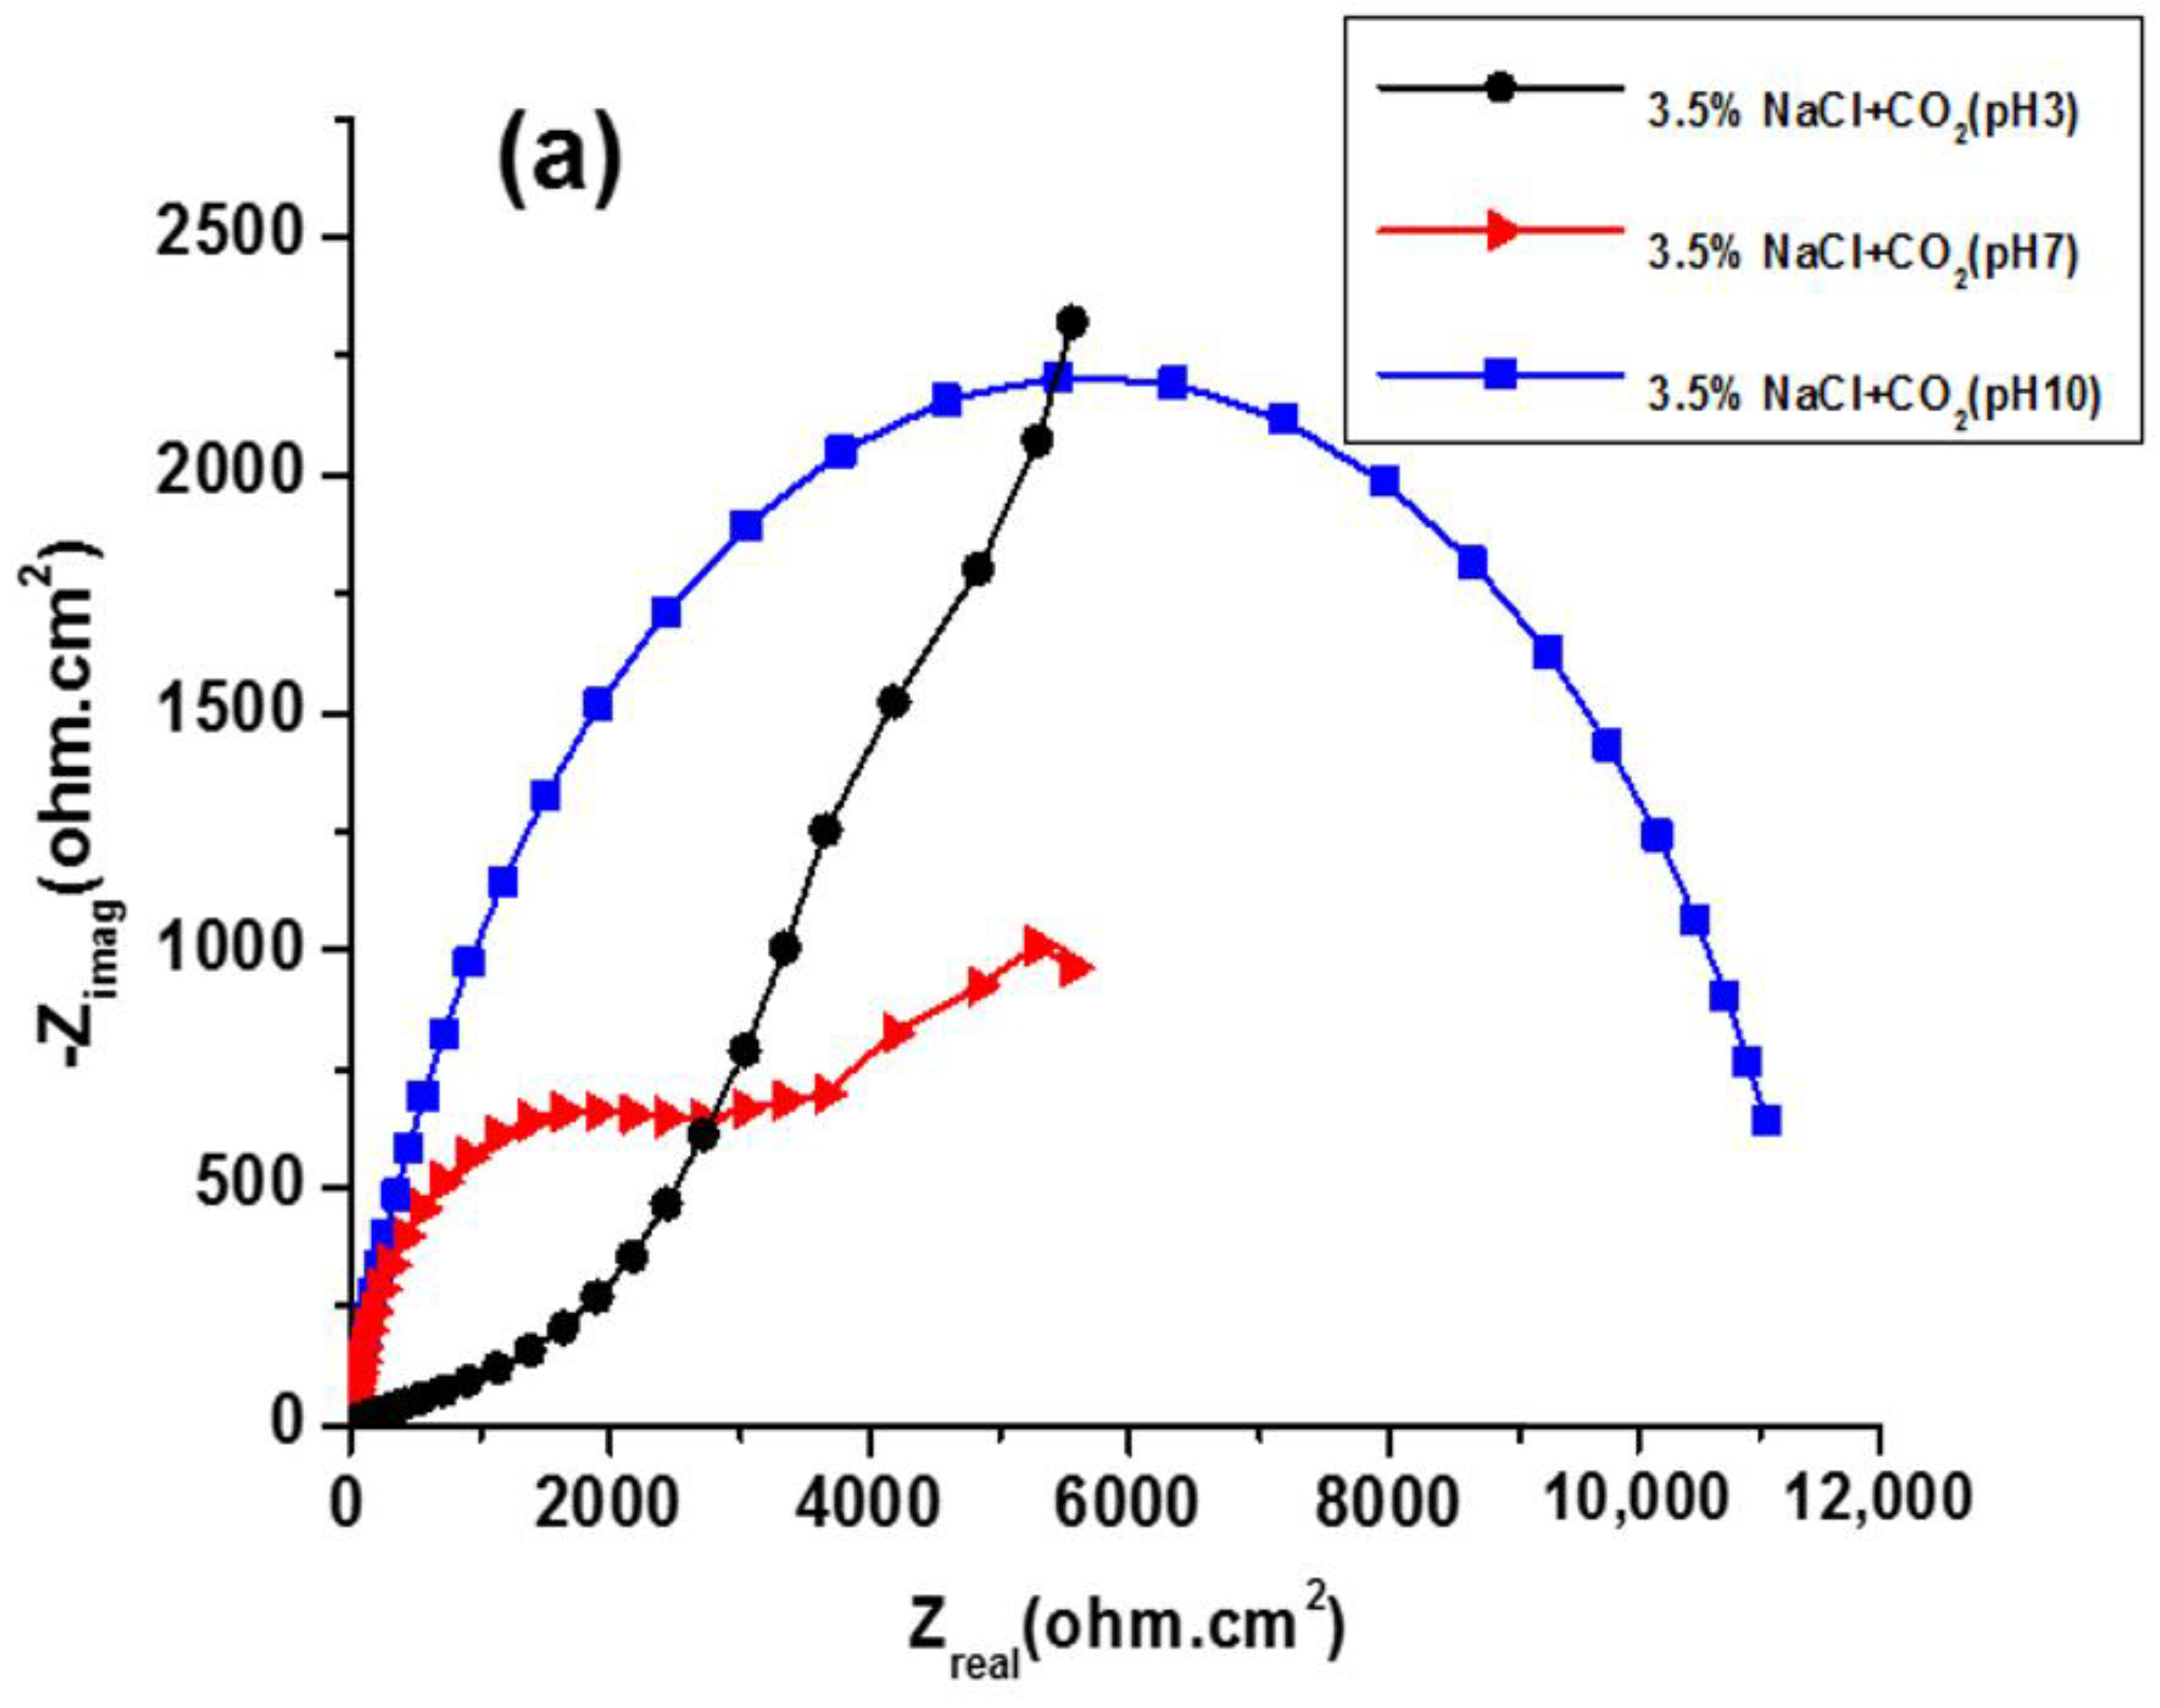
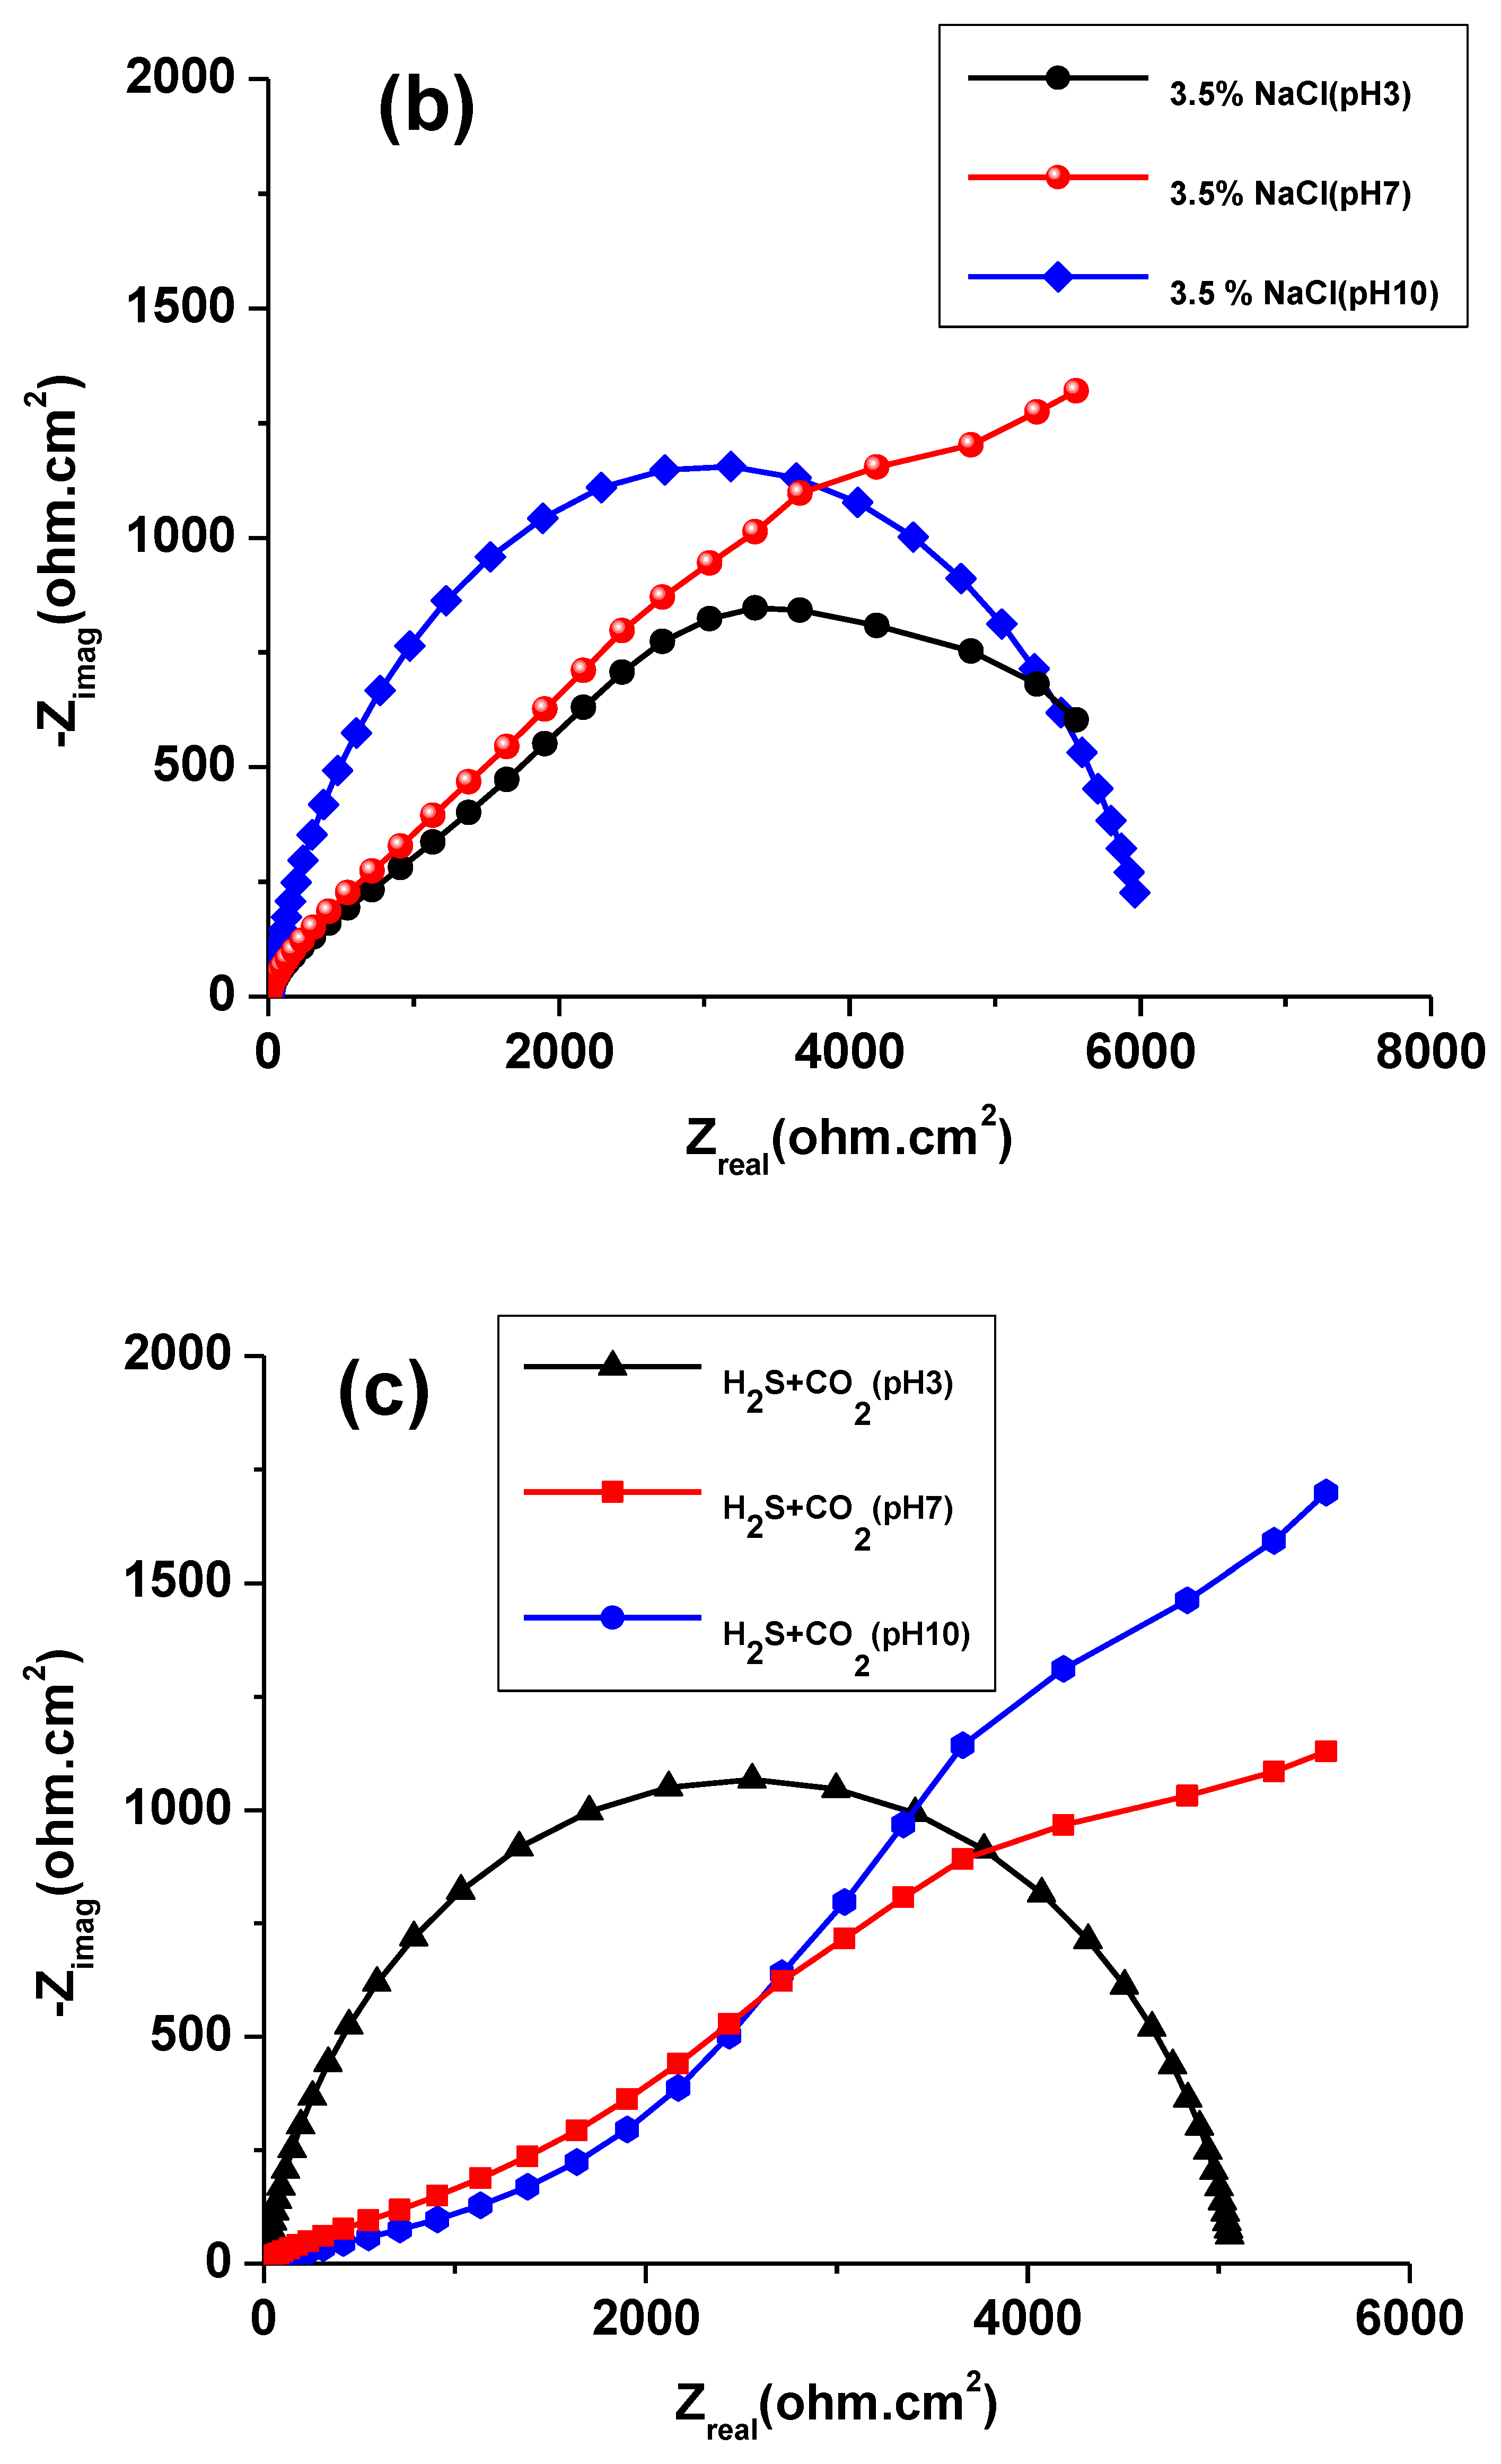
3.2. EIS Study
3.3. SEM Analysis
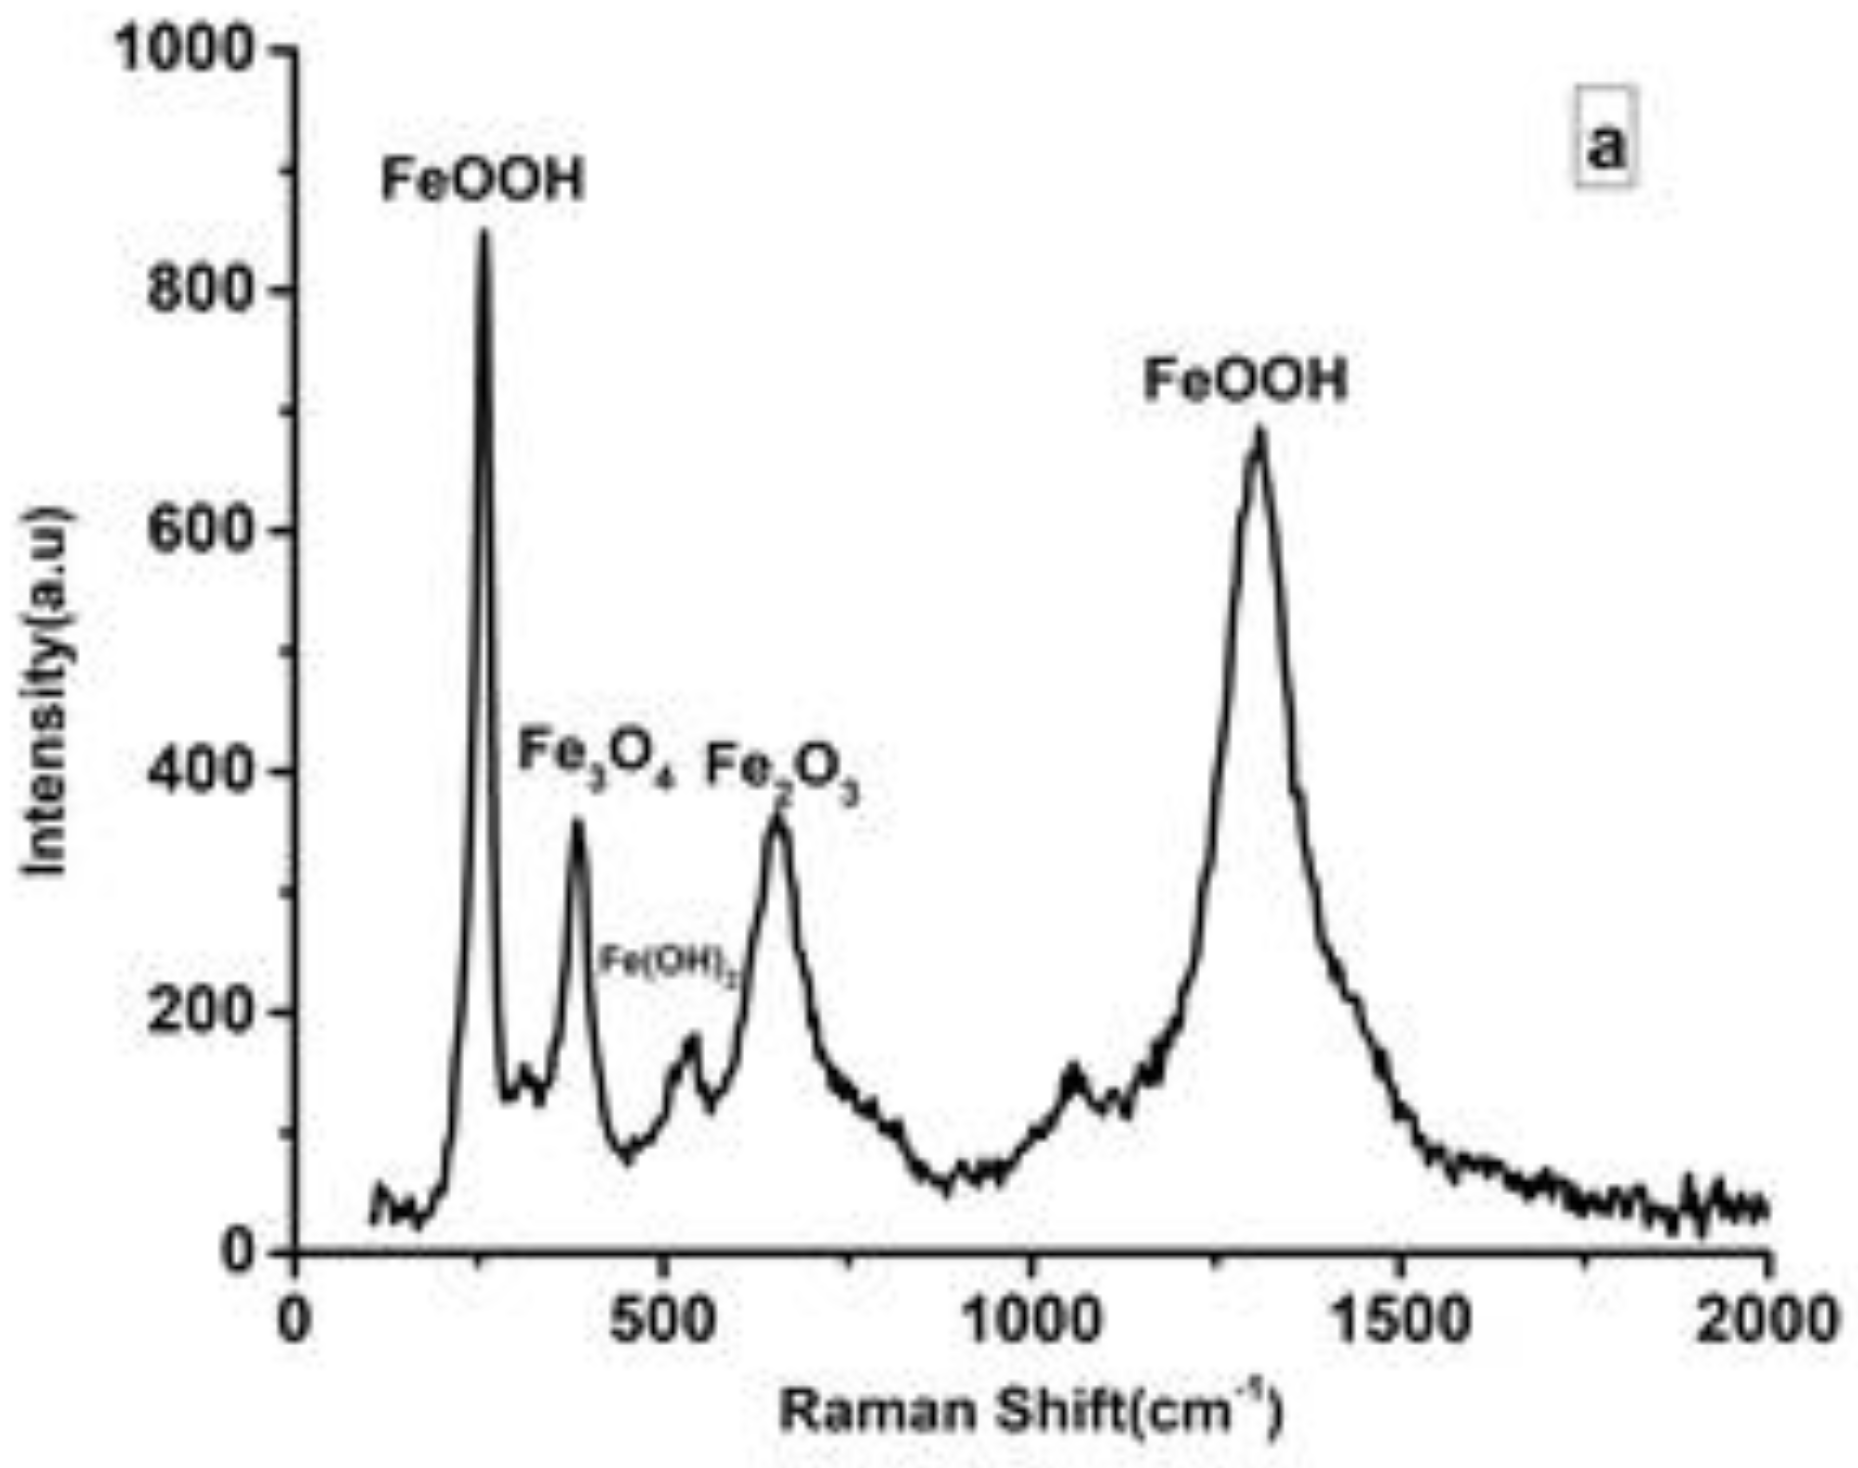
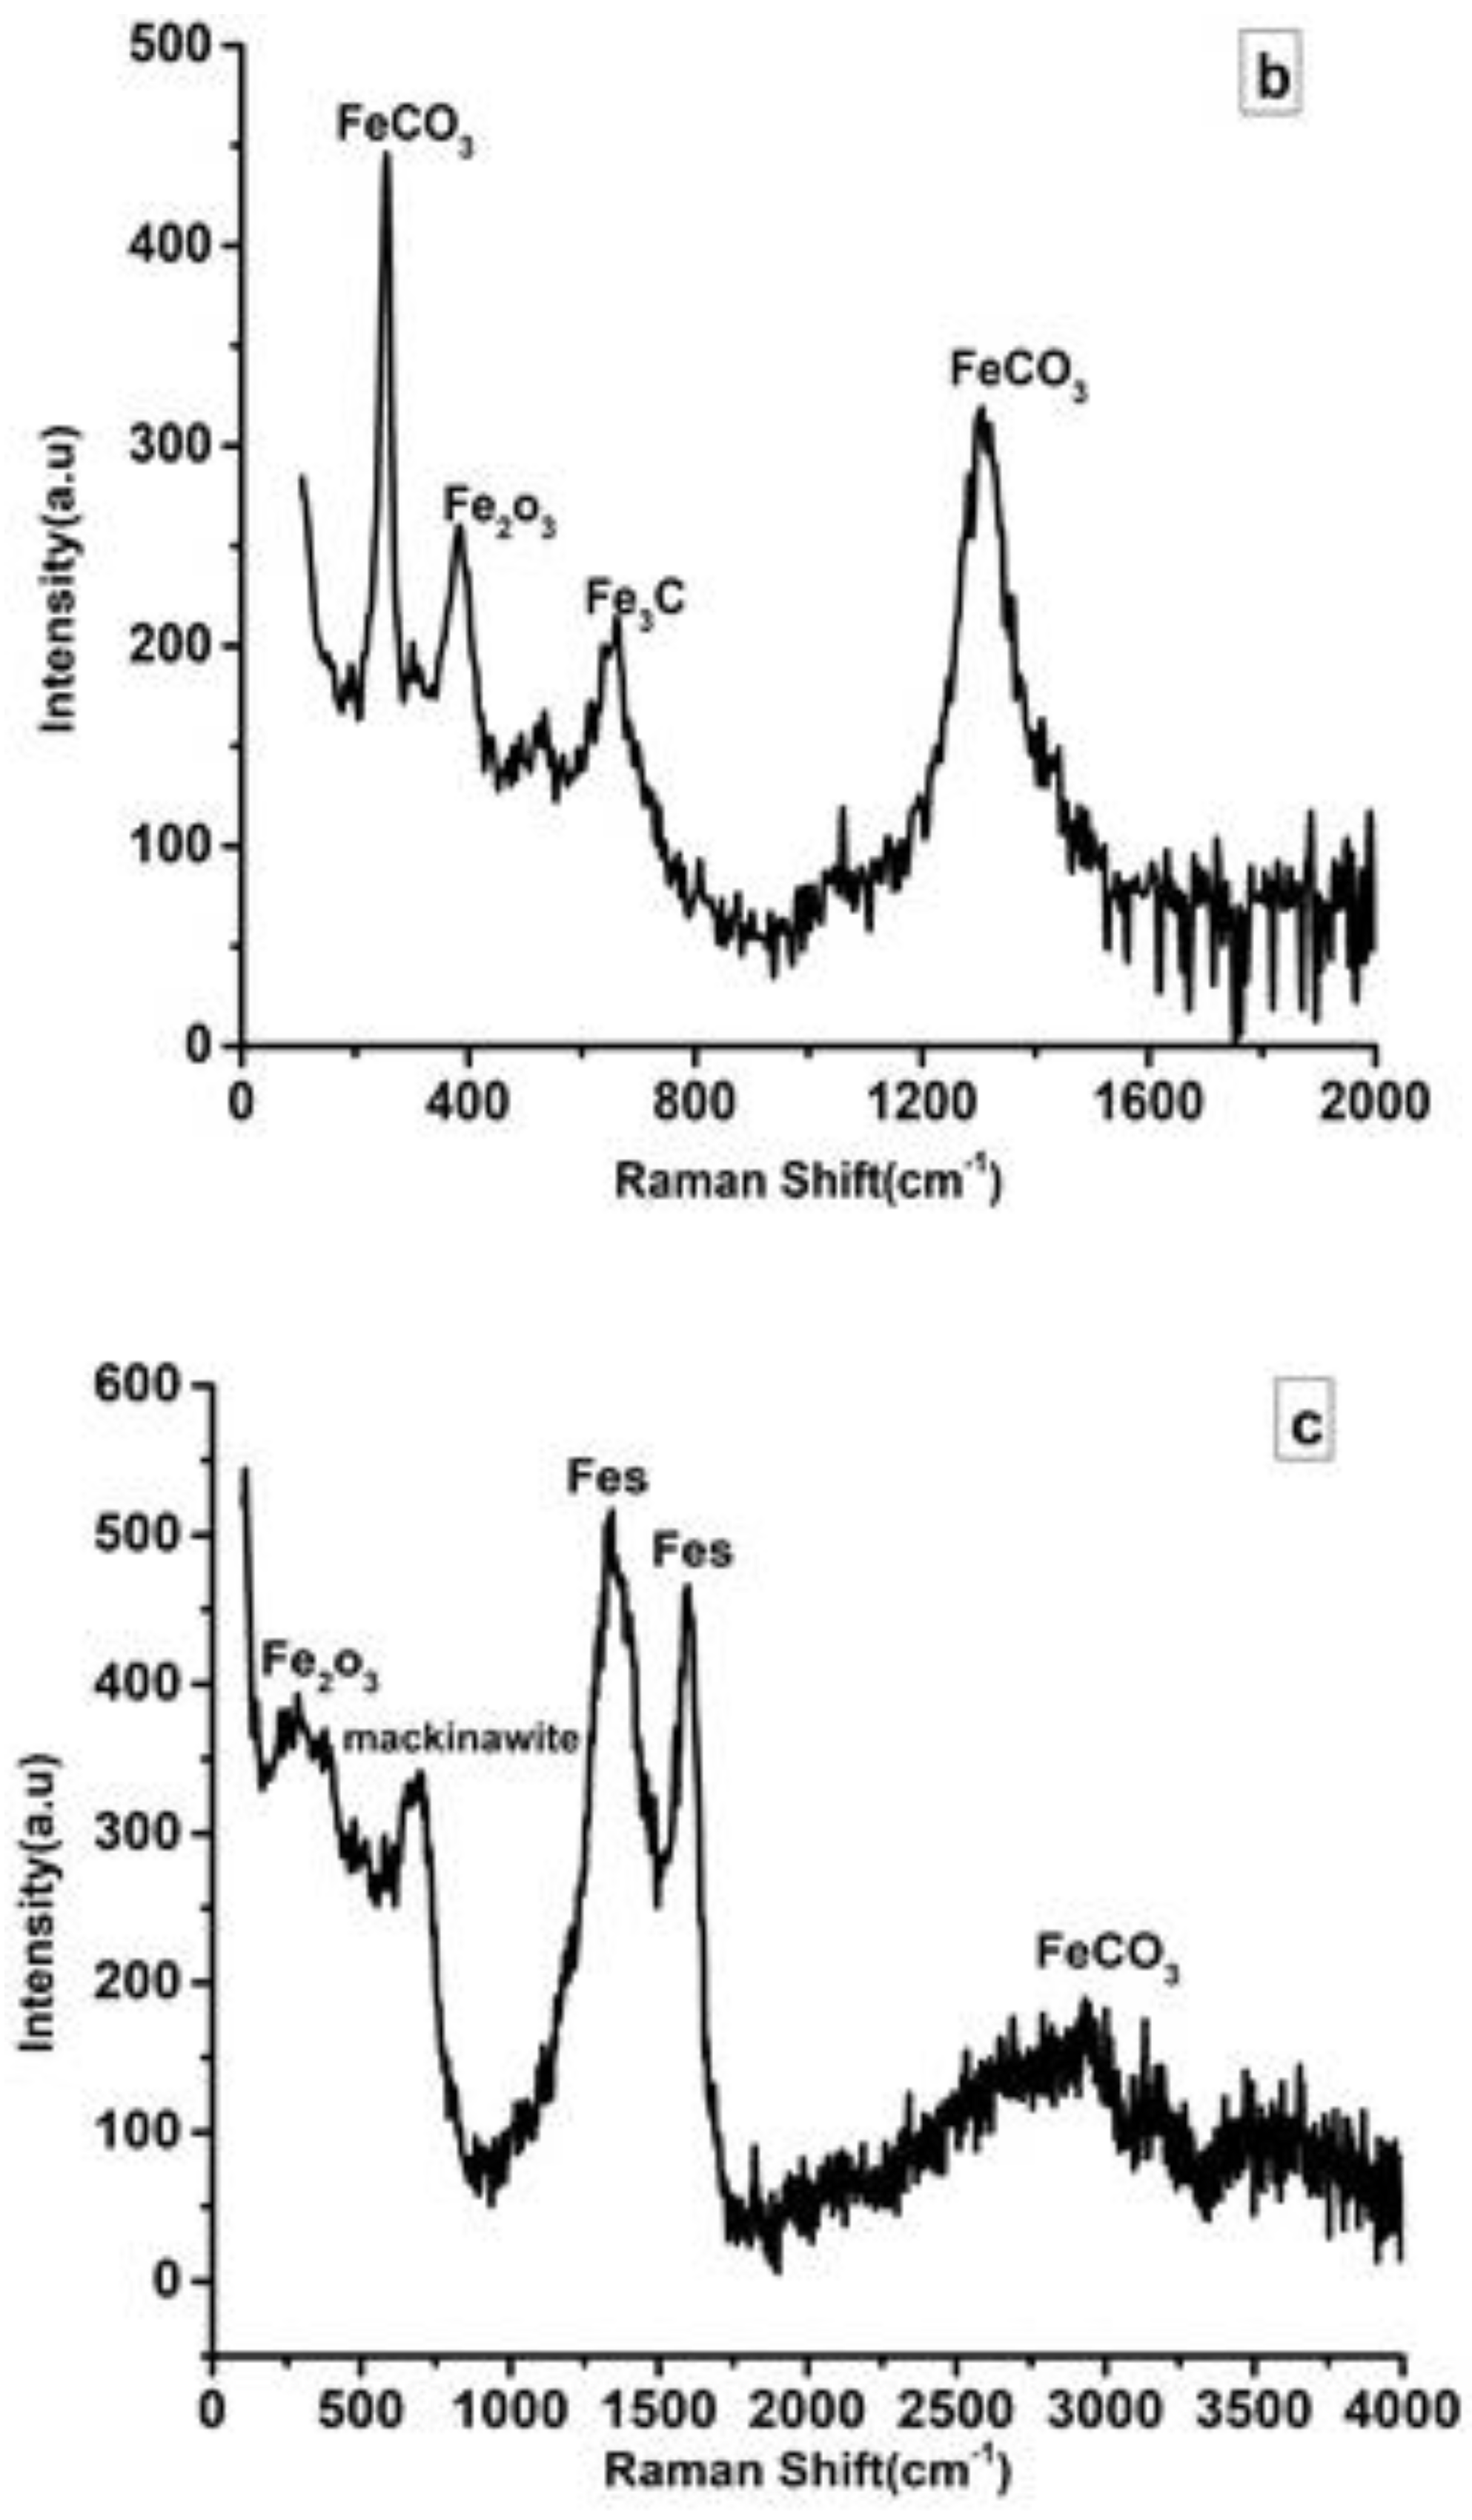
3.4. Raman Spectroscopy
4. Conclusions
Author Contributions
Funding
Institutional Review Board Statement
Informed Consent Statement
Data Availability Statement
Acknowledgments
Conflicts of Interest
References
- Moiseeva, L.S.; Kuksina, O.D. Predicting the Corrosion Aggressiveness of CO2-containing Media in Oil and Gas Wells. Chem. Pet. Eng. 2000, 36, 307–311. [Google Scholar] [CrossRef]
- Nešić, S. Key Issues Related to Modelling of Internal Corrosion of Oil and Gas Pipelines—A Review. Corros. Sci. 2007, 49, 4308–4338. [Google Scholar] [CrossRef]
- Drugli, J.M.; Rogne, T.; Svenning, M.; Axelsen, S.; Enerhaug, J. The Effect of Buffered Solutions in Corrosion Testing of Alloyed 13 % Cr Martensitic Stainless Steels for Mildly Sour Applications. In Proceedings of the NACE-International Corrosion Conference Series, San Antonio, TX, USA, April 1999; pp. 99–586. [Google Scholar]
- Carvalho, D.S.; Joia, C.J.B.; Mattos, O.R. Corrosion Rate of Iron and Iron-chromium Alloys in CO2 Medium. Corros. Sci. 2005, 47, 2974–2986. [Google Scholar] [CrossRef]
- Linter, B.; Burstein, G. Reactions of Pipeline Steels in Carbon Dioxide Solutions. Corros. Sci. 1999, 41, 117–139. [Google Scholar] [CrossRef]
- Seiersten, M. Material Selection for Separation, Transportation and Disposal of CO2. In Proceedings of the NACE-International Corrosion Conference Series, Houston, TX, USA, March 2001; p. 01042. [Google Scholar]
- Abdo, H.S.; Abdus Samad, U.; Mohammed, J.A.; Ragab, S.A.; Seikh, A.H. Mitigating Corrosion Effects of Ti-48Al-2Cr-2Nb Alloy Fabricated via Electron Beam Melting (EBM) Technique by Regulating the Immersion Conditions. Crystals 2021, 11, 889. [Google Scholar] [CrossRef]
- Storage, G.; Dioxide, C. Carbon Dioxide Capture for Storage in Deep Geologic Formations-Results from CO2 Capture Project, Volume 1: Capture and Separation of Carbon Dioxide form Combustion; Elsevier Publishing: Amsterdam, The Netherlands, 2005. [Google Scholar]
- Reyes, A.G.; Trompetter, W.J.; Britten, K.; Searle, J. Mineral Deposits in the Rotokawa Geothermal Pipelines, New Zealand. J. Volcanol. Geotherm. Res. 2003, 119, 215–239. [Google Scholar] [CrossRef]
- Cui, Z.D.; Wu, S.L.; Zhu, S.L.; Yang, X.J. Study on Corrosion Properties of Pipelines in Simulated Produced Water Saturated with Supercritical CO2. Appl. Surf. Sci. 2006, 252, 2368–2374. [Google Scholar] [CrossRef]
- López, D.; Schreiner, W.; de Sánchez, S.; Simison, S. The Influence of Carbon Steel Microstructure on Corrosion Layers. Appl. Surf. Sci. 2003, 207, 69–85. [Google Scholar] [CrossRef]
- López, D.A.; Pérez, T.; Simison, S.N. The Influence of Microstructure and Chemical Composition of Carbon and Low Alloy Steels in CO2 Corrosion. A state-of-the-art Appraisal. Mater. Des. 2003, 24, 561–575. [Google Scholar] [CrossRef]
- Banaś, J.; Lelek-Borkowska, U.; Mazurkiewicz, B.; Solarski, W. Effect of CO2 and H2S on the Composition and Stability of Passive Film on Iron Alloys in Geothermal Water. Electrochim. Acta 2007, 52, 5704–5714. [Google Scholar] [CrossRef]
- Abdo, H.S.; Seikh, A.H.; Mohammed, J.A.; Uzzaman, T. Ameliorative Corrosion Resistance and Microstructure Characterization of 2205 Duplex Stainless Steel by Regulating the Parameters of Pulsed Nd:YAG Laser Beam Welding. Metals 2021, 11, 1206. [Google Scholar] [CrossRef]
- Inaba, H.; Kimura, M.; Yokokawa, H. An Analysis of the Corrosion Resistance of Low Chromium-steel in a Wet CO2 Environment by the Use of an Electrochemical Potential Diagram. Corros. Sci. 1996, 38, 1449–1461. [Google Scholar] [CrossRef]
- Carew, J.; Akashah, S. Prediction Techniques for Materials Performance in the Crude Oil Production Systems. Model. Simul. Mater. Sci. Eng. 1994, 2, 371–382. [Google Scholar] [CrossRef]
- Wu, S.L.; Cui, Z.D.; He, F.; Bai, Z.Q.; Zhu, S.L.; Yang, X.J. Characterization of the Surface Film Formed from Carbon Dioxide Corrosion on N80 Steel. Mater. Lett. 2004, 58, 1076–1081. [Google Scholar] [CrossRef]
- Abdo, H.S.; Seikh, A.H.; Mohammed, J.A.; Soliman, M.S. Alloying Elements Effects on Electrical Conductivity and Mechanical Properties of Newly Fabricated Al Based Alloys Produced by Conventional Casting Process. Materials 2021, 14, 3971. [Google Scholar] [CrossRef]
- Heitkemper, M.; Fischer, A.; Bohne, C.; Pyzalla, A. Verschleißverhalten Des Laserwärmebehandelten, Hochstickstofflegierten Werkzeugstahls X30CrMoN15 1. Mater. Sci. Eng. Technol. 2000, 31, 918–922. [Google Scholar] [CrossRef]
- Abdo, H.S.; Seikh, A.H.; Mandal, B.B.; Mohammed, J.A.; Ragab, S.A.; Abdo, M.S. Microstructural Characterization and Corrosion-Resistance Behavior of Dual-Phase Steels Compared to Conventional Rebar. Crystals 2020, 10, 1068. [Google Scholar] [CrossRef]
- Isfahany, A.N.; Saghafian, H.; Borhani, G. The Effect of Heat Treatment on Mechanical Properties and Corrosion Behavior of AISI420 Martensitic Stainless Steel. J. Alloys Compd. 2011, 509, 3931–3936. [Google Scholar] [CrossRef]
- Kemp, M.; van Bennekom, A.; Robinson, F.P.A. Evaluation of the Corrosion and Mechanical Properties of a Range of Experimental Cr-Mn Stainless Steels. Mater. Sci. Eng. A 1995, 199, 183–194. [Google Scholar] [CrossRef]
- Tahara, A.; Shinohara, T. Influence of the Alloy Element on Corrosion Morphology of the Low Alloy Steels Exposed to the Atmospheric Environments. Corros. Sci. 2005, 47, 2589–2598. [Google Scholar] [CrossRef]
- Brown, B.; Parakala, S.R.; Nesic, S. CO2 corrosion in the presence of trace amounts of H2S. NACE Meet. paper no. NACE-04736, 28 March–1 April 2004.
- Moreira, R.M.; Franco, C.V.; Joia, C.J.B.M.; Giordana, S.; Mattos, O.R. The Effects of Temperature and Hydrodynamics on the CO2 Corrosion of 13Cr and 13Cr5Ni2Mo Stainless Steels in the Presence of Free Acetic Acid. Corros. Sci. 2004, 46, 2987–3003. [Google Scholar] [CrossRef]
- Abdo, H.S.; Seikh, A.H.; Mohammed, J.A.; Luqman, M.; Ragab, S.A.; Almotairy, S.M. Influence of Chloride Ions on Electrochemical Corrosion Behavior of Dual-Phase Steel over Conventional Rebar in Pore Solution. Appl. Sci. 2020, 10, 4568. [Google Scholar] [CrossRef]
- Shoesmith, D.W. The Formation of Ferrous Monosulfide Polymorphs during the Corrosion of Iron by Aqueous Hydrogen Sulfide at 21 °C. J. Electrochem. Soc. 1980, 127, 1007. [Google Scholar] [CrossRef]
- Ma, H.; Cheng, X.; Li, G.; Chen, S.; Quan, Z.; Zhao, S.; Niu, L. The Influence of Hydrogen Sulfide on Corrosion of Iron under Different Conditions. Corros. Sci. 2000, 42, 1669–1683. [Google Scholar] [CrossRef]
- López-Rendón, R.; Alejandre, J. Molecular Dynamics Simulations of the Solubility of H2S and CO2 in Water. J. Mex. Chem. Soc. 2008, 52, 88–92. [Google Scholar]
- Srinivasan, S.; Kane, R.D. Prediction of Corrosivity of CO2/H2S Production Environments. In Proceedings of the NACE—International Corrosion Conference Series, Denver, CO, USA, March 1996. [Google Scholar]
- Sun, W. Kinetics of Iron Carbonate and Iron Sulfide Scale Formation in CO2/H2S Corrosion. Ph.D. Thesis, Ohio University, Athens, OH, USA, 2006. [Google Scholar]
- Donik, Č.; Paulin, I.; Jenko, M. Influence of MnS Inclusions on the Corrosion of Austenitic Stainless Steels. Mater. Tehnol. 2010, 44, 67–72. [Google Scholar]
- Ikeda, A.; Mukai, S.; Ueda, M. Corrosion Behavior of 9 to 25% Cr Steels in Wet CO 2 Environments. Corrosion 1985, 41, 185–192. [Google Scholar] [CrossRef]
- Shukla, A.K.; Balasubramaniam, R.; Bhargava, S. Properties of Passive Film Formed on CP Titanium, Ti-6Al-4V and Ti-13.4Al-29Nb Alloys in Simulated Human Body Conditions. Intermetallics 2005, 13, 631–637. [Google Scholar] [CrossRef]
- Kobayashi, E.; Wang, T.J.; Doi, H.; Yoneyama, T.; Hamanaka, H. Mechanical Properties and Corrosion Resistance of Ti-6Al-7Nb Alloy Dental Castings. J. Mater. Sci. Mater. Med. 1998, 9, 567. [Google Scholar] [CrossRef]
- Sánchez, M.; Gregori, J.; Alonso, C.; García-Jareño, J.J.; Takenouti, H.; Vicente, F. Electrochemical Impedance Spectroscopy for Studying Passive Layers on Steel Rebars Immersed in Alkaline Solutions Simulating Concrete pores. Electrochim. Acta 2007, 52, 7634–7641. [Google Scholar] [CrossRef]
- Thibeau, R.J.; Brown, C.W.; Heidersbach, R.H. Raman Spectra of Possible Corrosion Products of Iron. Appl. Spectrosc. 1978, 32, 532–535. [Google Scholar] [CrossRef]
- Farrow, R.L.; Mattern, P.L.; Nagelberg, A.S. Characterization of Surface Oxides by Raman Spectroscopy. Appl. Phys. Lett. 1980, 36, 212–214. [Google Scholar] [CrossRef]
- Zhang, G.A.; Zeng, Y.; Guo, X.P.; Jiang, F.; Shi, D.Y.; Chen, Z.Y. Electrochemical Corrosion Behavior of Carbon Steel under Dynamic High Pressure H2S/CO2 Environment. Corros. Sci. 2012, 65, 37–47. [Google Scholar] [CrossRef]
- Gao, M.; Pang, X.; Gao, K. The Growth Mechanism of CO2 Corrosion Product Films. Corros. Sci. 2011, 53, 557–568. [Google Scholar] [CrossRef]
- Choi, Y.S.; Hassani, S.; Vu, T.N.; Nesic, S.; Abas, A.Z.B. Effect of H2S on the Corrosion Behavior of Pipeline Steels in Supercritical and Liquid CO2 Environments. Corrosion 2016, 72, 999–1009. [Google Scholar] [CrossRef]


| Solution | pH | icorr (A cm−2) | Ecorr (V) |
|---|---|---|---|
| 3.5%. NaCl + CO2 | 3 | 2 × 10⁻⁷ | −0.3633 |
| 7 | 1 × 10⁻⁷ | −0.3013 | |
| 10 | 3 × 10⁻⁸ | −0.0073 | |
| 3.5% NaCl | 3 | 6 × 10⁻⁷ | −0.3699 |
| 7 | 3 × 10⁻⁶ | −0.4422 | |
| 10 | 2 × 10⁻⁶ | −0.4282 | |
| CO2 + H2S | 3 | 2 × 10⁻⁵ | −0.1313 |
| 7 | 6 × 10⁻⁶ | −0.4259 | |
| 10 | 3 × 10⁻⁶ | −0.3291 |
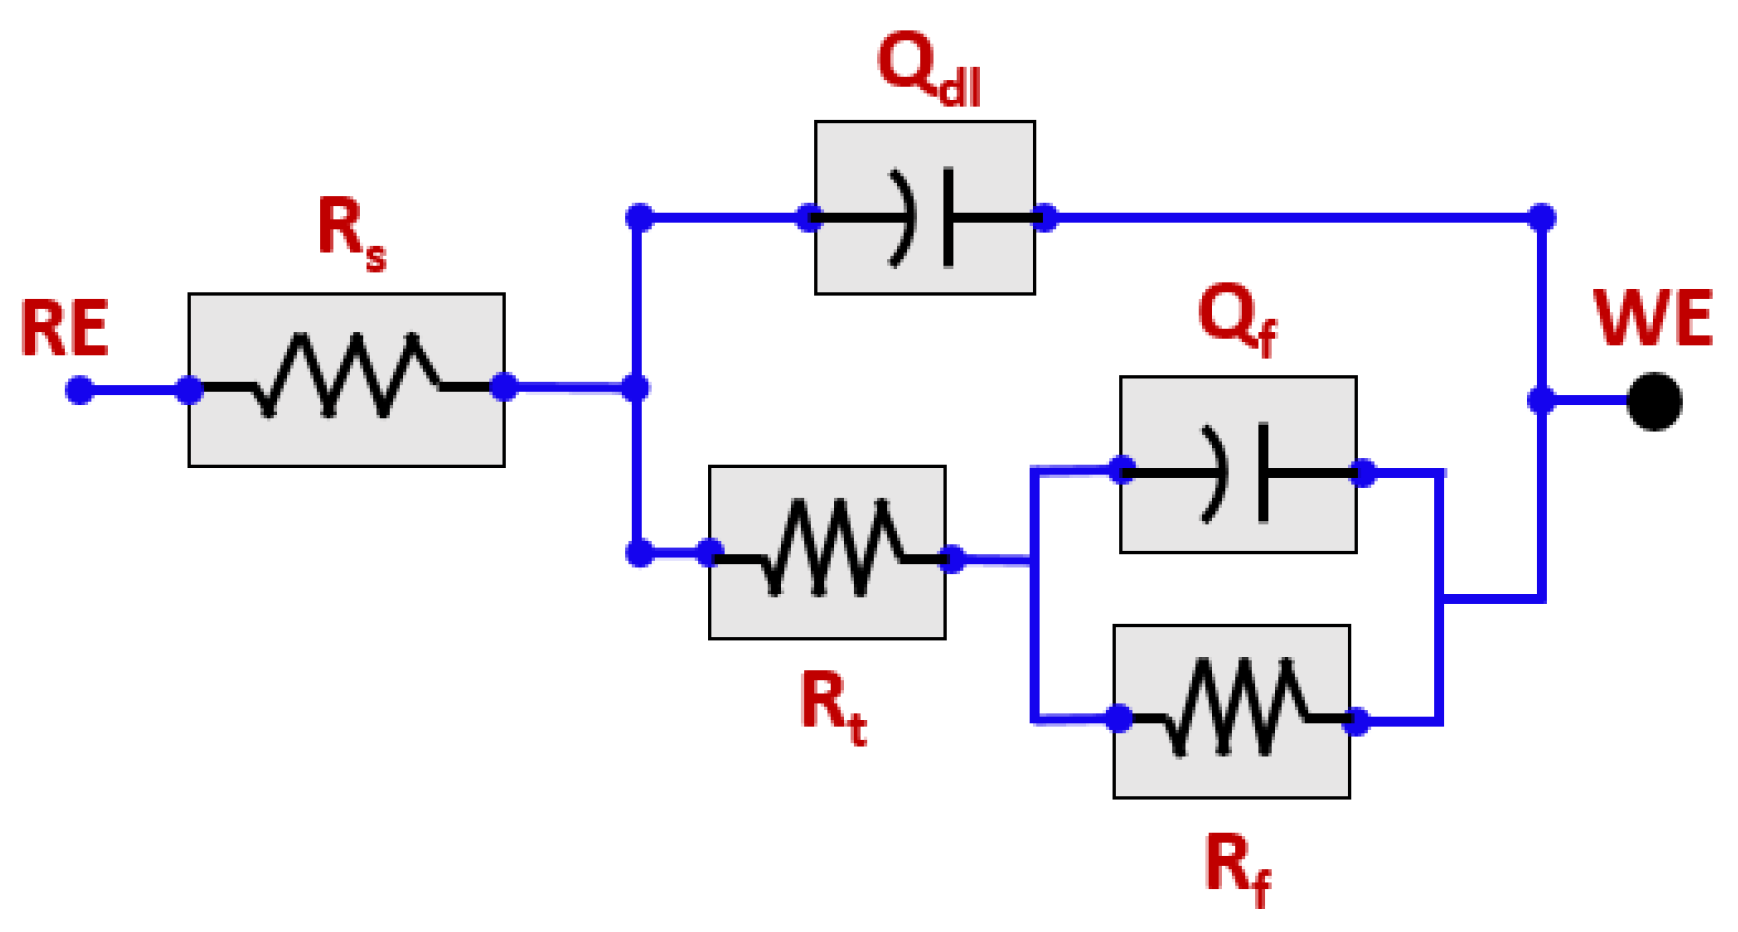
| Solution | pH | Rs (ohm-cm2) | Rt (k.ohm.cm2) | Rf (k.ohm.cm2) | Qdl (F.cm2) | Qf (F.cm2) | X2, chi Squared |
|---|---|---|---|---|---|---|---|
| CO2 | 3 | 51.2 | 4.96 | 5.86 | 1362 | 10.43 × 10⁻⁴ | 5.14 × 10⁻³ |
| 7 | 39.9 | 5.83 | 6.80 | 2146 | 12.26 × 10⁻⁴ | 4.43 × 10⁻³ | |
| 10 | 61.6 | 10.41 | 12.40 | 4150 | 14.56 × 10⁻⁴ | 3.15 × 10⁻³ | |
| 3.5% NaCl | 3 | 41.6 | 4.61 | 4.78 | 3186 | 6.02 × 10⁻⁴ | 5.23 × 10⁻³ |
| 7 | 52.9 | 5.10 | 4.90 | 4195 | 6.98 × 10⁻⁴ | 4.31 × 10⁻³ | |
| 10 | 71.6 | 5.11 | 5.20 | 6282 | 9.84 × 10⁻⁴ | 4.77 × 10⁻³ | |
| CO2 + H2S | 3 | 36.5 | 3.29 | 3.45 | 3845 | 3.98 × 10⁻⁴ | 5.99 × 10⁻³ |
| 7 | 55.6 | 4.15 | 4.01 | 4288 | 4.98 × 10⁻⁴ | 4.35 × 10⁻³ | |
| 10 | 61.6 | 4.59 | 4.24 | 6211 | 5.34 × 10⁻⁴ | 4.23 × 10⁻³ |
Publisher’s Note: MDPI stays neutral with regard to jurisdictional claims in published maps and institutional affiliations. |
© 2021 by the authors. Licensee MDPI, Basel, Switzerland. This article is an open access article distributed under the terms and conditions of the Creative Commons Attribution (CC BY) license (https://creativecommons.org/licenses/by/4.0/).
Share and Cite
Abdo, H.S.; Seikh, A.H. Role of NaCl, CO2, and H2S on Electrochemical Behavior of 304 Austenitic Stainless Steel in Simulated Oil Industry Environment. Metals 2021, 11, 1347. https://doi.org/10.3390/met11091347
Abdo HS, Seikh AH. Role of NaCl, CO2, and H2S on Electrochemical Behavior of 304 Austenitic Stainless Steel in Simulated Oil Industry Environment. Metals. 2021; 11(9):1347. https://doi.org/10.3390/met11091347
Chicago/Turabian StyleAbdo, Hany S., and Asiful H. Seikh. 2021. "Role of NaCl, CO2, and H2S on Electrochemical Behavior of 304 Austenitic Stainless Steel in Simulated Oil Industry Environment" Metals 11, no. 9: 1347. https://doi.org/10.3390/met11091347
APA StyleAbdo, H. S., & Seikh, A. H. (2021). Role of NaCl, CO2, and H2S on Electrochemical Behavior of 304 Austenitic Stainless Steel in Simulated Oil Industry Environment. Metals, 11(9), 1347. https://doi.org/10.3390/met11091347