1. Introduction
Grain boundary segregation is a phenomenon of increasing importance, e.g., in connection with the stabilization of nanocrystalline structures [
1,
2,
3]. The development of methods of theoretical calculations, mainly those based on density functional theory (DFT), enabled the recently increasing amount of new data on segregation energy for various systems, including metallic alloys [
4].
Despite the admirable progress in theoretical calculations, its fundamental drawback is that the segregation energy can only be calculated for 0 K. This means that the Gibbs energy of segregation, Δ
GI, which is formed by the segregation enthalpy, Δ
HI; and by the product of temperature,
T, and the segregation entropy, Δ
SI,
reduces to Δ
GI(0 K) = Δ
HI, and the value of the segregation entropy cannot be obtained. It is noteworthy that the segregation enthalpy is related to the segregation energy,
by
However, the value of the product
is extremely low at normal pressure and thus negligible [
5], so that practically
, and the Gibbs energy of segregation is equal to the Helmholtz energy of segregation. Accordingly, in the following, we consider
and
to be identical. By the term “segregation entropy”, we consider all its contributions, such as vibrational, anharmonic and multiplicity, except mixing entropy [
6]. Without segregation entropy, it is impossible to realistically quantify the temperature dependence of grain boundary composition, given by [
7]
In Equation (2),
XI is the bulk concentration, and
is the grain boundary (GB) occupation ratio, i.e., the ratio of the grain boundary concentration,
, and the maximum reachable concentration of solute
I at the grain boundary (site) in host
M,
,
In fact,
where the symbols marked by upper index “0” are the standard (ideal) thermodynamic quantities of grain boundary segregation, and
is the excess Gibbs energy of segregation allowing for real behavior [
6]. As
represents the combination of activity coefficients of the solute and the host metal, both in volume and at the grain boundary [
7], it is complicated to obtain its values. Therefore, it has frequently been approximated by the Fowler term,
where
is the binary interaction parameter [
7].
To simplify the situation, the segregation entropy is neglected in some cases. Although segregation enthalpy is generally considered as characterizing the tendency of the solute to segregate, segregation entropy plays an additional important role in establishing the concentration level of the segregant at the grain boundaries. In particular, this is the case when the entropy term,
TΔ
SI, is larger (in absolute values) than the enthalpy, Δ
HI, i.e.,
In this case, the contribution of the segregation entropy is the dominating factor in controlling the grain boundary composition. This situation, described recently, was designated as entropy-dominated grain boundary segregation [
6,
8].
In contrast to the experiment, in which the averaged values of the segregation enthalpy and entropy can be determined from the temperature dependence of the cumulative grain boundary concentration over all grain boundary sites, theoretical calculations provide the values of segregation energy for individual grain boundary sites, but no information about the segregation entropy is obtained. Some of the sites exhibit strong segregation tendency with negative values of the segregation energy. On the other hand, there are sites with positive values of segregation energy, which are generally considered as “anti-segregation” sites (e.g., [
9]). In this context, the following question arises: is it possible to extrapolate Equation (6) to positive values of Δ
HI if the values of the product
? This would mean that a solute could additionally occupy an “anti-segregation” site due to the effect of the segregation entropy.
In the present paper, we attempted to model such situation using both the theoretically calculated segregation energies found in the literature and the simple phenomenological tools. If a solute segregates at the grain boundaries, even if its segregation energy/enthalpy is positive, such a phenomenon is called entropy-driven grain boundary segregation.
2. Proposal of Entropy-Driven Grain Boundary Segregation
As mentioned above, the phenomenon of entropy-dominated grain boundary segregation was introduced and supported by the available data classified according to Equation (6) [
6,
8]. As usual, we limited our consideration to the negative values of
and to both positive and negative values of
, which fulfill Equation (6) for
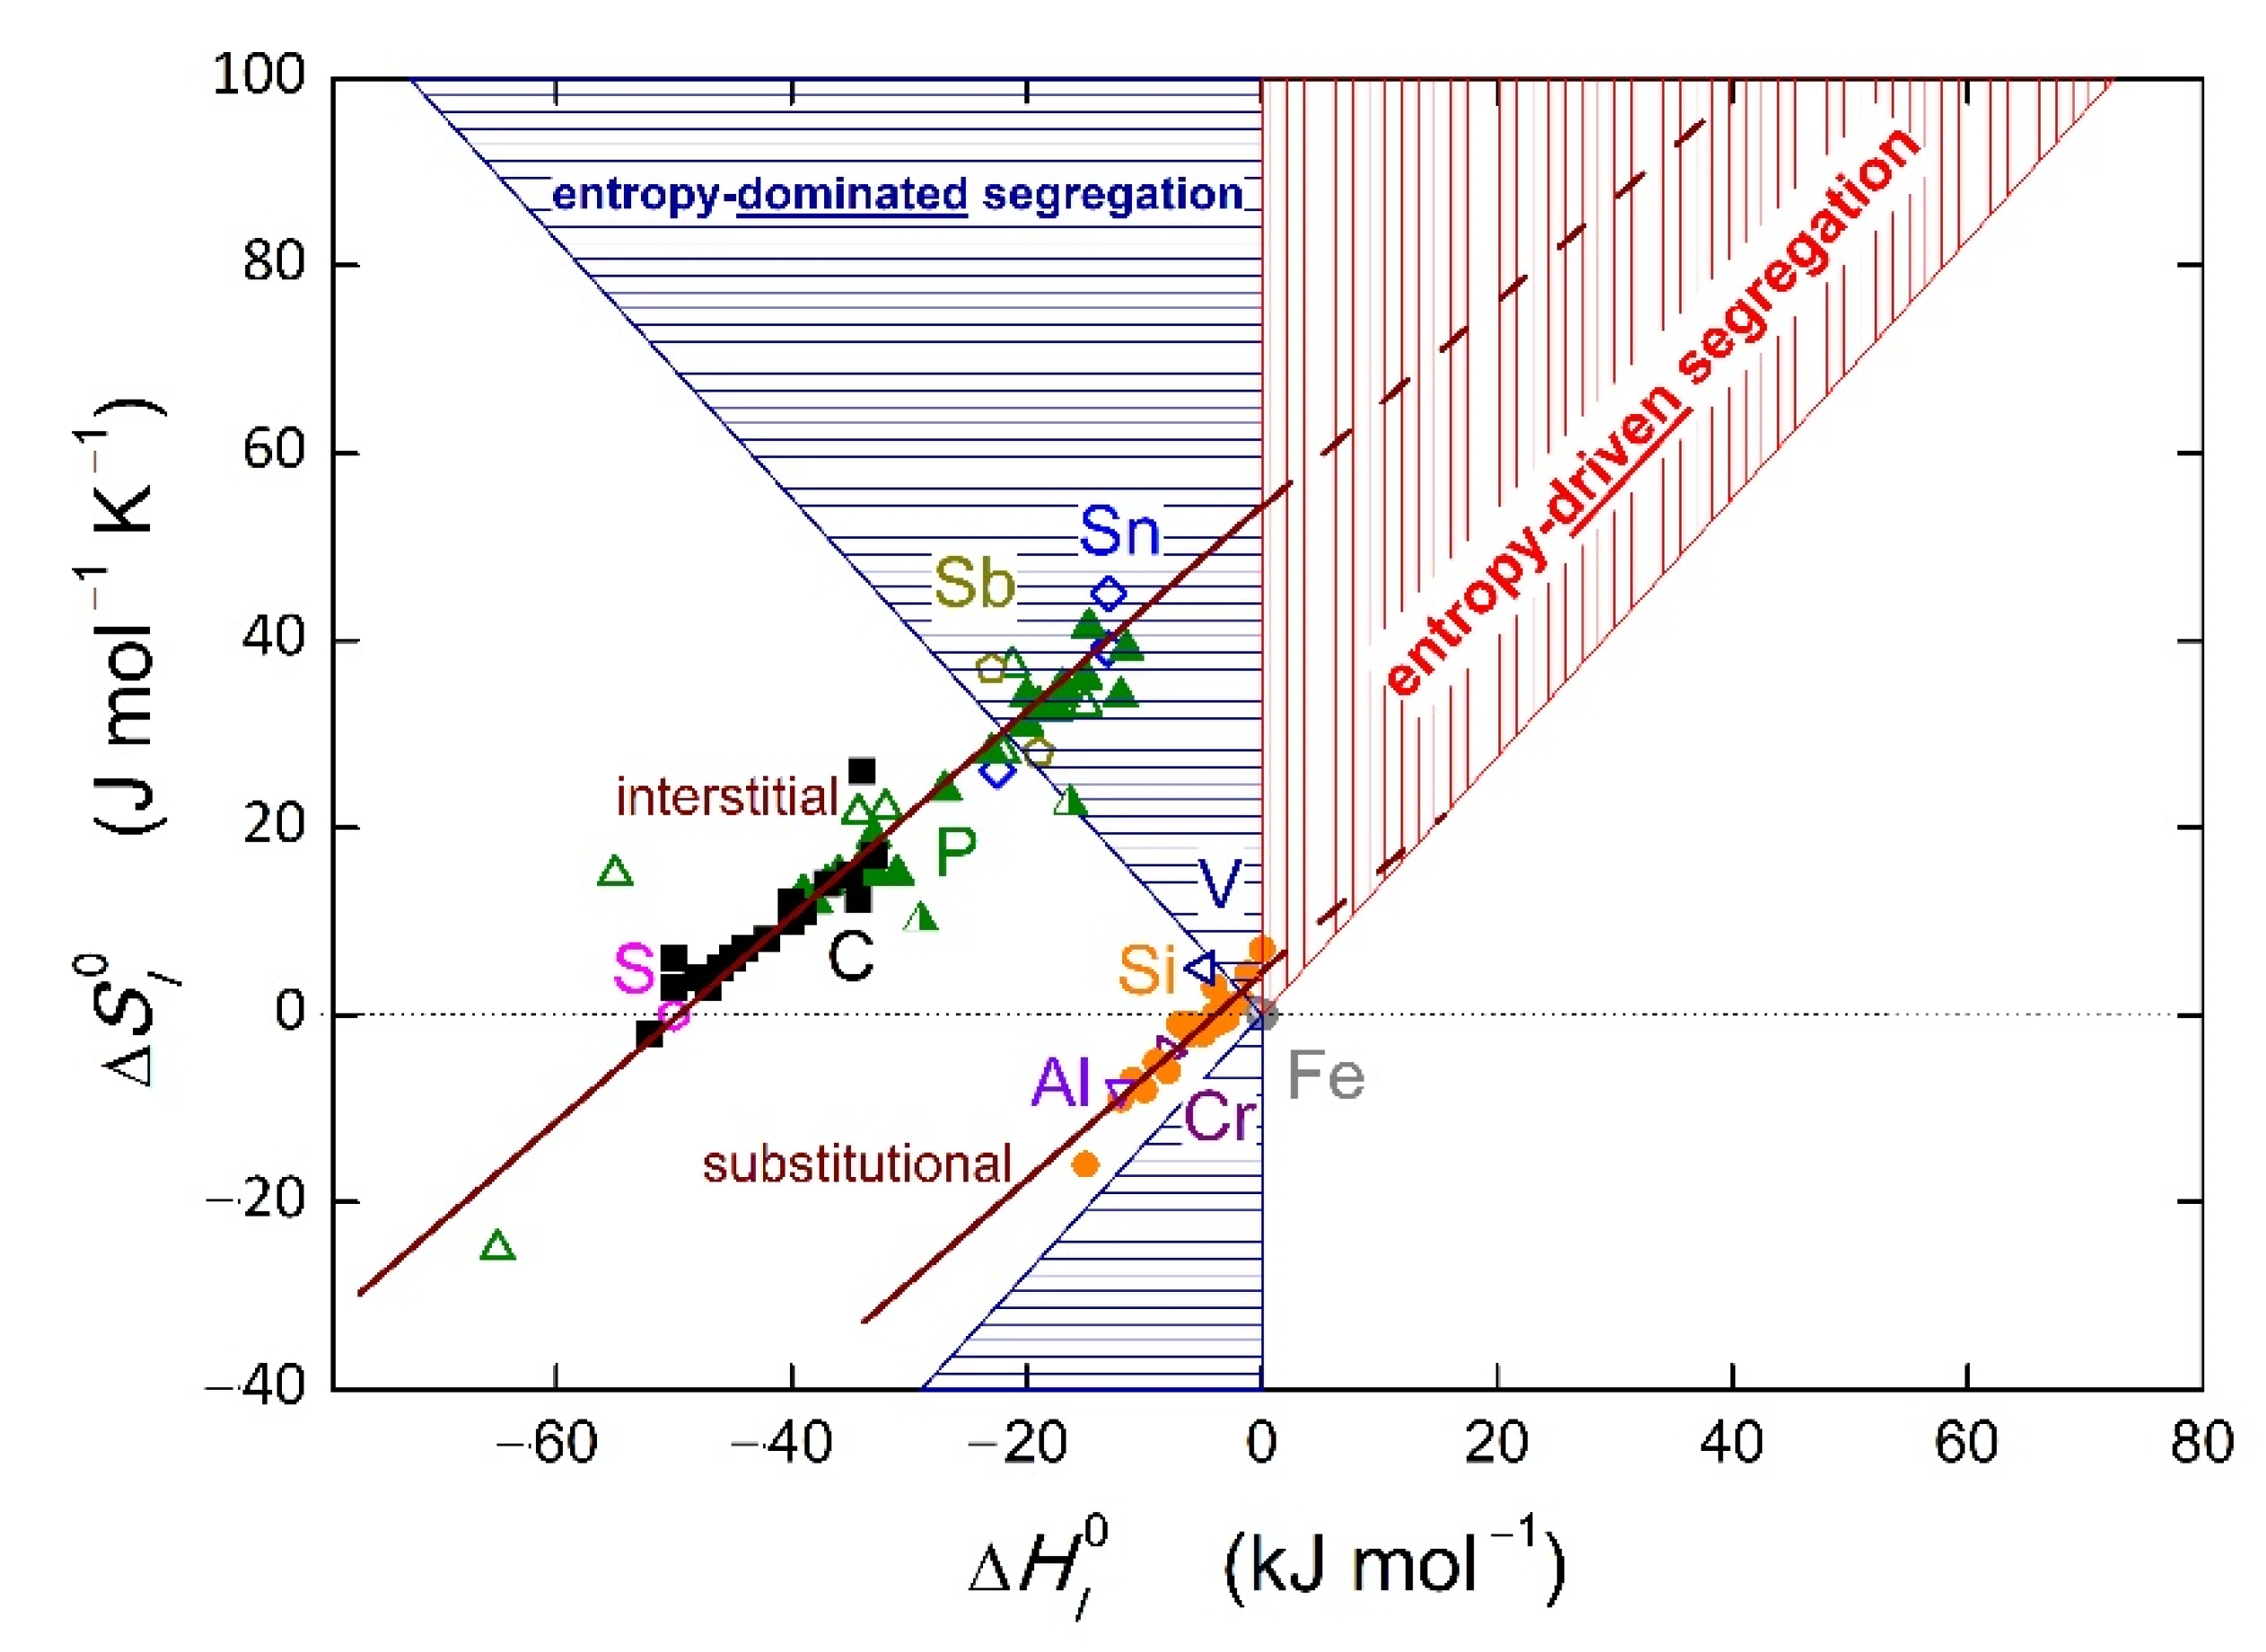
T > 723 K. This limiting temperature was chosen because all considerations were completed for iron-based systems, and 450 °C (723 K) is the lowest temperature considered for practical applications of iron and ferritic steels. In
Figure 1, the region of entropy-dominated grain boundary segregation is represented by the horizontally hatched area for
with the border lines of the slope of ±1/723 K
−1. Numerous data, mainly for the segregation of Sb, Sn, P, Si and V, fit Equation (6) under the condition
.
As apparent from
Figure 1, a very important relationship for further consideration follows from the finding that the experimental values of the standard (ideal) enthalpy,
, and standard (ideal) entropy,
, of grain boundary segregation for individual solutes fit with the linear dependence [
11]
where
TCE is the compensation temperature and
is the integration constant of entropy character, as explained in detail in [
11]. The dependence (7) is split into two branches, one for substitutional segregants, and the other for interstitially segregated solutes. In bcc iron-based systems, the values of
are
= 56 J mol
−1 K
−1 and
= 5 J mol
−1 K
−1, and
TCE = 900 K [
10]. The linear relationship (7) for the values of
and
reports on the compensation of the changes in the standard enthalpy of grain boundary segregation due to the changed grain boundary structure by respective changes in the standard segregation entropy, and this phenomenon is generally called the enthalpy–entropy compensation effect [
11].
However, condition (6) can also be fulfilled for positive values of Δ
HI and positive and negative values of Δ
SI in principle (
Figure 1). In the case of Δ
HI > 0 and Δ
SI < 0, according to Equation (1), Δ
GI > 0 at any temperature (cf. Equation (2)) and no segregation occurs. However, if the segregation entropy is positive, condition (6) can be fulfilled for the pairs of segregation enthalpy and entropy, thus resulting in Δ
GI < 0 due to the prevailing value of the entropy term. The region of principal validity of Δ
GI < 0 is shown by the horizontally hatched area in
Figure 1. Due to the “anti-segregation” tendency of the segregation energy, the segregation in this area would be exclusively controlled by the entropy term, which we refer to as entropy-driven grain boundary segregation. It is noteworthy that this statement is only based on the fact that Equation (6) is fulfilled in a specific part of the plot
vs.
. As is apparent from
Figure 1, entropy-driven grain boundary segregation should be an extreme part of a more general phenomenon—entropy-dominated grain boundary segregation.
However, despite the fact that entropy-driven grain boundary segregation is a part of the entropy-dominated segregation, there is a very important difference between these two phenomena. Entropy-dominated segregation represents the grain boundary enrichment by a segregant, which is characterized by negative segregation enthalpy and thus considered as “usual” segregation. The domination of entropy only means that its contribution to the segregation behavior prevails. In contrast, in entropy-driven segregation, the enthalpy (energy) of segregation is positive, which is presently considered as “anti-segregation”, and excludes this site from any segregation. In this case, the term exclusively responsible for the segregation effects is the entropy one. Therefore, we formulate the idea that these sites must also be considered for segregation.
While the concept of entropy-driven grain boundary segregation is clear, it is not easy to find supportive experimental or theoretical data. Experimentally, it is possible to determine the average grain boundary concentration of a solute and the values of the average grain boundary enthalpy and entropy if the temperature dependence of the grain boundary concentration is measured as mentioned above. As far as we know, no experimental data have been reported indicating entropy-driven grain boundary segregation to date. Theoretically, we can only calculate positive segregation energies for some specific boundary sites, albeit not the values of the entropy in question. Therefore, we can only provide indirect evidence using the modeling based on realistic assumptions and existing approaches.
3. Indirect Support of Entropy-Driven Grain Boundary Segregation
It is noteworthy that the concept of entropy-driven phenomena is already known and appears frequently in various branches of materials science and chemistry. We may document it by entropy-driven processes such as the Friedel–Crafts reaction [
12], electrochemiluminescence [
13], supramolecular polymerization [
14], nanocrystal stability [
15] and adsorption [
16]. In fact, entropy-driven interfacial segregation was recently reported [
17], although “segregation” was considered to have a different meaning to that in this paper. Ariadne’s thread of these entropy-driven phenomena is an endothermic character of the processes characterized by positive values of the characteristic enthalpy and entropy and prevailing entropy term.
Numerous values of the grain boundary segregation energy of different solutes at individual grain boundaries or even at individual boundary sites in various systems have been determined by various calculation techniques [
18,
19,
20,
21,
22,
23,
24]. Some of these values are positive. For example, in iron-based systems, positive values of the energy are calculated for the interstitial segregation of, e.g., carbon at the {112} grain boundary [
24], and boron [
18,
19] and nitrogen [
18] at the {111} grain boundary. Similarly, positive values of the energy were also calculated for substitutional segregation at some boundary sites of, e.g., V [
18,
20], Mo [
20] and Cr [
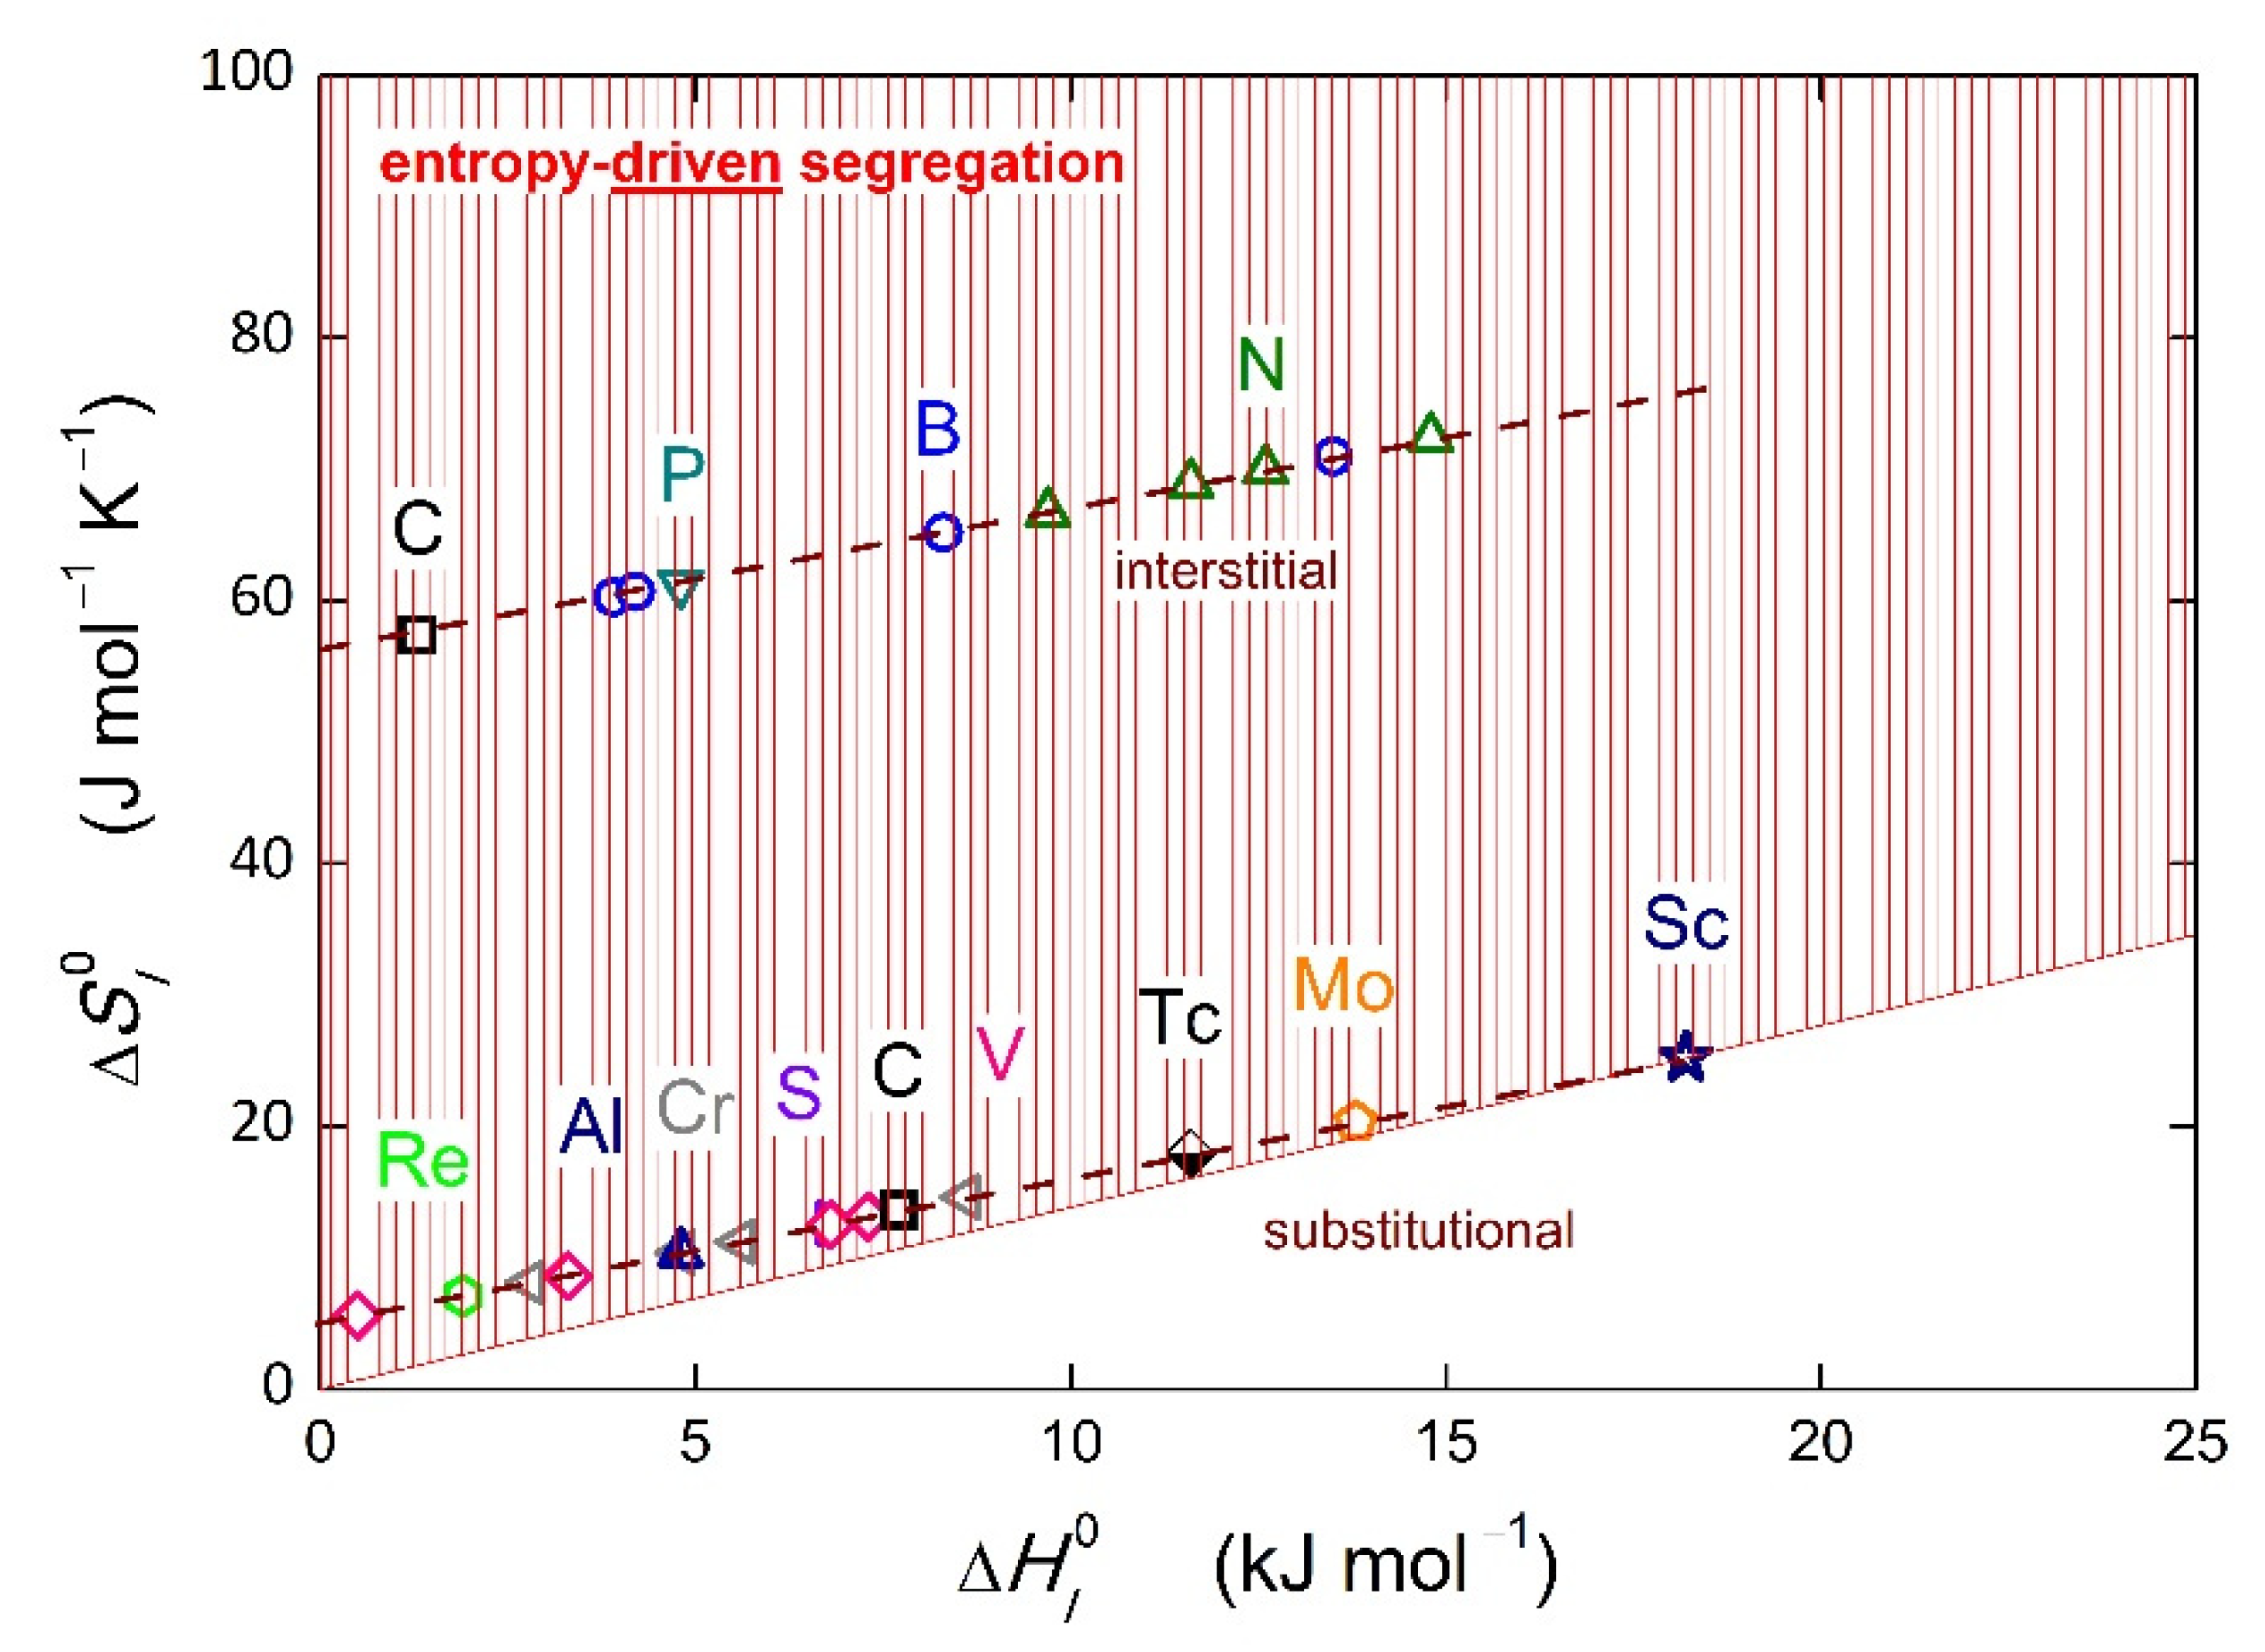
21] at the {111} grain boundary. Selected examples of the candidates for entropy-driven grain boundary segregation are listed in
Table 1 and shown in
Figure 2. It is worth mentioning that the listed values are only single values corresponding to specific boundary sites. Additionally, there are other sites exhibiting negative values of segregation energy; these data are not shown in
Figure 2 displaying a respective detail of
Figure 1. Indeed, we could discuss the accuracy of these values and of the theoretical methods used for their calculation, but this is not the aim of this paper. In general, we accept the fact that positive values of segregation energy were calculated for some sites in the case of numerous solutes in various hosts. Similarly, the experimental data can be uncertain. However, the regression (enthalpy–entropy compensation effect) significantly reduces the random deviations from the linear dependence. In any case, the data used in this paper represent a model example serving to qualitatively support the idea of entropy-driven grain boundary segregation and its discussion, albeit not quantitative conclusions.
To model grain boundary segregation, we need to complete thermodynamic characterization of the chosen system. Although the segregation energies were only determined using the DFT method or other simulation methods, a problem presently exists regarding unknown values of segregation entropy. The respective values of the segregation entropy could be thus estimated by means of the enthalpy–entropy compensation effect (Equation (7)) [
25], supposing that the relationship can be extrapolated for positive values of
. In fact, this relationship is well proven experimentally for the region of negative values of segregation enthalpy [
11,
25], and its extrapolation to the positive values of
seems to be possible in principle. Additionally, this is proven later in the case of vanadium segregation. The corresponding estimates of these entropy values are also listed in
Table 1. For completeness, the values of the binary interaction coefficients,
(Equation (5)), representing real behavior [
25] and the values of the temperature
TH=TS, at which the absolute values of the energy and entropy terms are equal, are given for individual data in
Table 1. It is noteworthy that the values of the standard enthalpy and entropy were applied to estimate
TH=TS in Equation (6) so that some deviations can be expected in real systems. However, as the values of
are positive, they reduce the value of Δ
HI and, consequently, reduce the values of
TH=TS compared to those shown in
Table 1. Thus, the interaction strengthens the grain boundary segregation tendency of a particular solute.
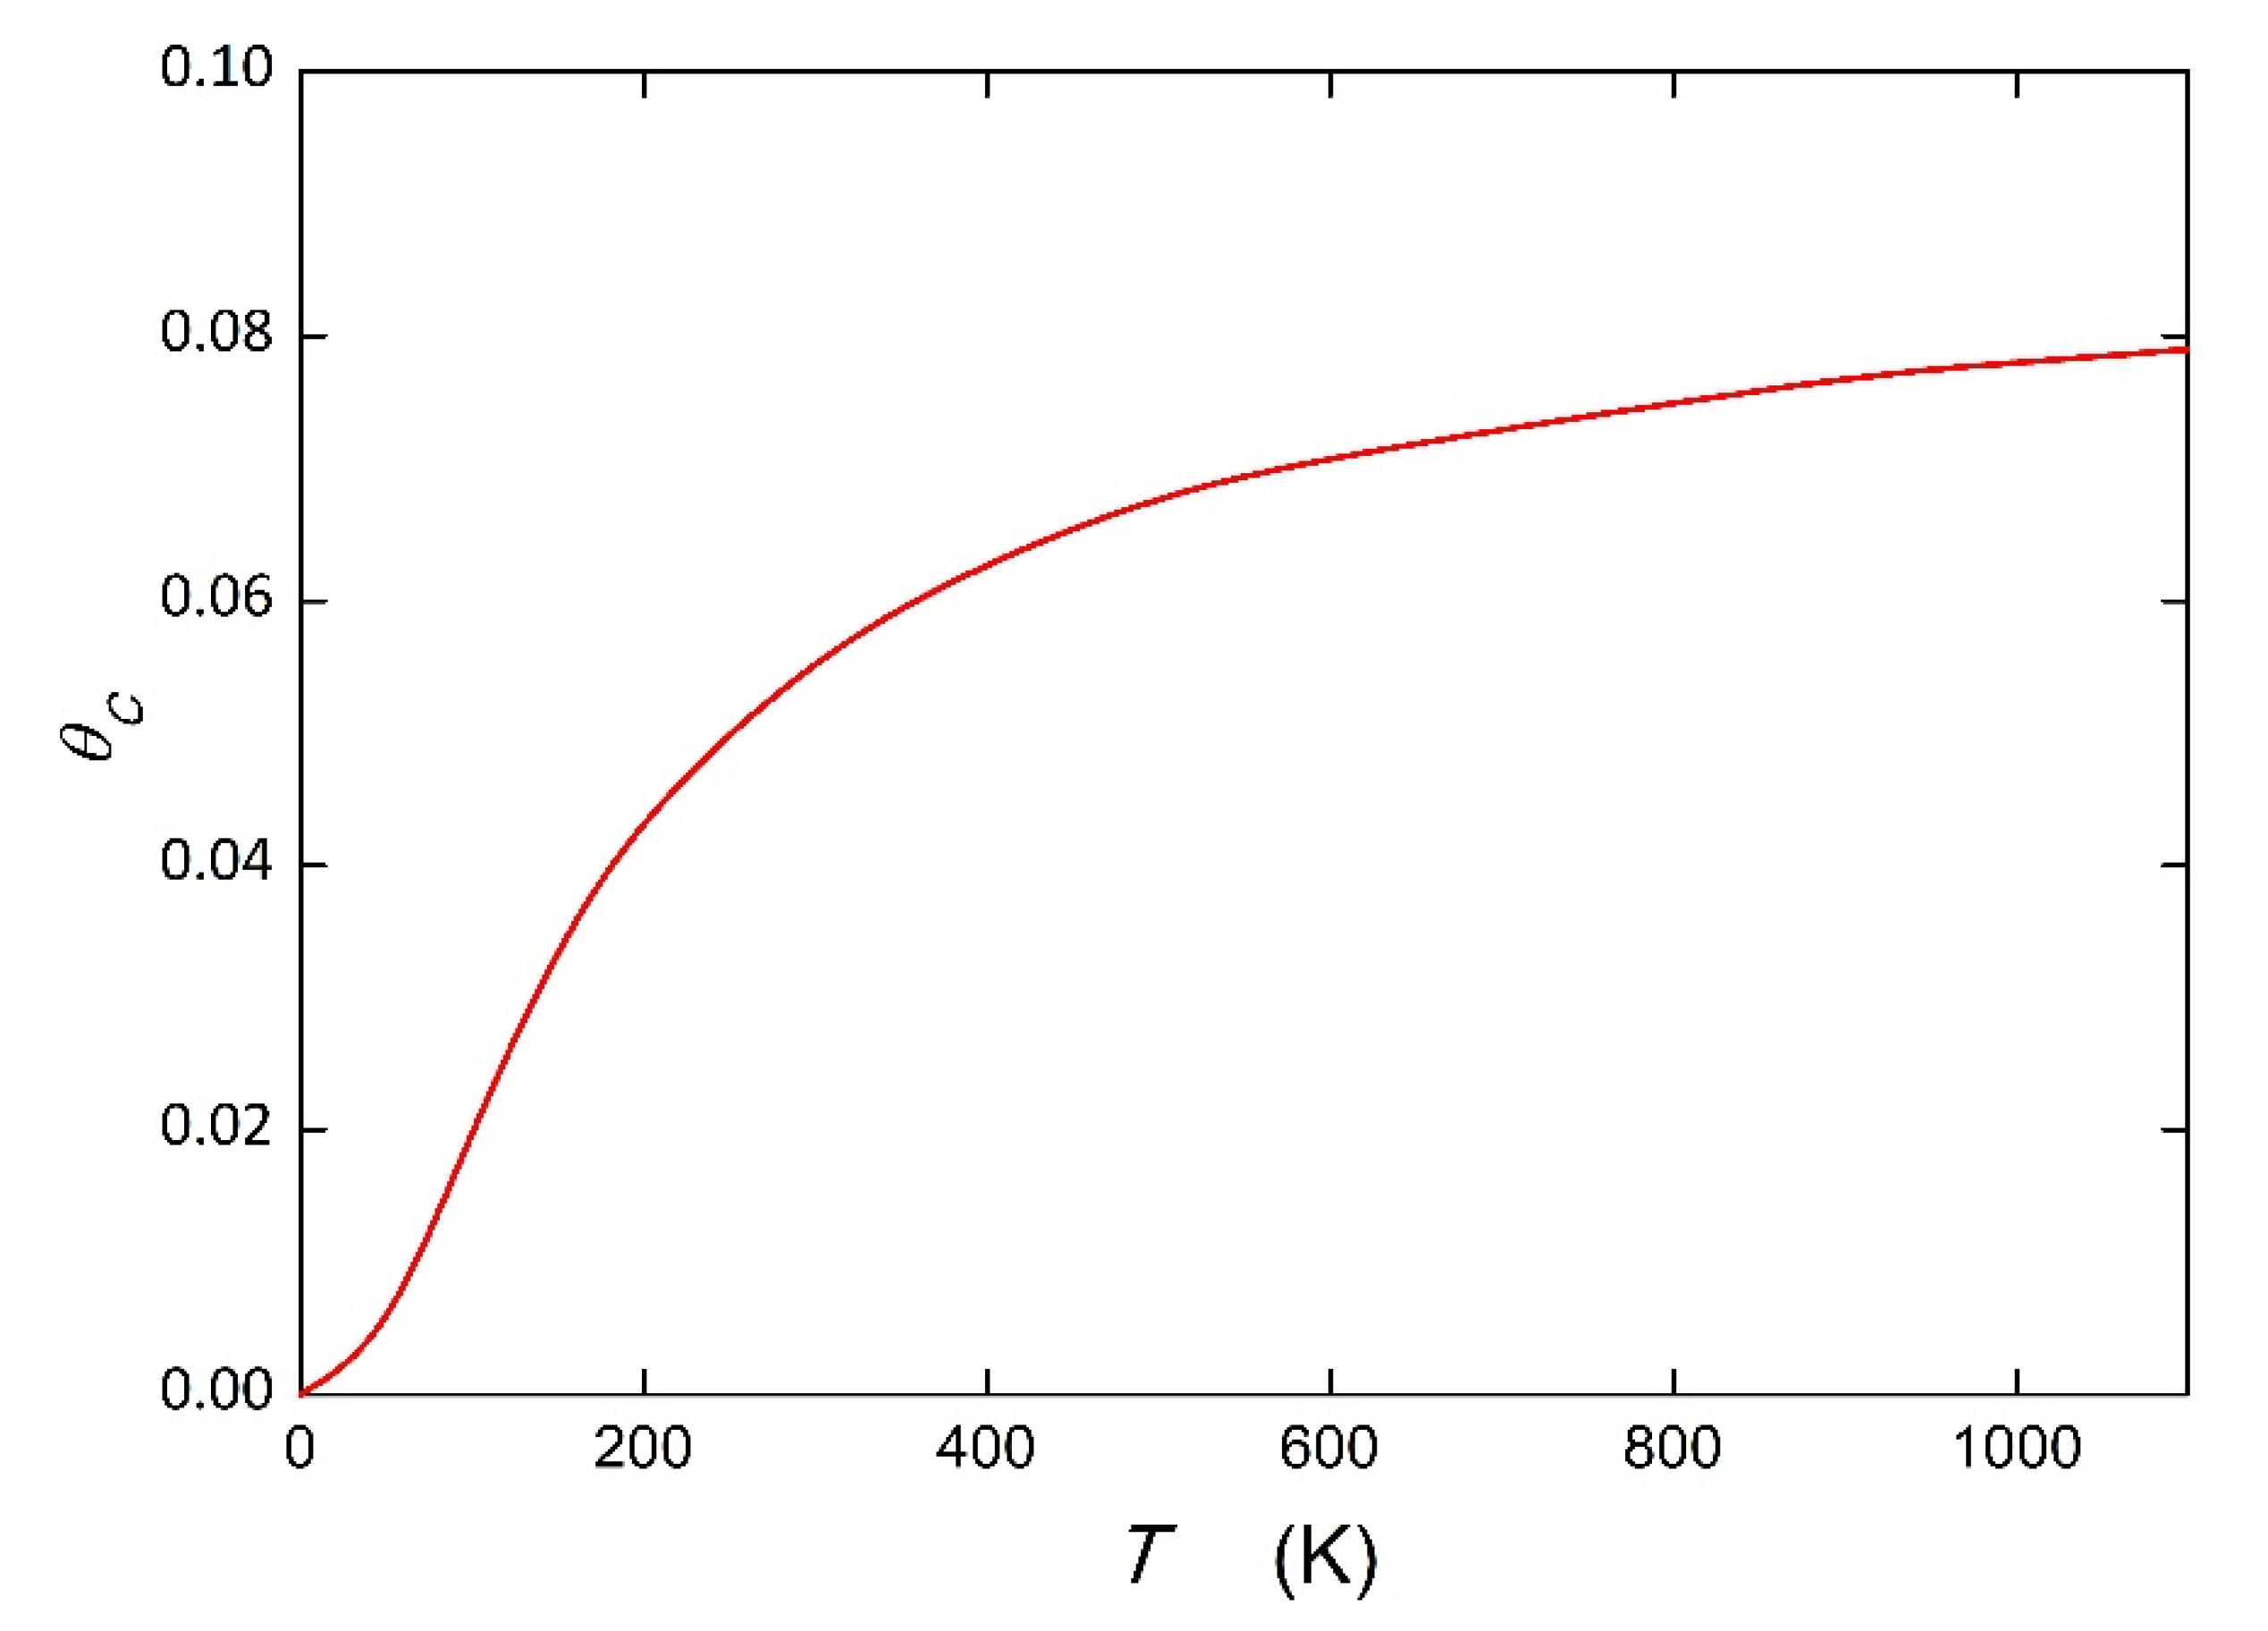
The question arises as to how the positive value of the segregation energy/enthalpy would be reflected in the temperature dependence of the grain boundary composition. The answer is documented by carbon segregation at the {112} grain boundary of bcc iron. We used the value Δ
HC = +1.3 kJ mol
−1 calculated by Hendy et al. [
24]. According to Equation (7) for interstitial segregation (
= 56 J mol
−1 K
−1,
TCE = 900 K [
10]), Δ
SC = +57.4 J mol
−1 K
−1. Using Equation (2) and these input data, we calculated the temperature dependence of C segregation at this boundary for
XC = 0.0001 using the interaction parameter
= +7.7 kJ mol
−1 (
Table 1) in Equations (2)–(5). This dependence is shown in
Figure 3. It is apparent that the course of this dependence is reversed to the usual course, which is characterized by a negative value of Δ
HC (with maximum
= 1 at 0 K). it is worth mentioning that with increasing temperature the value of
gradually approaches the maximum, i.e., the saturation value of segregation, given by
. To assess the maximum extent of segregation, the grain boundary enrichment ratio was obtained as
= 996. This suggests that grain boundary segregation can occur principally at high temperatures, even if the calculated segregation energy at 0 K is positive.
As shown in
Table 1, positive values of the segregation energy were calculated for specific boundary sites. However, the vast majority of sites exhibit negative values, as summarized, e.g., in [
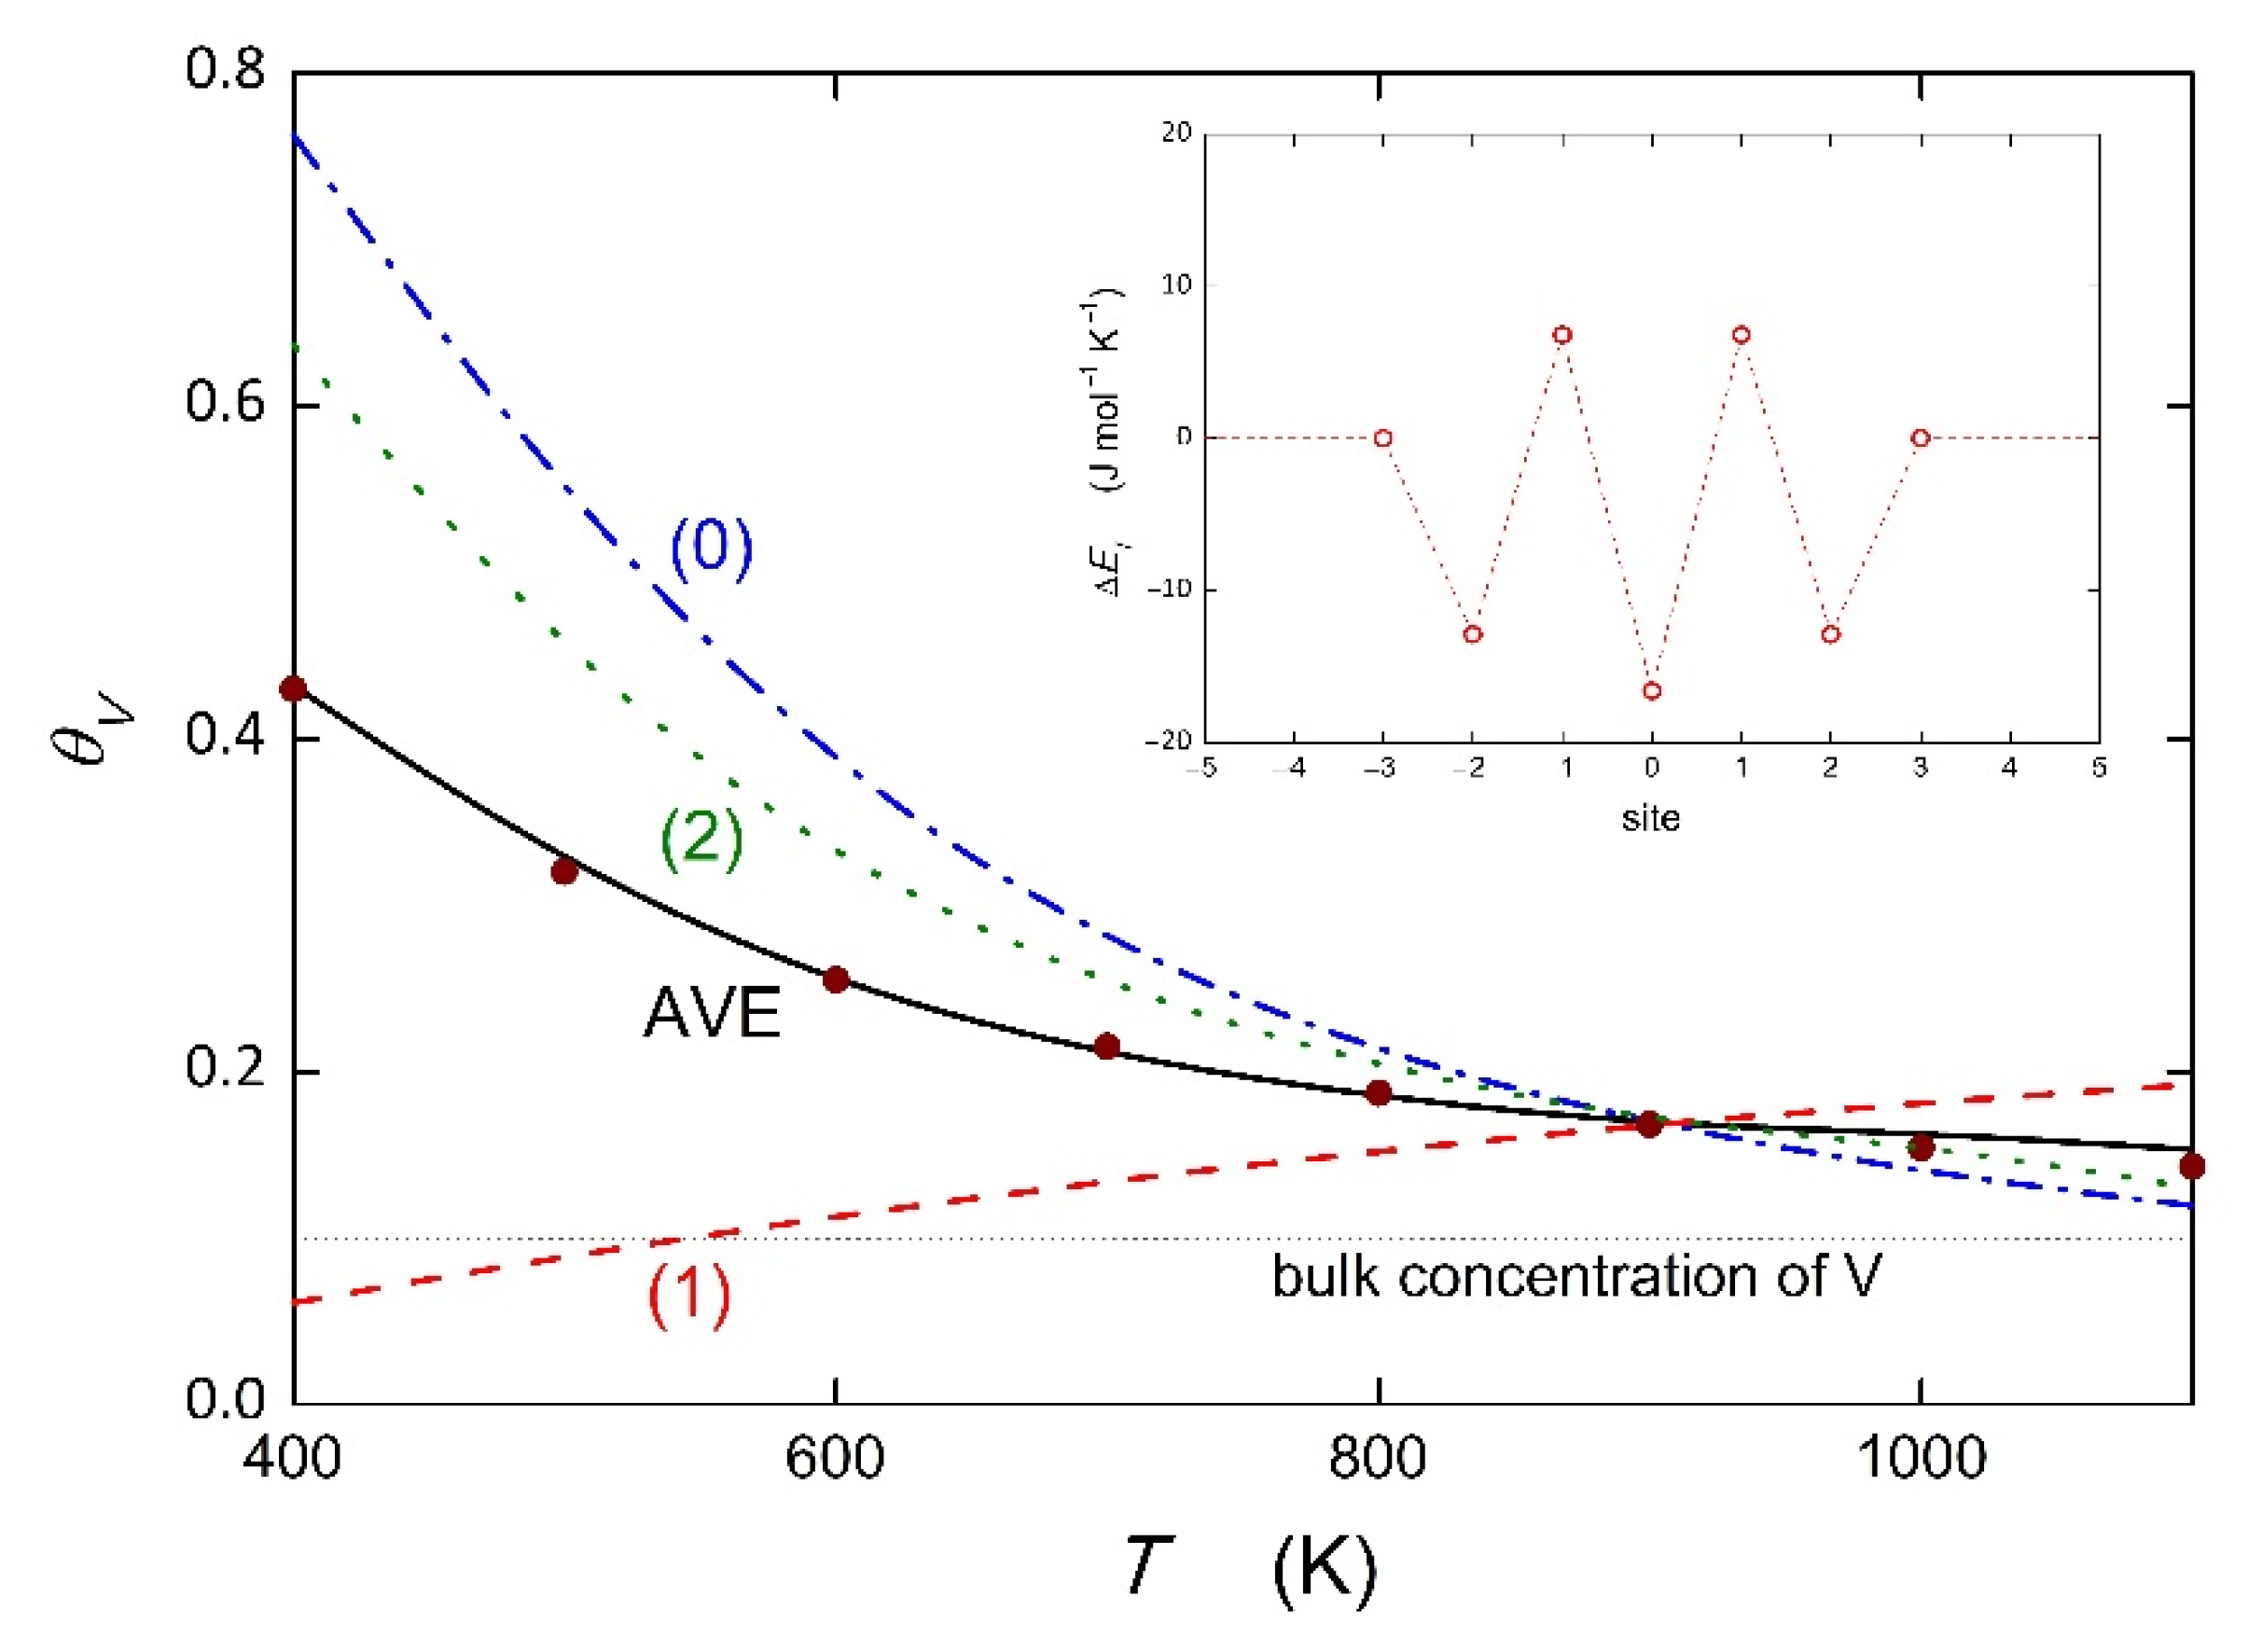
4]. The question arises as to how the solute segregation at individual sites contributes to the total grain boundary concentration. This may be explained by the example of the Fe–V binary alloy (
XV = 0.1). We used the data calculated by Kholtobina et al. for the {111} grain boundary [
18]. The values of Δ
HV are different for different sites of the {111} grain boundary shown in [
18] (see also inset in
Figure 4), i.e., +6.8 kJ mol
−1 (sites +1 and −1 as marked in [
18]) listed in
Table 1 but also −16.4 kJ mol
−1 (site 0) and −12.5 kJ mol
−1 (sites +2 and −2). For these energies, the values of the segregation entropy were determined for substitutional segregation according to Equation (7) as +12.5 J mol
−1 K
−1 (sites +1 and −1), −13.2 J mol
−1 K
−1 (site 0) and −8.9 J mol
−1 K
−1 (sites +2 and −2). The temperature dependence of the V concentration at individual sites is shown in
Figure 4.
It is apparent from
Figure 4 that different pairs of Δ
HV and Δ
SV are responsible for different temperature dependences of solute segregation at individual sites. It is worth noting that the site characterized by positive segregation energy also exhibits segregation at temperatures above 600 K (note that the temperature of practical applications is 723 K), and it even dominates the segregation behavior at temperatures above 900 K. This reversion is a further consequence of the enthalpy–entropy compensation effect [
6]. We can also calculate the average concentration of V at this grain boundary,
, according to a proposal of White and Coghlan [
28] and of Nowicki et al. [
29],
where
η is the number of sites,
i is the individual participating site, and
fi is the weight of the site
i,
. At the {111} grain boundary, 5 sites, −2, −1, 0, +1 and +2, contribute to the segregation [
18]. If we accept the equal probability of participation of all sites
i,
fi = 0.2, the average temperature dependence of the grain boundary concentration of V can be determined, which is marked as AVE in
Figure 4. It can be described by the values Δ
HV = −7.3 kJ mol
−1 and Δ
SV = −2.9 J mol
−1 K
−1. Although there are no suitable experimental data for comparison, we can model the temperature dependence using our recent prediction [
25]. An excellent quantitative agreement was obtained for the prediction using the values corresponding to vanadium segregation at a general grain boundary [
25],
= −7.9 kJ mol
−1,
= −3.8 J mol
−1 K
−1, and
= +0.9 kJ mol
−1 determined according to Equation (7). This dependence is represented in
Figure 4 by solid circles. It is noteworthy that this excellent agreement was obtained using (i) all values of Δ
HV, i.e., including its positive values, and (ii) the values of Δ
SV estimated from the extrapolated compensation effect. This finding has two important consequences. First, the “anti-segregation” sites contribute equally to the average grain boundary concentration, thus supporting the existence of entropy-driven grain boundary segregation. Indeed, at low temperatures, the “anti-segregation” character of sites ±1 prevails, resulting in a reduced concentration of the segregant at the site compared to the bulk (line 1 in
Figure 4). However, at higher temperatures, when the entropy term prevails over the positive segregation energy, thus resulting in negative value of the Gibbs energy of segregation, solute segregation occurs. This is exclusively caused by the reverse of segregation tendency due to the change in the sign of the Gibbs energy of segregation. Second, it also justifies the extrapolation of the compensation effect in as performed in this study.
The concept of entropy-driven grain boundary segregation would provide a new aspect for quantitative grain boundary segregation. In fact, there are sites at the grain boundaries which exhibit—in various systems—positive values of segregation energy/enthalpy. If , the Gibbs energy of segregation is negative, and thus, this site does no longer exhibit “anti-segregation” but even contributes substantially to the total grain boundary concentration. Consequently, the phenomenon of entropy-driven grain boundary segregation should be additionally considered for quantification in all related phenomena, such as temper embrittlement and grain boundary segregation-induced stabilization of nanocrystalline structures. To unambiguously prove the existence of entropy-driven grain boundary segregation, direct experimental and/or theoretical evidence is highly required. Unfortunately, measurements of grain boundary composition did not detect this phenomenon until now, although there are some systems that are supposed to exhibit it. Moreover, methods of calculating segregation entropies are still scarce. Thus, the proposal of entropy-driven grain boundary segregation should evoke an effort for searching for methods to theoretically calculate segregation entropy.


