Article

The Effect of Immersion Corrosion Time on Electrochemical Corrosion Behavior and the Corrosion Mechanism of EH47 Ship Steel in Seawater

1
School of Material and Metallurgy, University of Science and Technology Liaoning, Anshan 114051, China
2
State Key Laboratory of Metal Material for Marine Equipment and Application, Anshan 114009, China
3
School of Mechanical, Materials, Mechatronic and Biomedical Engineering, University of Wollongong, Wollongong, NSW 2522, Australia
*
Authors to whom correspondence should be addressed.
Metals 2021, 11(8), 1317; https://doi.org/10.3390/met11081317
Submission received: 29 June 2021 / Revised: 13 August 2021 / Accepted: 16 August 2021 / Published: 20 August 2021
(This article belongs to the Special Issue Advances in Corrosion and Protection of Materials)

Abstract

:
In this paper, electrochemical corrosion tests and full immersion corrosion experiments were conducted in seawater at room temperature to investigate the electrochemical corrosion behavior and the corrosion mechanism of high-strength EH47. The polarization curve, EIS (electrochemical impedance spectroscopy), SEM (scanning electron microscope), and EDS analyses were employed to analyze the results of the electrochemical corrosion process. The electrochemical corrosion experiments showed that the open circuit potential of EH47 decreases and then increases with an increase in total immersion time, with the minimum value obtained at 28 days. With an increase in immersion time, the corrosion current density (Icorr) of EH47 steel first decreases and then increases, with the minimum at about 28 days. This 28-day sample also showed the maximum capacitance arc radius, the maximum impedance and the minimum corrosion rate. In the seawater immersion test in the laboratory, the corrosion mechanism of EH47 steel in the initial stage of corrosion is mainly pitting corrosion, accompanied by a small amount of crevice corrosion with increased corrosion time. The corrosion products of EH47 steel after immersion in seawater for 30 days are mainly composed of FeOOH, Fe3O4 and Fe2O3.

1. Introduction

For marine ships, the hull steel must withstand the impact of waves, the action of huge bending moments formed by surging waves, temperature changes in cold winters and hot summers, and the corrosion of seawater. Therefore, in addition to sufficient mechanical properties and good technological properties, hull steel should also have good corrosion resistance. Corrosion will reduce the strength of the ship structure and shorten the service life. It will also endanger the safety of navigation and reduce its operational performance. Therefore, corrosion prevention of the hull structure has always been an important issue in the design, construction and use of ships [1,2].
In the marine environment, the corrosion of marine equipment and marine engineering steel is electrochemical corrosion. Electrochemical corrosion refers to the corrosion of metals in the electrolyte due to the action of microcells on its surface [3,4]. The main reason for corrosion is the presence of dissolved oxygen. In the marine environment, the surface of steel and iron will form anode and cathode regions due to inhomogeneity. In the positive and negative regions, the formation of local batteries will cause a certain degree of corrosion [5,6]. A series of reports have shown that the surface of carbon steel does not form a stable passivating corrosion film, but a porous rust layer, which makes it difficult to prevent further corrosion under marine conditions [7,8]. The passivation film of low-alloy steels has low stability and is easily broken and corroded in seawater. Chen et al. [9] showed that the passivating film could be formed on the surface of carbon steel. When immersed in 3% NaCl solution or seawater, the weak parts of the passivating film would crack quickly and induce corrosion. The corrosion of carbon steel and low-alloy steel is uneven in a seawater environment, and local pits are formed. Furthermore, a relatively closed microenvironment and occlusive corrosion cell can be formed under the rust layer, resulting in serious local corrosion. The strength of the occlusive corrosion cell directly affects the expansion of the pit and the local corrosion resistance of carbon steel and low-alloy steel. The pH of seawater is about 8.0 to 8.2, and seawater contains a large amount of chloride ions. With a decrease in Cl content in the solution, the thickness of the passivation film decreases and its protection ability increases due to the failure of the passivation layer on the steel surface at the threshold of Cl concentration [10,11]. In addition, with an increase in Cl concentration, a porous and non-protective product is formed on the steel surface. Zhang studied the corrosion behavior of 304 stainless steel under different Cl concentrations and soaking times. The results showed that with the increase in Cl concentration, the stability of 304 stainless steel decreases with the passivation film [12]. The effect of Cl on the passivation film and pitting corrosion is particularly serious with long-term use. Yang [13] used the potentiometric polarization method to measure pitting potential in the corrosion process. The results showed that with the increase in temperature and Cl concentration, the size and number of corrosion pits increase.
Xia studied the erosion and corrosion of hull steel under different flow rates in the seawater environment of the East China Sea [14]. Jia et al. [15] analyzed the corrosion resistance of F690, F460 and Q235B steel in 3.5% NaCl solution. Melchers [16] proposed various models to explain the corrosion mechanism. Zayed et al. [17] and Panayotova et al. [18] investigated the main corrosion mechanisms of ship steels.
Pitting corrosion is a common form of corrosion of carbon steel and low-alloy steel in the marine environment [19,20]. It is uneven and comprehensive, and so is often called pitting corrosion, which is different from the typical blunt metal pitting corrosion. Pitting corrosion forms because of electrochemical inhomogeneity on the steel surface, which leads to the formation of local corrosion microcells. Typical forms of corrosion of carbon and low-alloy ship steels in the marine environment include uniform corrosion, pitting corrosion, oxygen concentration difference corrosion, etc. [21,22].
Electrochemical technologies and hanging plate tests, such as the corrosion potential measurement, the polarization test, linear polarization technology, electrochemical impedance spectroscopy, and the simulated block cell test, have been widely used in the study of the corrosion behavior of ship steels and the development of products [23,24,25,26]. The main advantage of the electrochemical test method is that it is fast and can obtain instantaneous corrosion information, but the main disadvantage is the lack of accuracy. In contrast to the electrochemical test, the results of the hanging test and field test are accurate, but the required time is longer and the process is more complicated [27].
In this study, due to the disadvantages of the long test period and significant influence of environmental factors, the seawater hanging sheet test was carried out in the laboratory, and the seawater was changed every seven days during the experiment, which overcomes the shortcoming that the medium changes due to the limitation of the amount of medium and the corrosion and dissolution of metal as the test progresses. In this paper, the electrochemical corrosion behavior of ship plate steel EH47 was studied by electrochemical techniques such as corrosion potential measurement, polarization curve and electrochemical impedance spectroscopy. At the same time, the corrosion mechanism of low-alloy and high-strength ship plate steel in seawater was investigated by actual seawater hanging plate test.

2. Experimental

2.1. Materials

The chemical compositions of the samples were measured by a direct reading spectrometer (ARL-3460L, Thermoelectric Corporation of America, Chicago, IL, USA): C: 0.07, Si: 0.20, Mn: 1.42, Mo: 0.22, Ni: 0.79, Cr: 0.07, Ti: 0.013, Nb: 0.04, V: 0.006, Al: 0.03, P: 0.006, S: 0.001, Fe balanced.

2.2. Electrochemical Test

In order to ensure the accuracy of the experiments, the electrochemical experiments were conducted in triplicate, meanwhile, the specimens were 4 × 3 = 12, every set needed 4 specimens, and there were 12 specimens in total.
The experimental samples were polished with W28, W20, W14 and W10 sandpaper, then polished with a metallographic polishing machine, and finally wiped with ethanol and acetone cotton balls. After welding the copper wire on the non-working surface, the non-working surface was sealed with epoxy resin, and a 10 mm × 10 mm electrode working surface was reserved.
Electrochemical experiments were carried out on a weekly basis after 7, 14, 28 and 49 days of total immersion corrosion in seawater.
All electrochemical tests were performed using a CHI760E electrochemical workstation produced by Shanghai ChenHua instrument Co., LTD (Shanghai, China). The sample was used as the working electrode, the saturated calomel electrode (SCE) was used as the reference electrode, and the platinum wire around the working electrode was used as the auxiliary electrode.
EIS (electrochemical impedance spectroscopy) measurements were performed at the open circuit potential. The open circuit potential was monitored for 60 s before electrochemical measurement. The frequency range was 100 kHz to 100 mHz and the voltage amplitude was 10 mV. Potentiodynamic polarization curves were obtained in the scanning range of −600 mV to 1400 mV with respect to the Open Circuit Potential (OCP) at a scanning rate of 0.5 mV/s.
The corrosion morphology was detected by scanning electron microscope (SEM, EV018, Carl Zeiss AG, (Oberkochen, Germany).
X-ray diffraction (XRD X’Pert Powder, Malvern Panalytical, Malvern, UK) was used to determine the surface phase compositions of the samples. The working voltage was 40 kV, the working current was 40 mA, the radiation target was Cu Ka, and the scanning speed was 6/min. The scanning ranged from 10° to 90° (2θ). The numbers of the JCPDS (Joint Committee on Powder Diffraction Standards) cards are used in this paper as references to identify the crystalline phases in the XRD patterns. The JCPDS of Fe3O4 is 98.015-8506, Fe2O3 is 98-010-890, and FeOOH of JCPDS is 96-100-8763.

2.3. Immersion Test

In order to ensure the accuracy of the experiments, the immersion experiments were conducted in duplicate, meanwhile, the specimens were 4 × 2 = 8, every set needed 4 specimens, and there were 8 specimens in total.
Considering the short electrochemical experiment period, the total immersion corrosion experiment lengthens the experiment period. The immersion test experiments were carried out in natural seawater for different total immersion times in the laboratory. The samples were immersed in natural seawater for 20, 40, and 80 days at room temperature.

3. Results

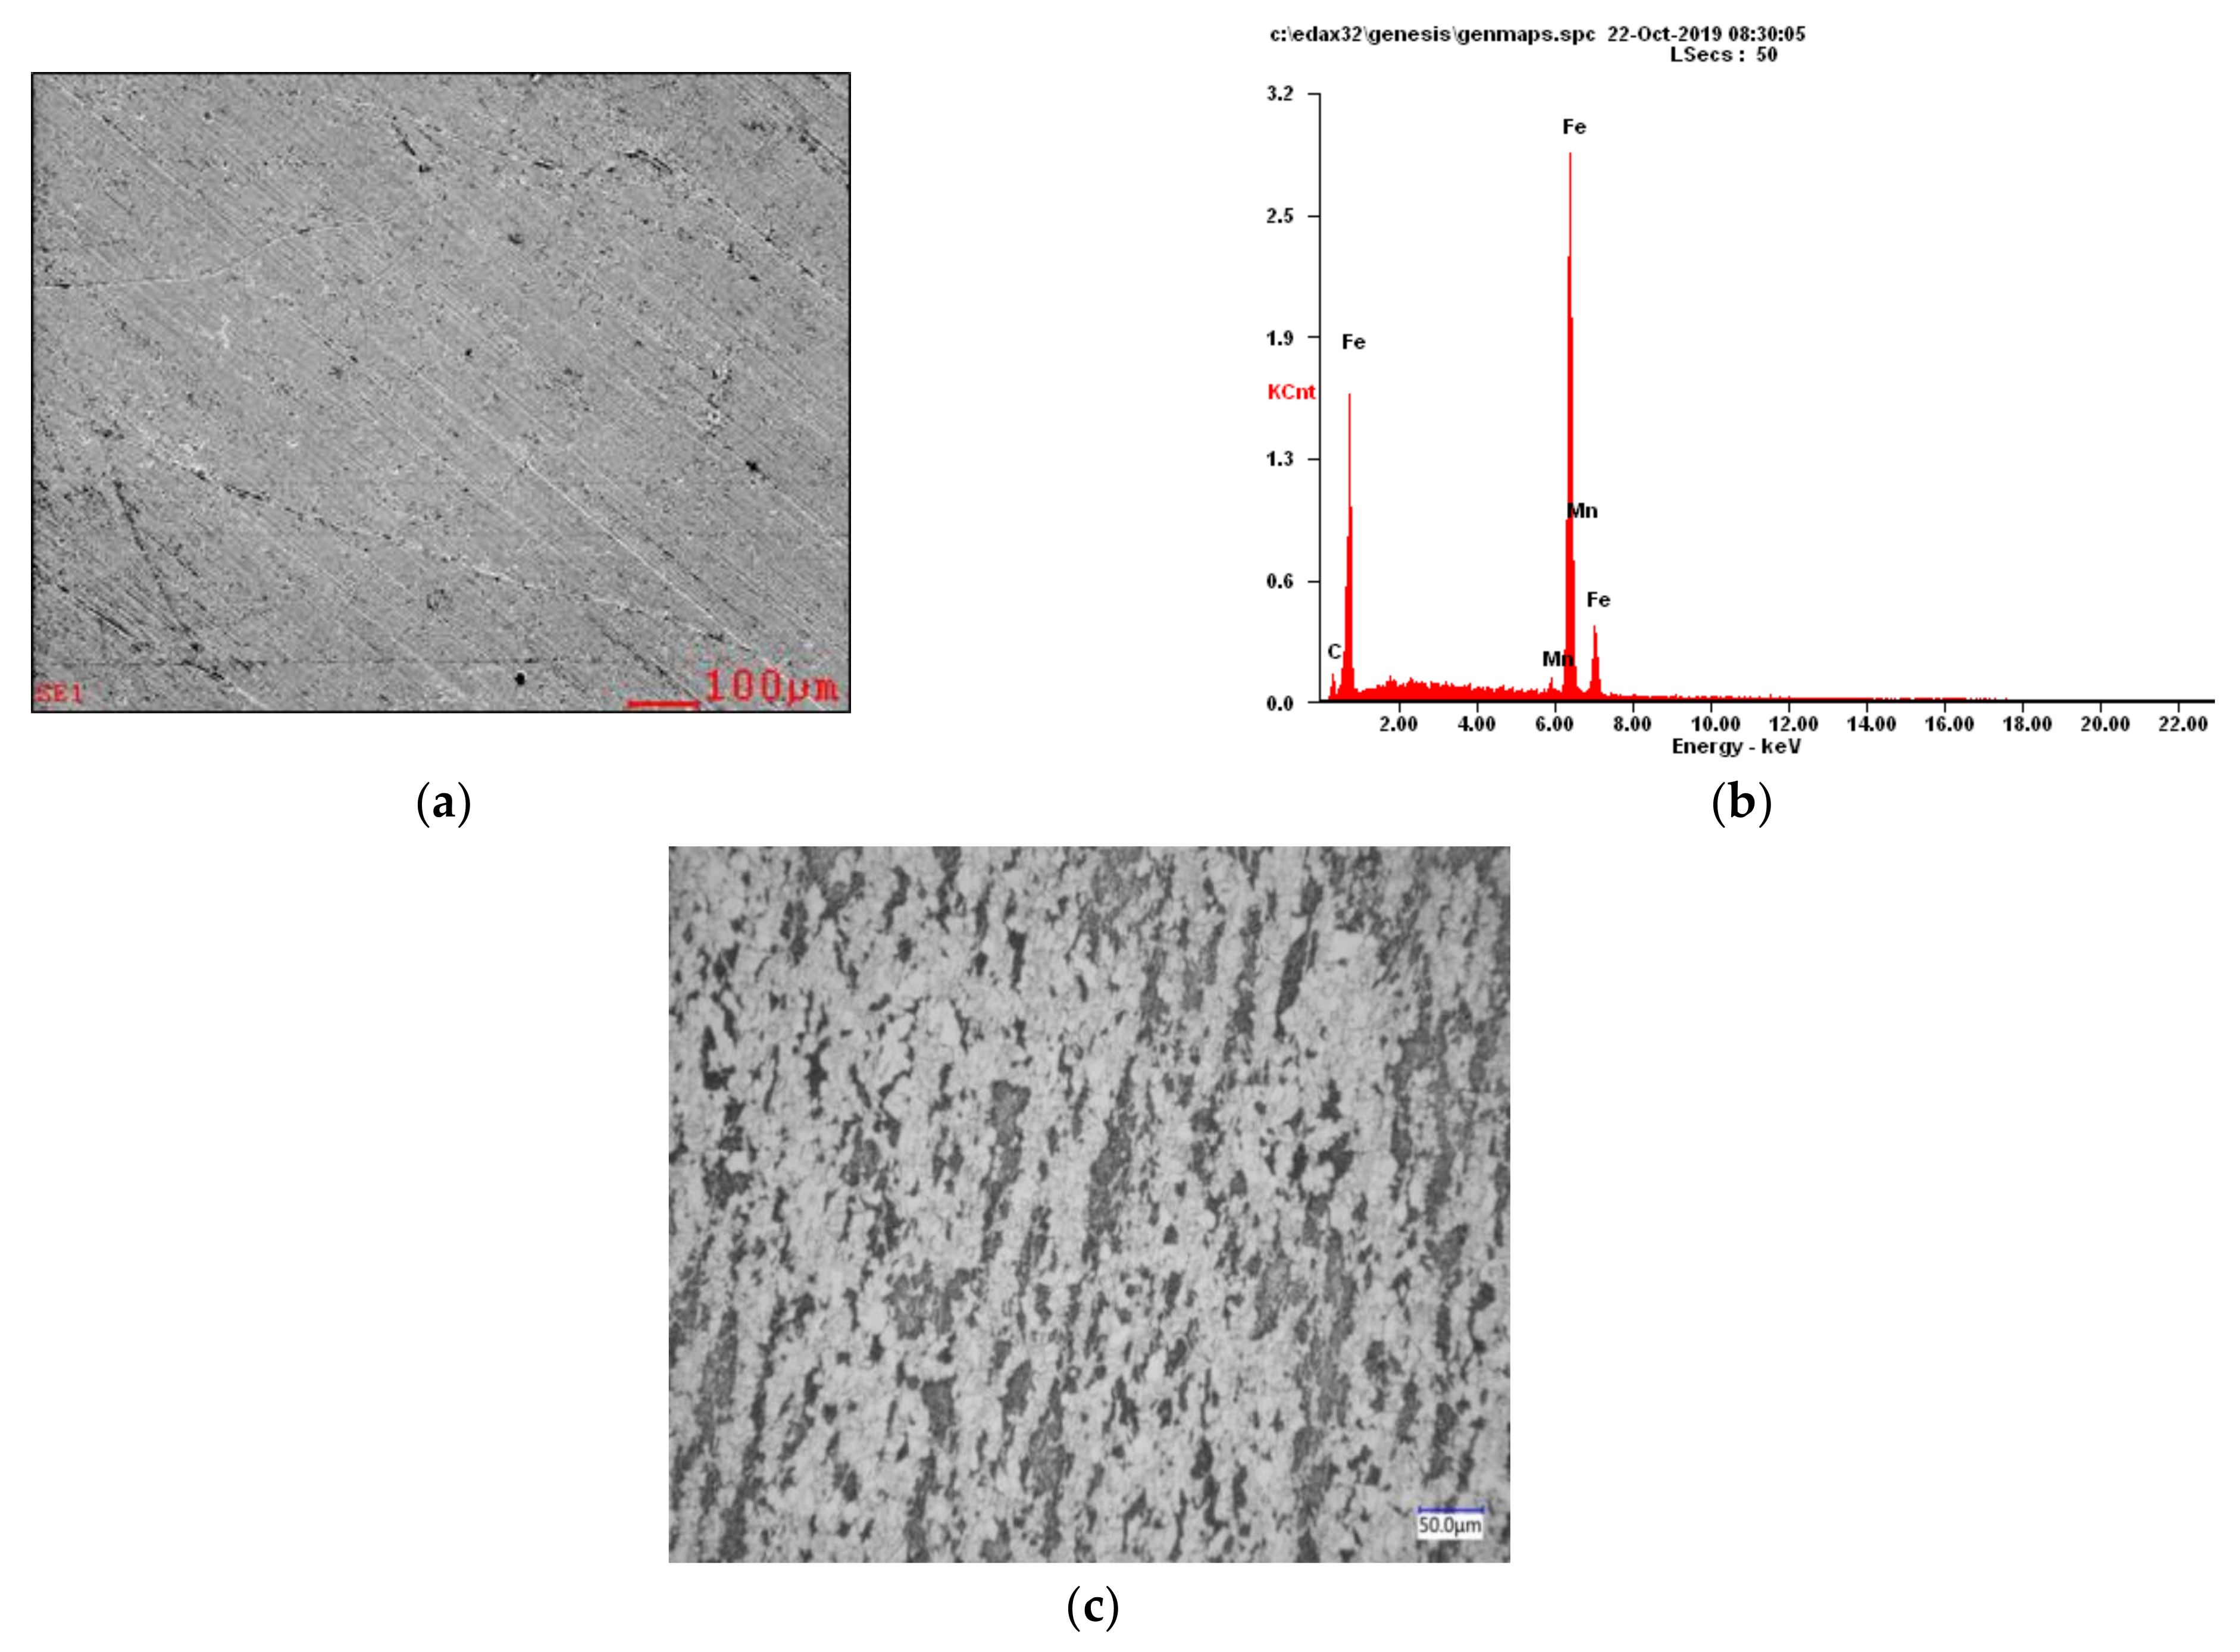
3.1. Energy Spectrum Analysis of Steel

Figure 1 is the surface EDS analysis and optical micrograph of the original EH47. It can be seen from Figure 1b that the surface of the original steel EH47 is composed of three main elements: Fe, Mn and C, indicating that Fe, Mn and C are the primary elements. The optical micrograph of the original EH47 is presented in Figure 1c. The microstructure is mainly composed of ferrite and bainite.

3.2. Electrochemical Characteristics of EH47 in Seawater

EH47 samples were immersed in seawater for 0, 14, 28 and 49 days for electrochemical experiments. The open circuit potential, polarization curve and Nyquist diagram of electrochemical impedance spectroscopy were measured.

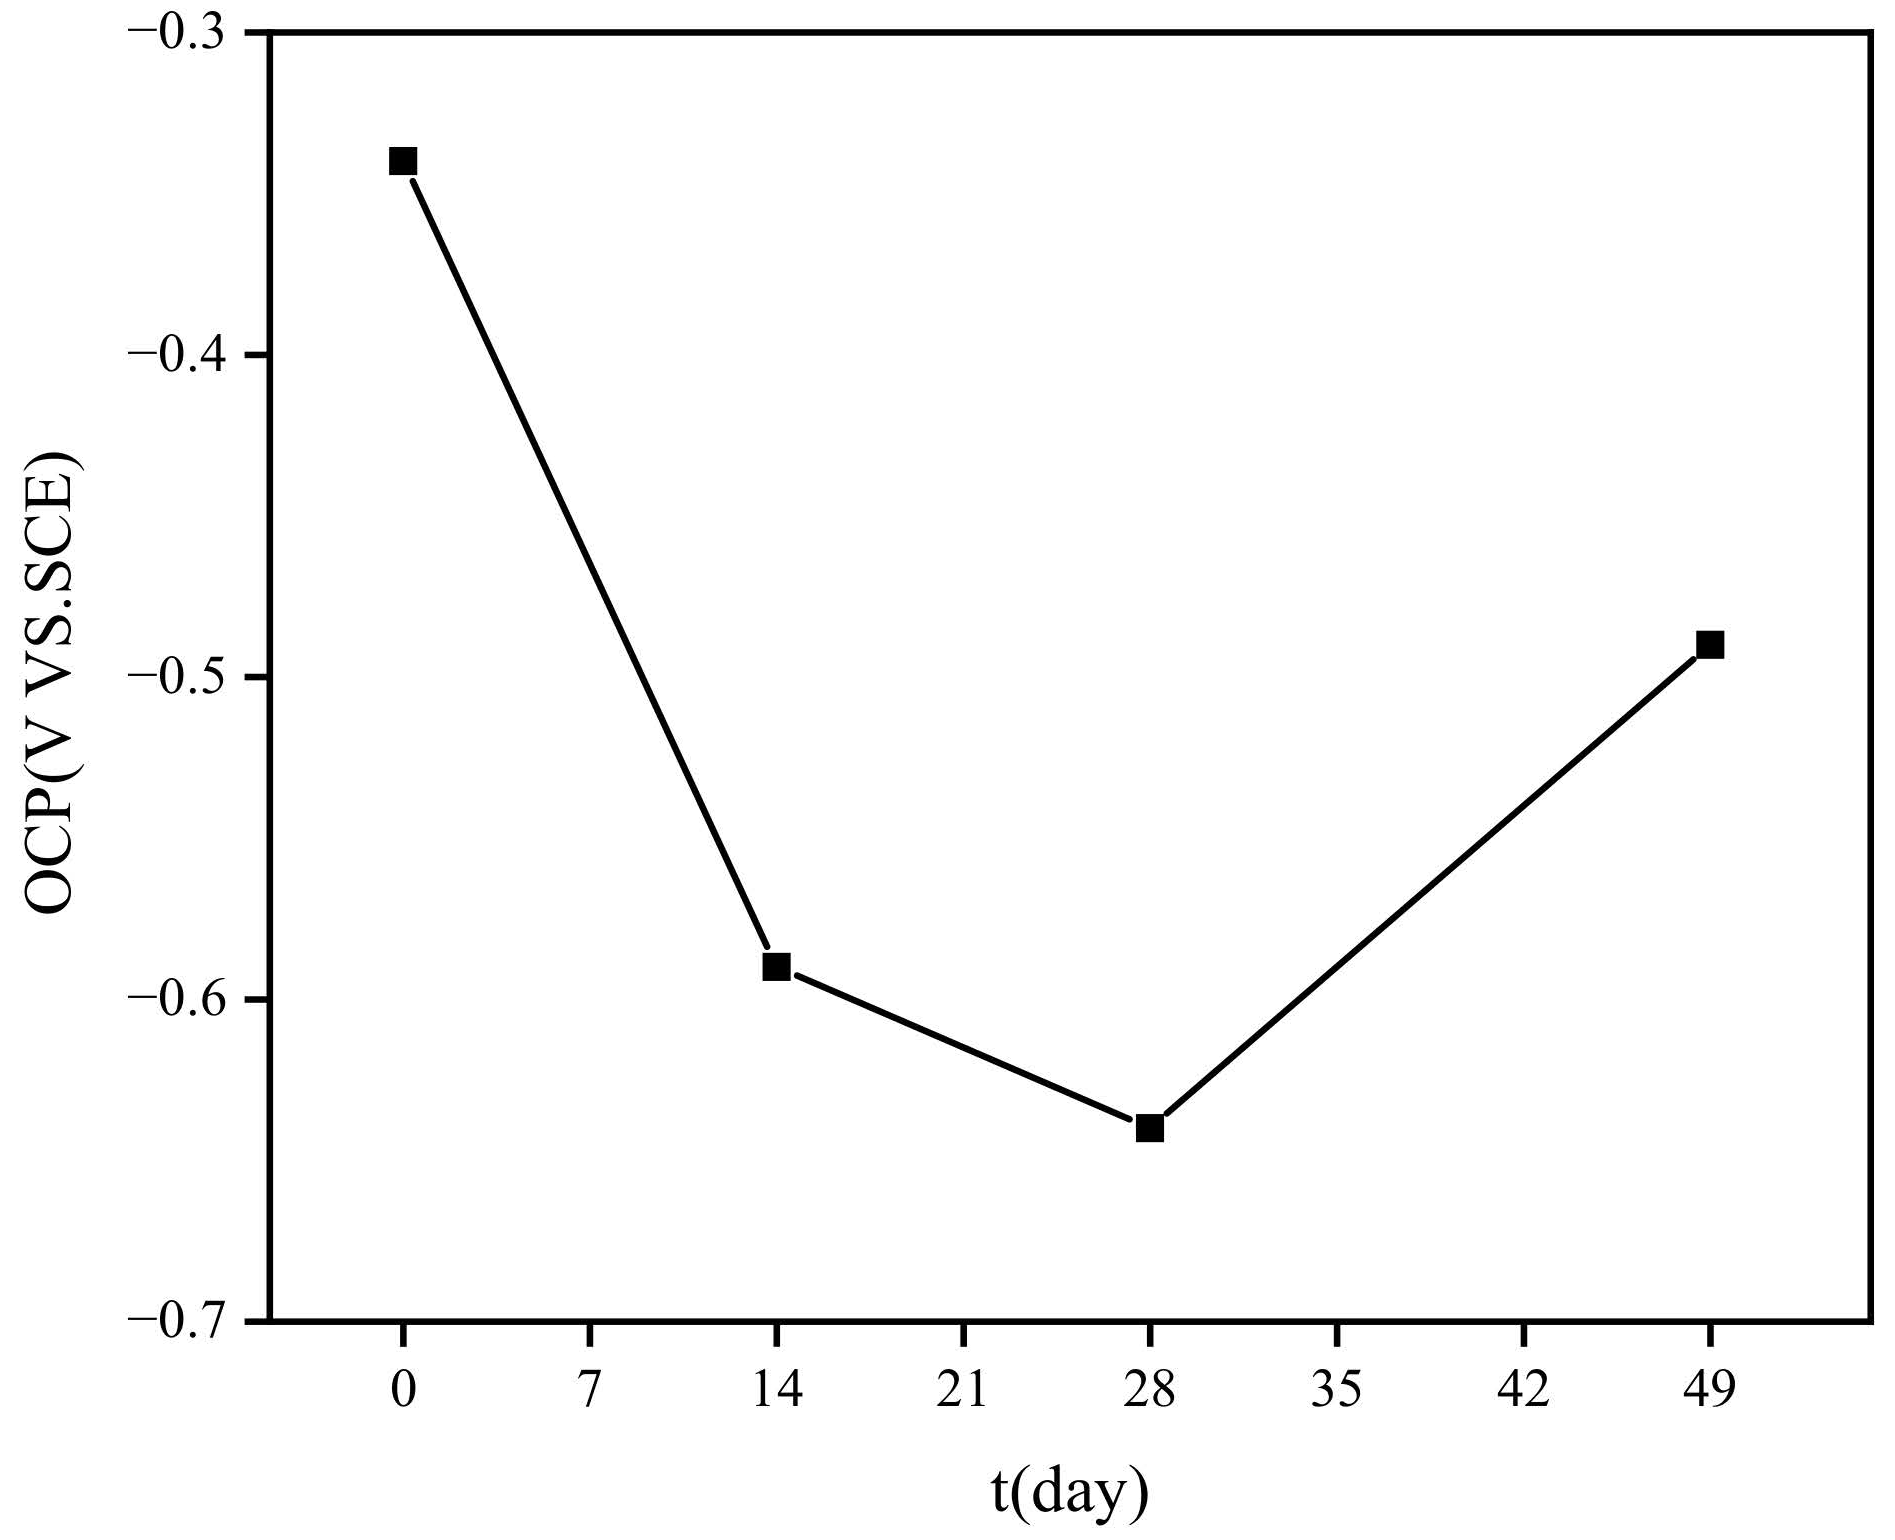
3.2.1. Open Circuit Potential of EH47

The change in open circuit potential can indicate the corrosion state and corrosion behavior of the material surface [27]. Figure 2 shows the open circuit potential curves of EH47 steel samples immersed in seawater for different durations (0, 14, 28, and 49 days) at room temperature. It can be seen from Figure 2 that the corrosion potential changes significantly after total immersion in seawater for 14 days, and the minimum value is obtained after 28 days of immersion. The variation in the open circuit potential from 14 days to 28 days is lower than that from 0 days to 14 days, which indicates that the corrosion rate of EH47 steel is relatively slow with the increase in corrosion time from 14 days to 28 days. With further extension of the corrosion time, the open circuit potential moves in the positive direction and the corrosion rate decreases gradually.

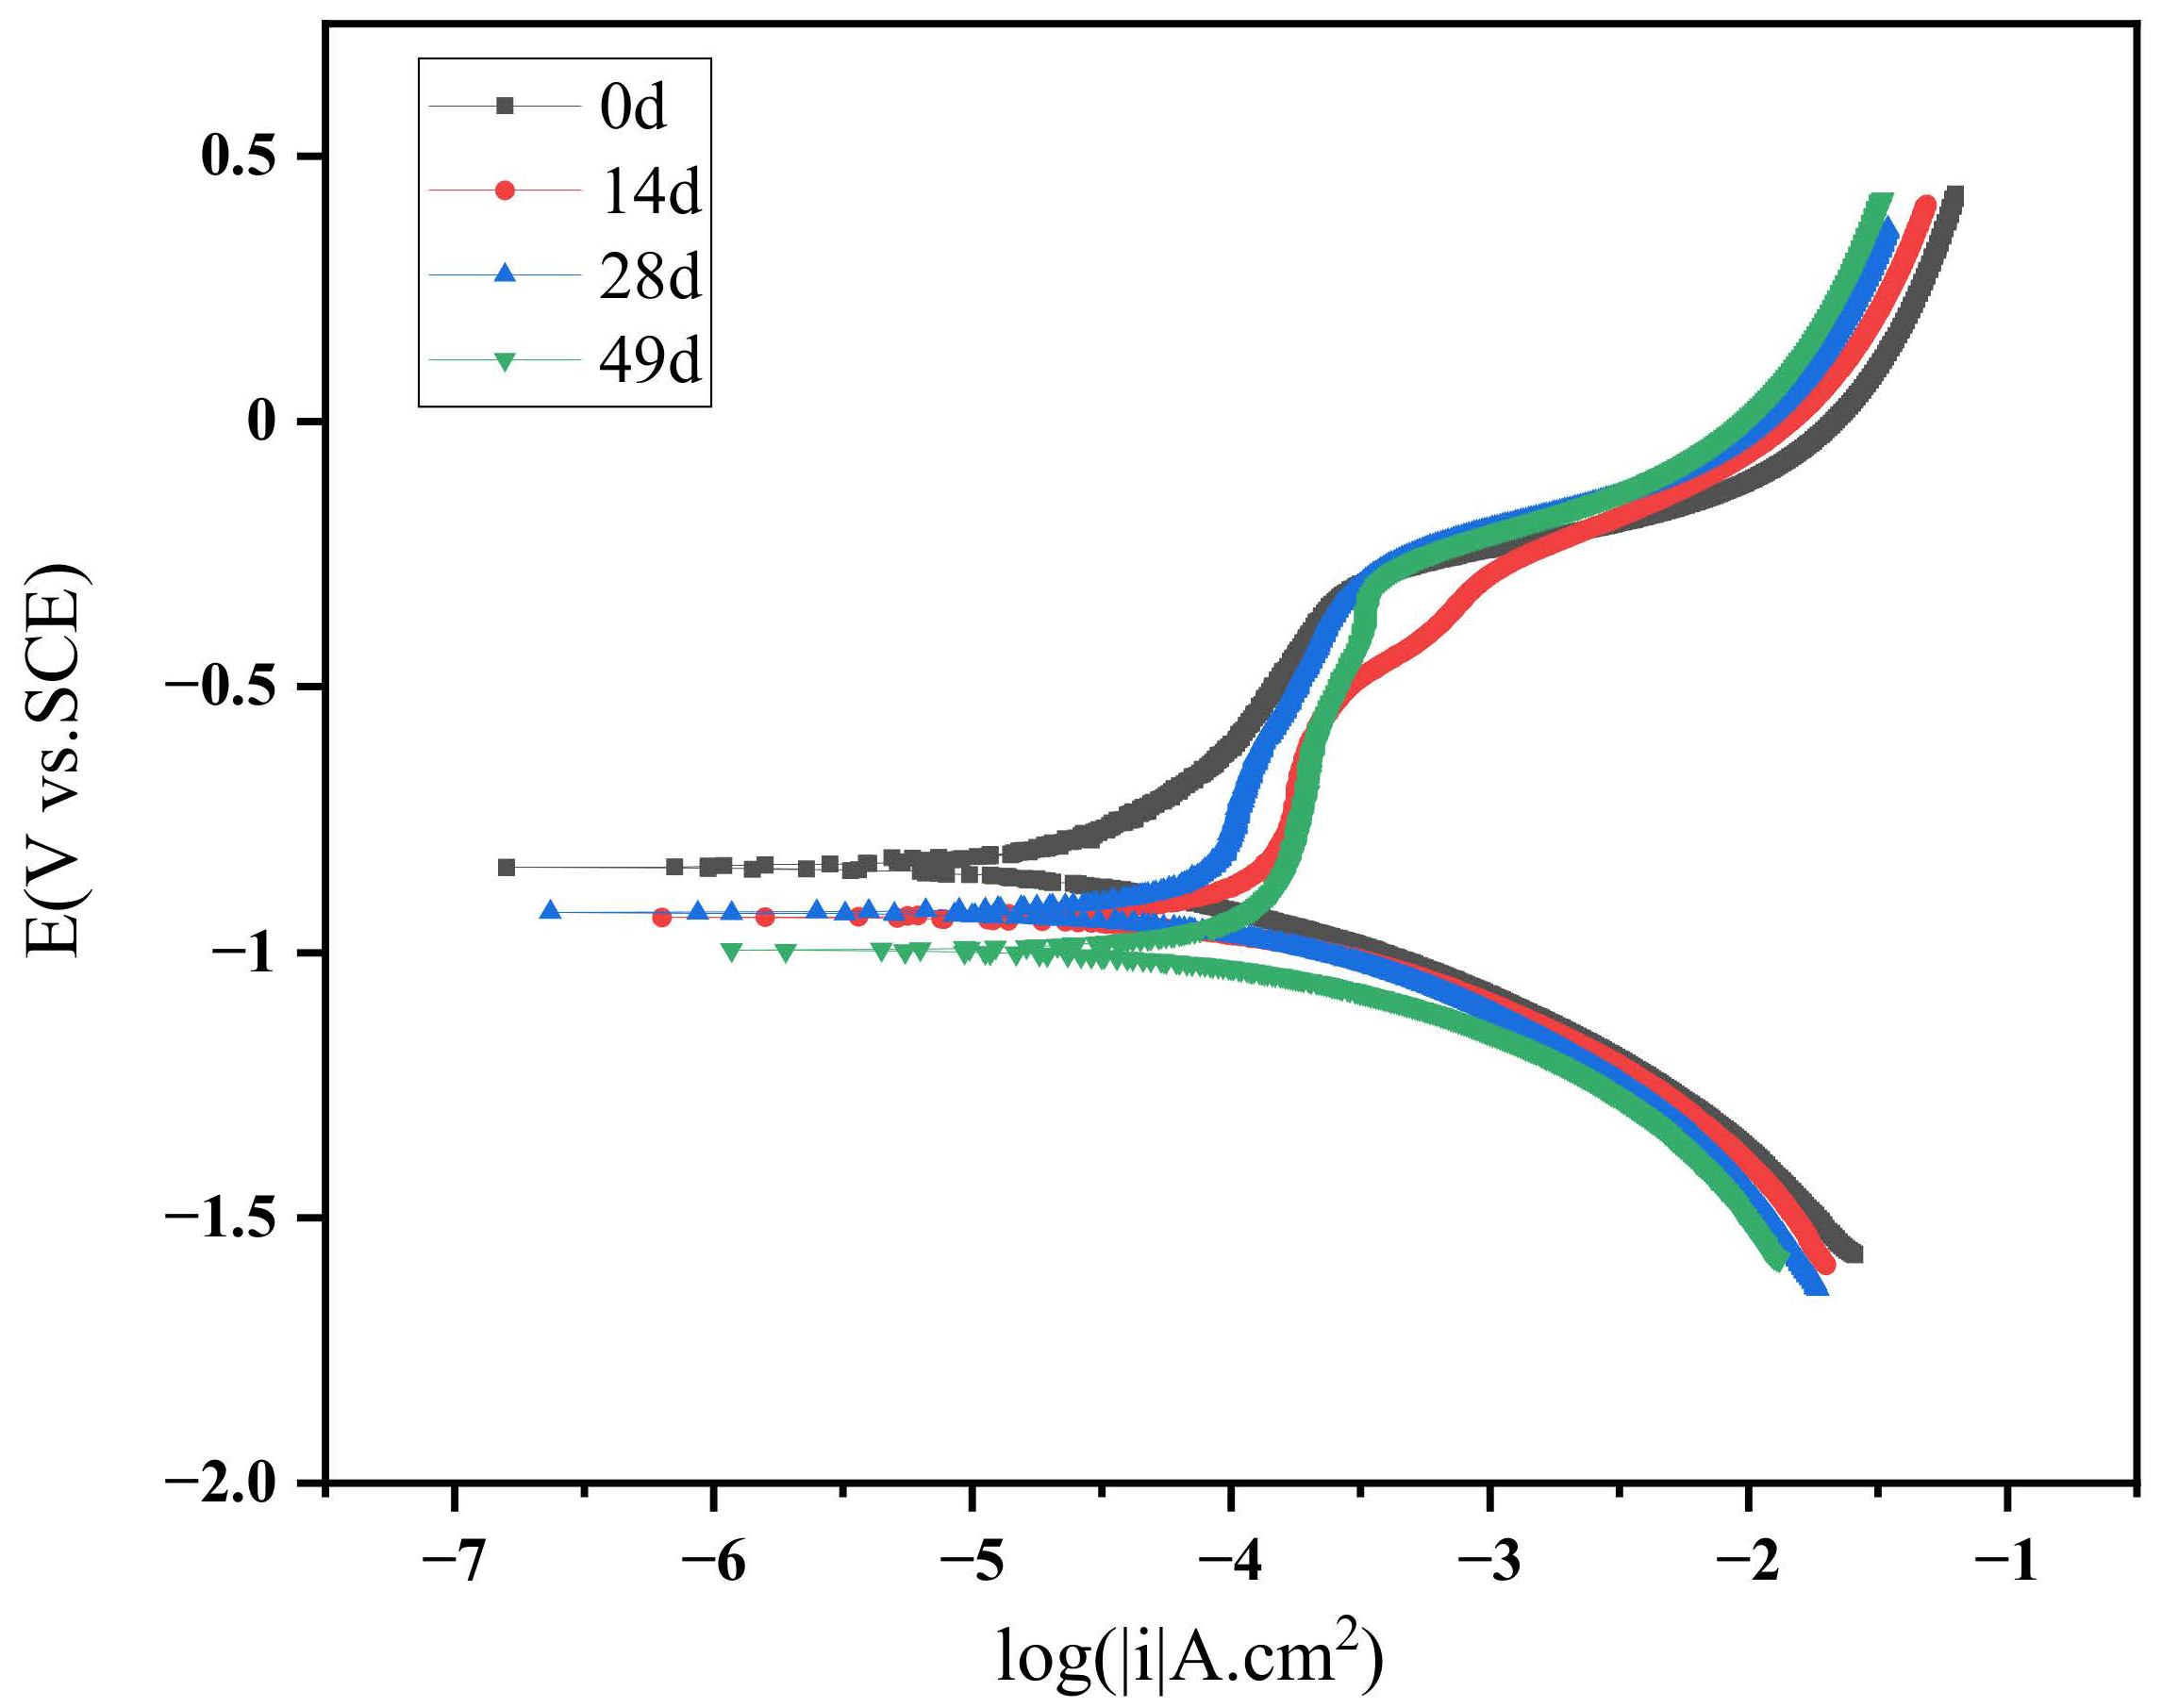
3.2.2. Potentiodynamic Polarization Tests

Figure 3 shows the potentiodynamic polarization curves of the EH47 samples immersed in seawater for different immersion durations (0, 14, 28, and 49 days) at room temperature. It can be seen from Figure 3 that the cathodic branch at day 0 immersion indicates the limiting diffusion control characteristics of the reduction reaction of dissolved oxygen. The diffusion of dissolved oxygen cannot be more effectively inhibited because there is no rust layer on the surface of the sample under this condition. With the increase in immersion time, the cathodic branch at day 0 immersion is not significantly different from 14, 28 and 49 days. The relatively smooth curves indicate that oxygen reduction can occur but it is not diffusion-controlled. The limit control characteristics of dissolved oxygen reduction on the surface of the steel with a rust layer have disappeared and changed to the charge transfer control transformation dominated by the reduction of corrosion products in the whole process of corrosion. The anode branch has a certain passivation characteristic, and the passivation range is about 0.6 V (from −0.9 V to −0.2 V). The experimental steel underwent a cathodic electrode reaction under the limit diffusion control of dissolved oxygen; meanwhile, the anode electrode reaction underwent electrochemically active dissolution under the control of charge transfer (current). After forming a certain corrosion layer thickness at the early stage of corrosion, the reductive corrosion product γ-FeOOH appears in the corrosion layer [28]. As the corrosion reaction continues, the reduction reaction (Fe3+ + e → Fe2+) of the corrosion layer mainly occurs in the cathode region. With the continuous reaction, Fe3O4 and β-FeOOH were formed with high stability in the corrosion layer, which played a certain protective role, resulting in a relatively slow corrosion rate and a relatively low corrosion current [29].
A comparison of the corrosion current density (Icorr) of samples at different corrosion durations in seawater, according to the data in Table 1, shows that the maximum value of Icorr is 1.444 × 10⁻⁴ A/cm2 on day 0, because there is no rust layer on the surface of the day 0 immersion sample, and that the oxygen on the surface of the sample is sufficient, the anodic dissolved Fe2+ can diffuse rapidly, and the corrosion rate is the fastest [30]. With the prolongation of immersion time, the Icorr of the EH47 steel sample first decreases and then increases, and reaches the minimum value of 8.093 × 10⁻⁵A/cm2 at day 28 immersion. Because of the dense and tight corrosion layer formed on the surface of the sample under this condition, which plays a prominent role in protecting the matrix and hinders the diffusion of Fe2+ generated by the anodic reaction on the steel surface in seawater, the corrosion resistance of the sample is relatively good at day 28 immersion. With a further increase in immersion time, the rust layer formed on the surface of the sample is easily removed after long-term immersion in seawater, which provides a channel for the diffusion of iron ions into seawater under the condition of sufficient O2 [31]. Furthermore, the corrosion products become loose and porous, and the protective effect of the corrosion layer on the matrix is weakened, which makes the Icorr of the EH47 steel sample increase after 49 days of immersion [5,32,33].

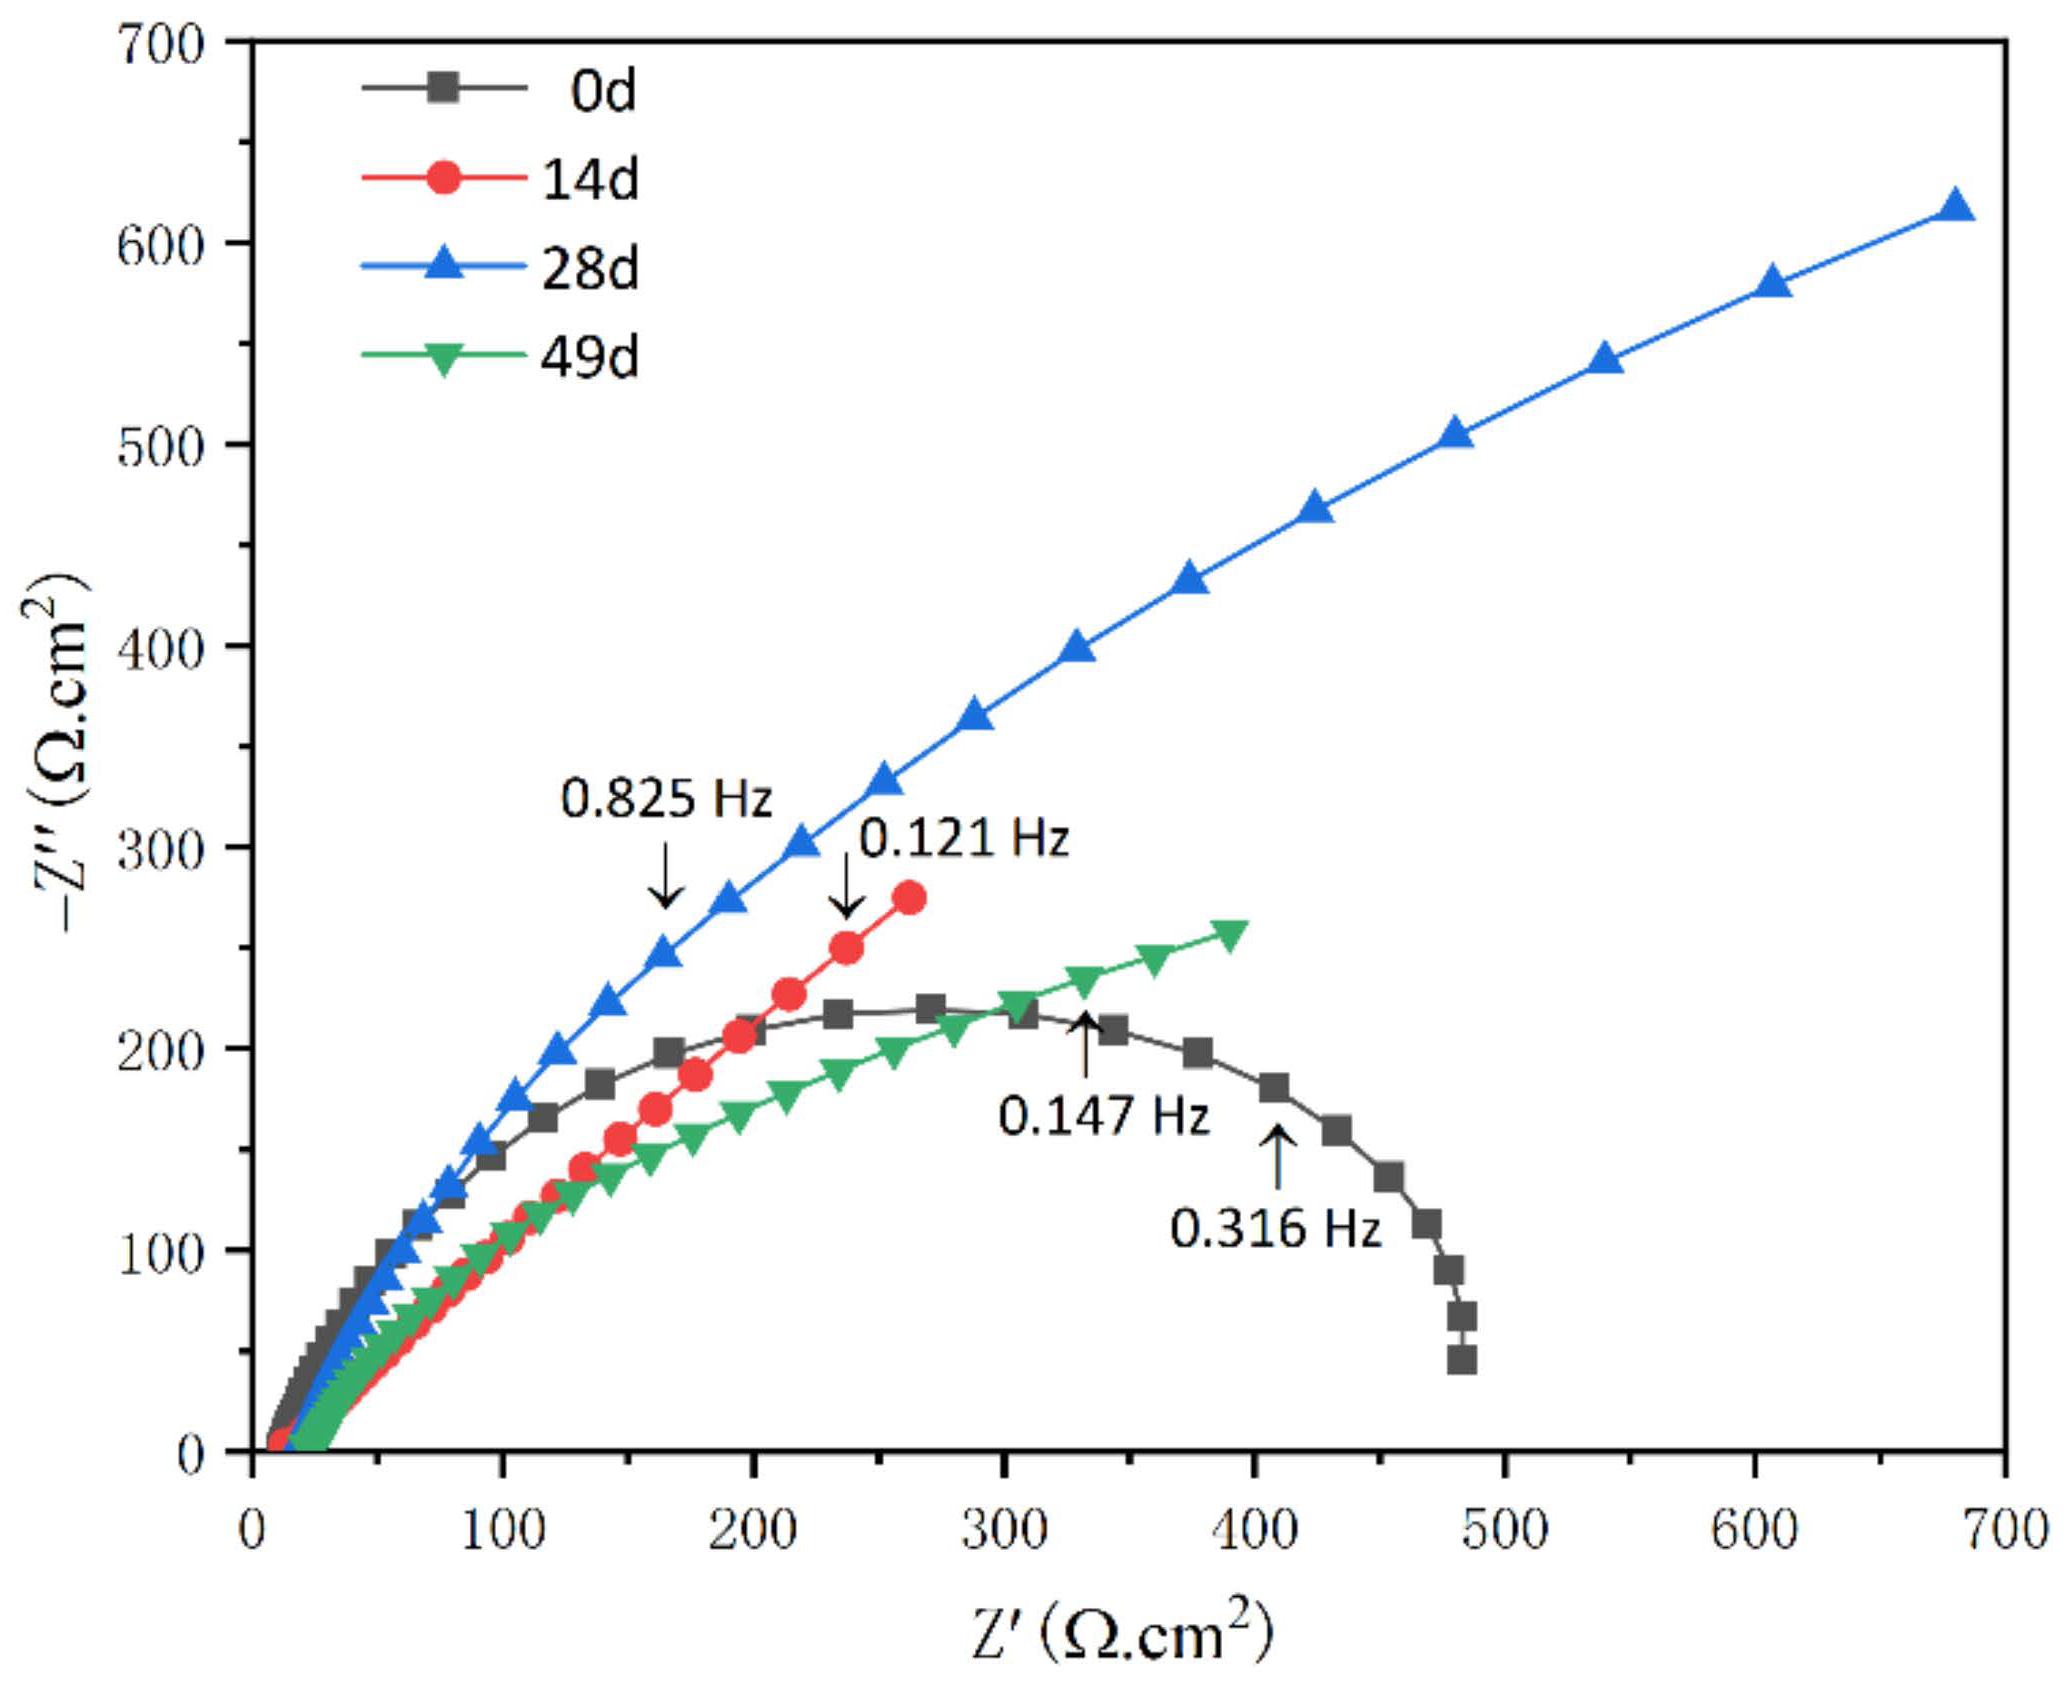
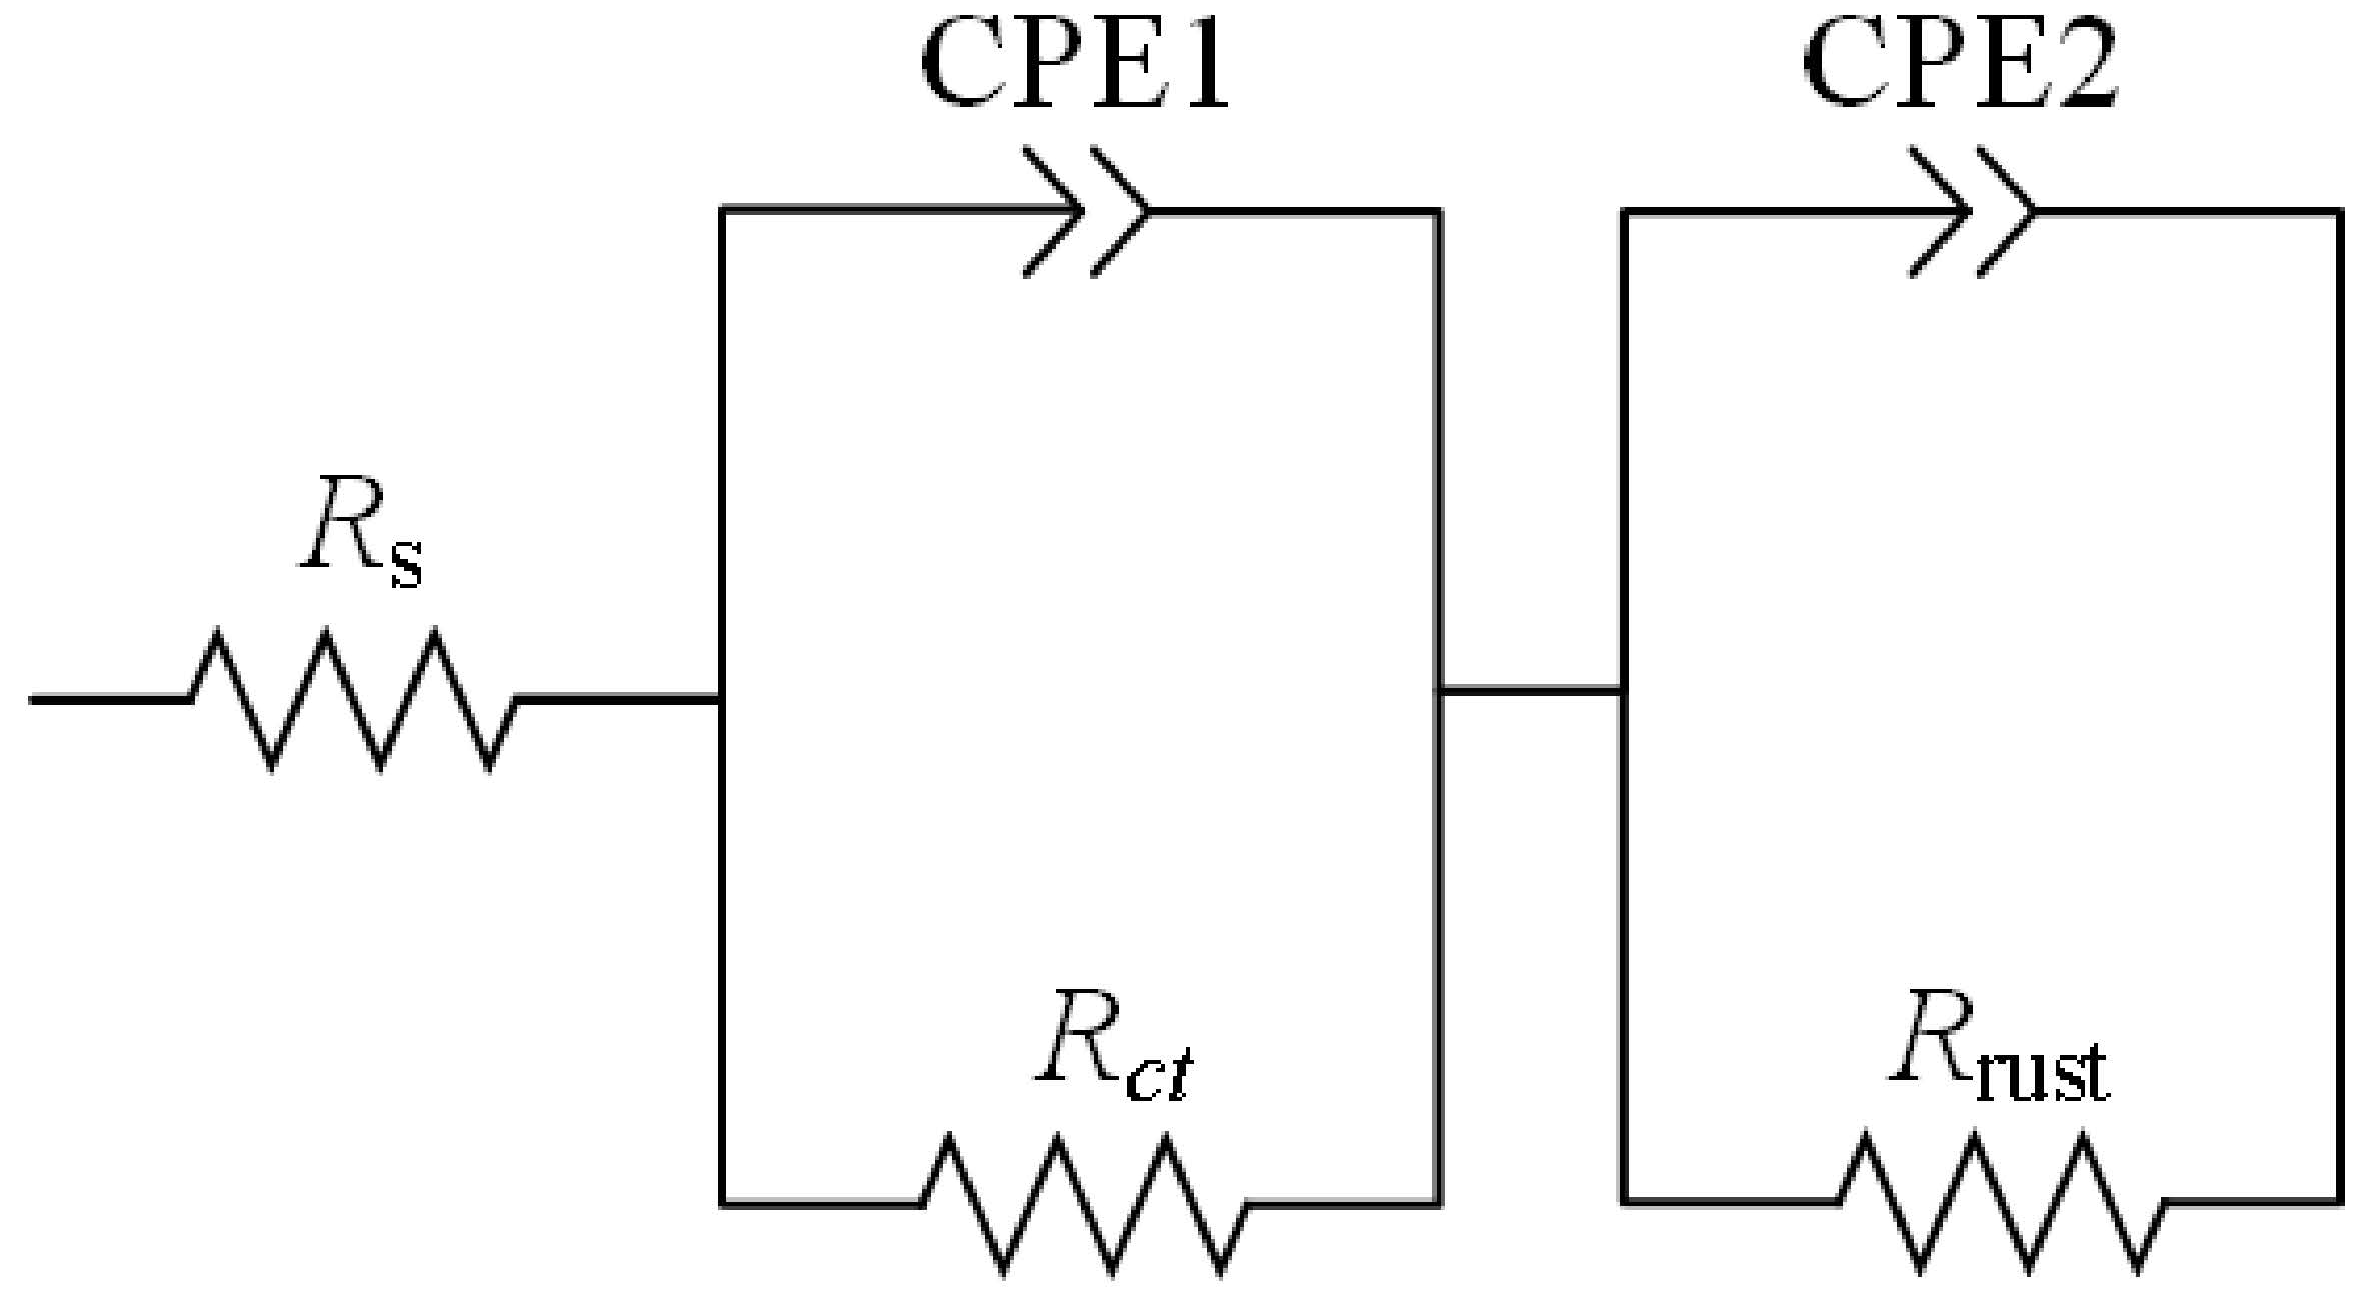
3.2.3. EIS Measurements

Electrochemical impedance spectroscopy is an effective method in the field of corrosion electrochemistry [34]. Figure 4 shows the Nyquist diagrams of EH47 steel corroded in seawater for different immersion durations (0, 14, 28, and 49 days). It can be seen from Figure 4 that the obvious capacitive arc is an incomplete semicircle. The radius of the semicircle arc increases gradually. With the extension of full immersion time, the radius of the semicircle arc decreases, which may be caused by the thickening of the rust layer affecting the charging and discharging process. Among them, the arc radius of the day 28 immersion sample is the largest, which indicates that the impedance is the largest, the corrosion rate is the smallest, and the corrosion resistance is good. The arc radius of the day 0 immersion sample is the smallest, which indicates that its impedance is the smallest and the corrosion rate is the largest, which is consistent with the results of the polarization curve analysis above.
Figure 5 shows the Bode diagrams of the samples immersed in seawater for different durations. Figure 5a shows the phase angle versus frequency. It can be seen that the phase angle of 28 days immersion is close to the maximum value. Figure 5b shows that the impedance modulus value increases with the decrease in frequency in the frequency range from 10−1 Hz to 10 Hz, and the maximum impedance is obtained at day 28 of immersion. Figure 5 further demonstrates that the corrosion resistance of the day 28 immersion sample is the best.
The equivalent circuit diagram used for fitting the impedance data is shown in Figure 6. In this circuit, Rs represents the solution resistance, Rct is the charge transfer resistance of the corroded samples and Rrust is the resistance of the corrosion products on the sample surface.
CPE (constant phase element) reflects the capacitance behavior, which is a frequency-dependent capacitance expressed the following equation:
CPE = [Q (Jω)n]1
where Q is a frequency independent constant, J is the imaginary unit, ω is the angular frequency, n is an exponential term. If n = 0, the impedance is ideal resistance, while it is ideal capacitance if n = 1, and 0 < n < 1 represents the deviation from the ideal capacitance, which is correlated with the surface roughness and defect [35,36].
The n values corresponding to the four groups of different days of immersion in this experiment are all greater than 0.6, which indicates that the diffused impedance characteristics with limited retention layer [26], and the corrosion layer generated on the sample surface after corrosion reaction has produced a barrier effect on the solution, meanwhile, the diffusion reaction of ions contained in the solution to the matrix is limited. Y0 is a parameter with dimensions of Ω−1cm−2·s−n, CPE1 represents the capacitance in parallel with Rct and CPE2 represents the capacitance in parallel with Rrust. Meanwhile, n1 is the exponential term correlated with Rct, and n2 is the exponential term correlated with Rrust.
The inhibition efficiencies of the inhibitor from EIS are calculated using the following equation:
IE % = R ct R ct 0 R ct × 100
where Rct and R ct 0 are the charge transfer resistance in the presence and absence of inhibitor, respectively.
The data was fitted by Zview (Zview3.1, San Francisco, CA, USA). The fitting results are listed in Table 2.

3.3. The Corrosion Mechanism of EH47

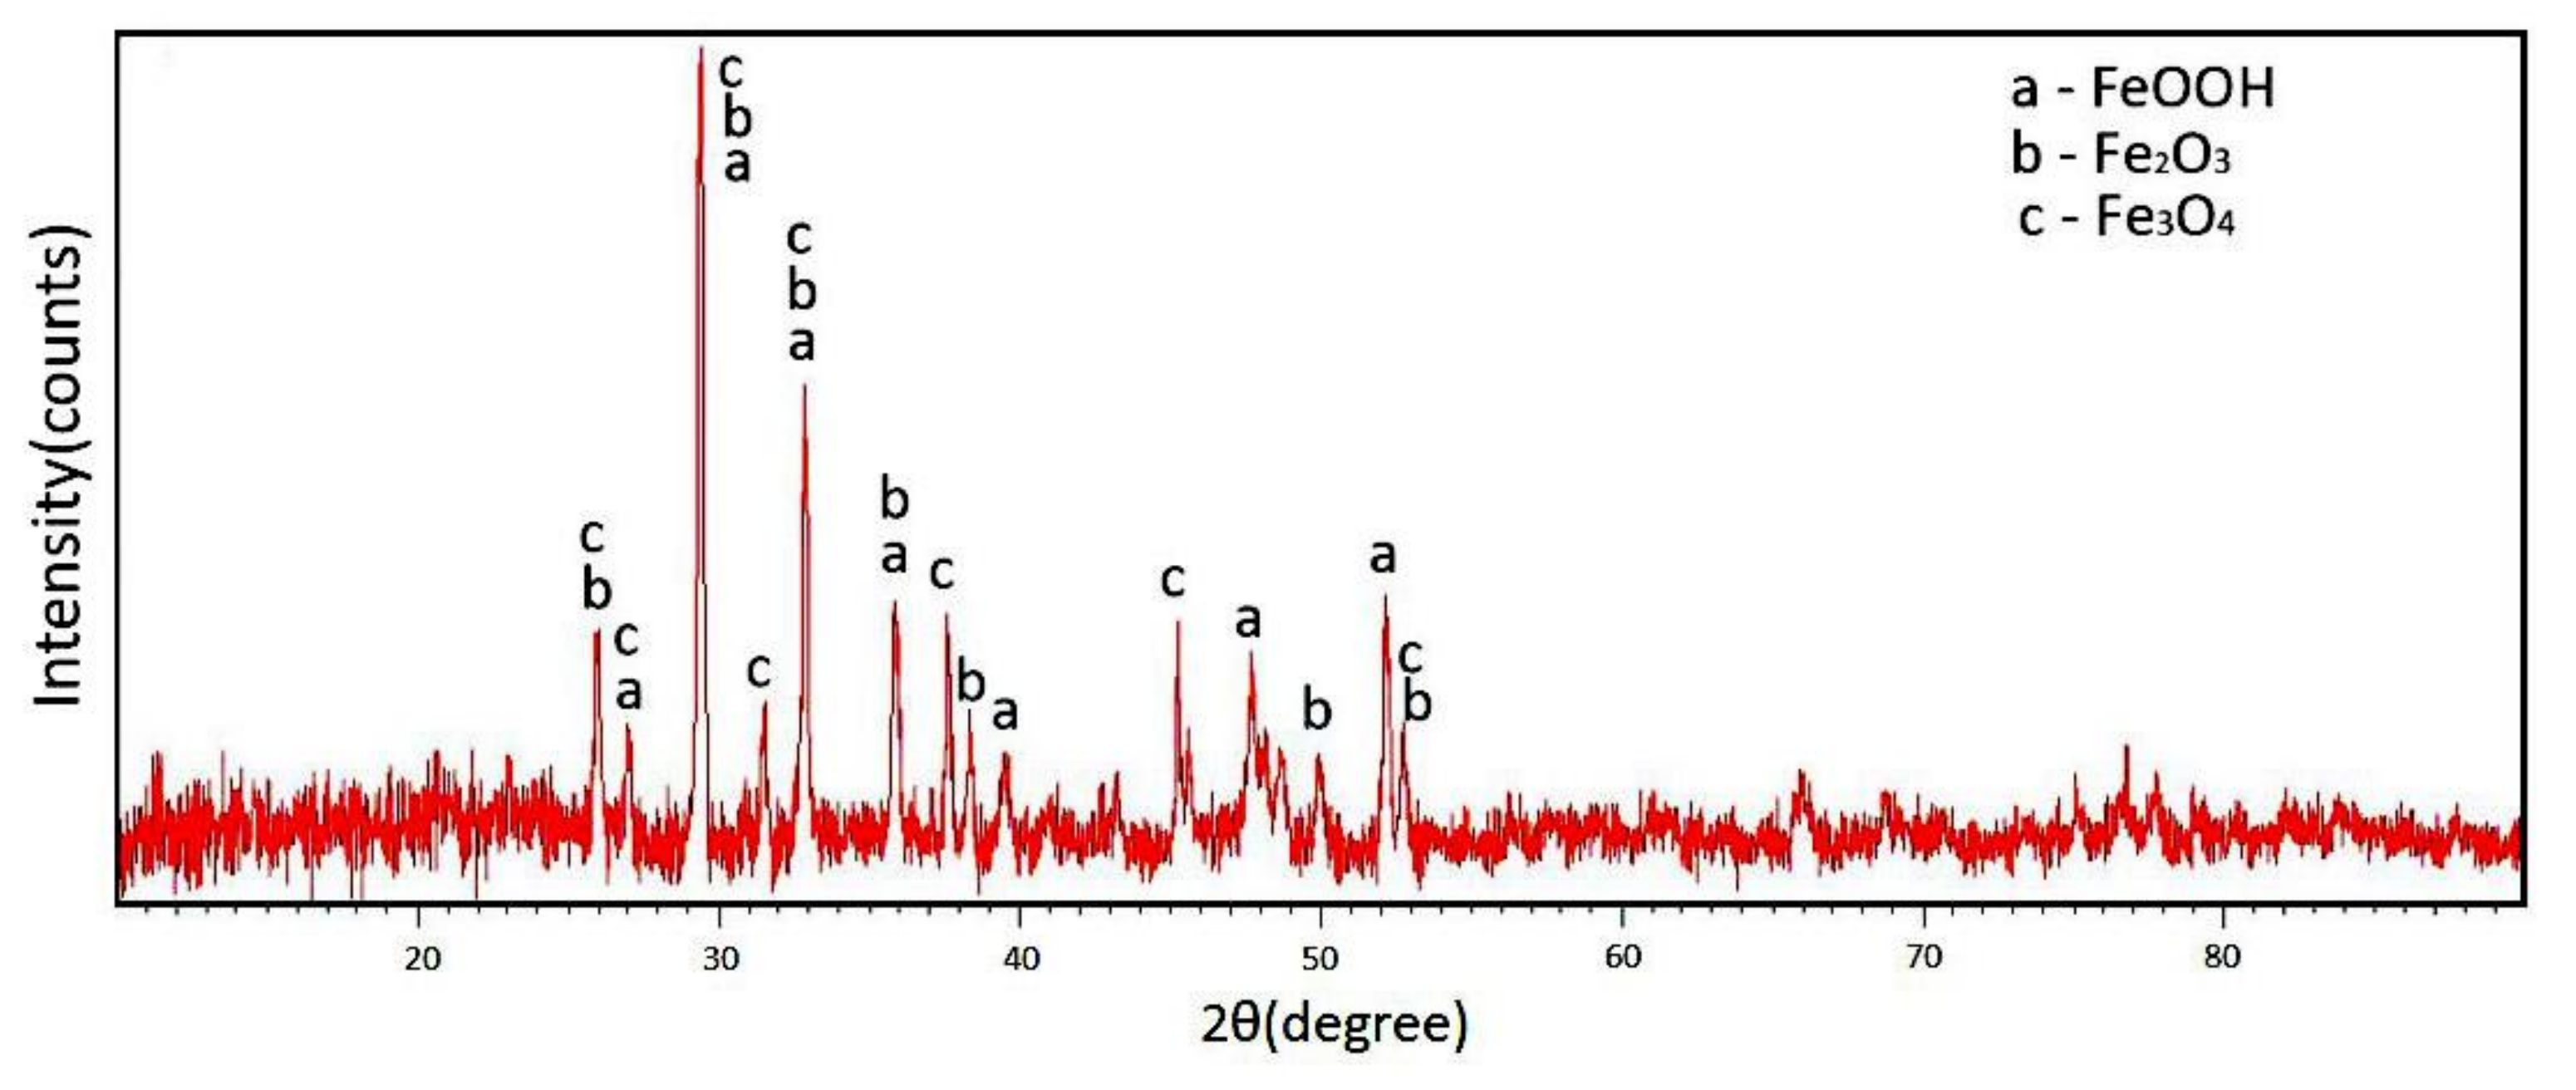
3.3.1. The Phase Composition of the Corrosion Products for EH47

In order to study the phase composition of the corrosion products of EH47, the X’Pert Powder X-ray diffractometer was used to analyze the corrosion layer of the experimental steel. The X-ray diffraction analysis results of the corrosion products of EH47 after immersion in seawater for 49 days are shown in Figure 7. It can be seen that the corrosion products formed on the surface of EH47 steel are mainly composed of FeOOH, Fe3O4 and Fe2O3 phases.
After the EH47 steel sample is immersed in seawater for 49 days, the corrosion product layer extends from the outer layer to the inner part, and the content of O element gradually decreases, while the content of Fe element gradually increases, corresponding to the results of the previous energy spectrum analysis, which reflects the characteristics of comprehensive corrosion [37]. In the early stage of corrosion, due to the existence of inclusions in EH47 steel and the inhomogeneous composition of the sample surface, numerous microcells will occur on the surface of the sample immersed in seawater. The equation of this reaction is as follows:
Anodic reaction:
Fe → Fe2+ + 2e
Cathodic reaction:
O2 + 2H2O + 4e → 4OH
Dissolved Fe2+ is deposited on the metal surface and is hydrolyzed and oxidized to Fe3+ and finally γ-FeOOH is formed. The corrosion reaction is as follows:
Fe2+ + H2O FeOH+ + H+
2FeOH+ + O2 + 2e 2γ-FeOOH
With the progress of the reaction, the dissolved iron will continue to be oxidized to the unstable intermediate after deposition, and the intermediate will be further oxidized after dehydration to form β-FeOOH. With further corrosion, the corrosion layer will thicken and the dissolved oxygen will be difficult to diffuse to the surface of the steel substrate. A part of γ-FeOOH is transformed into α-FeOOH by amorphous iron hydroxide, and parts of β-FeOOH and γ-FeOOH are reduced to Fe3O4 due to the cathodic reaction.
Cathodic reaction:
6FeOOH + 2e→ 2Fe3O4 + 2H2O + OH
Therefore, the corrosion products of EH47 steel after immersion in seawater for 49 days are mainly composed of FeOOH, Fe3O4 and Fe2O3.

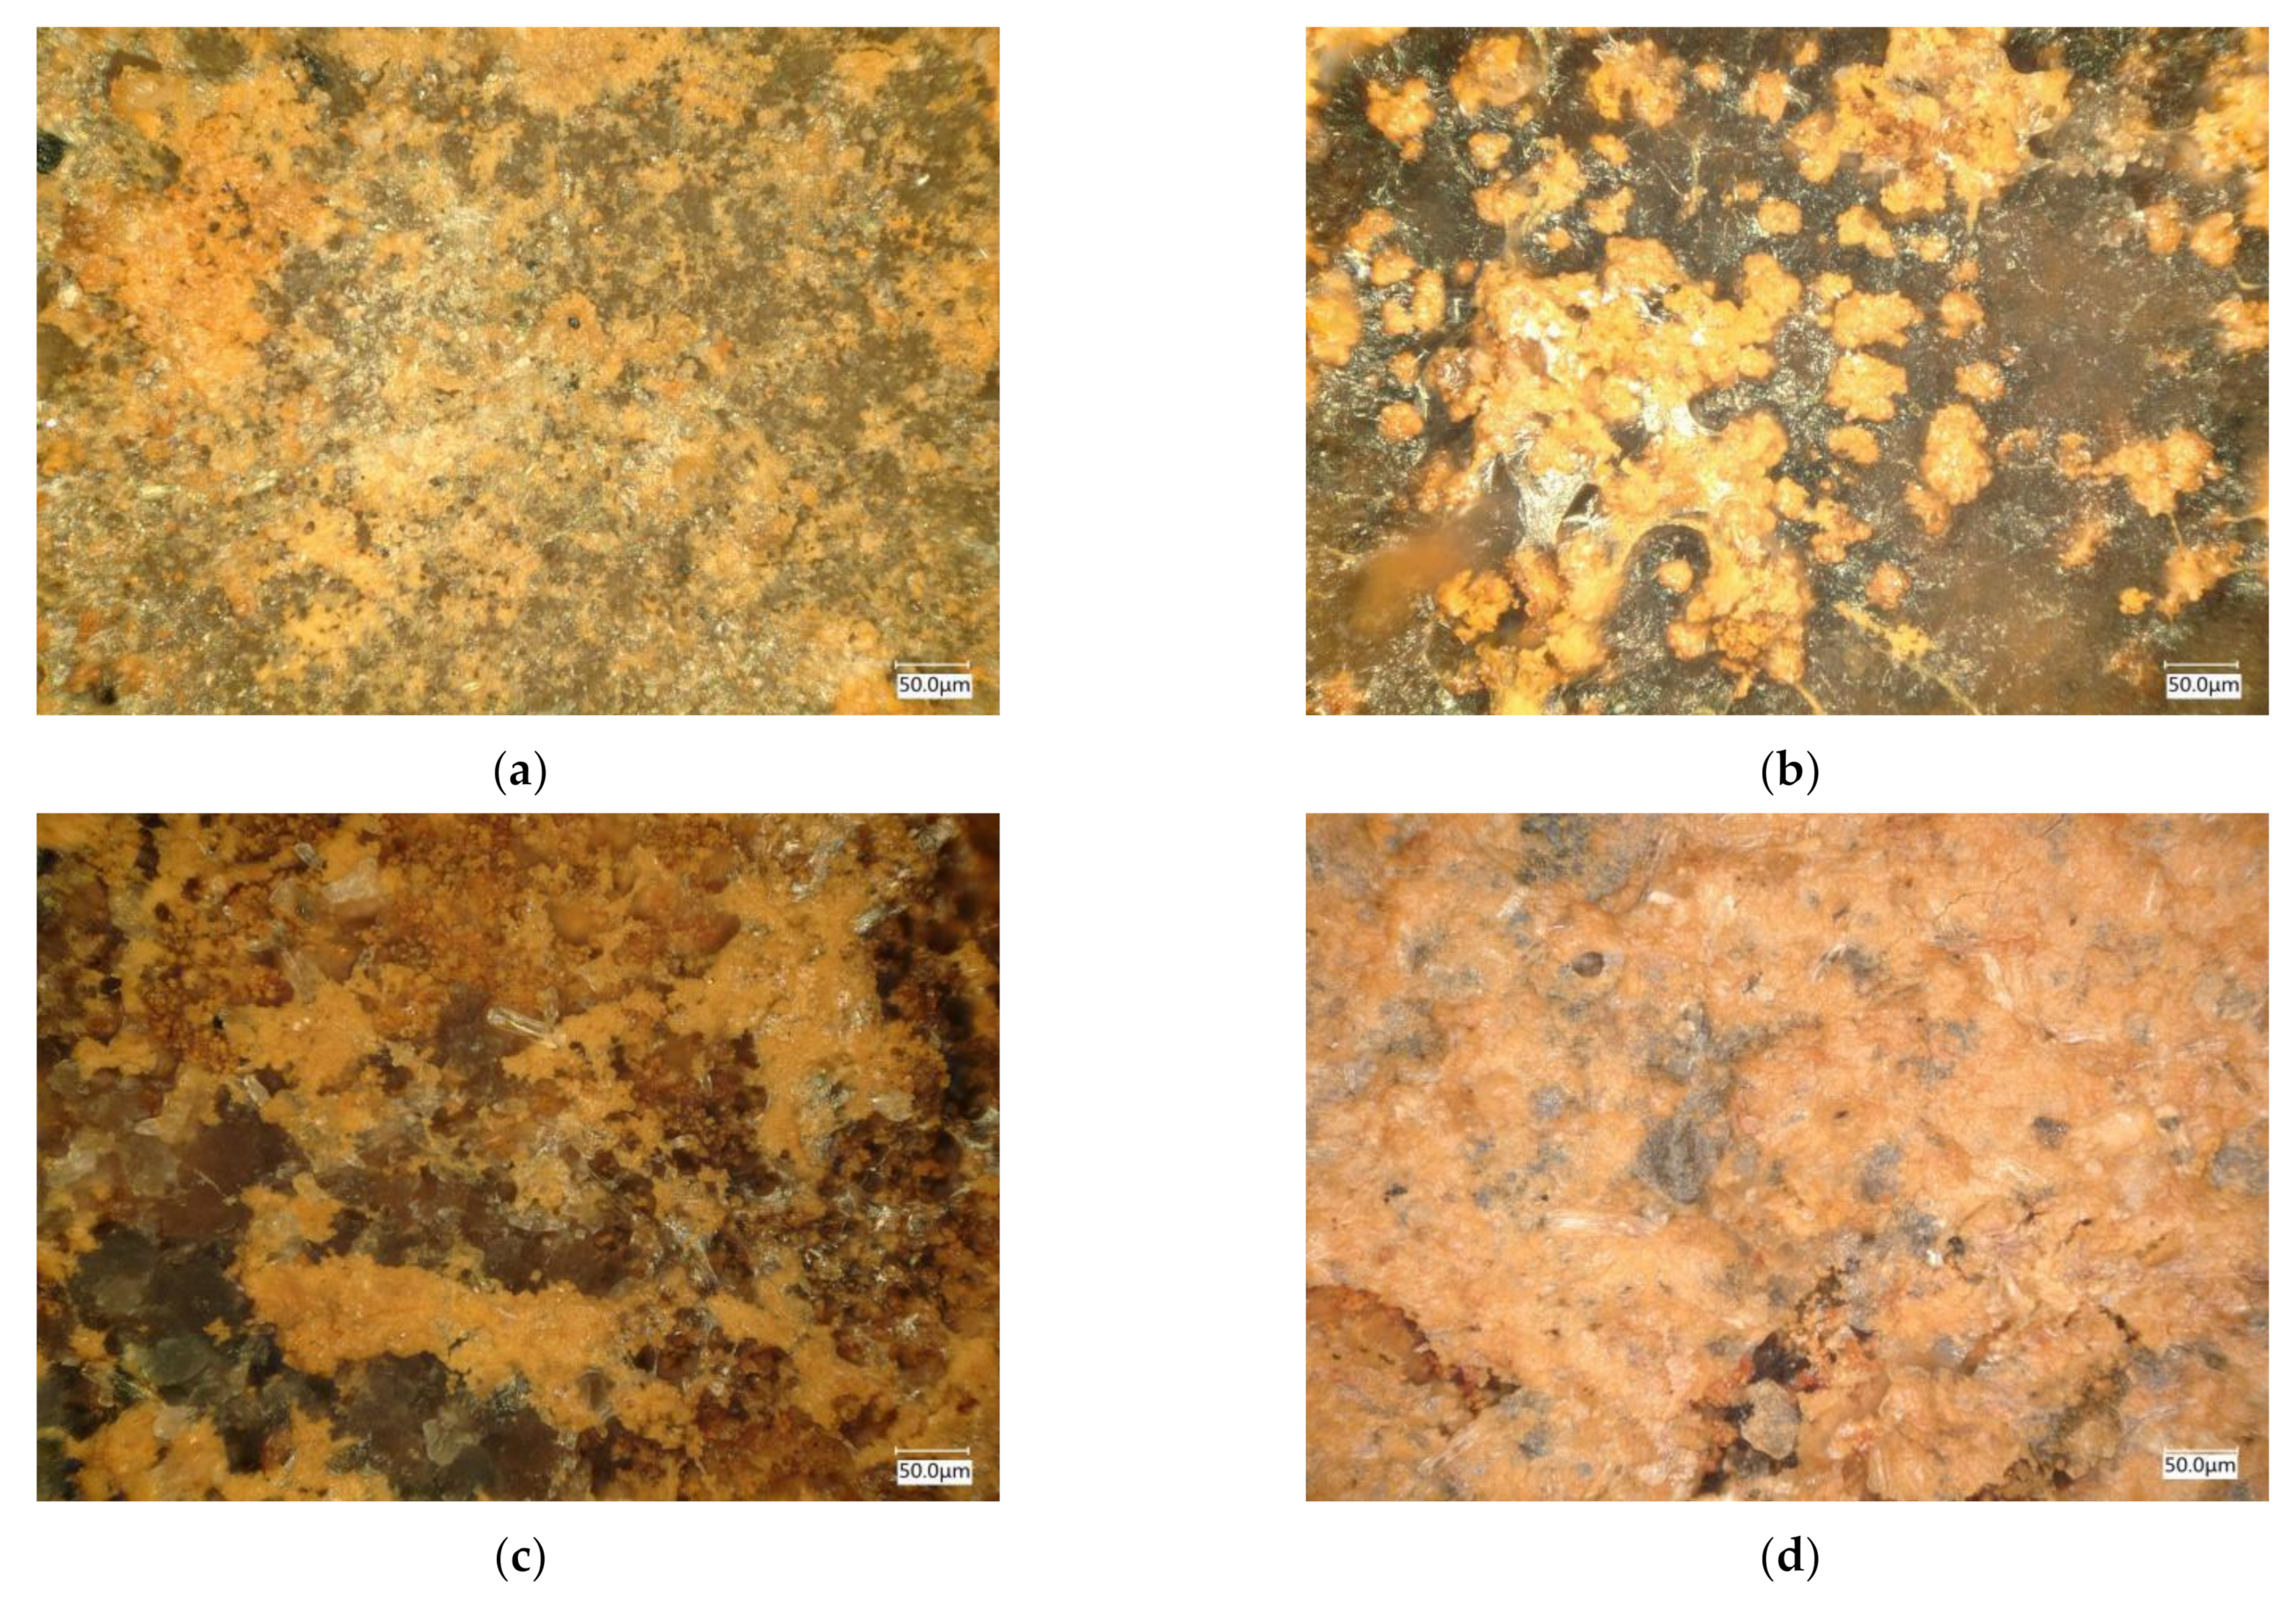
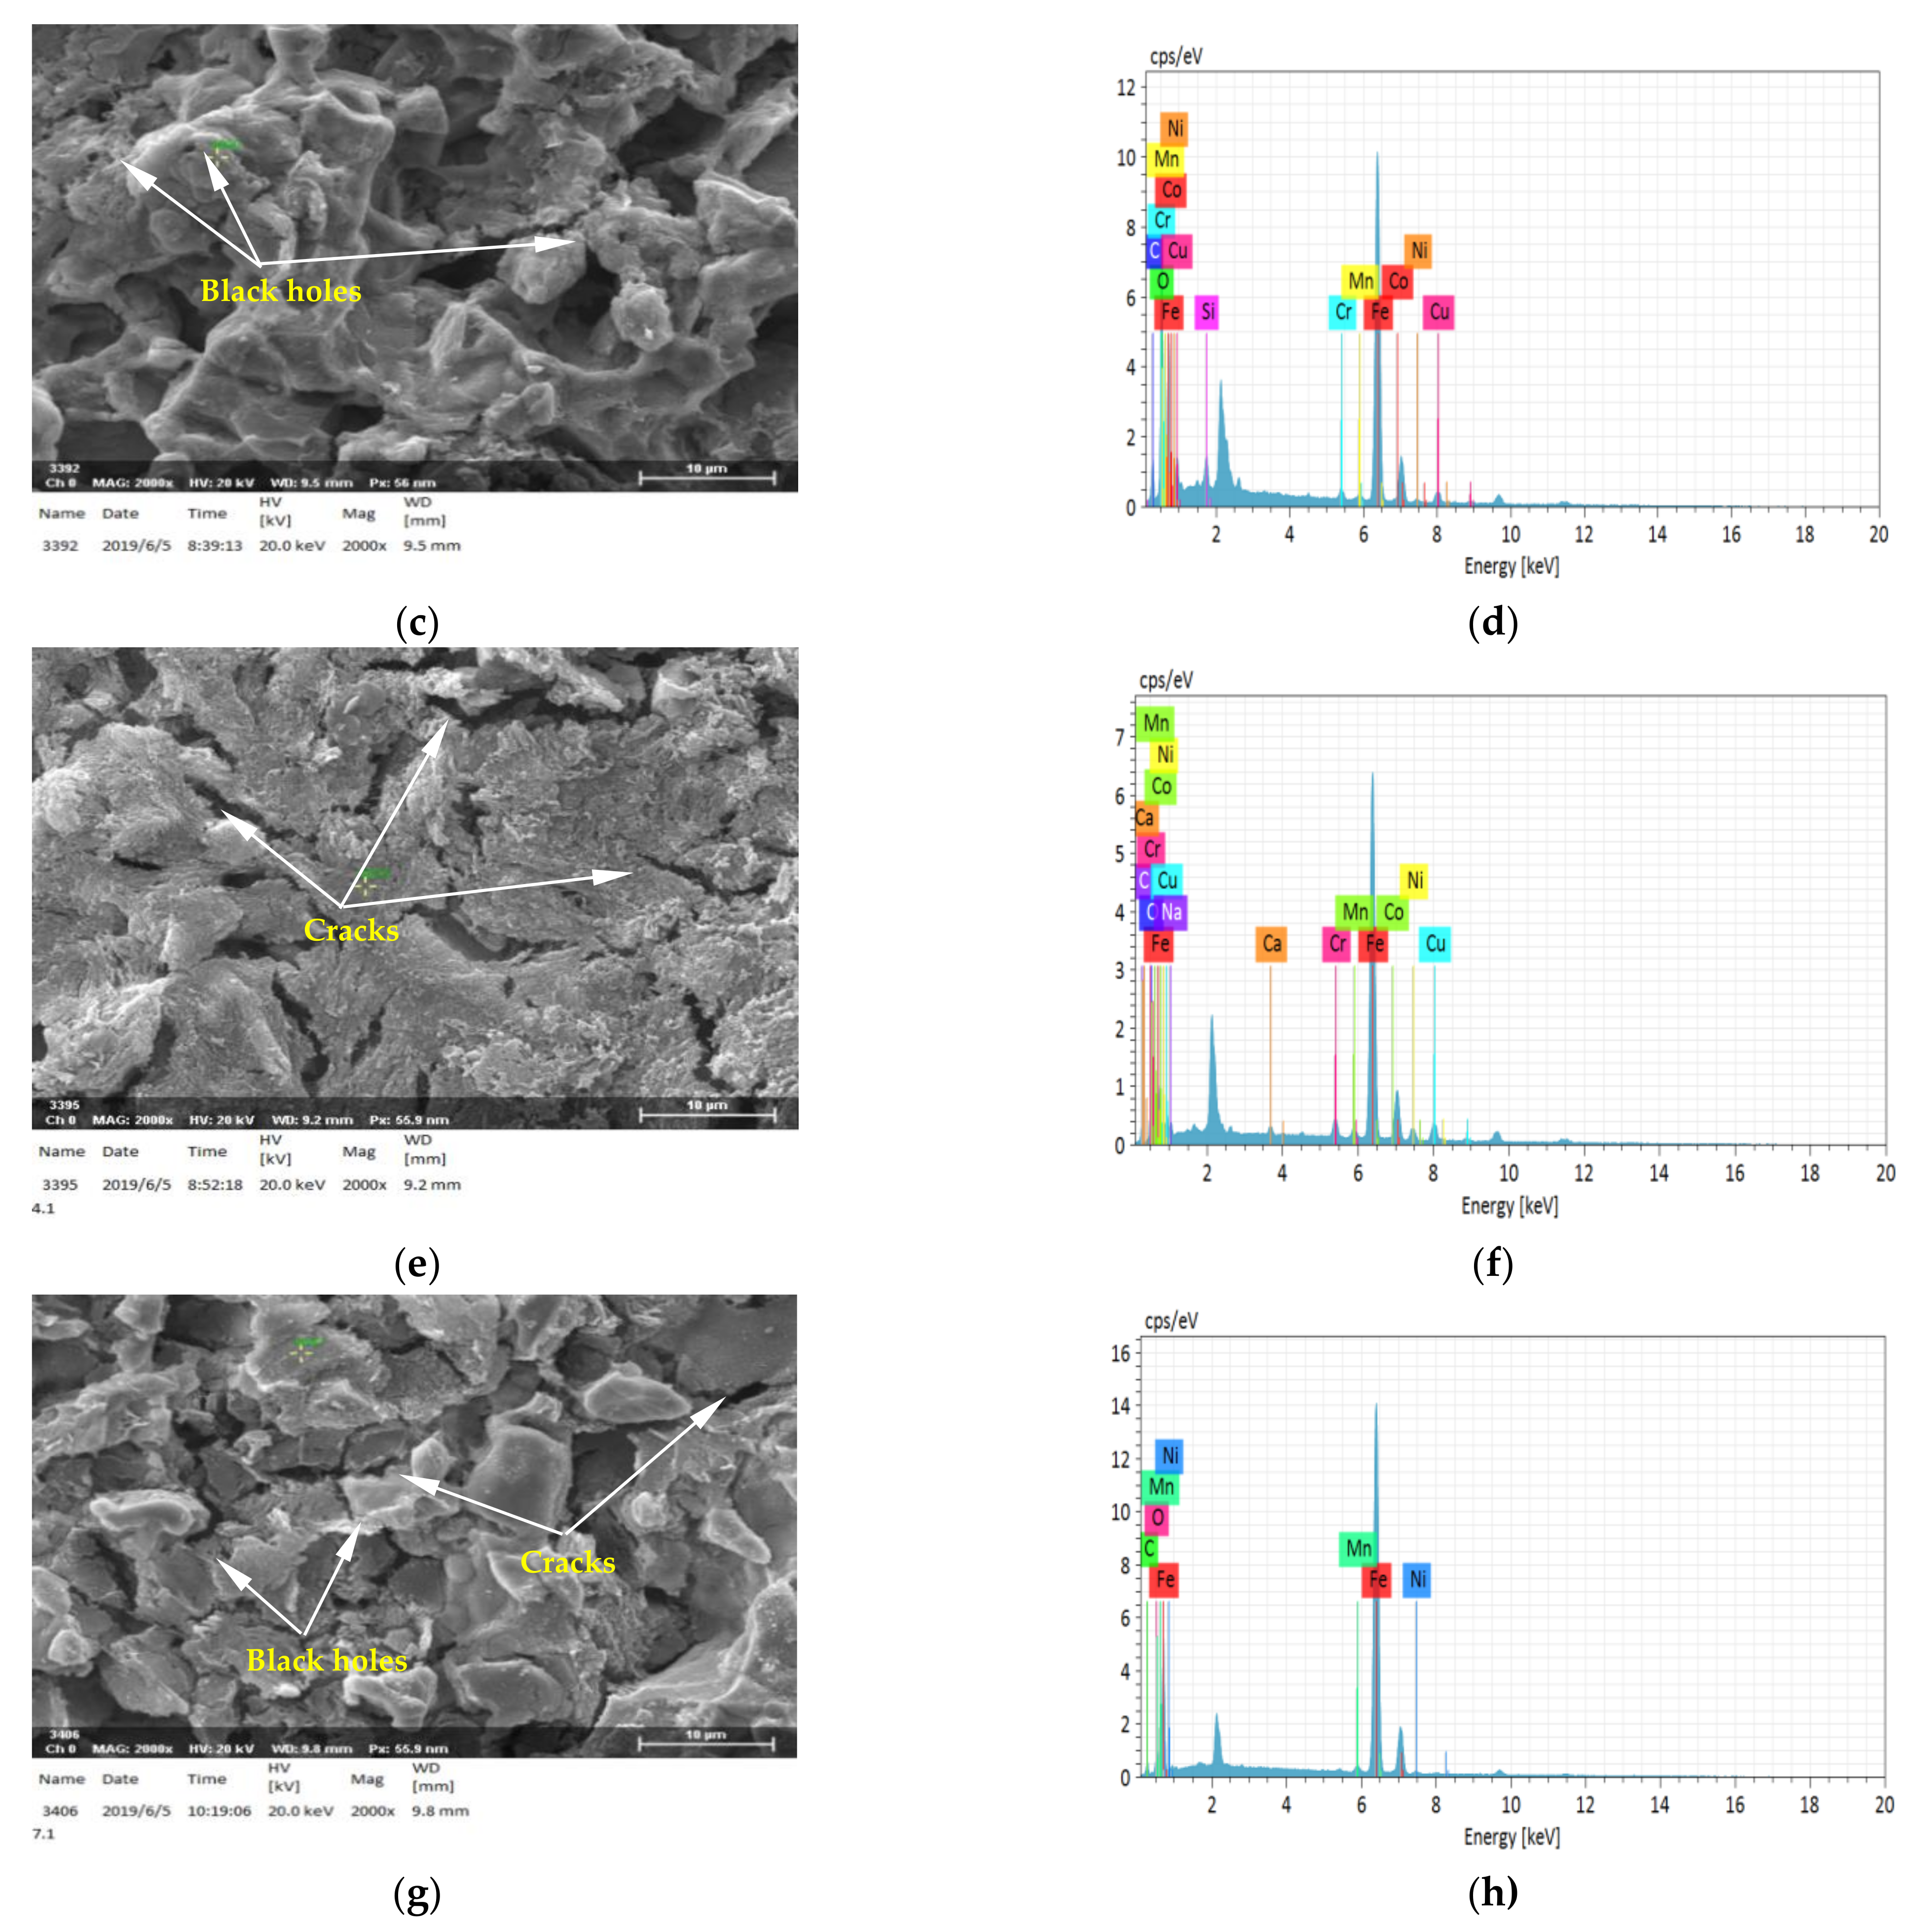
3.3.2. The Microstructure of Corrosion Products of EH47 Formed on the Sample Surface under Different Full Immersion Corrosion Times

It can be seen that corrosion products formed on the sample surface are light yellow and loose granular clusters in a network distribution, and a small part of the corrosion products are aggregated into blocks, while a small part of the dark brown substrate is exposed after 20 days of immersion in seawater (Figure 8a). The corrosion products on the surface of the sample become large lumps, and some of the corrosion products fall off, and the exposed part of the black matrix increases as shown in Figure 8b after 40 days of immersion. As shown in Figure 8c, the color of corrosion products on the surface of the sample becomes darker after 60 days of immersion. The newly generated light yellow corrosion products appear on the original dark yellow corrosion products in irregular network blocks. The surface of the sample is almost completely covered by the newly pale yellow corrosion products, with obvious thickness differences between the upper and lower layers, as shown in Figure 8d, after 80 days of immersion.

3.3.3. The Mechanism of Immersion Corrosion of EH47

In order to investigate the mechanism of immersion corrosion of EH47, the full immersion corrosion tests were performed in natural seawater for different total immersion durations. Furthermore, the rust layer on the surface of the sample for different total immersion durations was removed and the cross section of the sample matrix after the full immersion corrosion tests in natural seawater were measured by SEM and EDS to study the mechanism of immersion corrosion of EH47.
Figure 9 shows the SEM and EDS diagrams of the sample matrix. In order to investigate the corrosion mechanism, the sample matrix was obtained after the rust layer on the sample surface for different durations was removed.
Figure 9a,b show low magnification SEM images of the sample matrix. It can be seen from that the corrosion products on the surface of the substrate after 20 days of immersion show massive accumulation. Figure 9b shows the rust layer on the surface of the sample after 40days of immersion. It can be seen from the figure that the corrosion products on the surface of the matrix are of poor continuity and there are many black cracks and black holes on the corrosion product film.
Figure 9c,e,g show high magnification SEM images of the sample matrix. Figure 9c presents that the continuity of the corrosion products is poor, and the black pitting holes in the corrosion product film indicate that pitting corrosion has occurred. The EDS test results on the surface of the substrate are shown in Figure 9d. After 20 days of immersion, the surface of the substrate is mainly Fe, O, C, Mn and Cu, with the highest content being that of Fe, and a small amount of Cr, Co and Ni are also detected. It can be seen from Figure 9e, which indicates the corrosion mechanism here is mainly crevice corrosion, that there are many black cracks on the matrix of corrosion products after 40 days of immersion. Crevice corrosion is a strong localized corrosion of a metal surface immersed in seawater (or other corrosive media), often occurring in crevices. The principle of crevice corrosion is similar to pitting corrosion. The anode is in the crevice, and the cathode is in the large area outside the crevice, thus forming the corrosion battery. Cl can be enriched and H+ can be formed in the crevices, reducing the pH value. The crevice corrosion is mainly due to the existence of gaps, leading to dielectric inhomogeneity caused by the media. The EDS test results on the surface of the substrate are shown in Figure 9f. After 40 days of immersion, the surface of the substrate is mainly Fe, O, C, Mn and Cu, and a small amount of Cr, Co, Ni and Na can also be detected. Figure 9g shows the SEM of the sample substrate after 80 days of immersion. It can be seen that the corrosion products on the surface of the matrix are of poor continuity, where black holes and fine cracks appear in the corrosion products. This shows that pitting and crevice corrosion occur with the increase in corrosion time. The EDS test results on the surface of the substrate are shown in Figure 9h. After 80 days of immersion, Fe, O, C and Mn are the main parts of the surface of the substrate. A small amount of Cr, Co and Ni are detected because the EDS energy spectrum just hits the matrix, and is not affected by the corrosion products, and the seawater composition is not detected.
Figure 10 shows the SEM and EDS of the cross section of the sample matrix after immersion in natural seawater for different total immersion durations, which removed the rust layer on the surface of the sample. As shown in Figure 10a, a continuous inner rust layer was formed after 20 days of corrosion. The uniformity of the rust layer is poor, and some areas show pitting morphology. The EDS test is carried out on the cross section of the matrix shown in Figure 10b. The test results show that little Cl is detected in the inner area of the rust layer, which indicates that the content of Cl in the rust layer near the substrate is very low, the rust layer has a protective effect, and the content of Ca2+ is high. Figure 10c shows the SEM of the cross section of the sample matrix after 40 corrosion days. It can be seen that the continuous inner rust layer has been formed on the sample surface and the uniformity of the rust layer is poor. Meanwhile, the flake corrosion products and obvious pitting pits can be observed in some areas. The EDS test results on the cross section of the matrix are shown in Figure 10d. The EDS results show that Ca2+ content detected inside the rust layer is high, which may be caused by the deposition of salt in seawater on the surface of the corrosion products. The content of Cl compared with that of 20 corrosion days is increased. Figure 10e shows that the rust layer on the surface of the sample is still discontinuous after 80 days of corrosion, and there are obvious cracks separating the rust layer, which is caused by crevice corrosion. The EDS test results are shown in Figure 10f. Ca2+ and O2+ are detected in the inner area of rust layer after 80 days of corrosion, and Cl is also detected, which is lower than that of 40 days of immersion and higher than that of 20 days of immersion.
SEM and EDS were used to observe and analyze the rust layer on the surface of the sample after 20 days of total immersion corrosion in seawater. it is found that the corrosion products are mainly laminated with poor continuity. There are black holes in the corrosion product film, which indicates that pitting corrosion is the main corrosion mechanism. After 40 full days of immersion, the corrosion products are laminated and reticulated, and there are still black holes in the corrosion products. The samples show slight cracks, which indicates that the corrosion mechanism is mainly pitting corrosion, accompanied by a small amount of crevice corrosion. After 80 days of corrosion, obvious cracks appear on the surface of the sample, which is the starting point of crevice corrosion. Local corrosion, such as pitting and crevice corrosion, occurs easily in seawater due to the local failure of passivation. Through the EDS analysis of the cross section of the matrix, it can be seen that Ca2+ appears on the surface of the matrix, and the content of Ca2+ is high, which may be caused by salt deposition on the surface of the corrosion products in seawater. At the same time, a very small amount of Cl appears, indicating that the rust layer still has a protective effect, preventing Cl penetration, and the corrosion layer is relatively stable.

4. Conclusions

In this paper, electrochemical corrosion tests and the full immersion corrosion experiments were performed in seawater at room temperature to investigate the electrochemical corrosion behavior and the corrosion mechanism of high-strength EH47. The main conclusions obtained by the analyses are as follows:
  • With an increase in immersion time, the open circuit potential of EH47 decreases and then increases, with the minimum at 28 days of immersion.
  • With an extension in immersion time, the corrosion current density (Icorr) of EH47 steel first decreases and then increases, with the minimum at 28 days of immersion. Furthermore, the arc radius of the 28 days of immersion sample is the largest, which indicates that the impedance is the largest, the corrosion rate is the smallest and the corrosion resistance is good.
  • The corrosion products of EH47 steel after immersion in seawater are mainly composed of FeOOH, Fe3O4 and Fe2O3 phases.
  • The corrosion mechanism of EH47 steel in the initial stage of corrosion is mainly pitting corrosion, and furthermore, the corrosion mechanism is mainly pitting corrosion with a small amount of crevice corrosion with increased corrosion time.

Author Contributions

Conceptualization, H.Z. and L.Y.; methodology, H.Z.; software, Y.Z. and F.A.; validation, Z.J., L.Y. and H.Z.; formal analysis, H.Z.; investigation, Y.Z., Y.L. and F.A.; writing—original draft preparation, H.Z. and Y.Z.; writing—review and editing, H.Z., Z.J. and H.L.; project administration, F.A. and Y.L. All authors have read and agreed to the published version of the manuscript.

Funding

This research was funded by the State Key Laboratory of Metal Material for Marine Equipment and Application—University of Science and Technology Liaoning co-project (No. SKLMEA-USTL 2017010) and (No. HGSKL-USTLN(2019)05).

Data Availability Statement

Data presented in this article are available at request from the corresponding author.

Conflicts of Interest

The authors declare no conflict of interest.

References

  1. Xiao, Q.Y.; Wu, X.G. Corrosion and Protection Technology of Ships; Harbin Engineering University Press: Harbin, China, 2012; pp. 102–133. [Google Scholar]
  2. Ping, Y. Research on the evaluation method and requirements of the corrosion state of ship structure. Ships 2010, 4, 16–19. [Google Scholar]
  3. Sun, B.L.; Cao, J.; Si, T.Z.; Zhang, Q.A. Electrochemical corrosion behavior of rusted NSB steel in Simulated Seawater. Anhui Univ. Technol. 2013, 30, 124–128. [Google Scholar]
  4. Zou, Y.; Wang, J.; Zheng, Y.Y. Electrochemical techniques for determining corrosion rate of rusted steel in seawater. Corros. Sci. 2011, 53, 208–216. [Google Scholar] [CrossRef]
  5. Wang, H.W.; Zhou, P.; Huang, S.W.; Chi, Y. Corrosion mechanism of low alloy steel in NaCl solution with CO2 and H2S. Int. J. Electrochem. Sci. 2016, 11, 1293–1309. [Google Scholar]
  6. Han, E.H.; Chen, J.M.; Su, Y.J. Corrosion and Protection of Marine Engineering Materials and Structures; Chemical Industry Press: Beijing, China, 2017; pp. 304–382. [Google Scholar]
  7. Prakashaiah, B.G.; Vinaya Kumara, D.; Anup Pandith, A.; Nityananda Shetty, A.; Amitha Rani, B.E. Corrosion inhibition of 2024-T3 aluminum alloy in 3.5% NaCl by thiosemicarbazone derivatives. Corros. Sci. 2018, 136, 326–338. [Google Scholar] [CrossRef]
  8. Lebrini, M.; Lagrenée, M.; Vezin, H.; Gengembre, L.; Bentiss, F. Electrochemical and quantum chemical studies of new thiadiazole derivatives adsorption on mild steel in normal hydrochloric acid medium. Corros. Sci. 2005, 47, 485–505. [Google Scholar] [CrossRef]
  9. Chen, X.Q.; Chang, W.S.; Chen, D.B. Study on the law and characteristics of pitting corrosion induced by inclusions in carbon steel. J. Nav. Acad. Eng. 2004, 16, 30–36. [Google Scholar]
  10. Sazou, D.; Pavlidou, M.; Pagitsas, M. Potential oscillations induced by localized corrosion of the passivity on iron in halide-containing sulfuric acid media as a probe for a comparative study of the halide effect. J. Electroanal. Chem. 2012, 675, 54–67. [Google Scholar] [CrossRef]
  11. Usman, B.J.; Umoren, S.A.; Gasem, Z.M. Inhibition of API 5L X60 steel corrosion in CO2 -saturated 3.5% NaCl solution by tannic acid and synergistic effect of KI additive. J. Mol. Liq. 2017, 237, 146–156. [Google Scholar] [CrossRef]
  12. Deyab, M.; Mohamed, N.H.; Moustafa, Y. Corrosion protection of petroleum pipelines in NaCl solution by microcrystalline waxes from waste materials: Electrochemical studies. Corros. Sci. 2017, 122, 74–79. [Google Scholar] [CrossRef]
  13. Yang, S.C.; Bi, H.J.; Niu, S.R.; Jin, S.T.; Shen, K. Effect of temperature and Cl~-mass fraction on pitting corrosion resistance of 304 stainless steel. J. Lanzhou Univ. Technol. 2010, 36, 5–9. [Google Scholar]
  14. Xia, J.M.; Li, Z.Y.; Jiang, J.C.; Wang, X.Q.; Zhang, X.D. Effect of Flow Rates on erosion corrosion behavior of hull steel in real seawater. Int. J. Electrochem. Sci. 2021, 16, 1–13. [Google Scholar]
  15. Jia, C.Y.; Niu, J.Q.; Liu, D.S. Research on marine atmospheric corrosion resistance of ship plate steel. Shanghai Met. 2013, 35, 26–30. [Google Scholar]
  16. Melchers, R.E.; Jeffrey, R. Early corrosion of mild steel in seawater. Corros. Sci. 2005, 47, 1678–1693. [Google Scholar] [CrossRef]
  17. Soares, C.G.; Garbatov Zayed, Y. Effect of environmental factors on steel plate corrosion under marine immersion conditions. Corros. Eng. Sci. Technol. 2011, 46, 524–541. [Google Scholar] [CrossRef]
  18. Panayotova, M.; Garbatov, Y.; Guedes, S.C. Factors Influencing Atmospheric Corrosion and Corrosion in Closed Spaces of Marine Steel Structural. In Proceedings of the 7th International Conference on Marine Science and Technology, Varna, Bulgaria, 7–9 October 2004; Union of Scientists of Varna: Varna, Bulgaria, 2004. [Google Scholar]
  19. Li, G.M.; Chang, W.S.; Chen, X.Q. Study on simulated pitting corrosion test method of carbon steel and low alloy steel. Mater. Dev. Appl. 2008, 3, 40–42. [Google Scholar]
  20. Gan, Y.; Li, Y.; Lin, H.C. Laboratory simulation of local corrosion process of low alloy steel in seawater. J. Corros. Protec. 2001, 21, 82–87. [Google Scholar]
  21. Wang, J.M.; Chen, X.Q.; Li, G.M. Comparison of pitting corrosion resistance of two kinds of marine low alloy steels. J. Corros. Protec. 2005, 25, 356–360. [Google Scholar]
  22. Cao, G.L.; Li, G.M.; Chen, S.; Chang, W.S.; Chen, X.Q. Comparison of pitting corrosion resistance of Ni and Cr in typical seawater corrosion resistant steels. Acta Metal. Sin. 2010, 46, 748–754. [Google Scholar] [CrossRef]
  23. Zhang, Y.C.; Chen, X.Q.; Chen, D.W.; Li, G.M.; Pan, R.Y. Pitting induced sensitivity and mechanism of different low carbon steels. J. Corros. Protec. 2001, 21, 265–272. [Google Scholar]
  24. Liu, W.; Wang, H.T.; Yang, H.Y.; Huang, G.Q. Compilation and standard interpretation of seawater corrosion test method for metallic materials. Environ. Technol. 2016, 34, 57–60. [Google Scholar]
  25. Song, S.Z. Corrosion Electrochemical Methods; Chemical Industry Press: Beijing, China, 1988; pp. 55–70. [Google Scholar]
  26. Cao, C.N.; Zhang, J.Q. Electrochemical Impedance Spectroscopy; Science Press: Beijing, China, 2002; pp. 46–88. [Google Scholar]
  27. Yang, S.W.; Chang, T.J. Corrosion and Protection of Materials; Harbin Engineering University Press: Harbin, China, 2003; pp. 102–108. [Google Scholar]
  28. Wu, H.; Li, Y.; Lu, Y.; Li, Z.; Cheng, X.W.; Hasan, M.; Zhang, H.M.; Jiang, Z.Y. Influences of load and microstructure on tribocorrosion behaviour of high strength hull steel in saline solution. Tribol Lett. 2019, 67, 1–12. [Google Scholar] [CrossRef]
  29. Sun, B.L. Electrochemical Corrosion Characteristics of Low-Carbon Alloy Steel under NaCl Solution. Master’s Thesis, Anhui University of Technology, Anhui, China, 2013. [Google Scholar]
  30. Zheng, L.Y.; Cao, F.H.; Liu, W.J. Electrochemical study on failure behavior of Q235 steel in simulated natural environment. Equip. Environ. Eng. 2011, 8, 8–15. [Google Scholar]
  31. Liang, C.F.; Hou, W.T. Study on atmospheric exposure corrosion of low carbon alloy steel and low alloy steel for 16 years. J. Corros. Protec. 2005, 25, 2–6. [Google Scholar]
  32. Sherif El-Sayed, M.; Almajid, A.A. Electrochemical corrosion behavior of API X-70 5L grade steel in 4.0 wt.% sodium chloride solutions after different immersion periods of time. Int. J. Electrochem. Sci. 2015, 10, 34–45. [Google Scholar]
  33. Han, P.; Han, P.J.; Xie, R.Z.; Bin, H.; Bai, X.H. Study of the electrochemical corrosion behaviour of X70 steel in H2SO4 contaminated silty soil. Int. J. Electrochem. Sci. 2018, 13, 8694–8710. [Google Scholar] [CrossRef]
  34. Peng, X. Corrosion Electrochemical Behavior and Correlative Parameters of Rusty Carbon Steels in Seawater Environment. Master’s Thesis, Ocean University of China, Qingdao, China, 2013. [Google Scholar]
  35. Dai, N.; Zhang, L.C.; Zhang, J.X.; Chen, Q.M.; Wu, M.L. Distinction in corrosion resistance of selective laser melted Ti-6Al-4V alloy on different planes. Corros. Sci. 2016, 111, 703–720. [Google Scholar] [CrossRef] [Green Version]
  36. Yan, Z.W.; Yuan, X.J.; Tan, Z.J.; Tang, M.Q.; Feng, Z.Q. Effect of in situ ion nitridetreatment on the corrosion behavior of titanium. Int. J. Electrochem. Sci. 2018, 13, 353–361. [Google Scholar] [CrossRef]
  37. Sun, L.L. Mechanism of Q235 Steel and Stainless Steel in Seawater. Master’s Thesis, Shandong University, Shandong, China, 2010. [Google Scholar]
Figure 1. (a) The surface of the original steel EH47; (b) surface EDS analysis of EH47 steel; (c) the optical micrograph before the immersion test of EH47 steel.
Metals 11 01317 g001
Figure 2. Open circuit potential of the EH47 steel sample immersed in seawater for different durations.
Metals 11 01317 g002
Figure 3. Potentiodynamic polarization curves of the EH47 samples immersed in seawater for different durations.
Metals 11 01317 g003
Figure 4. Nyquist diagrams of the EH47 sample immersed in seawater for different durations. Z′—real part of electrochemical impedance; Z″—imaginary part of electrochemical impedance.
Metals 11 01317 g004
Figure 5. Bode diagrams of EH47 samples immersed in seawater for different durations. (a) Bode diagram of phase angle versus frequency. (b) Bode diagram of Z versus frequency.
Metals 11 01317 g005
Figure 6. The equivalent circuit used for fitting the impedance data.
Metals 11 01317 g006
Figure 7. XRD pattern of the corrosion product of EH47 after full immersion in seawater for 49 days.
Metals 11 01317 g007
Figure 8. The OM microstructure of corrosion products of EH47 formed on the sample surface under different full immersion corrosion times: (a) 20 days, (b) 40 days, (c) 60 days, and (d) 80 days.
Metals 11 01317 g008
Figure 9. SEM and EDS diagram of the sample surface in which the rust layer was removed after different seawater immersion durations: (a) 20 day (500×); (b) 40 day (500×); (c) 20 days; (d) EDS (20 days); (e) 40 days; (f) EDS (40 days); (g) 80 days; (h) EDS (80 days).
Metals 11 01317 g009aMetals 11 01317 g009b
Figure 10. SEM and EDS diagram of a cross-section of sample substrate after different seawater immersion durations: (a) 20 days, (b) EDS (20 days), (c) 40 days, (d) EDS (40 days), (e) 80 days, (f) EDS (80 days).
Metals 11 01317 g010
Table 1. Results of fitting polarization curves of the EH47 sample immersed in seawater for different corrosion durations.
Corrosion Time (d)Corrosion Potential, vs. SCECorrosion Current Density (A/cm2)Passive Domain, vs. SCE
0−0.9151.444 × 10−4−0.8~−0.2
14−0.9341.107 × 10−4−0.8~−0.5
28−0.9248.093 × 10−5−0.8~−0.2
49−0.9951.030 × 10−4−0.9~−0.2
Table 2. Fitting parameters of EIS of different EH47 samples.
t(d)Rs/
(Ω·cm2)
Rct/
(Ω·cm2)
CPE1n1Rrust/
(Ω·cm2)
CPE2n2IE%
Y0/·Ω−1cm−2·s−nY0/·Ω−1cm−2·s−n
012120.00070.983800.00170.750
14880.00290.6016230.00200.8750
28191710.00150.7524580.00160.9392
4923900.00030.6611030.00190.9586
Publisher’s Note: MDPI stays neutral with regard to jurisdictional claims in published maps and institutional affiliations.

