Article

Modelling of Hot Flow Stress of Duplex Steel in Dependence of Microstructure Using the Rule of Mixture

Institute of Metal Forming, RWTH Aachen University, 52072 Aachen, Germany
*
Author to whom correspondence should be addressed.
Metals 2021, 11(8), 1285; https://doi.org/10.3390/met11081285
Submission received: 16 July 2021 / Revised: 6 August 2021 / Accepted: 11 August 2021 / Published: 15 August 2021

Abstract

:
The ferrite fraction and phase distribution of duplex steels depend strongly on the temperature evolution during hot deformation and are correlated to different mechanical behaviors during hot deformation as well as cold deformation. Therefore, the control of microstructure evolution during hot forming is relevant for target-oriented material design. In flow stress modelling for hot forming, the influence of microstructure beyond the ferrite fraction is often neglected. In the present work, a new method is demonstrated to also consider the influence of grain size in flow stress modelling. For this purpose, different initial microstructures with different ferrite fractions and phase distribution were tested in compression tests at 1100 °C and 0.1 s−1. The microstructure was analyzed before and after forming and it was observed that the differences in ferrite fractions vanished during the compression tests. Those microstructure data were used in a model including a rule of mixture and Hall–Petch relationship to extract the single-phase flow curves of ferrite and austenite. Based on the flow stress of the single phases, in combination with ferrite fraction and individual grain size, the flow curves of the different material conditions were calculated and the concurrent influence of ferrite fraction and phase distance on the mechanical behavior was discussed.

Graphical Abstract

1. Introduction

The combination of high strength and good corrosion resistance makes duplex stainless steels interesting materials for extreme environments, such as in chemical or oil/gas industries, offshore applications, subsea umbilicals, or pipelines in severe environmental conditions, such as desalination plants or in the sewage industry. The attractive mechanical and chemical properties are based on the chemical composition and the microstructure. Duplex steels provide a dual-phase matrix of around 50% delta ferrite and 50% austenite. In addition to the corrosion resistance and high strength, the high impact toughness at low temperatures is another outstanding proper of duplex stainless steels. However, it was shown by Haghdadi et al. [1] that the morphology of the same amount of austenite phase after different thermomechanical process routes, e.g., equiaxed, elongated or Widmanstätten-structure, results in different impact toughness at low temperatures below 0 °C. In the work of Iza-Mendia et al. [2] the influence of different microstructures in the as-cast and as-wrought condition on the mechanical behavior during hot forming was discussed. While in plane-strain compression tests both microstructures exhibit a similar stress-strain behavior, in torsion tests the yield stress deviates significantly due to the different orientations of elongated austenite grains toward the principal stress direction in both microstructures. These results highlight the importance of understanding the microstructure evolution of duplex steel during hot forming. In the past, most research was focused on characterizing the microstructural evolution of duplex steels and empirical modelling of hot flow curve characteristics such as the peak and saturation stress in dependence of temperature and strain rate. While the change in ferrite fraction is often considered by a rule of mixture, the impact of grain size and phase distribution is neglected in the flow curve modelling. In the present work, the characterized duplex steel exhibits a nonlinear correlation of ferrite fraction and peak stress in compression tests investigated at the same strain rate and test temperature. This strange behavior is comparable to the deviations in stress due to the phase orientation in the work of Iza-Mendia et al. [2] and can be attributed to various initial phase distributions in the present work. To cover this nonlinear stress behavior in the present work in addition to the ferrite fraction, the phase distribution should be taken into account in order to model the stress strain behavior.
During hot deformation, a duplex steel undergoes significant microstructure changes. Next to temperature activated processes such as dynamic recovery (DRC) and recrystallization (DRX), an additional factor is the change of ferrite and austenite phase fraction. Several authors have reported that ferrite fraction increases with the temperature [2,3,4]. Both phases, austenite and ferrite, show a different microstructural evolution during hot deformation. While in austenite conventional DRX occurs, the ferrite phase undergoes continuous DRX with a gradually increasing misorientation and distance of low angle boundaries [5]. The single-phase ferrite exhibits a higher ductility at high temperatures compared to austenite. This is caused by the DRC, with its annihilation of the dislocation density and the rearrangement into subgrain boundaries. As a result of this ongoing process, an equilibrium of the subgrain size occurs, which leads to a steady state in the flow stress value [6]. During hot forming, single-phase austenite undergoes dynamic recrystallization with significant flow stress reduction due to low resistance of new formed grains compared to the deformed microstructure [3]. While both single phases exhibit a good hot workability, their combination in a duplex microstructure leads to a decrease in ductility [3]. Due to the differences in stress, the strain accumulates in ferrite phase regions, while austenite is almost undeformed in the early stage of deformation [3]. Even at the end of the forming process, the strain distribution shows higher strains in ferrite than in austenite [7]. Due to the high strain accumulation in ferrite, a faster softening behavior of ferrite can be observed [8].
In a single-phase material, the grain size evolution and, consequently, the mechanical response of the material during hot deformation is dominated by hardening, recovery, recrystallization, and grain growth. In the case of a dual-phase material, the fraction and distribution of phases must also be taken into account for the calculation of the mechanical properties. In the literature, a rule of mixture is commonly used to calculate the strain, as well as the stress partitioning of duplex steels based on single phases. In general, a stress and strain partitioning according to Equations (1) and (2) is used:
σ D = f δ * σ δ + ( 1 f δ ) * σ γ
with the volume fraction of ferrite f δ and the stress of single-phase ferrite σ δ and austenite σ γ . Accordingly, the strain can be divided in the parts of both single phases:
ε D = f δ * ε δ + ( 1 f δ ) * ε γ
with ε δ and ε γ being the micro-strains in the single phases and ε D being the macro-strain of the duplex material. This rule of mixture was validated for cold forming of a 1.4507 (AISI F255) super duplex steel by Cho et al. [9] using measurements of micro-strains in ferrite and austenite and calculated stress-strain curves of ferrite and austenite single phase based on Ashby’s one-parameter theory. For hot deformation, the rule of mixture was used by Zhao et al. [8] to estimate the stress-strain partitioning coefficient at a total strain of 0.25, which indicates the degree of stress transfer from soft ferrite to hard austenite. The partitioning coefficient increases with the deformation temperature, which means that strain at high temperatures is more homogenously distributed between both phases. In addition, the higher ferrite fraction in one of the characterized materials leading to a higher partitioning coefficient and, therefore, a more homogenous strain distribution.
There are several authors investigating the kinetics of hot deformation flow curves of duplex steels showing dynamic recrystallization (DRX) with a classical peak and steady state stress; thereby, the characterization is either done directly at the duplex microstructure or at single-phase microstructures. In these cases, a DRX model for single austenite and ferrite is determined. In general, the classical hyperbolic sine equation with the Zener–Hollomon parameter Z is used to describe the relation of peak stress σ p   or steady-state stress σ s during hot deformation, test temperature T , and strain rate   ε ˙ :
Z = A [ sinh ( α σ i ) ] n = ε ˙   exp ( Q R T ) ,
with A and n being constants, α the inverse of the stress associated with power-law breakdown, Q the activation energy for hot working, and R the universal gas constant. Cabrera et al. [10] investigated the parameters of this function for two duplex steels with different nitrogen content, i.e., 1.4462 (AISI F51/AISI F60) and 1.4410 (AISI F53), to describe the relations among steady-state stress, temperature and strain rate. The parameters, such as activation energy, were estimated with steady-state stresses from the dual phase material. Hence, it is mentioned that this activation energy is a kind of weighted average of the activation energies of each phase, including an additional term that accounts for the synergistic effect arising from the interactive deformation between the two phases. Farnoush et al. [4] and Momemi et al. [11] estimated the parameters of Equation (3) for a stainless duplex steel, 1.4462 (AISI F51), as well as for the single-phase materials for the steady state stress. Based on these parameters for the corresponding three different microstructure conditions, the strain rates of the single phases were calculated for the steady state stress. With the implementation of the rule of mixture for the strain rates, it was possible to estimate two strain interaction coefficients for the strain in austenite and ferrite. Their work showed that both interaction coefficients are related to the Zener–Hollomon parameter, and show a physically reasonable evolution with temperature and strain rate, which is in alignment with experimentally observed phase transformation of ferrite to austenite at lower hot forming temperatures.
While most authors use the empirical approach of Zener–Hollomon to calculate the correlation between characteristic stress values, e.g., peak stress or steady state stress, and strain rate, as well as temperature, the calculation of a complete stress-strain curve needs additional modelling, which calculates the evolution of stress with strain. For example, Momemi et al. [12] extended their model to describe the strain rate and temperature dependence of peak- and steady-state stress with an additional strain dependency. This means parameters such as activation energy, stress exponent, and other constants have to be determined in dependence of the strain. With the help of this modification, whole flow curves could be calculated with Equation (3). Another investigation on the dual-phase material 1.4462 (AISI F51) as well as single-phase austenite and ferrite was performed by Spigarelli et al. [3]. The activation energy used to describe the dependence of peak stress on temperature and strain rate within the Zener–Hollomon relationship was detected to be higher for the duplex steel compared to the single phases of austenite and ferrite at the same temperature. It is assumed that the reason for this is the increasing of the soft ferrite fraction caused by increasing the temperature. An empirical model to calculate the stress-strain curve until the peak-stress for ferrite and austenite was developed and validated with experimental duplex curves. It takes into account the localized strain, as well as changing the strain rate in the single phases, and also uses the rule of mixture. The drawback of this method is that the softening due to recrystallization of austenite is neglected. Haghdadi et al. [13] used the Zener–Hollomon relationship to describe the peak stress as well as the steady-state stress of an 1.4162 lean duplex steel for different temperatures and strain rates. The parameters were estimated at the dual-phase material. The hardening behavior between yield stress and peak stress is calculated by a physically based Kocks–Mecking approach, using the evolution of dislocation density during plastic deformation. To also consider the softening due to dynamic recrystallization, the authors added an Avrami model to calculate the stress evolution between peak stress and steady-state stress. Compared to other models, this model has the advantage that a full curve for hot deformation, considering the physical hardening and recrystallization phenomena, can be calculated.
While the model of Haghdadi [13] already considers recrystallization during hot deformation to calculate the stress, the main drawback is that neither phase transformations nor changes in grain sizes were considered in this model and, therefore, it is limited to a simplified thermomechanical process chain and no extrapolation to other initial microstructures is possible. The Hall–Petch relationship was used by Siegmund et al. [14] to calculate the yield stress of single-phase ferrite and austenite for different temperatures based on the yield strength of polycrystals with infinite grain size at room temperature. With increasing temperature, the contribution of the grain size strengthening seems to decrease until yield strength of both phases over 600 °C is close to the same, with ferrite being slightly harder than austenite. At room temperature, the ferrite phase will be much harder than the austenite, which means that the yield stress vs. temperature curves of both phases cross each other, close to a temperature of 600 °C. This drop in yield strength at temperatures above 600 °C for ferrite is named Hall–Petch breakdown by Schneibel et al. [15].
When summarizing the work of other authors, it is apparent that there are many investigations into the strain rate and temperature dependency of stress behavior of duplex steels. Concerning the influence of microstructure, most authors limit research to the change in ferrite fraction with temperature. Few authors demonstrate models to cover a whole flow curve that includes softening due to DRX. Therefore, the aim of the present work is to introduce a method for calculating hot flow curves of duplex steel in dependence of different initial microstructures. In that sense, not only the ferrite fraction is considered as a parameter of the microstructure, but also the phase distribution of ferrite and austenite.

2. Materials and Methods

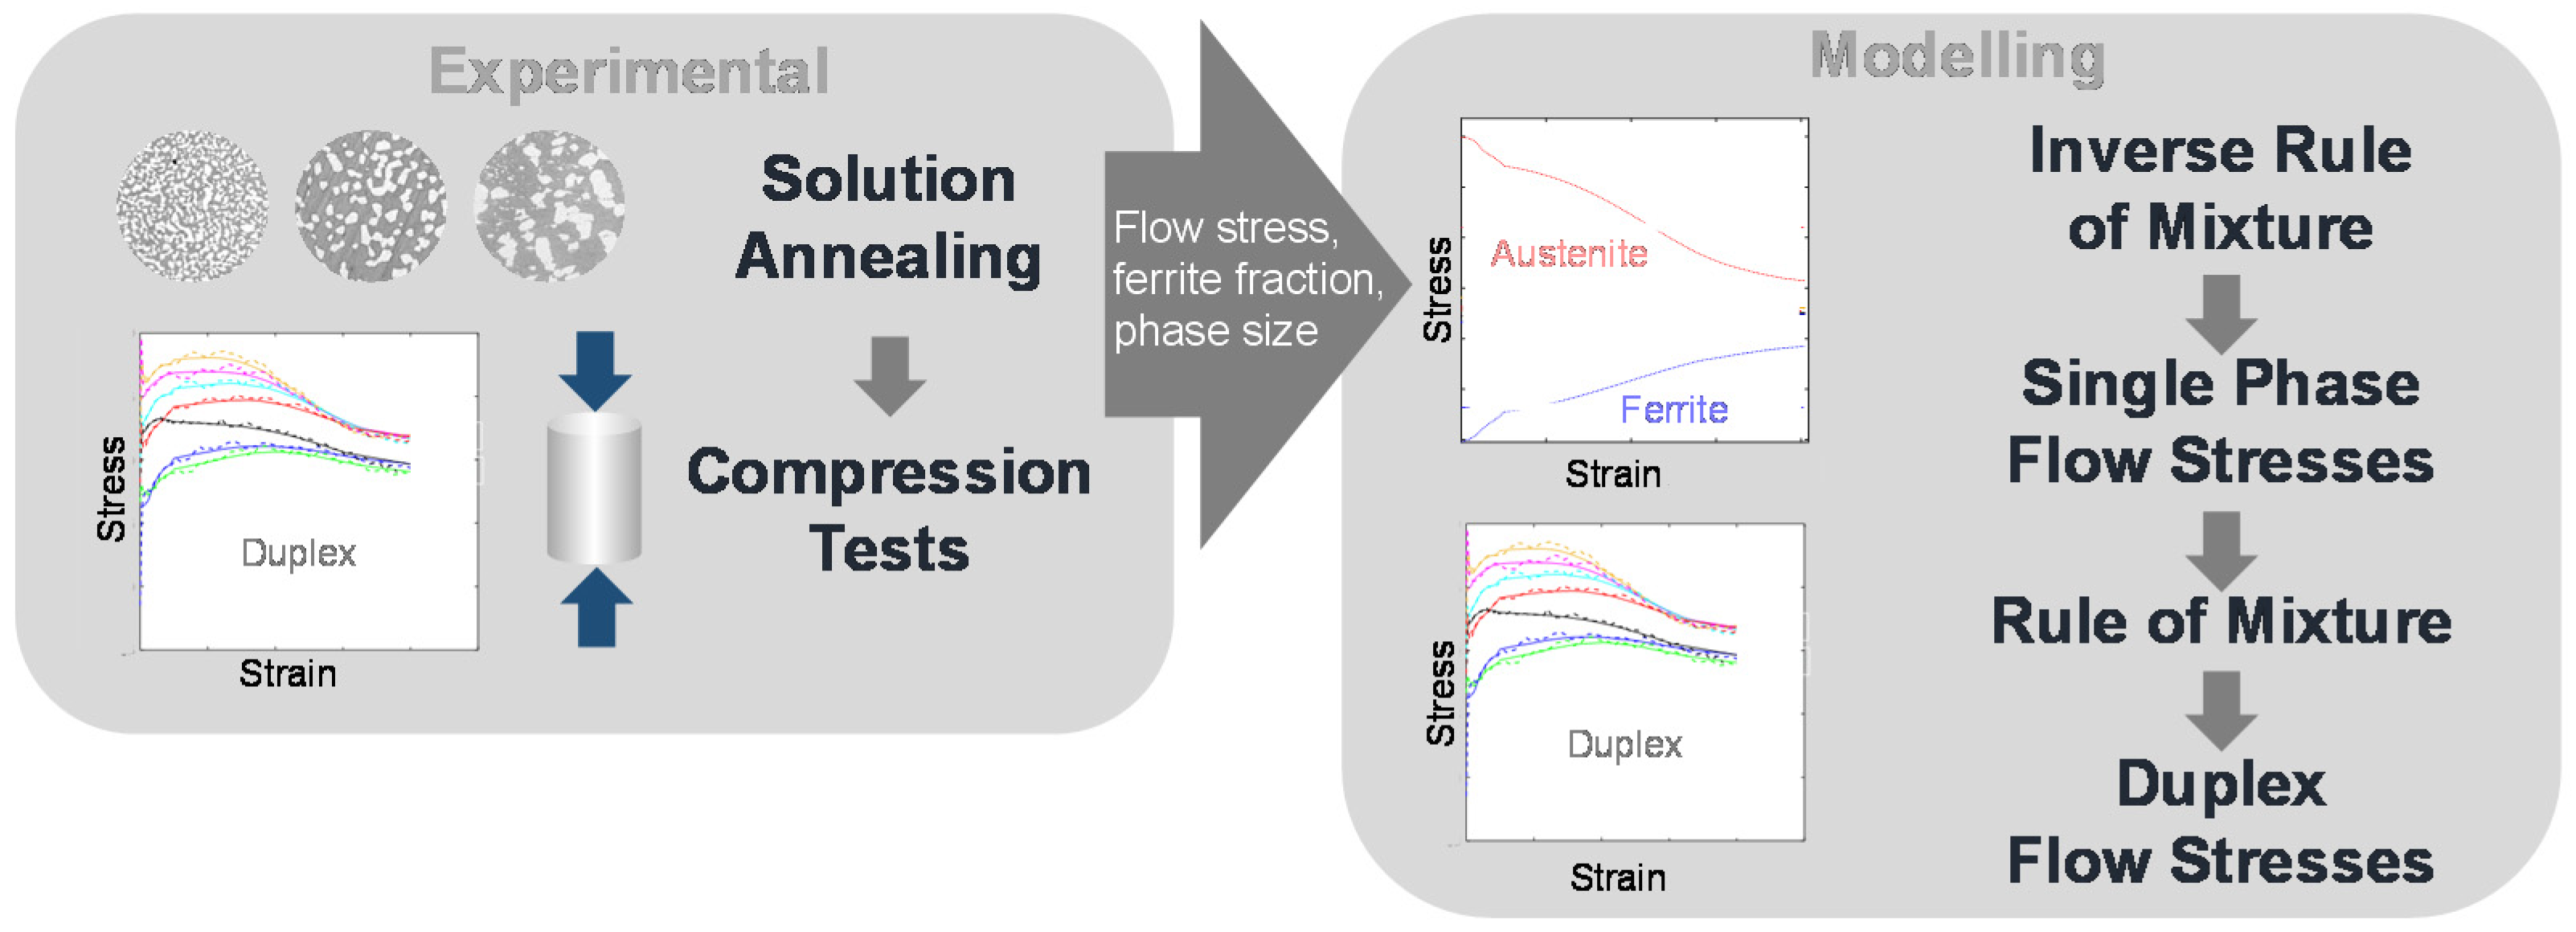
The present work investigates the influence of phase fraction and phase distribution on flow stress at one single strain rate and temperature via compression tests. A schematic overview of the methods used is given in Figure 1. Within the experimental part of the present work, different microstructures were produced by solution annealing and quenching. With these microstructures, compression tests at 1100 °C and 0.1 s−1 were performed. The ferrite fraction and mean phase distance of the different microstructures were analyzed before and after the compression tests. Within the modelling part of the present work, a model is derived to map the influence of the microstructure on the flow stress. The microstructure data before and after tests were used in this model, including the rule of mixture and Hall–Petch relationship, to extract the single-phase flow curves of ferrite and austenite from the measured duplex flow curves. Based on the flow stress of the single phases in combination with the ferrite fraction and individual mean phase distances, the corresponding flow curves of the different microstructures were calculated and the concurrent impact of the ferrite fraction and the mean phase distance on the mechanical behavior is discussed.
The Duplex steel used in the present work was the 1.4462 (AISI F51) with the chemical composition given in Table 1. A hot worked steel bar with a diameter of 18 mm was used as starting material for the experiments; therefore, all samples were taken in a longitudinal direction. This material was delivered in the solution annealed condition and represents semi-finished bar material, as it is often used for the forging of complex parts for oil and gas industry. The forging procedure of these parts consists of a pre-heating to high temperatures, upsetting, forging and several reheating steps. In this procedure, the austenite-ferrite ratio varies for each forging step. To characterize the different ratios of austenite and ferrite, the material was solution-annealed at different temperatures for 1 h and quenched in water to stabilize the austenite-ferrite ratio. Afterwards compression tests at 1100 °C and 0.1 s−1 were performed at a servo-hydraulic press to measure the stress-strain response.
In order to disregard friction effects, Rastegaev sample geometry [16] and a glass lubricant were used. The samples were heated, rising from room temperature to 1100 °C during pre-heating of 3 min or 5 min before the compression test started. The compression tests took 2–8 s depending on the final degree of deformation. After the tests, the samples were quenched in water within 10 s to avoid any further microstructural changes. Flow curves were determined from the compression test data by using a compensation technique for elastic deformations [
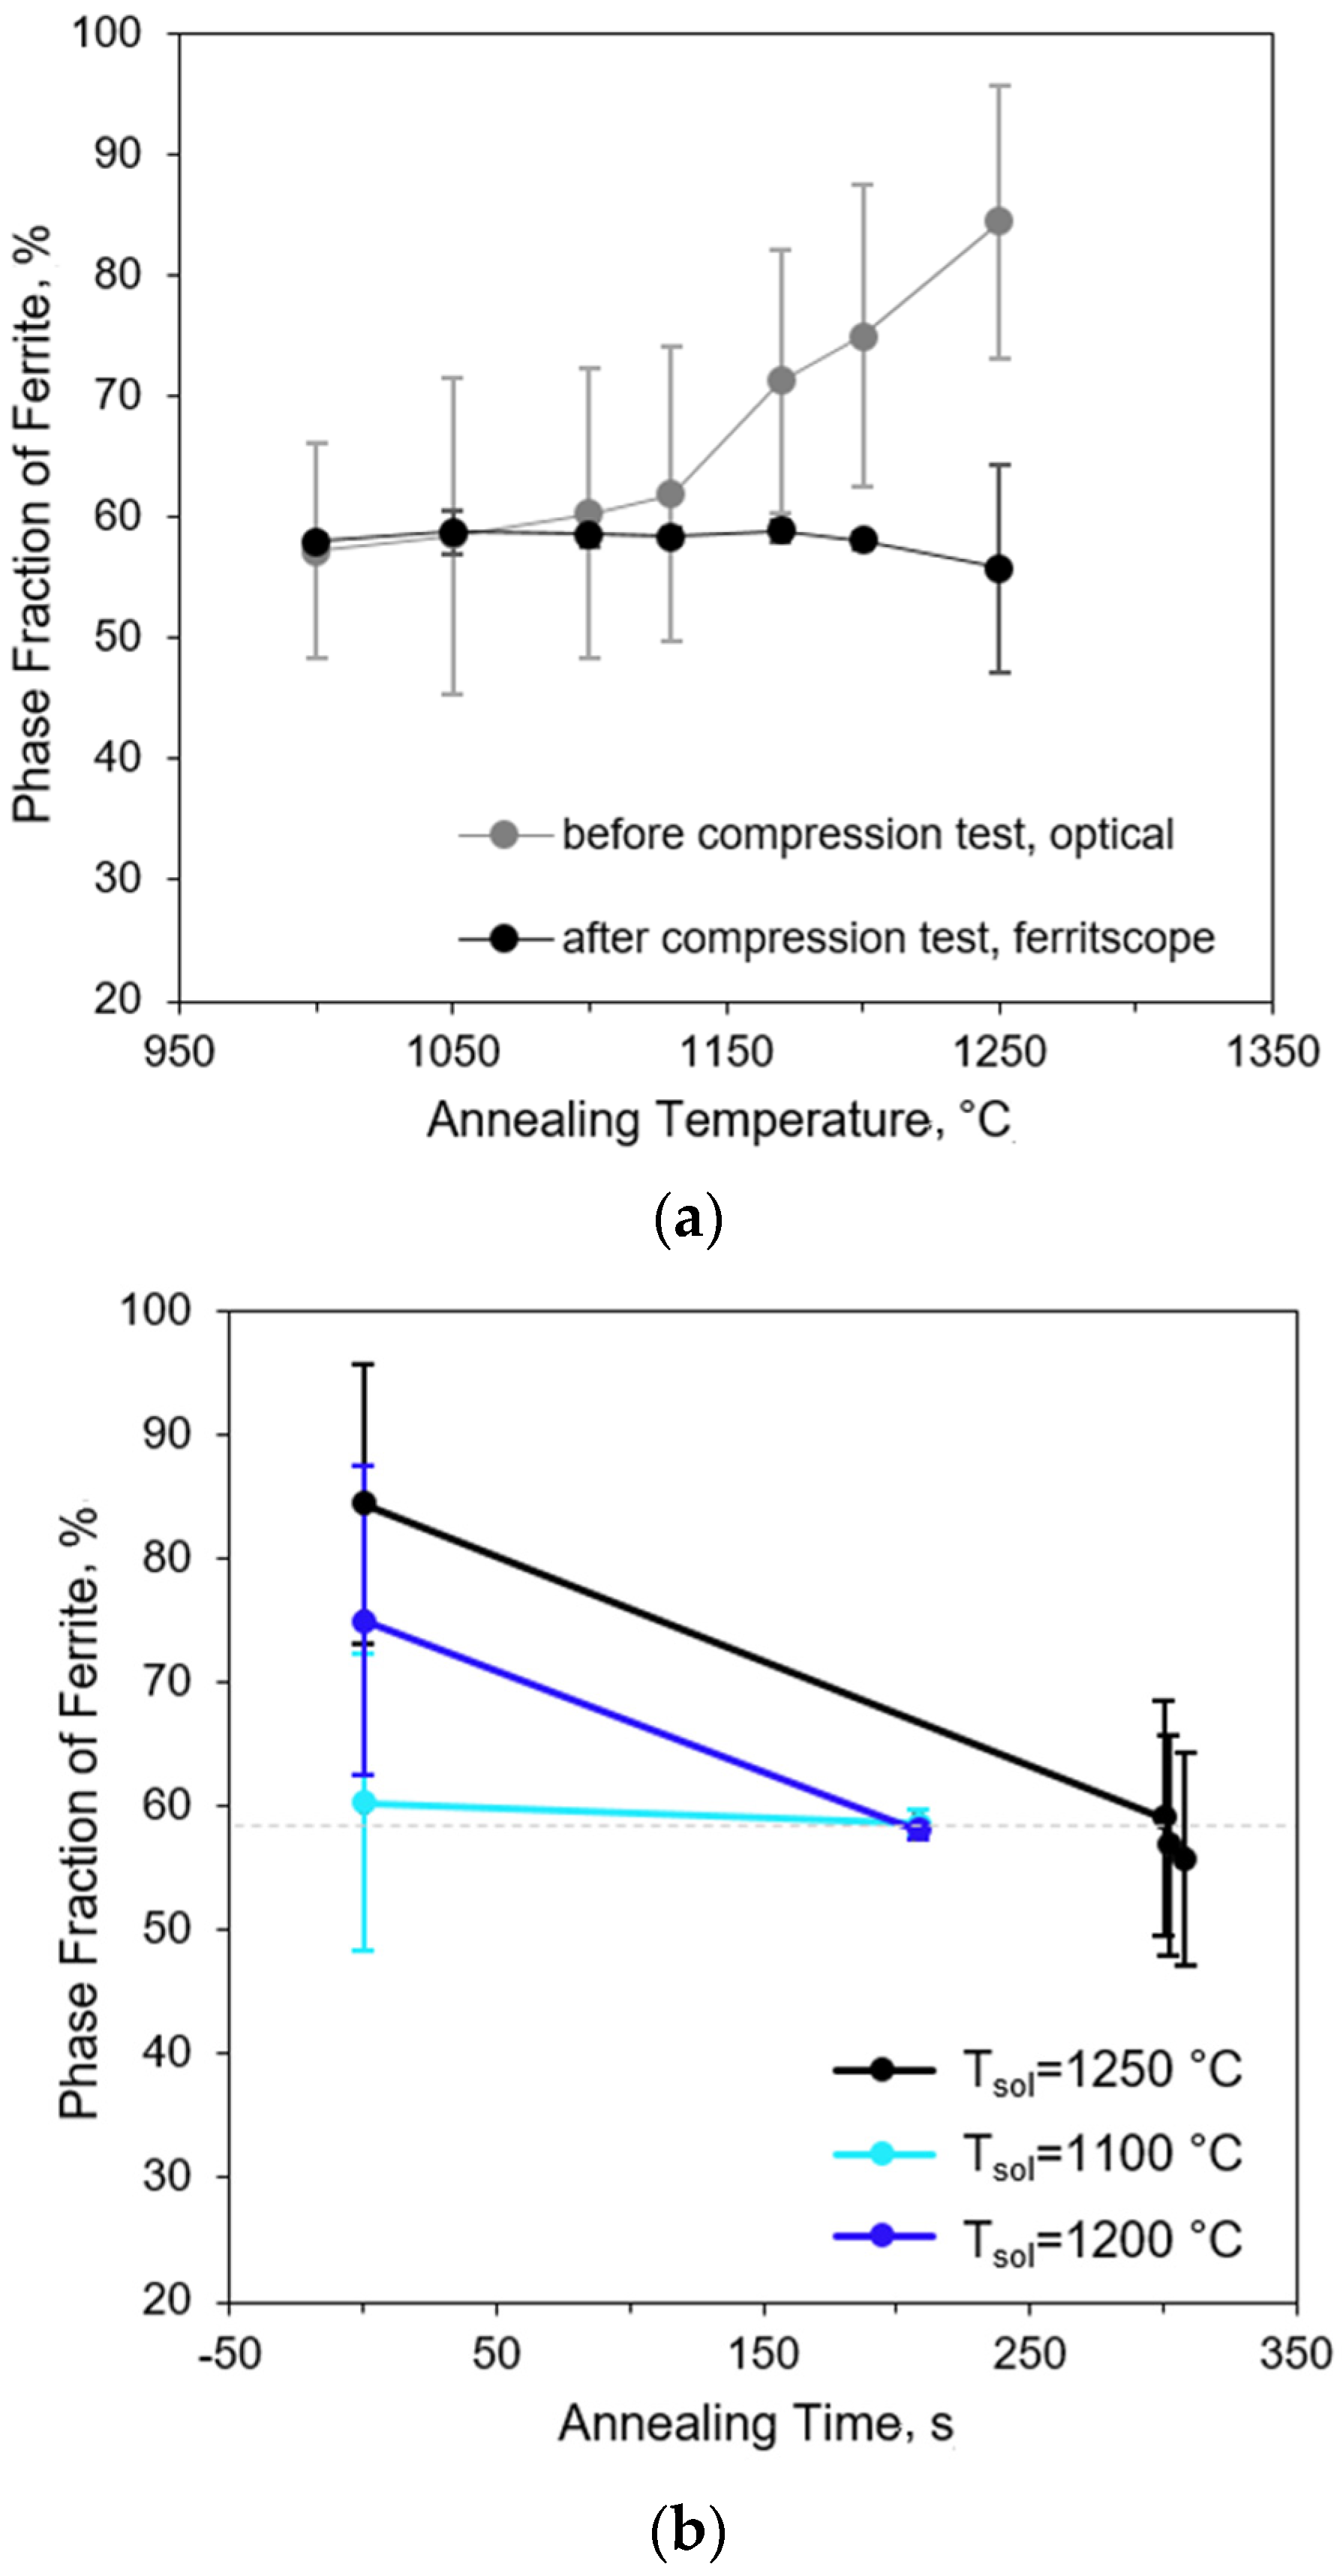
16]. The samples for metallographic analysis were electrolytically etched in 20% NaOH for 12 s and 2.5 V. Two methods were used to measure the ferrite volume fraction. The volume fraction before the compression test was measured by the metallographic point counting method according to ASTM E 562. After the compression tests the volume fraction of ferrite, except the material condition after 1250 °C solution annealing, was measured in the center of the sample with the help of a Fischer FERTISCOPE ® MP30 (Fischer, GER). Instead of a grain size, the mean phase distance was measured, due to the fact that only phase boundaries are visible with the used etching method. The mean phase distance as one mean value for ferrite and austenite was also measured by the line section method, which also included fine austenite clusters in the determination of the mean value.
For the modelling of the hot flow curve of the duplex steel, a new method was evolved within the present work. It was assumed that a basic ferrite and austenite single-phase flow curve for the boundary conditions 1100 °C and 0.1 s−1 can be used within the rule of mixture in addition to the Hall–Petch relationship to cover the different measured flow curves observed in experiments.
The influence of the ferrite-austenite ratio on the flow stress is considered in the commonly used stress partitioning of Equation (1). For reasons of simplification, the application of the strain partitioning is not considered to date.
The influence of grain size on the flow stress is considered by the Hall–Petch relationship. Regarding the Taylor law, the mean free path for dislocation glide defines the strength of a material. In addition, the grain size contributes to the limits of this mean-free path. According to this, the Hall–Petch equation is often used to describe the effect of grain size to the material strength empirically:
σ   = σ 0 + k d
with basic strength, e.g., solid solution strength σ 0 , as well as the mean grain size d and the Hall–Petch parameter k . Equations (1) and (4) can be combined to consider a variable grain size also in the stress partitioning:
σ D = f δ * ( σ δ , 0 + k δ d δ ) + ( 1 f δ ) * ( σ γ , 0 + k γ d γ )
Due to recrystallization or phase transformation during hot deformation, the grain size of ferrite and austenite can change significantly. In the present work the values of k δ , R T = 225   MPa µ m and k γ , R T = 503   MPa µ m were used as room temperature constants, according to Siegmund et al. [14]. Due to the assumption of Hall–Petch breakdown in the present work, k i , 1100 ° C was chosen much lower than the room temperature parameters. The ratio of both Hall–Petch parameters was chosen to be k δ , 1100 ° C / k y , 1100 ° C = 0.5 .
For the estimation of the single-phase flow curve from the duplex flow curve, two flow curves with different ferrite volume fractions are necessary. Equation (5) is set up for two different ferrite-austenite ratios,   f δ 1 and f δ 2 , and transferred to calculate the basic strength of ferrite σ δ , 0 . The first one of f δ 1 is given as an example:
σ δ = σ D , f δ 1 ( 1 f δ 1 ) * σ γ f δ 1
And including the Hall–Petch effect in Equation (6):
σ δ , 0 = σ D , f δ 1 ( 1 f δ 1 ) * ( σ γ , 0 + k y d f y 1 ) f δ 1 k δ d f δ 1
Assuming that the single-phase material response is always the same depending on the test temperature and the strain rate, the changing ferrite fraction should not influence the stress-strain behavior of the single ferrite phase. In this case σ δ , 0 calculated from σ D , f δ 1 must be the same, which is calculated from σ D , f δ 2 in Equation (7). Therefore, Equation (7) can be used on both sides of the equals sign for f δ 1 and f δ 2 :
σ D , f δ 1 ( 1 f δ 1 ) * σ γ f δ 1 k δ d f δ 1 = σ D , f δ 2 ( 1 f δ 2 ) * σ γ f δ 2 k δ d f δ 2
From this comparison, an equation for the estimation of σ γ , 0 can be derived:
σ γ , 0 = k δ d f δ 1 k δ d f δ 2 σ D , f δ 1 f δ 1 + σ D , f δ 2 f δ 2 + ( 1 f δ 1 ) * k γ d f γ 1 ( 1 f δ 2 ) * k γ d f γ 2 ( ( 1 f δ 2 ) f δ 2 ( 1 f δ 1 ) f δ 1 )
With the help of Equations (7) and (9), the basic flow stresses can be calculated with a variable combination of volume fractions of ferrite for every strain increment of two experimental flow curves σ D , f δ 1 and σ D , f δ 2 . At this point, the strain partitioning is neglected, therefore the resulting flow curves are not comparable to experimental flow curves of the single phases at this state of the model. This means that only the stress partitioning is considered. From a couple of combinations of different volume fractions, the basic flow curves of ferrite and austenite can each be averaged to achieve two mean flow curves with a wider range of validity. Material condition combinations of samples solution annealing at 1000 °C & 1170 °C, 1000 °C & 1200 °C, as well as 1050 °C & 1200 °C were used to calculate the different basic flow curves. The material conditions after the annealing at 1100 °C, 1130 °C, and 1250 °C were not used to calculate the basic flow curves of austenite and ferrite and can, therefore, be used for the validation of the model.
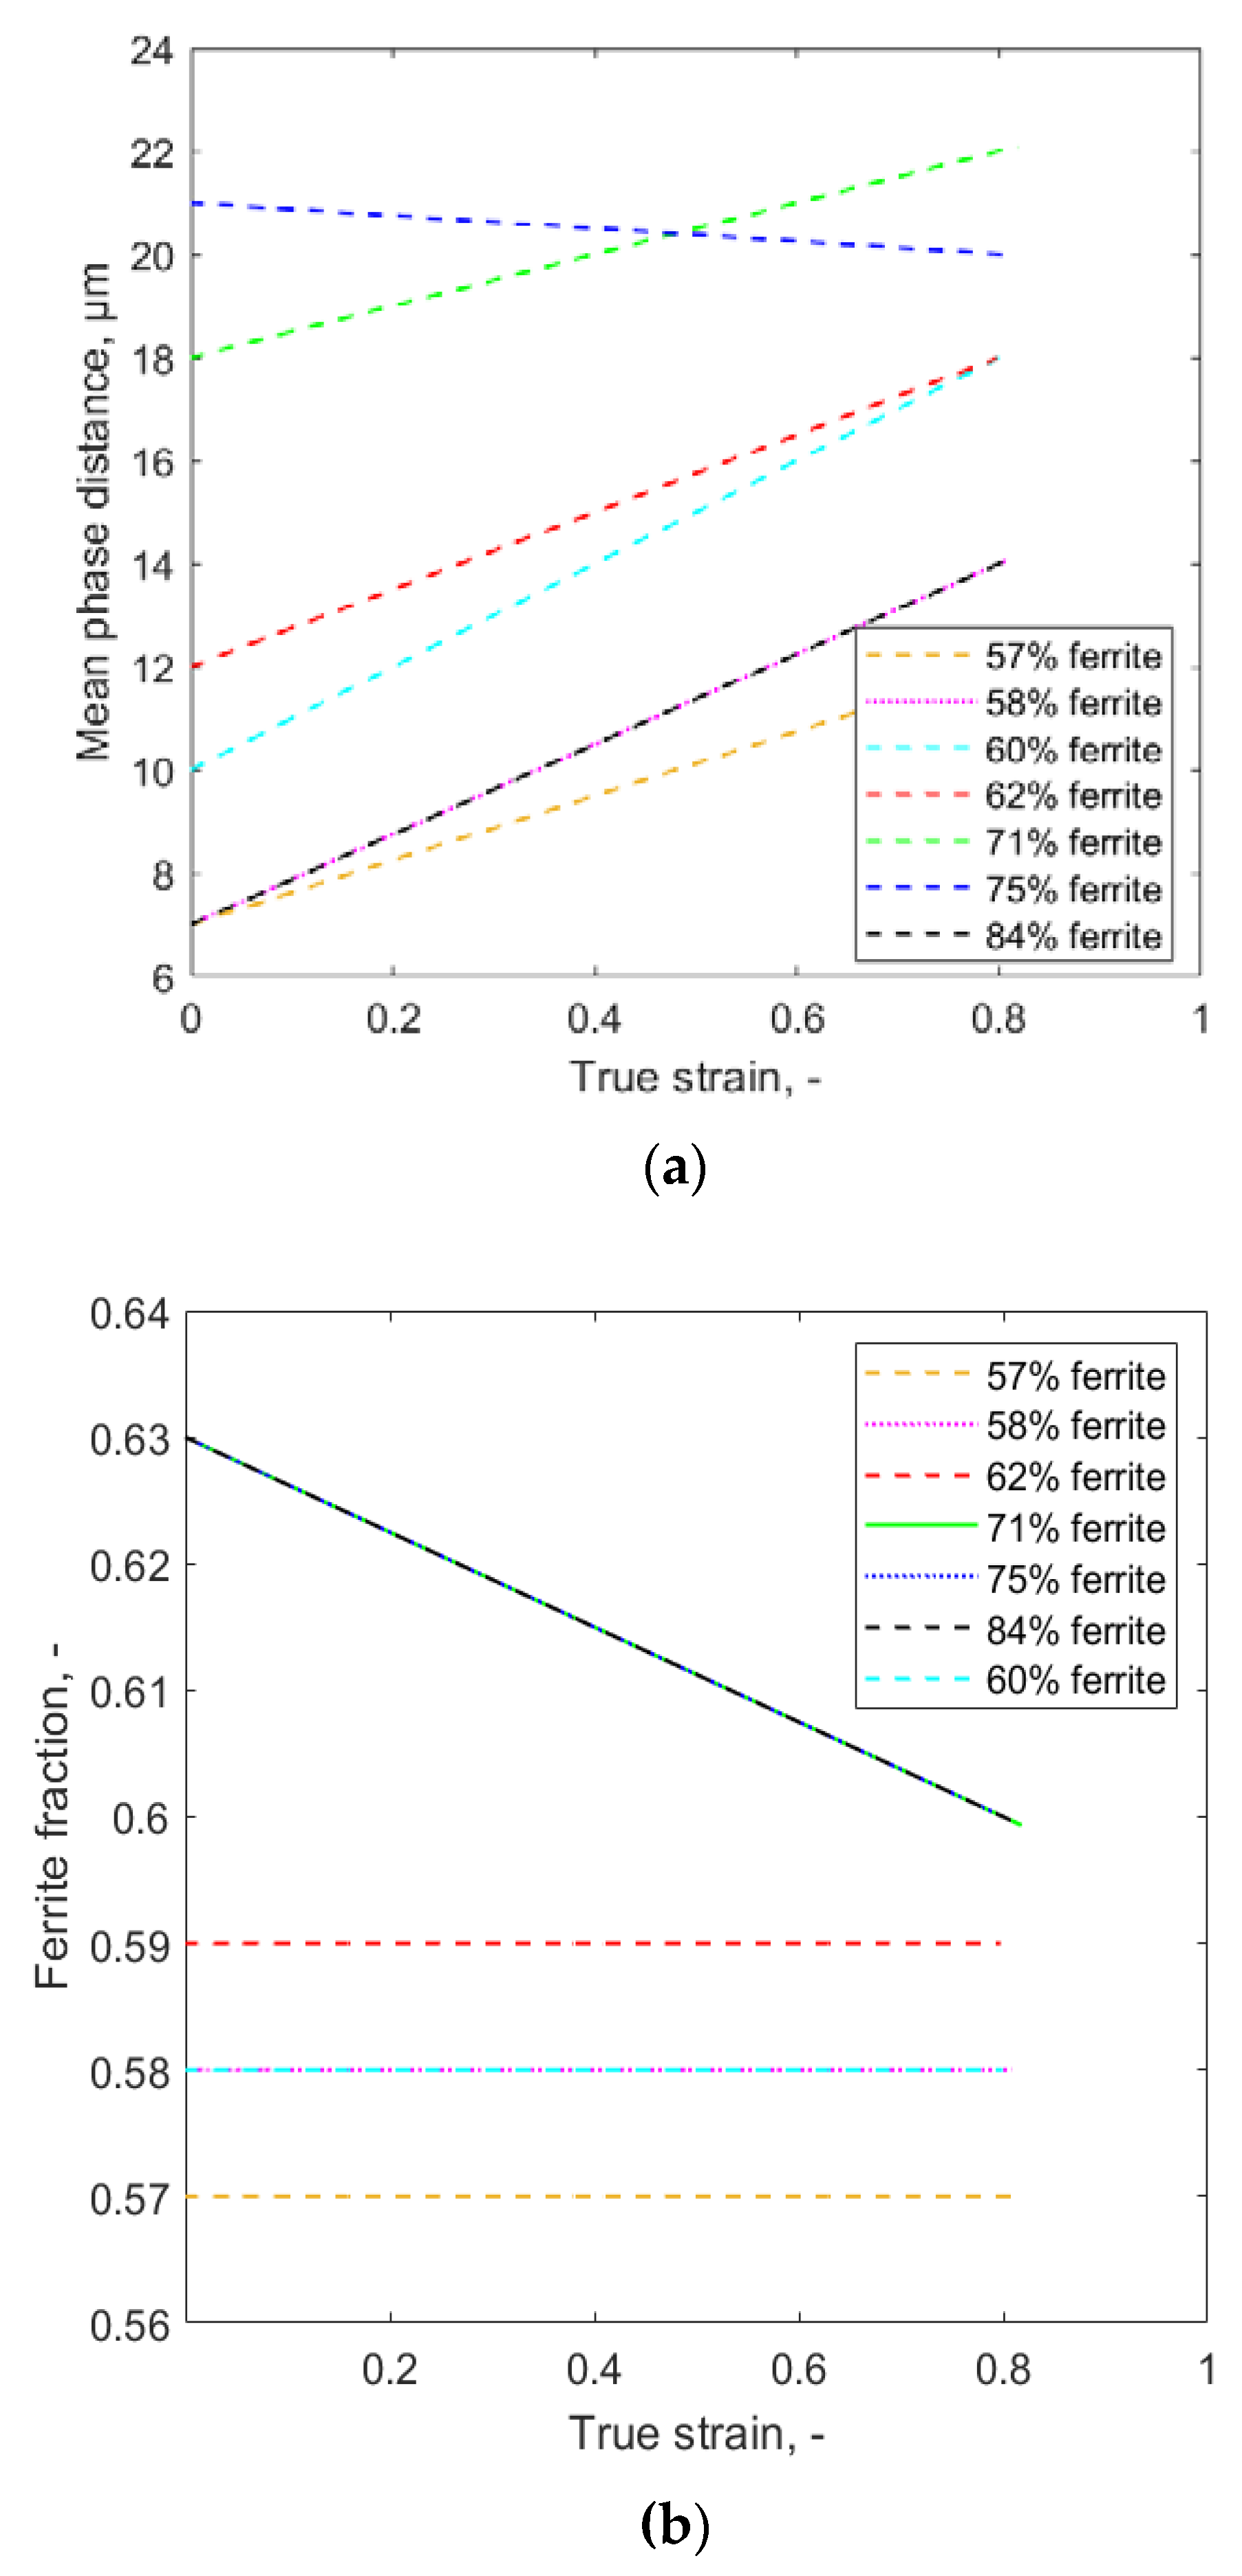
By having the mean flow curves of ferrite and austenite at 1100 °C and 0.1 s−1 for arbitrary ferrite-austenite ratios and grain sizes, the flow curves of duplex microstructure can be calculated under these boundary conditions using Equation (5). Three material conditions of the experimental investigation, as well as the literature data, were used for the validation of the presented method. The different ratios of ferrite and austenite ratios are coupled to an individual mean phase distance of both phases. Therefore, firstly, a duplex basic flow curve will be calculated considering the phase ratio, and secondly, the influence of phase grain size will be added. For every strain an individual grain size is used; this is necessary as the phase ratio and grain size change during the compression tests. While the change of grain size is considered in the model, the change of the phase fraction is not considered in the physical manner, due to numerical problems, which lead to high artefacts in the flow curve, reducing the phase fraction difference close to zero.

3. Results

3.1. Experimental Characterization

Due to the solution annealing for 1 h at different temperatures, the microstructure of the duplex steel is changed significantly in dependence of the annealing temperature. While the annealing at 1000 °C results in a microstructure with a ferrite content of 57% and a mean phase distance of 7 µm for ferrite and austenite, the annealing at 1200 °C leads to a ferrite fraction of 75% and a coarser microstructure with a mean phase distance of 21 µm. In Figure 2 the coarsening of the microstructure and decrease in the austenitic phase (white) due to the increase in annealing temperature is visible. The microstructure data measured from optical microscopy are given in Table 2.
The pictures were taken from the plane, which is located transversal to the forging direction; therefore, the lamellar structure of the elongated grains is not visible. Using these different initial microstructures as an input for the compression tests with a strain rate of 0.1 s−1 and a testing temperature of 1100 °C results in the stress strain behavior as given in Figure 3. The yield stress decreases with increasing ferrite fraction due to the lower strength of ferrite compared to austenite at high temperatures. The microstructure condition of 84% is an exception to this trend because the yield stress is higher than that of the 62% ferrite. Therefore, the existing models based on the ferrite and austenite phase content are not sufficient to cover this material behavior due to the additional effect of the phase distribution. While microstructure conditions with lower ferrite fractions show a clear peak stress, the microstructure conditions with a ferrite fraction of 71% and 75% show minimal softening. However, the microstructure condition with a ferrite fraction of 84% shows significant softening behavior again. At the end of the compression tests, there are two different steady-state stresses for the different tested microstructure conditions. The first steady-state stress is reached with ferrite fractions of 57–62% and the second one is reached with the ferrite fractions of 71–84%.
During deformation, the duplex microstructure undergoes extreme changes. Firstly, the ferrite fraction is changed due to heating to another temperature during forming, compared to the temperature of the solution annealing. At the end of the compression test, all microstructure conditions, independent from the starting fraction, exhibit a ferrite fraction of approximately 59%, which is the equilibrium ferrite fraction at 1100 °C. From Figure 4a two groups of microstructure changes can be defined. The first group consists of an initial ferrite fraction from 57% to 62%, where the change in ferrite fraction of initial microstructure and final microstructure is marginal. The second group has a higher ferrite content of up to 84%, where the ferrite fraction decreases significantly during the pre-heating and hot forming. This group definition also corresponds to the effect of the two different steady-state stresses in the flow curves shown in Figure 3. The high standard deviation of ferrite fraction measurements before compression tests for all material conditions and for the interrupted tests of 84% initial ferrite fraction is caused by the optical method of measurement. In contrast to this, the variations in measurements with the ferritscope are less.
In addition to the change of ferrite fraction, the orientation of the phases is changed during deformation. The beginning isotropic phase distribution was measured transverse to the elongated forging fiber course. This straight fiber course is rotated during plastic deformation and transformed to a more lamellar microstructure with elongated austenite islands, as shown in Figure 5. Grain boundaries are not visible due to the etching technique, which only allows for the differing of the phases. While the distribution of the austenite phase is very fine for the initial ferrite fraction of 57%, it is coarsened with increasing initial ferrite fraction. This means that all microstructures at the end of the compression tests exhibit the same ferrite fraction, but different distribution of the two phases.
The sample with the initial ferrite fraction of 84% was prepared differently to samples with other microstructure conditions before being subjected to compression tests. While most of the samples were heated up to the testing temperature and held for 3 min before compression starts, the sample with 84% ferrite was held for 5 min. For this material condition, the compression test was interrupted at a degree of deformation of φ = 0 , φ = 0.2 , and φ = 0.8 . Afterwards the evolution of microstructure was investigated as shown in Figure 4b and Figure 6. It was observed that the ferrite fraction had already decreased close to 60% during the pre-heating to deformation temperature and that further decrease during the compression is only 3%. The change in phase distribution in Figure 6a,b is also significant before deformation starts. There is a coarsening of the already existing austenite grains after the annealing due to decreasing ferrite fraction. Additionally, the austenite precipitates in fine phase fractions inside the ferrite areas.
The number of finely distributed austenite fractions decrease slightly during deformation in Figure 6c,d. At the beginning of the plastic forming, the finely distributed austenite particle refines the microstructure comparable to the material conditions of an approximately ferrite fraction of 60%. In Figure 6e two distributions of phase distance, before and after 5 min pre-heating for compression tests, are given. While the initial microstructure contains austenitic areas of close to 15 µm diameter and ferrite areas of close to 50 µm diameter, the large areas of the ferrite were refined by the precipitated austenite after the annealing, so that the distribution shows a sharp peak below 10 µm phase distance. Mean phase distance and ferrite fractions of the interrupted compression tests for samples with 84% initial ferrite fraction are given in Table 3. It can be observed that the mean phase distance of 14 µm does not represent the peak value of the phase size distribution after pre-heating, which is dominated by the small precipitates of austenite. The effect of refinement of the microstructure due to the austenite precipitations can also be observed in the flow curves in Figure 3, where the yield stress of the 84% ferrite fraction lies between the stress of 60% and 62% ferrite fraction.

3.2. Modelling of Flow Curves

In Figure 7a the simplified evolution of the mean phase distance of the different microstructure conditions is plotted. It is assumed that the mean phase distance evolves linearly between the initial and the final phase distance. Microstructure input parameters from Table 4, which are based on the experimental data from Table 2, were used. A smaller distance was only used for the initial phase distance of 84% ferrite, due to the extremely inhomogeneous microstructure of large areas of austenite and significant refined ferrite. Due to the assumption that strain is accumulated in ferrite in the early stage of forming [3], the smaller phase distance of the regions of ferrite with austenite precipitates is used instead of the measured mean phase distance. In Figure 7a most material conditions show an increase in the mean phase distance during hot deformation. Only the material condition of 75% ferrite shows a decreasing mean phase distance. Additionally, the material condition of 84% ferrite may be explained by the fine distributed austenite fractions at the beginning of the compression test, which does not coarsen much until the end of the forming process in Figure 6d.
Two problems concerning the changing ferrite fraction were observed during the hot forming and had to be addressed in the modelling. Firstly, the exact ferrite fraction of each material condition at the beginning of deformation is unknown due to the significant change of ferrite fraction during pre-heating. This is especially visible at the flow curve with an initial ferrite fraction of 84%. Secondly, the ferrite fraction of all material conditions changes to the equilibrium fraction of 58–59% during forming.
Because the single-phase flow curves were calculated using the differences between two different microstructural conditions, the decreasing ferrite fraction is a problem. The difference of the two ferrite fractions should not reach zero, because in this case Equation (9) is no longer valid. These two problems forced an exchange of the experimentally observed ferrite fraction, as listed in Table 2, to the assumed one, which are listed in Table 4, for the modelling. The assumed evolution of the ferrite fractions of the different microstructure conditions are plotted in Figure 7b. For the first group, with a ferrite fraction (57–62%) close to the equilibrium ferrite fraction, the ferrite fraction in the model of Table 4 is assumed to remain constant over the forming process. The second group, with an initial ferrite fraction of 71 84%, is assumed to have a decrease in ferrite fraction to 63% before deformation and further decreases down to 60% during the forming process.
Using Equations (7) and (9) for the combinations with an initial ferrite fraction of 57%, 58%, 71% and 75% the single-phase austenite and ferrite flow curves as shown in Figure 8a can be calculated. For this calculation, the initial ferrite fraction of Table 4 was assumed to stay constant during deformation. The mean flow curves for ferrite and austenite were calculated for each strain-step based on these three different single-phase flow curves. In Figure 8b, the mean flow curves of the single phases are compared to data from the literature. Here the parameters from Sellars et al. of Table 5 were used from the work of Iza-Mendia et al. [2] in Equation (3) to estimate the peak stress of austenite and the steady-state stress of ferrite. For the calculation, the boundary conditions 1100 °C and 0.1 s−1 were used. From comparing the single-phase flow curve of austenite with the peak stress from the literature, it is demonstrated that the peak stress of the duplex model in the present work overestimates the peak stress from the work of Iza-Mendia et al. In the case of a ferrite flow curve, the steady-state stress calculated by the duplex model of the present work is higher than the stress calculated with the model of Iza-Mendia et al. Moreover, the stress for low strains from the ferrite flow curves is as low as the yield stress in the measurements of Fischer et al. [17].
It must be mentioned that the single flow curves below a strain of 0.1 need to be discussed carefully due to the fact that the stress in the austenite flow curves decreases instead of increasing, as is typically observed in experiments. Nevertheless, the austenite single-phase flow curve shows the often-reported effect of dynamic recrystallization with the peak stress and a steady-state stress, while the ferrite single-phase flow curve shows a continuously increasing stress without dynamic recrystallization. To calculate reasonable duplex flow curves from the single-phase flow curves, the Hall–Petch contribution of the special microstructure condition has to be added.
In Figure 8b the results for the case of 57% ferrite are demonstrated. With the help of those adapted flow curves of ferrite and austenite, the rule of mixture of Equation (1) was used to calculate the stress of the duplex material for the example of 57% ferrite fraction.
For the calculation of the flow curves from different material conditions of the duplex steel in Figure 9a the same mean flow curves of ferrite and austenite and the rule of mixture were used. These material conditions correspond to the conditions used for the calculation of mean single-phase flow curves. Additionally, the material conditions in Figure 9b exhibit an interpolation and extrapolation of the method to the material conditions of 60%, 62% and 84% initial ferrite fractions and can, therefore, be used for the model validation. While the experimental flow curves in Figure 9a can be represented by the duplex model, the curves of Figure 9b show more deviation between the experiments and the model. For the material condition of 84% ferrite fraction, the flow stress shows for low strains a significant deviation, whereas the steady-state stress is in good congruence. For initial ferrite fractions of 60% and 62% the stress at the beginning looks good, but the steady-state stress cannot be represented by the model.
Due to several unknown input parameters in the model, a sensitivity analysis was performed. Next to the previously shown results for a Hall–Petch parameter of k δ , 1100 ° C = 10   MPa µ m and a constant ferrite fraction during forming in Figure 10a, the influence of changing ferrite fraction and higher Hall–Petch parameters were tested. Using a variable ferrite fraction during forming means reducing the initial ferrite fraction to the final values as given in Table 4, leading to an increase in peak stress and steady-state stress of the austenite. At the same time, this changing ferrite fraction leads to a more curved stress evolution of ferrite, see Figure 10b. The differences in the duplex flow curves are not significant. For the case that, in addition to the variable ferrite fraction, a higher Hall–Petch parameter of k δ , 1100 ° C = 20   MPa µ m is also used, the peak stress as well as the steady-state stress of austenite phase is reduced and the stress of ferrite is increased, see Figure 10c. Considering the duplex flow curves, especially the interpolated and extrapolated curves of 62% and 84% ferrite fraction changed. While the flow stress for low strains of both material conditions can be calculated by the model, the steady-state stresses were not represented. In contrast to the experimental results, the steady-state stress of 84% ferrite fraction calculation is higher than the one of 62%.

4. Discussion

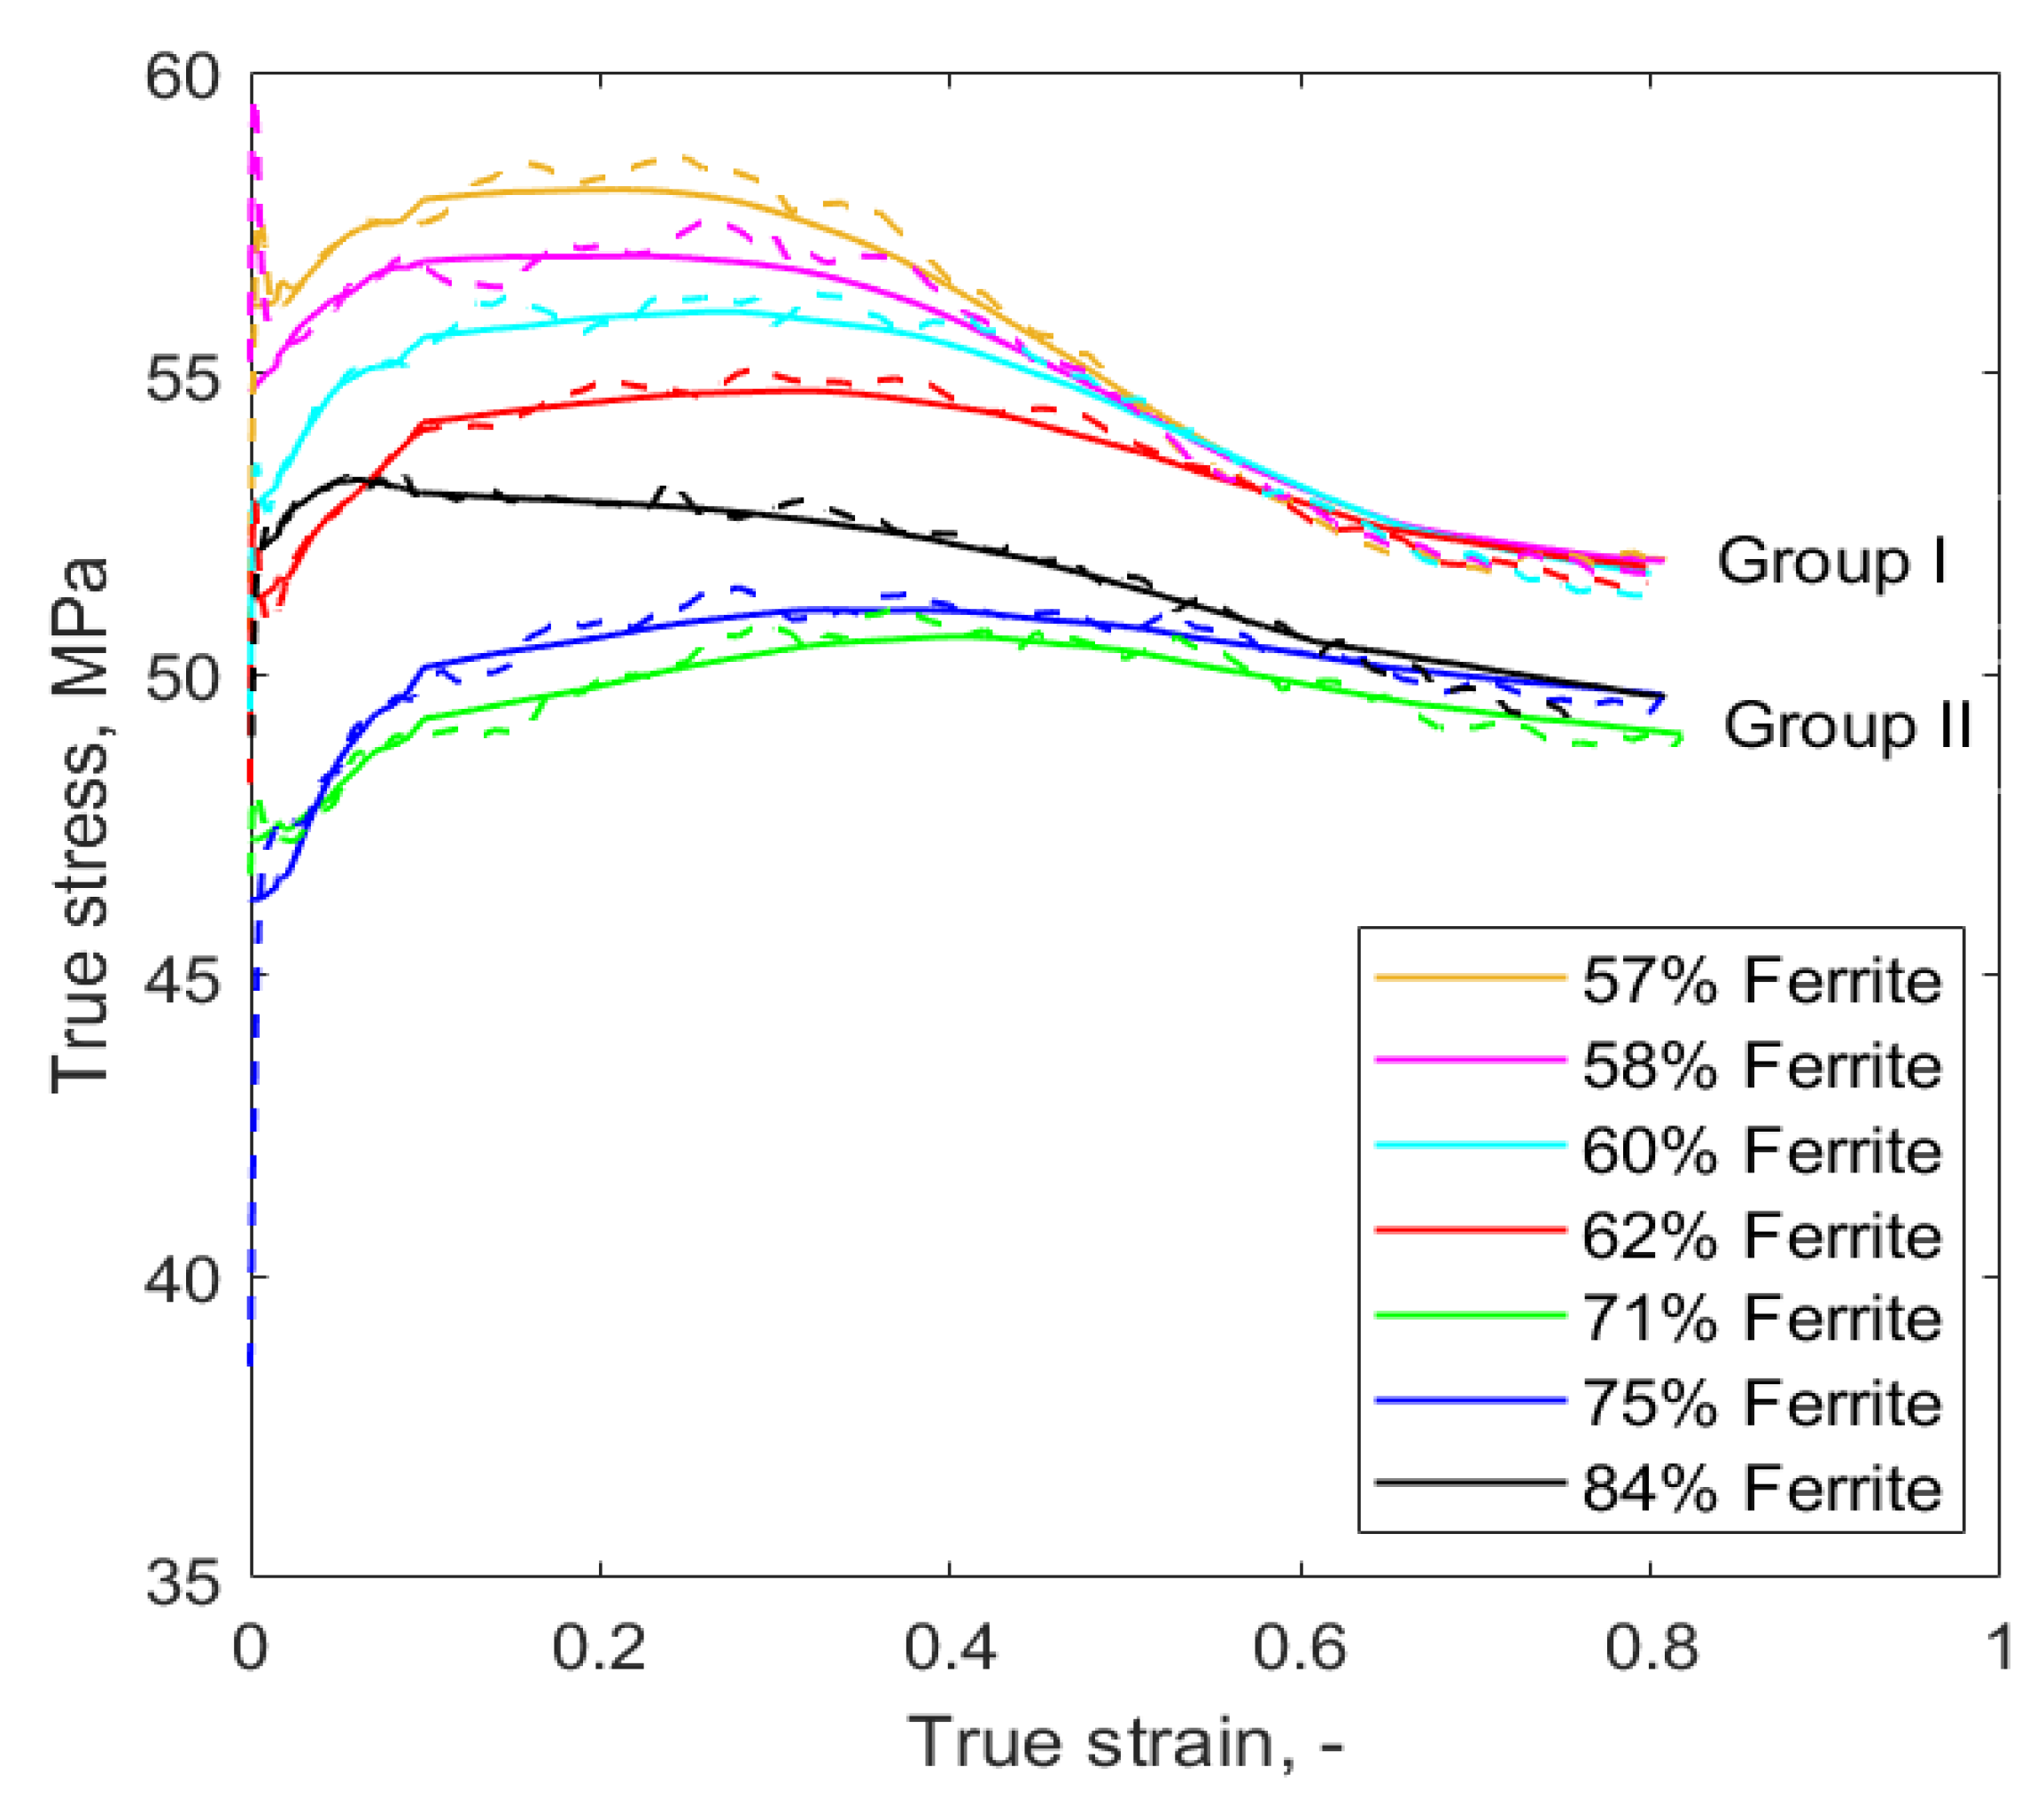
The present work demonstrates the importance of the influence of the microstructure, e.g., phase distribution and phase distance, on the flow stress of the duplex steel during hot forming. The flow stress evolution of the different material conditions cannot be explained easily by the different ferrite fractions achieved after different temperatures of solution annealing. From 57% to 71%, the magnitude of peak stresses of the flow curves in 
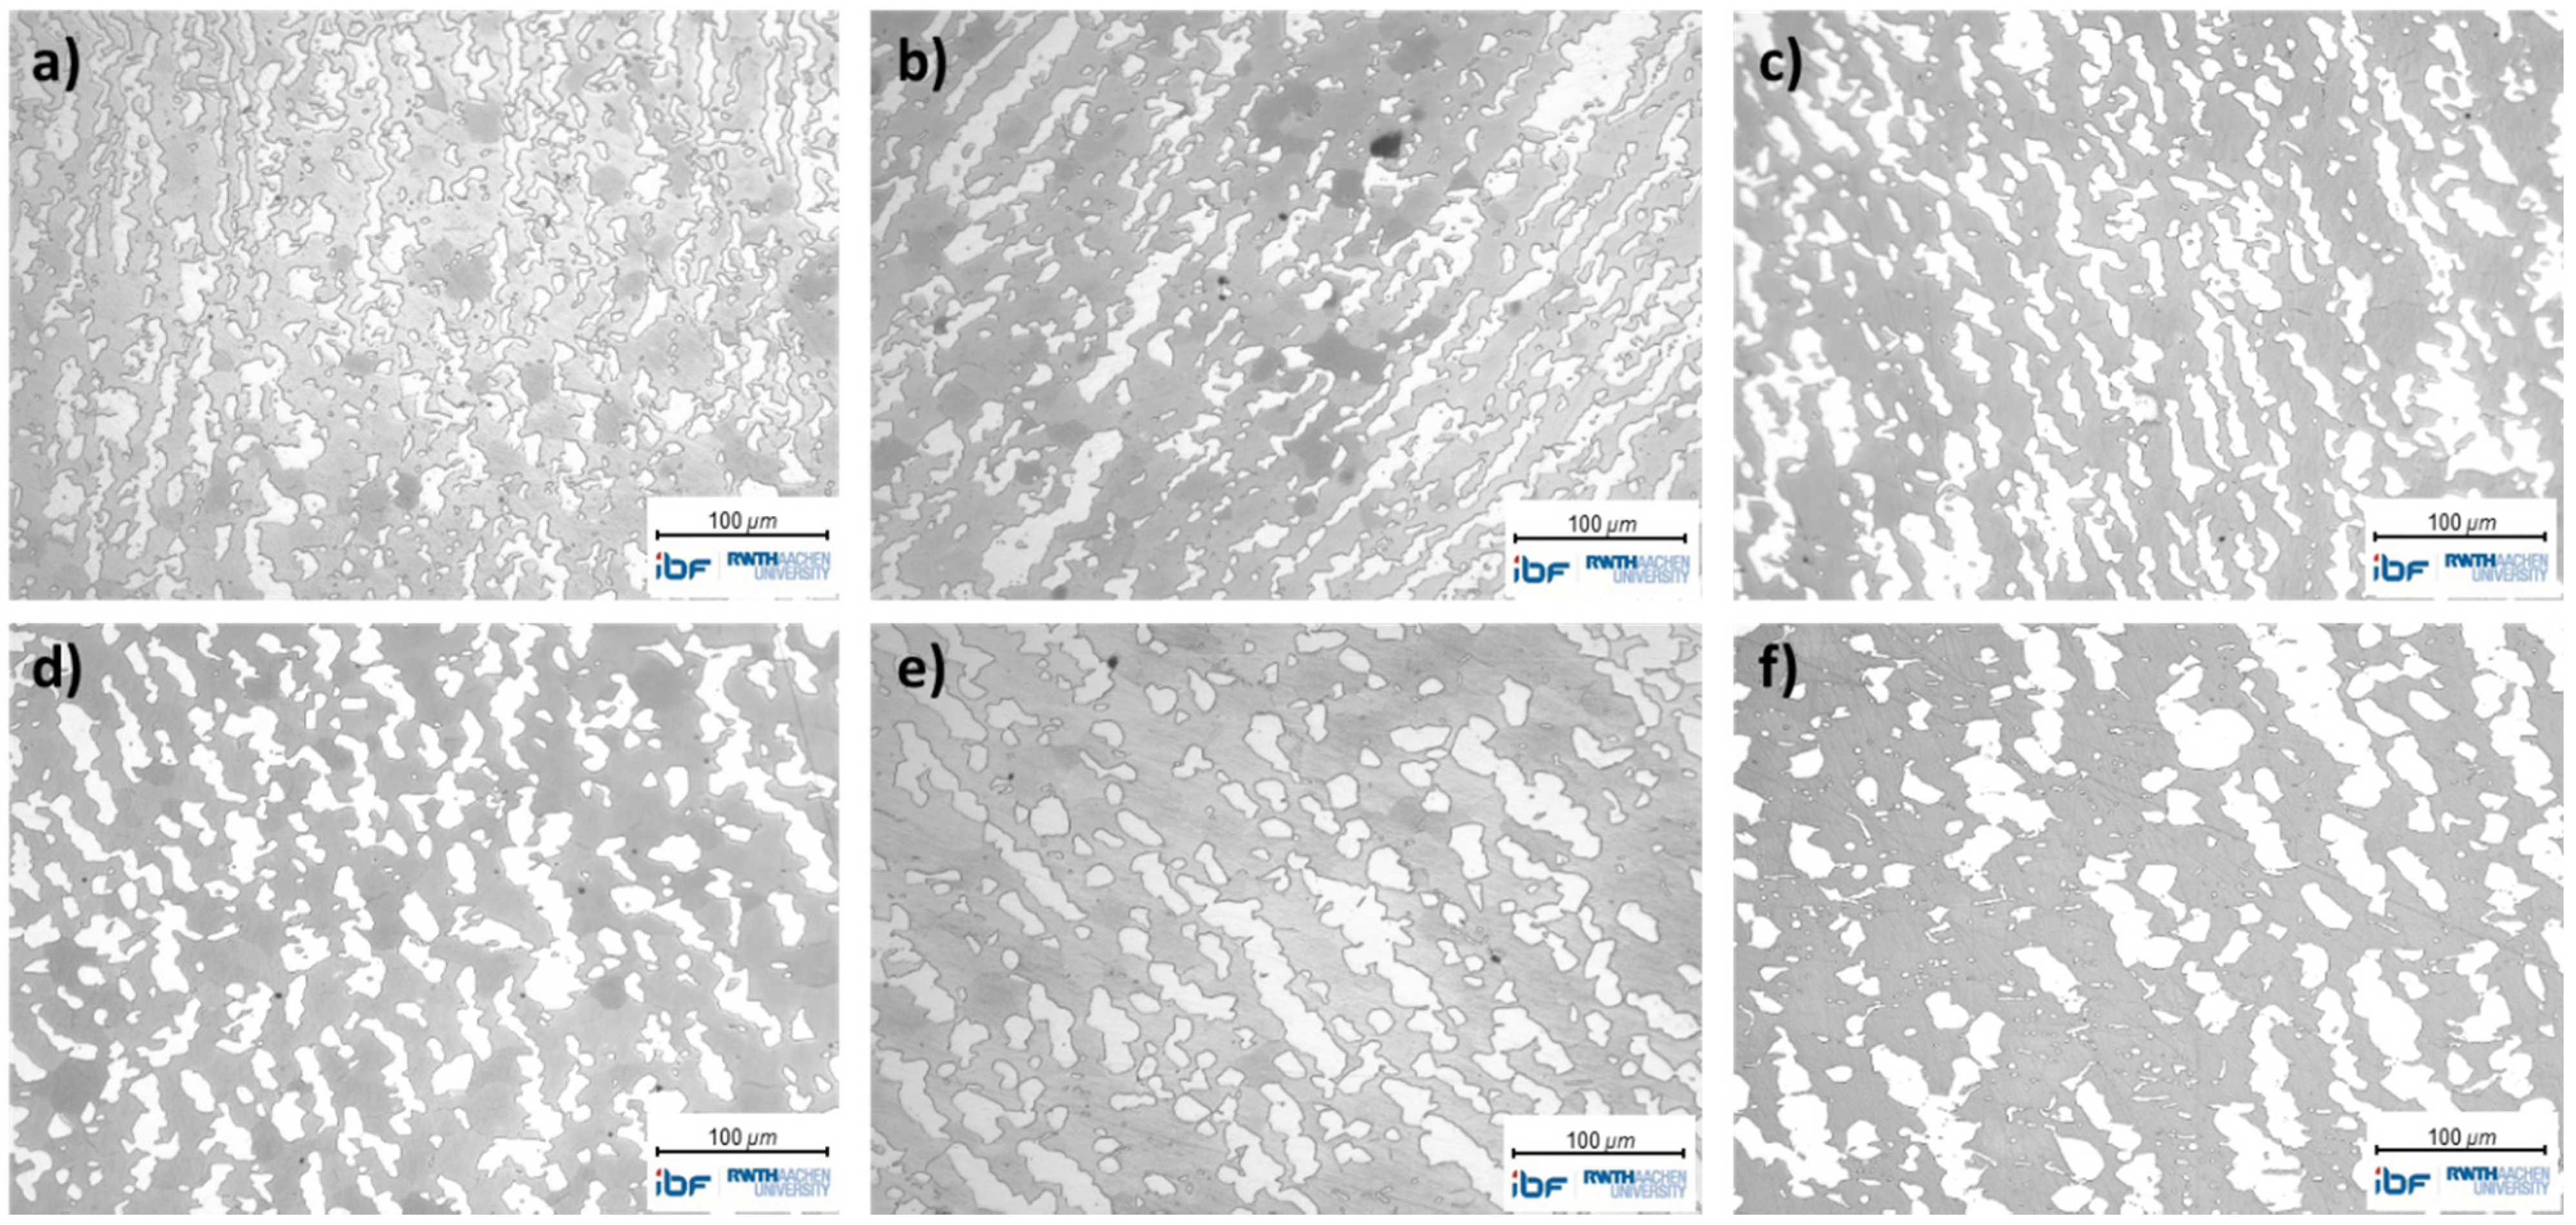
Figure 3 correspond with the initial ferrite fraction, which means more ferrite leads to less stress. However, in the case of 75%, and especially for 84%, the flow stress of the material condition is increasing, compared to material conditions with less ferrite. Furthermore, the fact that all material conditions exhibit the same ferrite fraction at the end of the compression test is also strong evidence that the different steady-state stresses in the flow curves were caused by differences in the phase distribution or the phase distance. This is especially the case for the material conditions (71%, 75%, 84% ferrite fraction), where the forming temperature does not correspond with the equilibrium temperature of the initial ferrite fraction. Therefore, significant microstructural changes have been observed between Figure 2 and Figure 5 during pre-heating and forming at 1100 °C in the present work, which strongly depend upon whether ferrite fraction increases or decreases. For the case that the ferrite fraction decreases more than 10%, fine austenite particles lead to significant microstructure refinement and, therefore, to an increase in the materials’ strength.
While other authors primarily investigate the influence of strain rate, temperature, and occasionally the ferrite fraction on the flow stress; the evolution of microstructure distribution during forming is often neglected. In Figure 3, the influence of the initial microstructure distribution on the peak stress during a compression at 0.1 s−1 and 1100 °C is in the range of 10 MPa. Therefore, this effect is comparable to the differences in the flow stress due to a strain rate change of 0.05 s−1 or 0.5 s−1 as well as the differences due to a temperature change from 1100 °C to 1200 °C. These mentioned changes are seen in the work of Spigarelli et al. [3]. As a consequence, the phase distribution and evolution of the microstructure cannot be neglected for precise flow curve modelling.
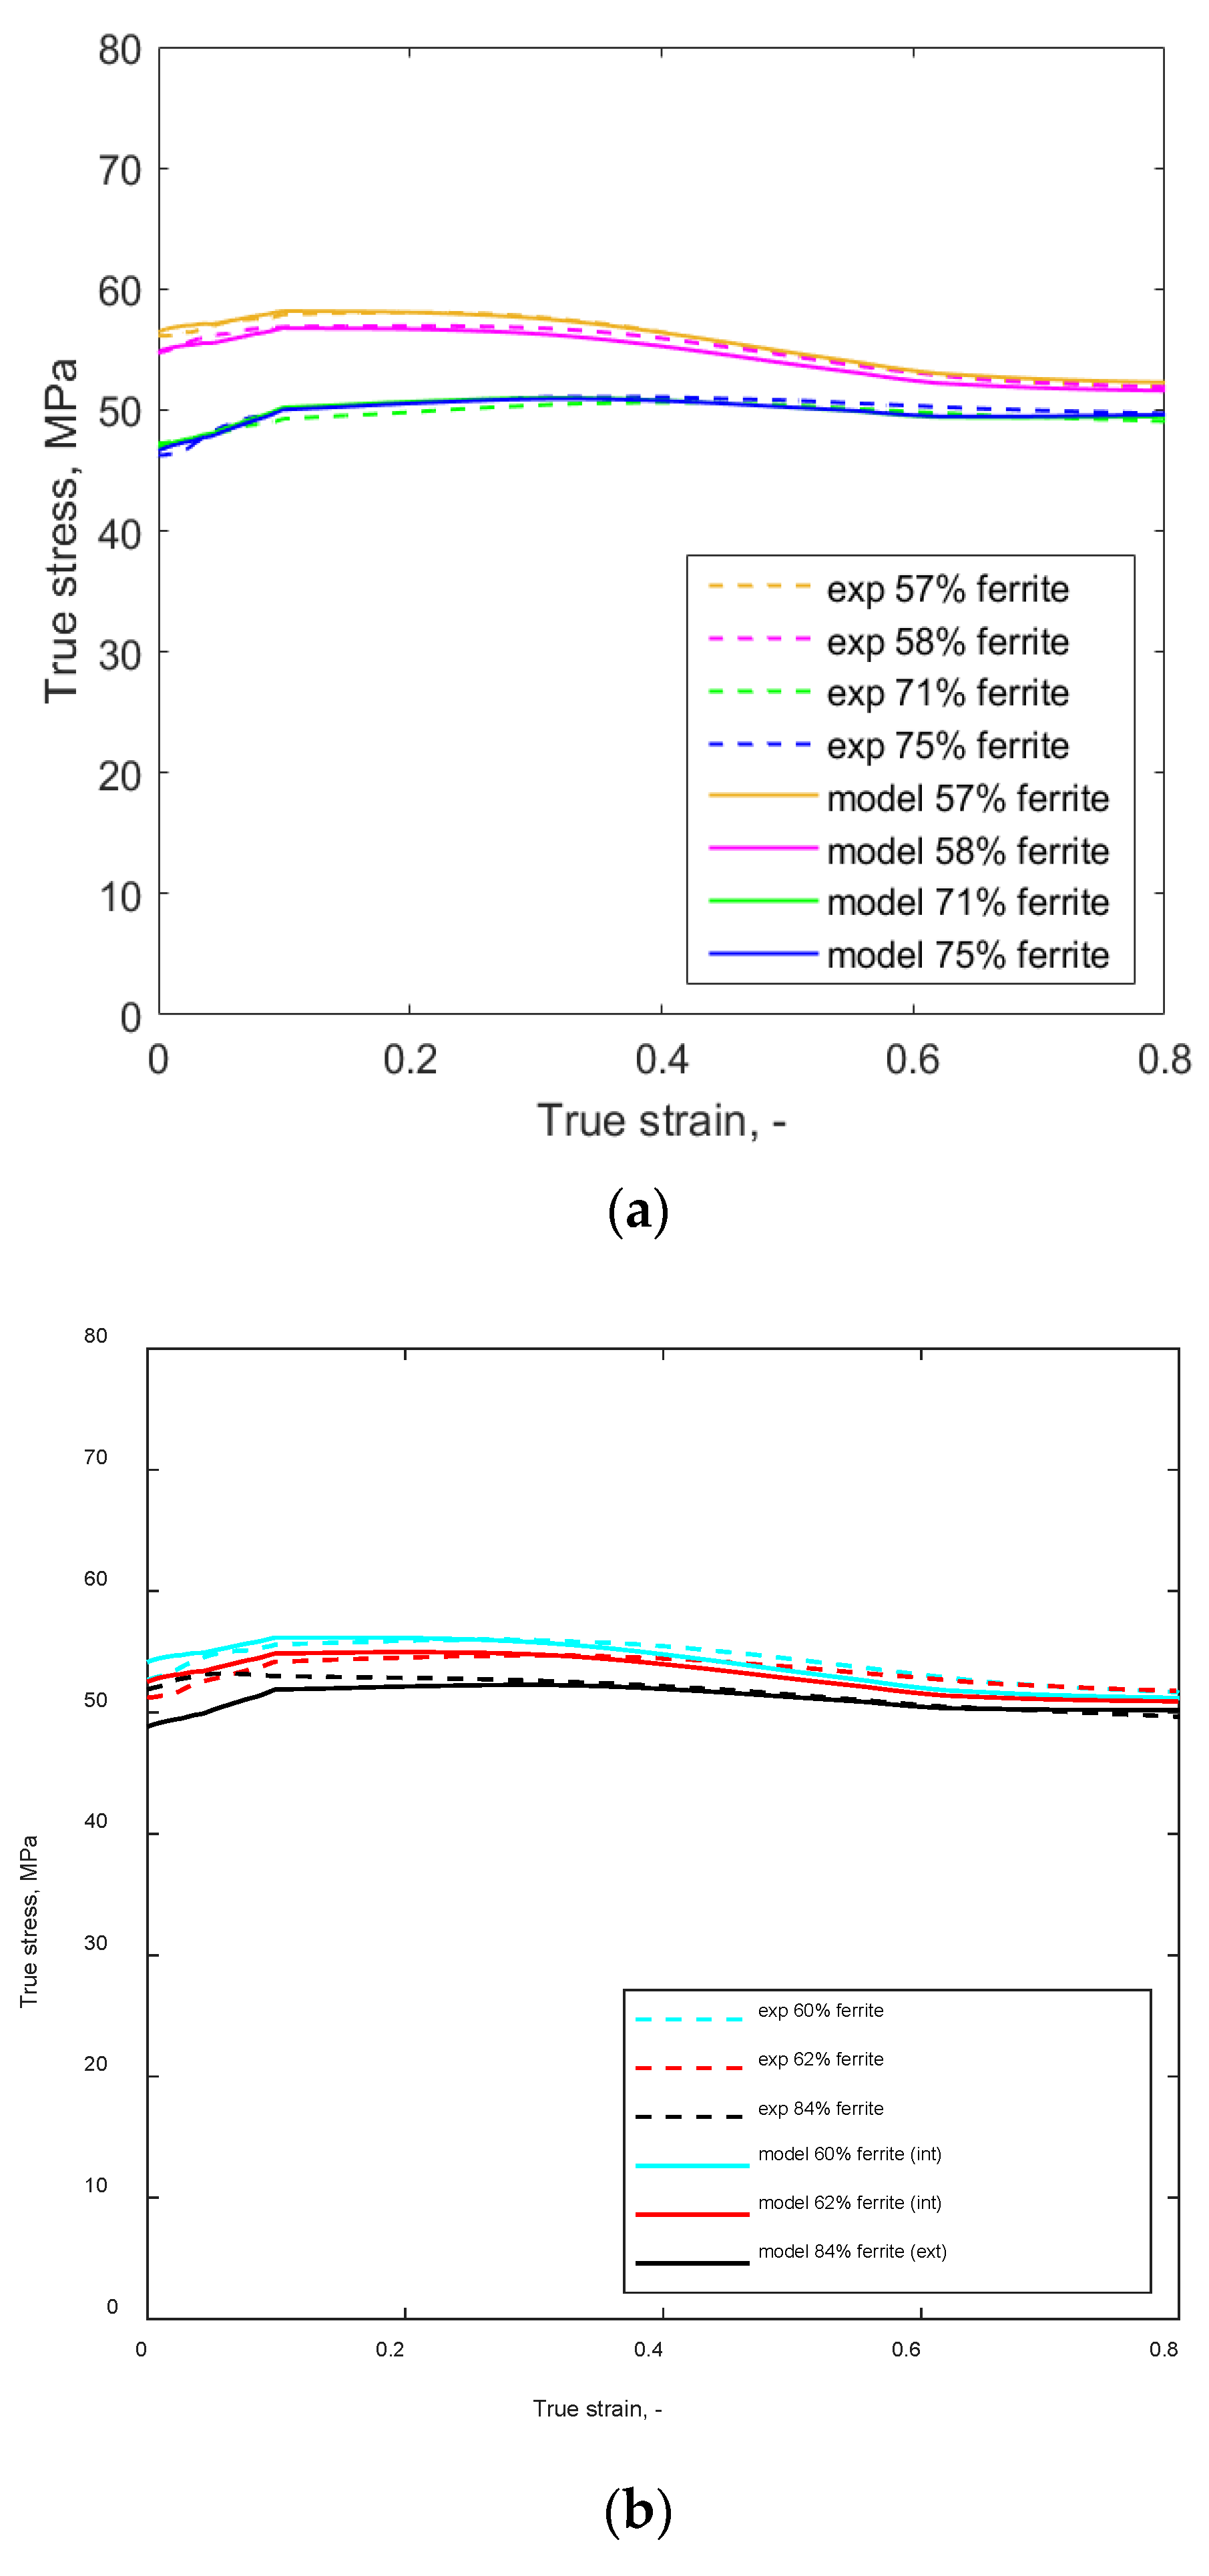
A possible model to consider the microstructure distribution in the form of the mean phase distance on the flow stress was introduced in the present work. This model is based on the assumption that the mechanical behaviour of all material conditions can be reduced to the same ferrite and austenite single-phase material behaviour, as shown in Figure 8b, which is then individualized for each material condition by the rule of mixture and Hall–Petch effect based on the different microstructure data.
One problem that still has to be overcome in the demonstrated method for the inverse estimation of the single-phase flow curves of ferrite and austenite is the assimilation of ferrite fraction during pre-heating and forming. Due to the limitations of the method that ferrite difference cannot decrease to zero, the results of the model contain an error. Additionally, it has to be mentioned that the calculated single-phase ferrite and austenite flow curves of Figure 8b would probably not represent experimentally measured flow curves of the single phases at 1100 °C and 0.1 s−1. The reason for this is that strain partitioning and strain rate partitioning as mentioned by Spigarelli et al. [3] have not been considered in the model to date. Nevertheless, it is assumed that the error resulting from the deviation in the ferrite fraction used and the one measured in experiments is in an acceptable range, as the results of the single-phase curves in Figure 8b are of a similar magnitude compared to data from the literature. Concerning the disregarding of strain and strain rate partitioning, it is possible to use the rule of mixture without strain partitioning if it is disregarded in both directions, means calculating the single-phase curves as well as mixing the duplex phase curves from single-phase curves. The aim of the present work is not to calculate perfect single-phase flow curves for austenite and ferrite for comparison with experimental data. Moreover, the present work has a much simpler aim, as it shows that effects of microstructure features on the stress response can be considered with relatively simple microstructure models and, therefore, should be further investigated. For a precise calculation of the single-phase flow curves, the strain rate partitioning, as well as the strain rate sensitivity of the stress, should be implemented in a future version of the model.
The sensitivity study in 
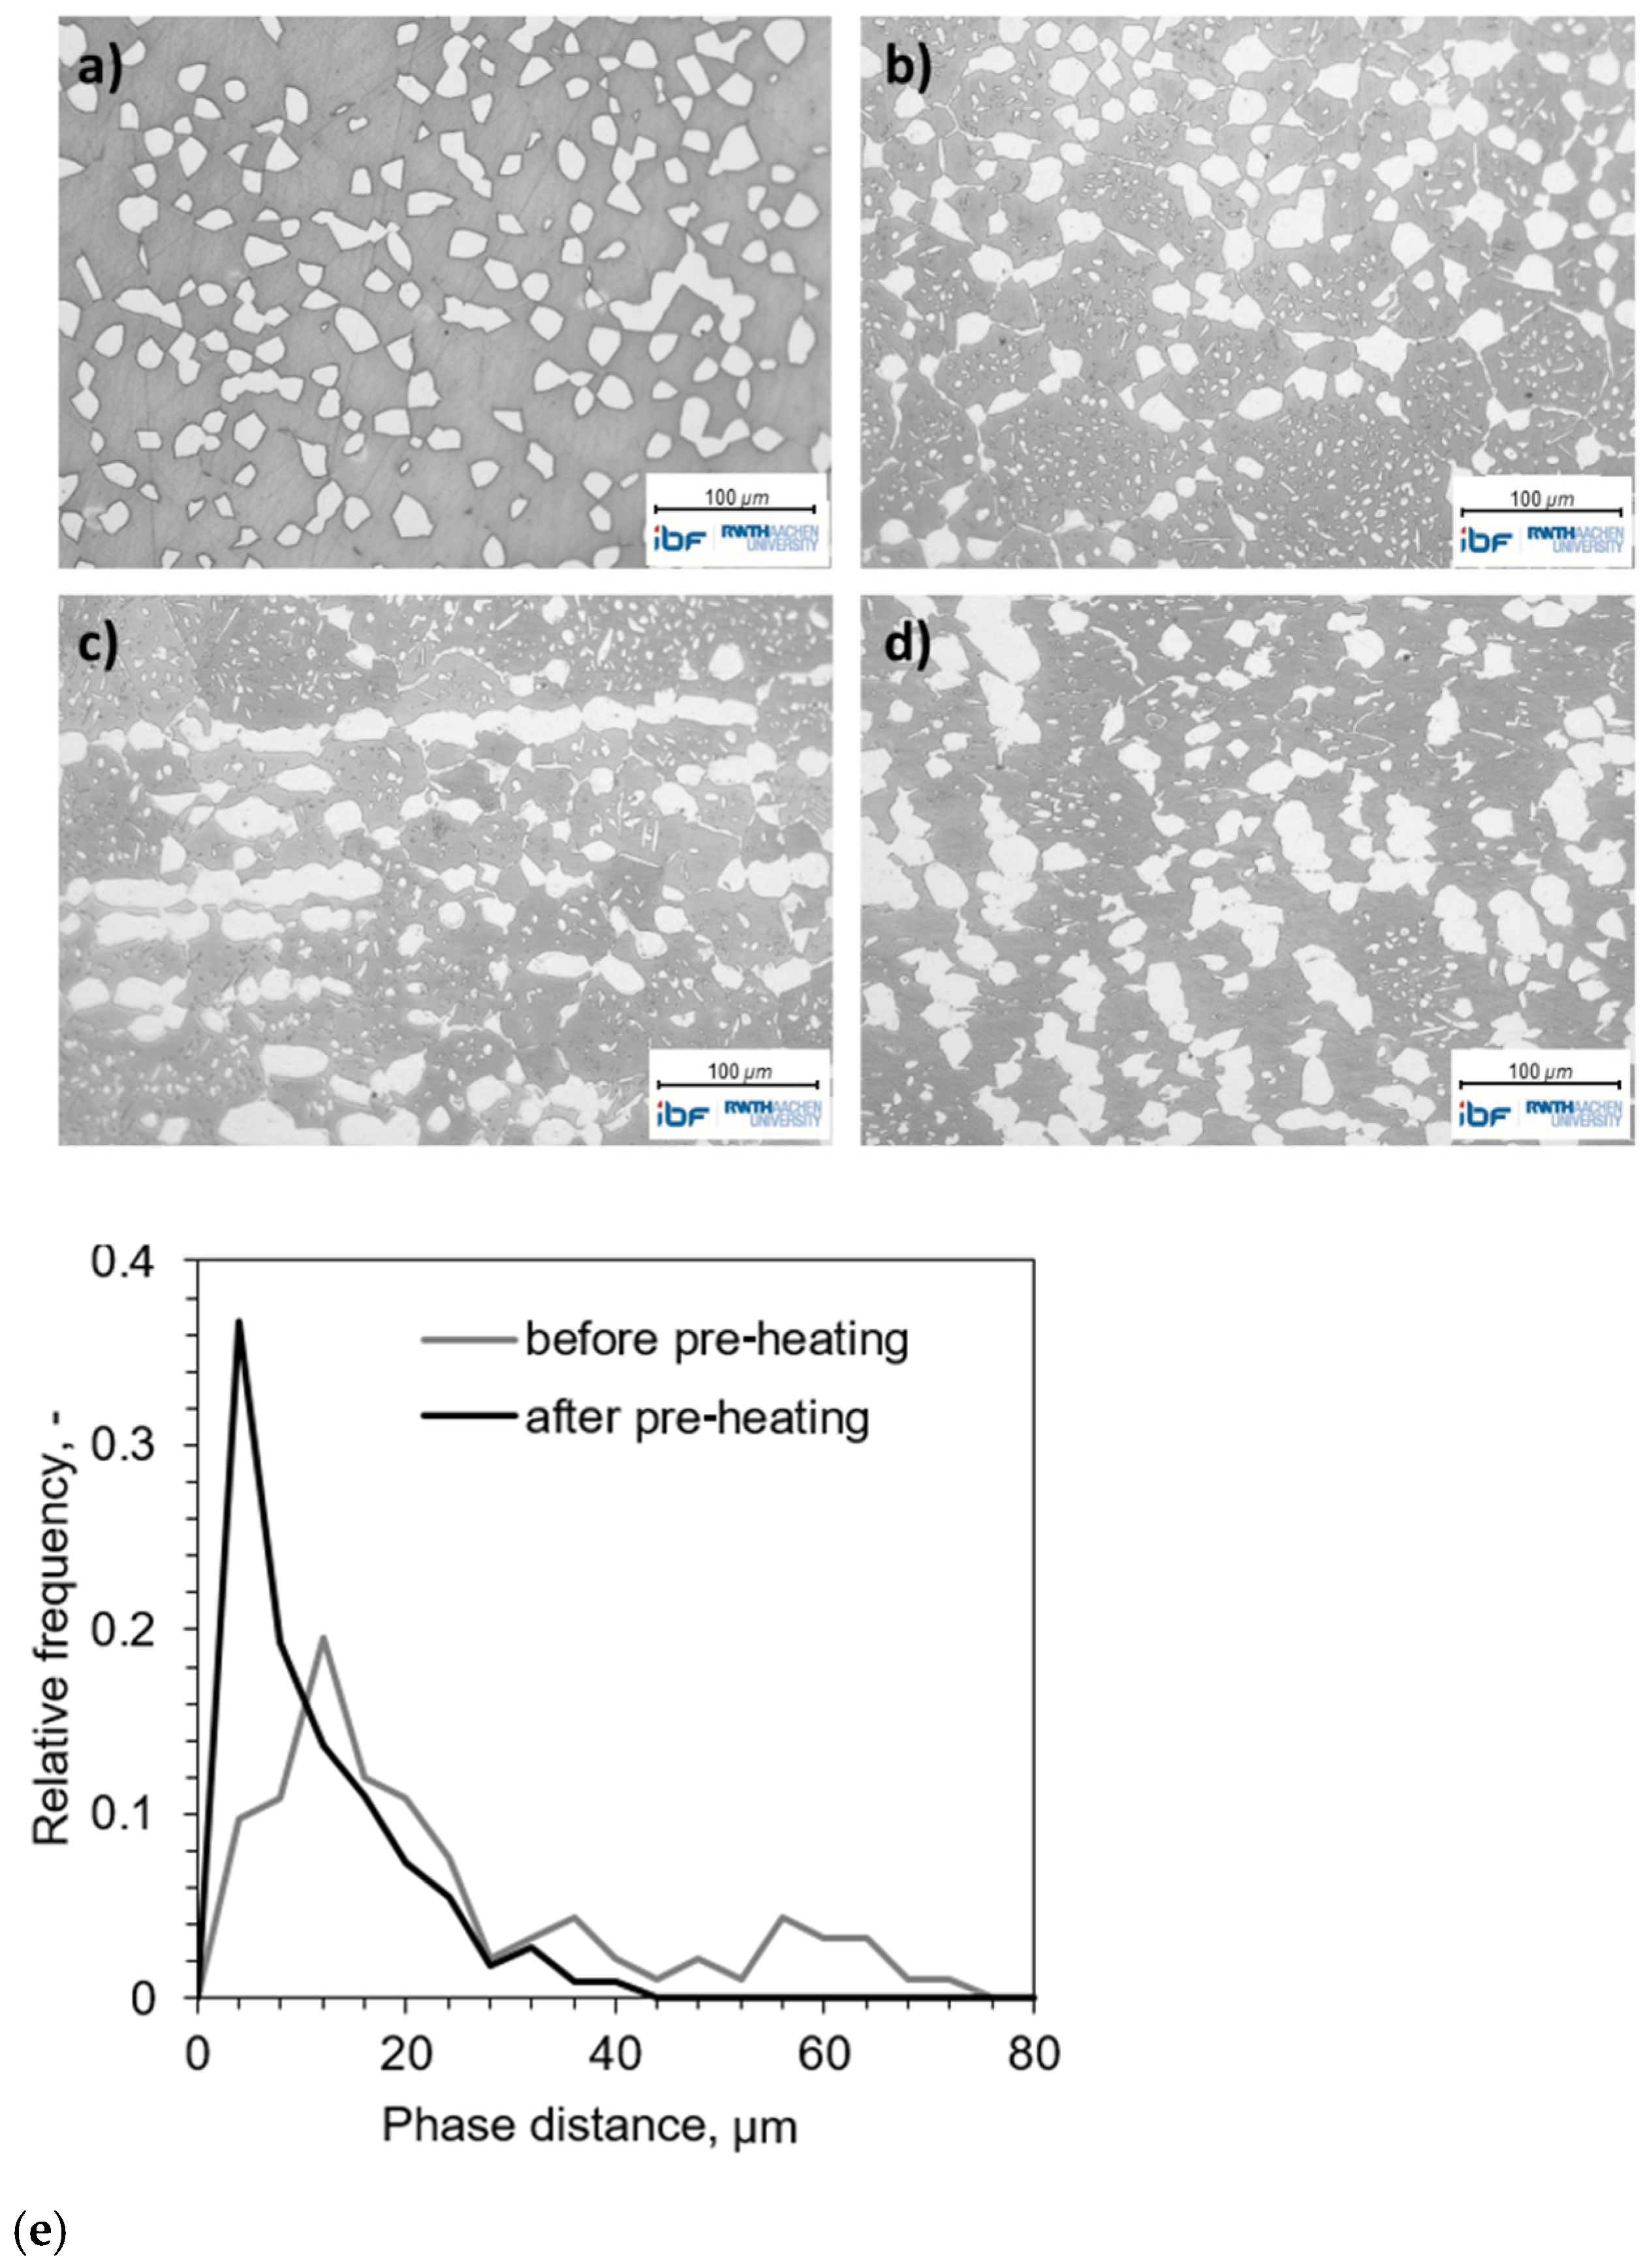
Figure 10 shows that the concurrent effects of phase fraction by the rule of mixture and phase distance by the Hall–Petch effect on the flow stress are strongly dependent on the fitted Hall–Petch parameters and the assumed input values of the microstructure, e.g., phase fraction and phase distance. In the present work, only mean values of the phase distance were used, which is a strong simplification. In the case of an 84% initial ferrite fraction, it is demonstrated that for inhomogeneous microstructures, a more complex definition of the microstructure parameters than the mean phase distance is necessary to cover the bimodal phase distance distribution, as shown in Figure 6b. Therefore, it is important to have as exact experimental microstructure parameters as possible, including the mean phase distance of each single phase and changing ferrite fractions. In addition, the Hall–Petch parameter is afflicted with uncertainty due to missing experimental data for high temperatures. Nevertheless, by choosing reasonable values based on the experimentally observed stresses from the literature for ferrite and austenite, the model could be used for the sensitivity analysis.
The calculated peak stresses of the different material conditions in Figure 9 and Figure 10 agree with the experimental data when using the measured mean phase distance from the experiments. Conversely, the effect of the two different steady-state stresses observed in the experiment cannot be covered adequately by the model when the microstructure information from the experiments after forming is used. Especially for the interpolated and extrapolated material conditions, the model results do not fit the experimental results. Keeping the ferrite fractions of the model constant during forming (Figure 10b) leads to not only different steady-state stresses but also to different final ferrite fractions for the material conditions. However, this is not in agreement with the measured ferrite fractions of the experiments, which are nearly the same (Table 4). Nevertheless, the two different steady-state stresses of the material conditions observed in the experiment can be predicted best with the constant ferrite fractions. While using a higher Hall–Petch parameter in combination with the more realistic decreasing ferrite fraction (Figure 10c) shifted the model sensitivity to the phase distance instead of the ferrite fraction. Furthermore, the mean values of the measured phase distance used in the experiment are not able to represent the situation of the steady-state stresses for all investigated material conditions. Especially the interpolated and extrapolated material conditions showed deviations between the model and the experimental data.
It can be concluded that the combination of single-phase flow curves, rule of mixture and Hall–Petch relationship is usable to predict the influence of phase distribution on the duplex flow stress for a homogenous microstructure. For more complex microstructures, which contains inhomogeneous features, more information than the mean distance of phases is needed to cover the flow curve.

5. Conclusions

In the present work, the influence of microstructure parameters such as ferrite volume fraction and phase distribution on the hot deformation flow stress of a duplex steel has been investigated. Therefore, compression tests at higher temperature were conducted and a model was developed. Based on the results of the experiments and the modelling, the following conclusions can be made:
  • Modelling of the flow stress based on just the ferrite and austenite fractions and the rule of mixture is not adequate if there are significant differences in the microstructural appearance.
  • The consideration of the phase distribution is also relevant for the modelling of duplex steel hot flow curves.
  • A possible way to predict the duplex flow curves of material with different austenite and ferrite phase distributions more accurately is the combined use of single-phase flow curves, the rule of mixture and the Hall–Petch relationship.
  • In a first step, the Hall–Petch relationship can be based on the mean phase distance, which is quite easy to measure and is able to increase the accuracy for the peak stress.
  • The limits of using only one single parameter mean phase distance for a duplex steel microstructure are visible for the case of strongly inhomogeneous microstructures.
  • Additionally, the inclusion of only the mean phase distance is not enough to describe the steady-state stress for all material conditions.
  • Due to sporadically occurring differences between modelled and measured flow curves for inhomogeneous microstructures, more information about single phases has to be collated and included in future models.

Author Contributions

A.Q.; validation, A.Q. and J.A.N.; formal analysis, J.A.N.; investigation, J.A.N.; resources, G.H.; data curation, M.T.; writing—original draft preparation, A.Q.; writing—review and editing, J.A.N., M.T. and G.H.; visualization, A.Q.; supervision, M.T. and G.H.; project administration, M.T.; funding acquisition, M.T. and G.H. All authors have read and agreed to the published version of the manuscript.

Funding

This research received no external funding.

Institutional Review Board Statement

Not applicable.

Informed Consent Statement

Not applicable.

Data Availability Statement

The data presented in this study are available on request from the corresponding author.

Acknowledgments

We acknowledge Lucas Endt for his support with the metallography and Owen Murdock for language revision.

Conflicts of Interest

The authors declare no conflict of interest.

References

  1. Haghdadi, N.; Cizek, P.; Hodgson, P.D.; Beladi, H. Microstructure dependence of impact toughness in duplex stainless steels. Mater. Sci. Eng. A 2019, 745, 369–378. [Google Scholar] [CrossRef]
  2. Iza-Mendia, A.; Pinol-Juez, A.; Urcola, J.J.; Gutierrez, I. Microstructural and mechanical behavior of a duplex stainless steel under hot working conditions. Metall. Mater. Trans. A 1998, 29, 2975–2986. [Google Scholar] [CrossRef]
  3. Spigarelli, S.; El Mehtedi, M.; Ricci, P.; Mapelli, C. Constitutive equations for prediction of the flow behaviour of duplex stainless steels. Mater. Sci. Eng. A 2010, 527, 4218–4228. [Google Scholar] [CrossRef]
  4. Farnoush, H.; Momeni, A.; Dehghani, K.; Mohandesi, J.A.; Keshmiri, H. Hot deformation characteristics of 2205 duplex stainless steel based on the behavior of constituent phases. Mater. Des. 2010, 31, 220–226. [Google Scholar] [CrossRef]
  5. Dehghan-Manshadi, A.; Barnett, M.R.; Hodgson, P.D. Microstructural evolution during hot deformation of duplex stainless steel. Mater. Sci. Technol. 2007, 23, 1478–1484. [Google Scholar] [CrossRef] [Green Version]
  6. Evangelista, E.; McQueen, H.J.; Niewczas, M.; Cabibbo, M. Hot workability of 2304 and 2205 duplex stainless steels. Can. Metall. Q. 2004, 43, 339–353. [Google Scholar] [CrossRef]
  7. Martin, G.; Caldemaison, D.; Bornert, M.; Pinna, C.; Bréchet, Y.; Véron, M.; Mithieux, J.D.; Pardoen, T. Characterization of the High Temperature Strain Partitioning in Duplex Steels. Exp. Mech. 2013, 53, 205–215. [Google Scholar] [CrossRef]
  8. Zhao, Y.; Li, X.; Zhang, W.; Misra, R.D.K.; Liu, Z. Strain Partitioning and Softening Mechanisms of δ/γ in Lean Duplex Stainless Steels during Hot Deformation. Steel Res. Int. 2020, 91, 1900212. [Google Scholar] [CrossRef]
  9. Cho, K.; Gurland, J. The law of mixtures applied to the plastic deformation of two-phase alloys of coarse microstructures. Metall. Trans. A 1988, 19, 2027–2040. [Google Scholar] [CrossRef]
  10. Cabrera, J. Hot deformation of duplex stainless steels. J. Mater. Process. Technol. 2003, 143–144, 321–325. [Google Scholar] [CrossRef]
  11. Momeni, A.; Dehghani, K.; Zhang, X.X. Mechanical and microstructural analysis of 2205 duplex stainless steel under hot working condition. J. Mater. Sci. 2012, 47, 2966–2974. [Google Scholar] [CrossRef]
  12. Momeni, A.; Kazemi, S.; Bahrani, A. Hot deformation behavior of microstructural constituents in a duplex stainless steel during high-temperature straining. Int. J. Miner. Metall. Mater. 2013, 20, 953–960. [Google Scholar] [CrossRef]
  13. Haghdadi, N.; Martin, D.; Hodgson, P. Physically-based constitutive modelling of hot deformation behavior in a LDX 2101 duplex stainless steel. Mater. Des. 2016, 106, 420–427. [Google Scholar] [CrossRef]
  14. Siegmund, T.; Werner, E.; Fischer, F.D. On the thermomechanical deformation behavior of duplex-type materials. J. Mech. Phys. Solids 1995, 43, 495–532. [Google Scholar] [CrossRef]
  15. Schneibel, J.H.; Heilmaier, M. Hall–Petch Breakdown at Elevated Temperatures. Mater. Trans. 2014, 55, 44–51. [Google Scholar] [CrossRef] [Green Version]
  16. Kopp, R.; Luce, R.; Leisten, B.; Wolske, M.; Tschirnich, M.; Rehrmann, T.; Volles, R. Flow stress measuring by use of cylindrical compression test and special application to metal forming processes. Steel Res. 2001, 72, 394–401. [Google Scholar] [CrossRef]
  17. Fischer, F.D.; Rammerstorfer, F.G.; Bauer, F.J. Fatigue and fracture of high-alloyed steel specimens subjected to purely thermal cycling. Metall. Trans. A 1990, 21, 935–948. [Google Scholar] [CrossRef]
Figure 1. Schematic overview of the used characterisation and modelling techniques to investigate the influence of microstructure to flow stress of duplex steels within the present work.
Metals 11 01285 g001
Figure 2. Microstructures after annealing at different temperatures for 1 h and quenching in water to achieve different ratios of ferrite and austenite volume fraction for (a) 1000 °C, (b) 1050 °C, (c) 1100 °C, (d) 1130 °C, (e) 1170 °C and (f) 1200 °C. Ferrite is depicted as grey and austenite as white.
Metals 11 01285 g002
Figure 3. True stress vs. true strain curves from compression tests for different ferrite starting volume fractions at 1100 °C and 0.1 s−1. Dashed lines indicate original data and continuous lines indicate smoothed data as inputs for the model.
Metals 11 01285 g003
Figure 4. (a) Initial and final ferrite fraction measured by the line section method or ferritscope for the different solution annealing temperatures T s o l . (b) Initial and final ferrite fraction for material condition of 60% (1100 °C) and 75% (1200 °C) and evolution of ferrite fraction during pre-heating, as well as during the compression test of 84% (1250 °C).
Metals 11 01285 g004
Figure 5. Microstructures after compression tests at 1100 °C and 0.1 s−1 with an initial ferrite volume fraction of (a) 57%, (b) 58%, (c) 60%, (d) 62%, (e) 71% and (f) 75%. Ferrite is depicted as grey and austenite as white.
Metals 11 01285 g005
Figure 6. Microstructures before and during the compression test at 1100 °C and 0.1 s−1 with an initial ferrite volume fraction of (a) 84%, (b) 59% after 300 s pre-heating at 1100 °C, (c) 57% after φ = 0.2 , (d) 56% after φ = 0.8 . Ferrite is depicted as grey and austenite as white. (e) Phase distribution before and after pre-heating of 300 s before compression test for initial ferrite volume fraction of 84%.
Metals 11 01285 g006
Figure 7. (a) Linearly interpolated mean phase distances for the investigated material conditions used as inputs for the duplex model (b) Linearly interpolated ferrite fractions for the investigated material conditions used as inputs for the duplex model.
Metals 11 01285 g007
Figure 8. (a) Basic true stress vs. true strain curves calculated from different material condition combinations and averaged curves for ferrite and austenite. (b) Mean single-phase basic stress-strain curves and single-phase curves considering mean phase distance, as well as stress-strain curves for duplex material with 57% ferrite from experiment and duplex model.
Metals 11 01285 g008
Figure 9. (a) Comparison of experimental and calculated stress-strain curves of material conditions that were used to calculate the mean single-phase curves. (b) Comparison of experimental and calculated stress-strain curves of material conditions that are inter- (int) and extrapolated (ext) with the duplex model.
Metals 11 01285 g009
Figure 10. (a) Sensitivity study of fitting parameters for the duplex model for (a) constant initial ferrite fractions and Hall-Petch parameter of 10, (b) decreasing ferrite fractions during compression and Hall-Petch parameter of 10 MPaµm1/2 and (c) decreasing ferrite fractions during compression and Hall-Petch parameter of 20 MPaµm1/2.
Metals 11 01285 g010
Table 1. Steel composition in weight percent, measured by spectral analysis.
CMnCrNiMoNSi
0.0191.62421.8964.8843.2720.1180.421
Table 2. Microstructure parameters of the duplex material after solution annealing of 1 h at different temperatures and after forming at 1100 °C and 1 s−1 measured from optical microscopy.
Annealing Temperature [°C] γ + δ Mean Phase Distance before Forming [µm] γ + δ Mean Phase Distance after Forming [µm] Ferrite Fraction before Forming
[−]
Ferrite Fraction after Forming [−]
---0.49 ± 0.10-
10006.54 ± 0.6212.18 ± 1.250.57 ± 0.090.58 ± 0.01
10507.20 ± 0.1113.54 ± 0.830.58 ± 0.130.59 ± 0.02
11009.71 ± 0.8517.98 ± 1.770.60 ± 0.120.59 ± 0.01
113012.07 ± 0.4918.19 ± 1.760.62 ± 0.120.58 ± 0.01
117017.53 ± 0.2022.17 ± 3.210.71 ± 0.110.59 ± 0.01
120021.16 ± 1.5219.94 ± 3.080.75 ± 0.120.58 ± 0.01
125032.54 ± 3.7114.38 ± 0.510.84 ± 0.110.56 ± 0.09
Table 3. Microstructure parameters of the material condition of 84% initial ferrite fraction after solution annealing of 1 h at 1250 °C and during forming at 1100 °C and 1 s−1 measured via optical microscopy and ferritscope.
Strain [−]Annealing Time [s] γ   &   δ Mean Phase Distance [µm] Ferrite Fraction [−]
0032.54 ± 3.710.84 ± 0.11
030012.54 ± 1.680.59 ± 0.09
0.230211.67 ± 1.420.57 ± 0.09
0.830814.38 ± 0.510.56 ± 0.09
Table 4. Microstructure parameters for modelling the flow curves of duplex steels with different phase distributions.
Annealing Temperature [°C] γ + δ Mean Phase Distance before Forming [µm] γ + δ Mean Phase Distance before Forming [µm] Ferrite Fraction before Forming
[−]
Ferrite Fraction after Forming [−]
10007120.570.57
10507140.580.58
110010180.580.58
113012180.590.59
117018220.630.60
120021200.630.60
12507140.630.60
Table 5. Input parameters for the Zener–Hollomon equation from the literature, data from [2], for single-phase austenite and ferrite to validate the single-phase results of the duplex model.
Phase A α [MPa−1] n [−] Q [kJ/mol]
Austenite1.6 × 10150.00824.75410
Ferrite3.52 × 10110.01153.156261
Publisher’s Note: MDPI stays neutral with regard to jurisdictional claims in published maps and institutional affiliations.

