
A Kinetic Study on the Reduction of Single Magnetite Particle with Melting Products at High Temperature Based on Visual and Surface Analytical Techniques


Abstract
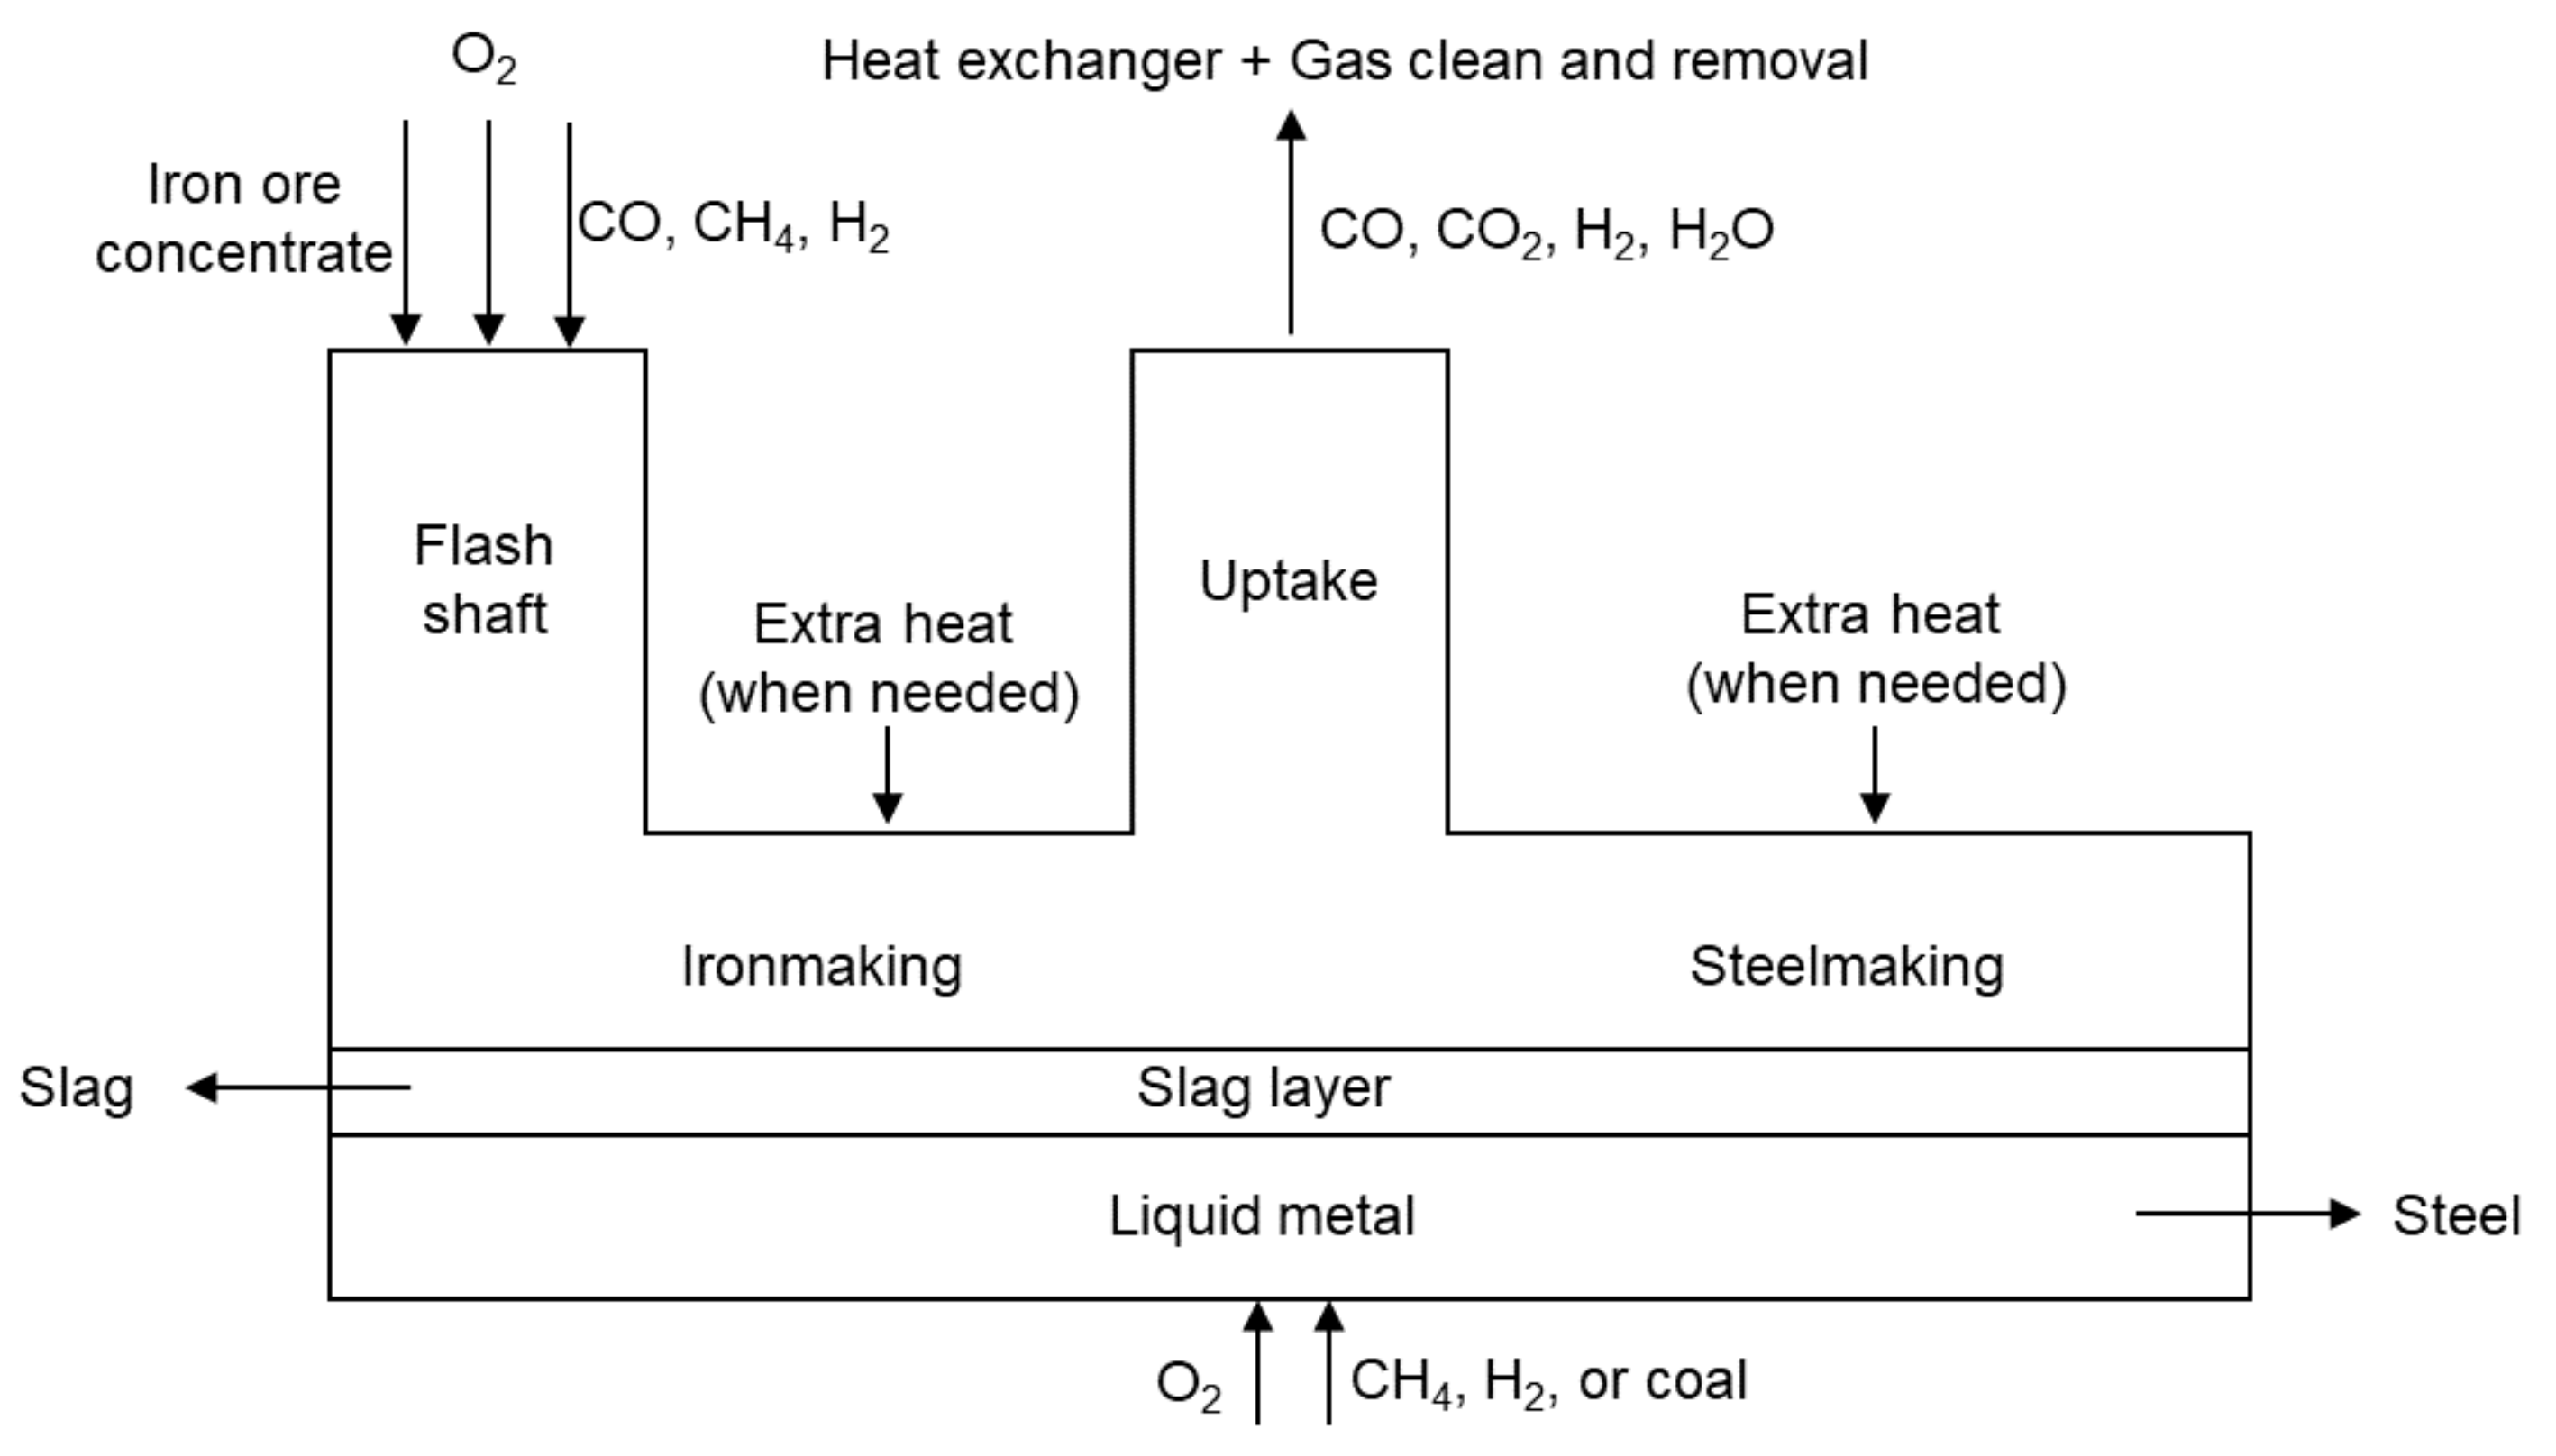
:1. Introduction
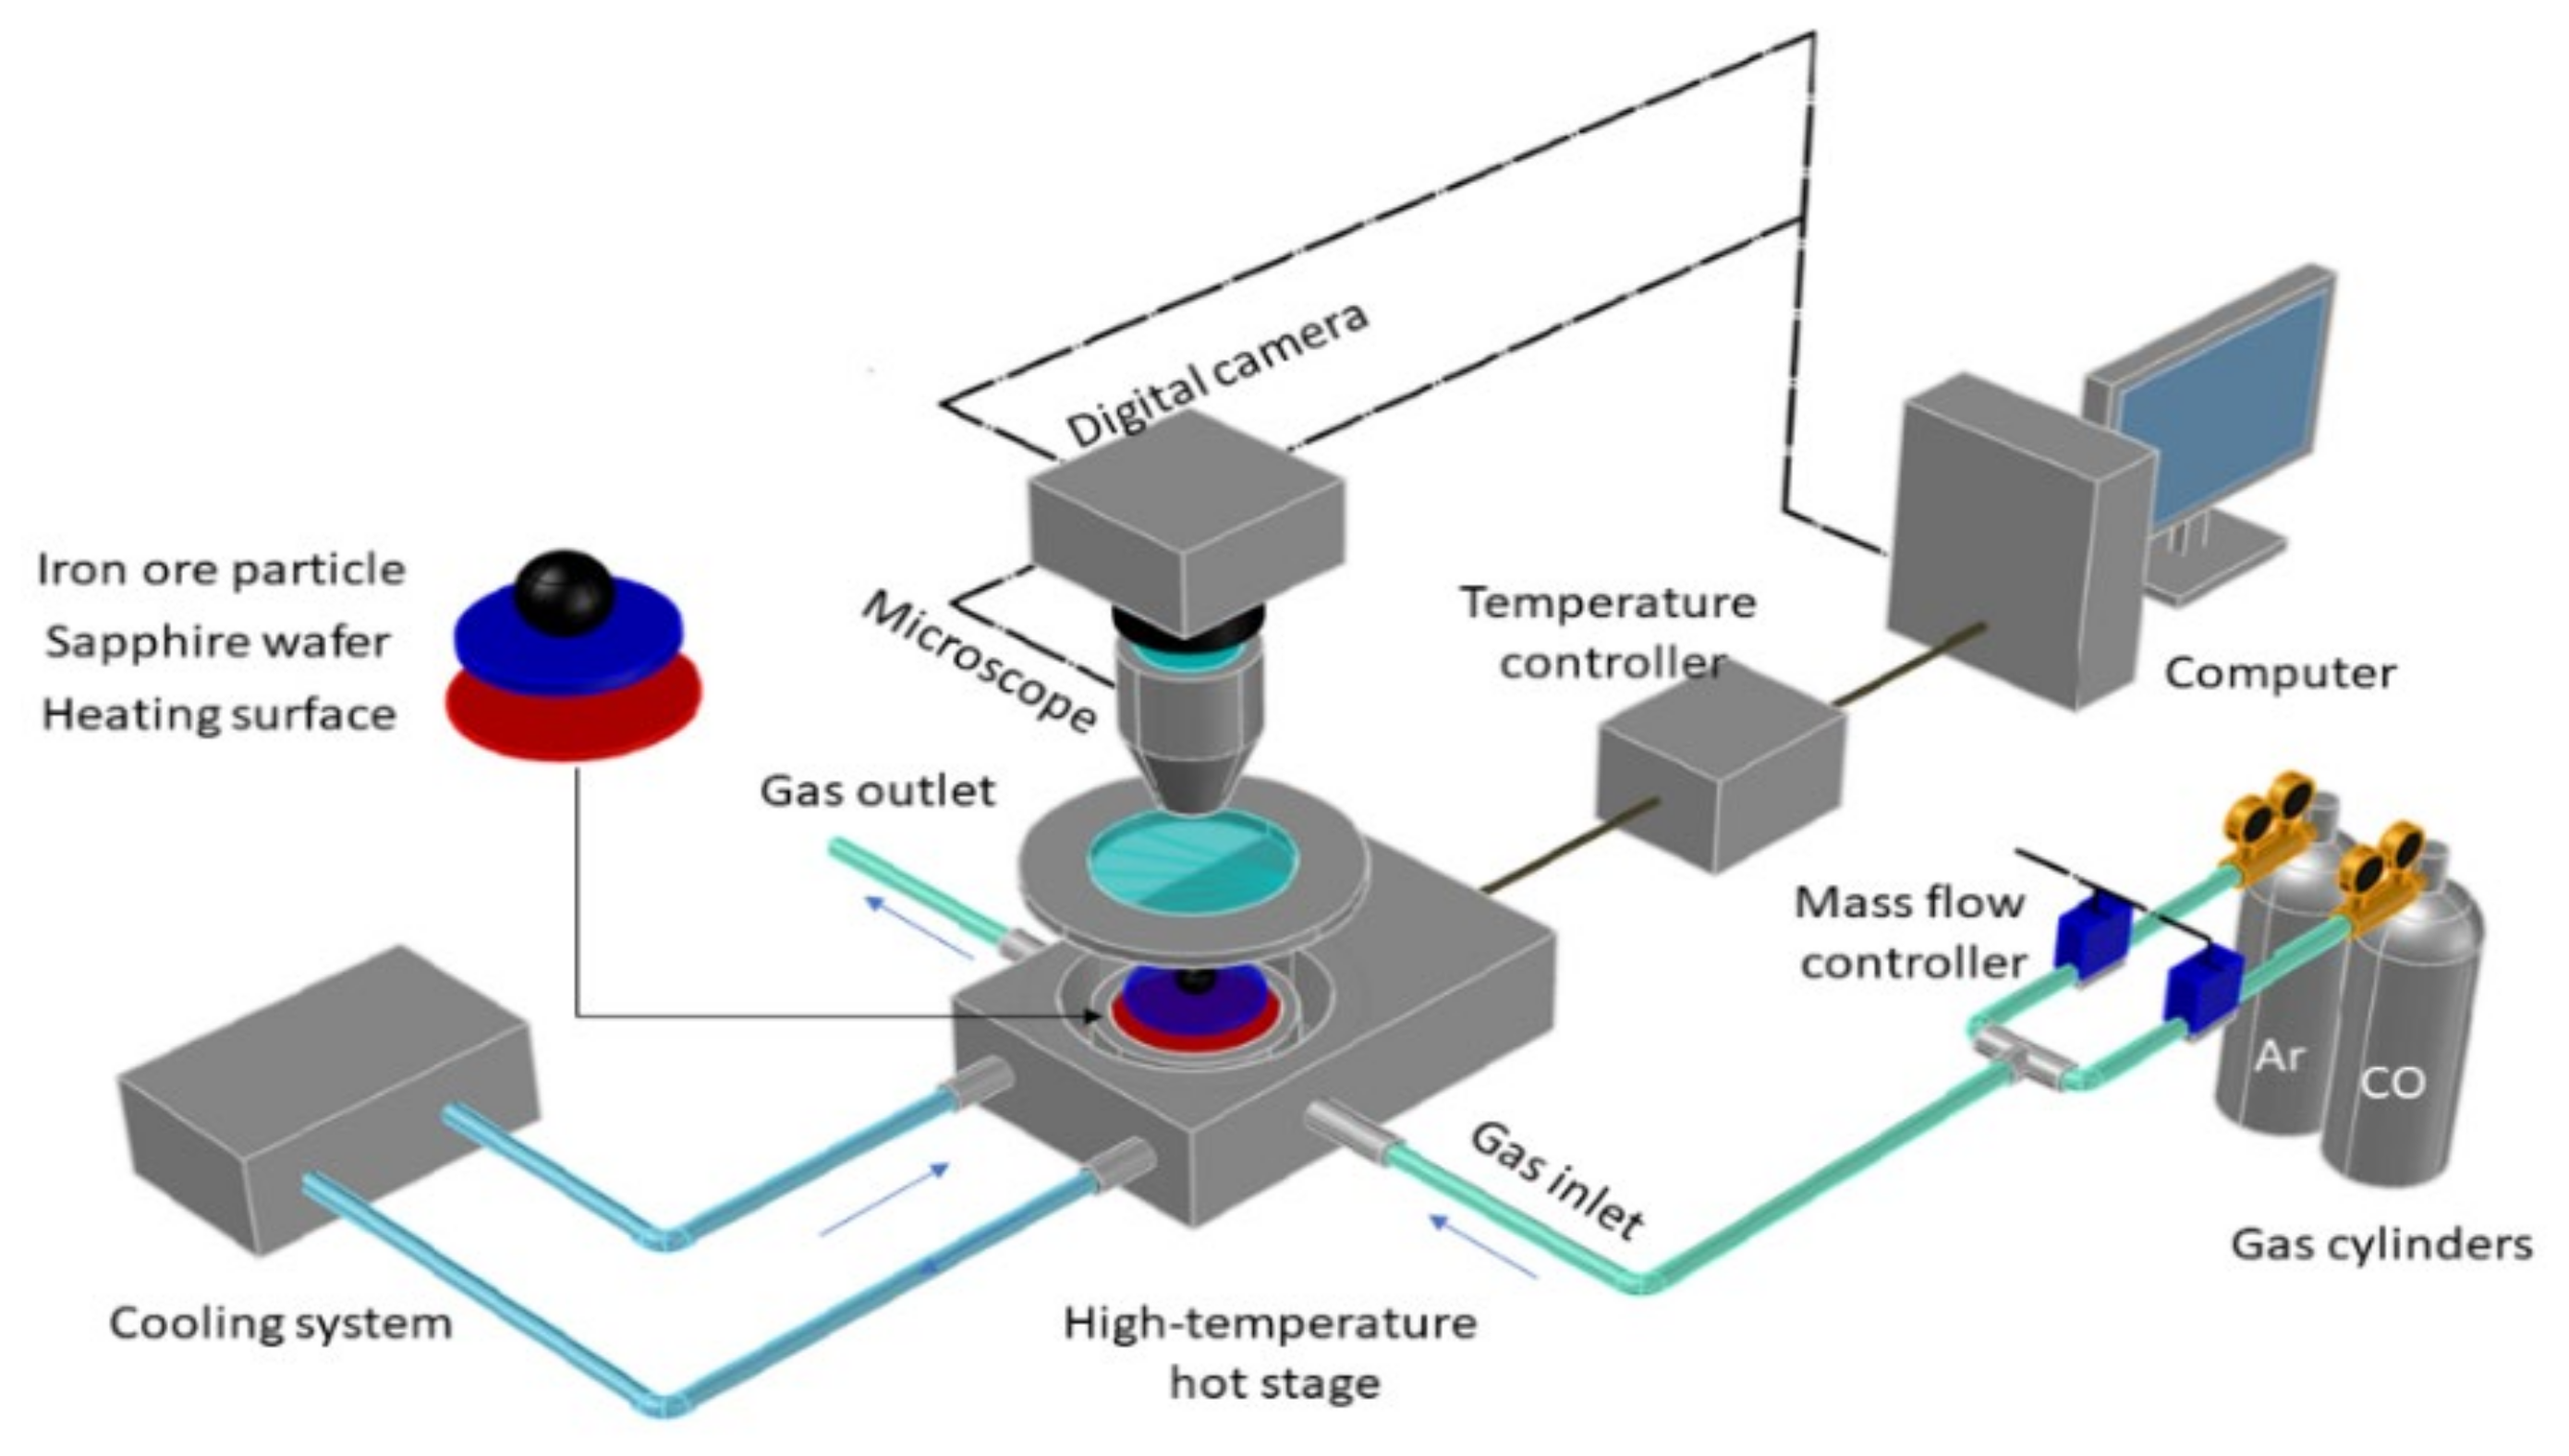
2. Materials and Methods
3. Results
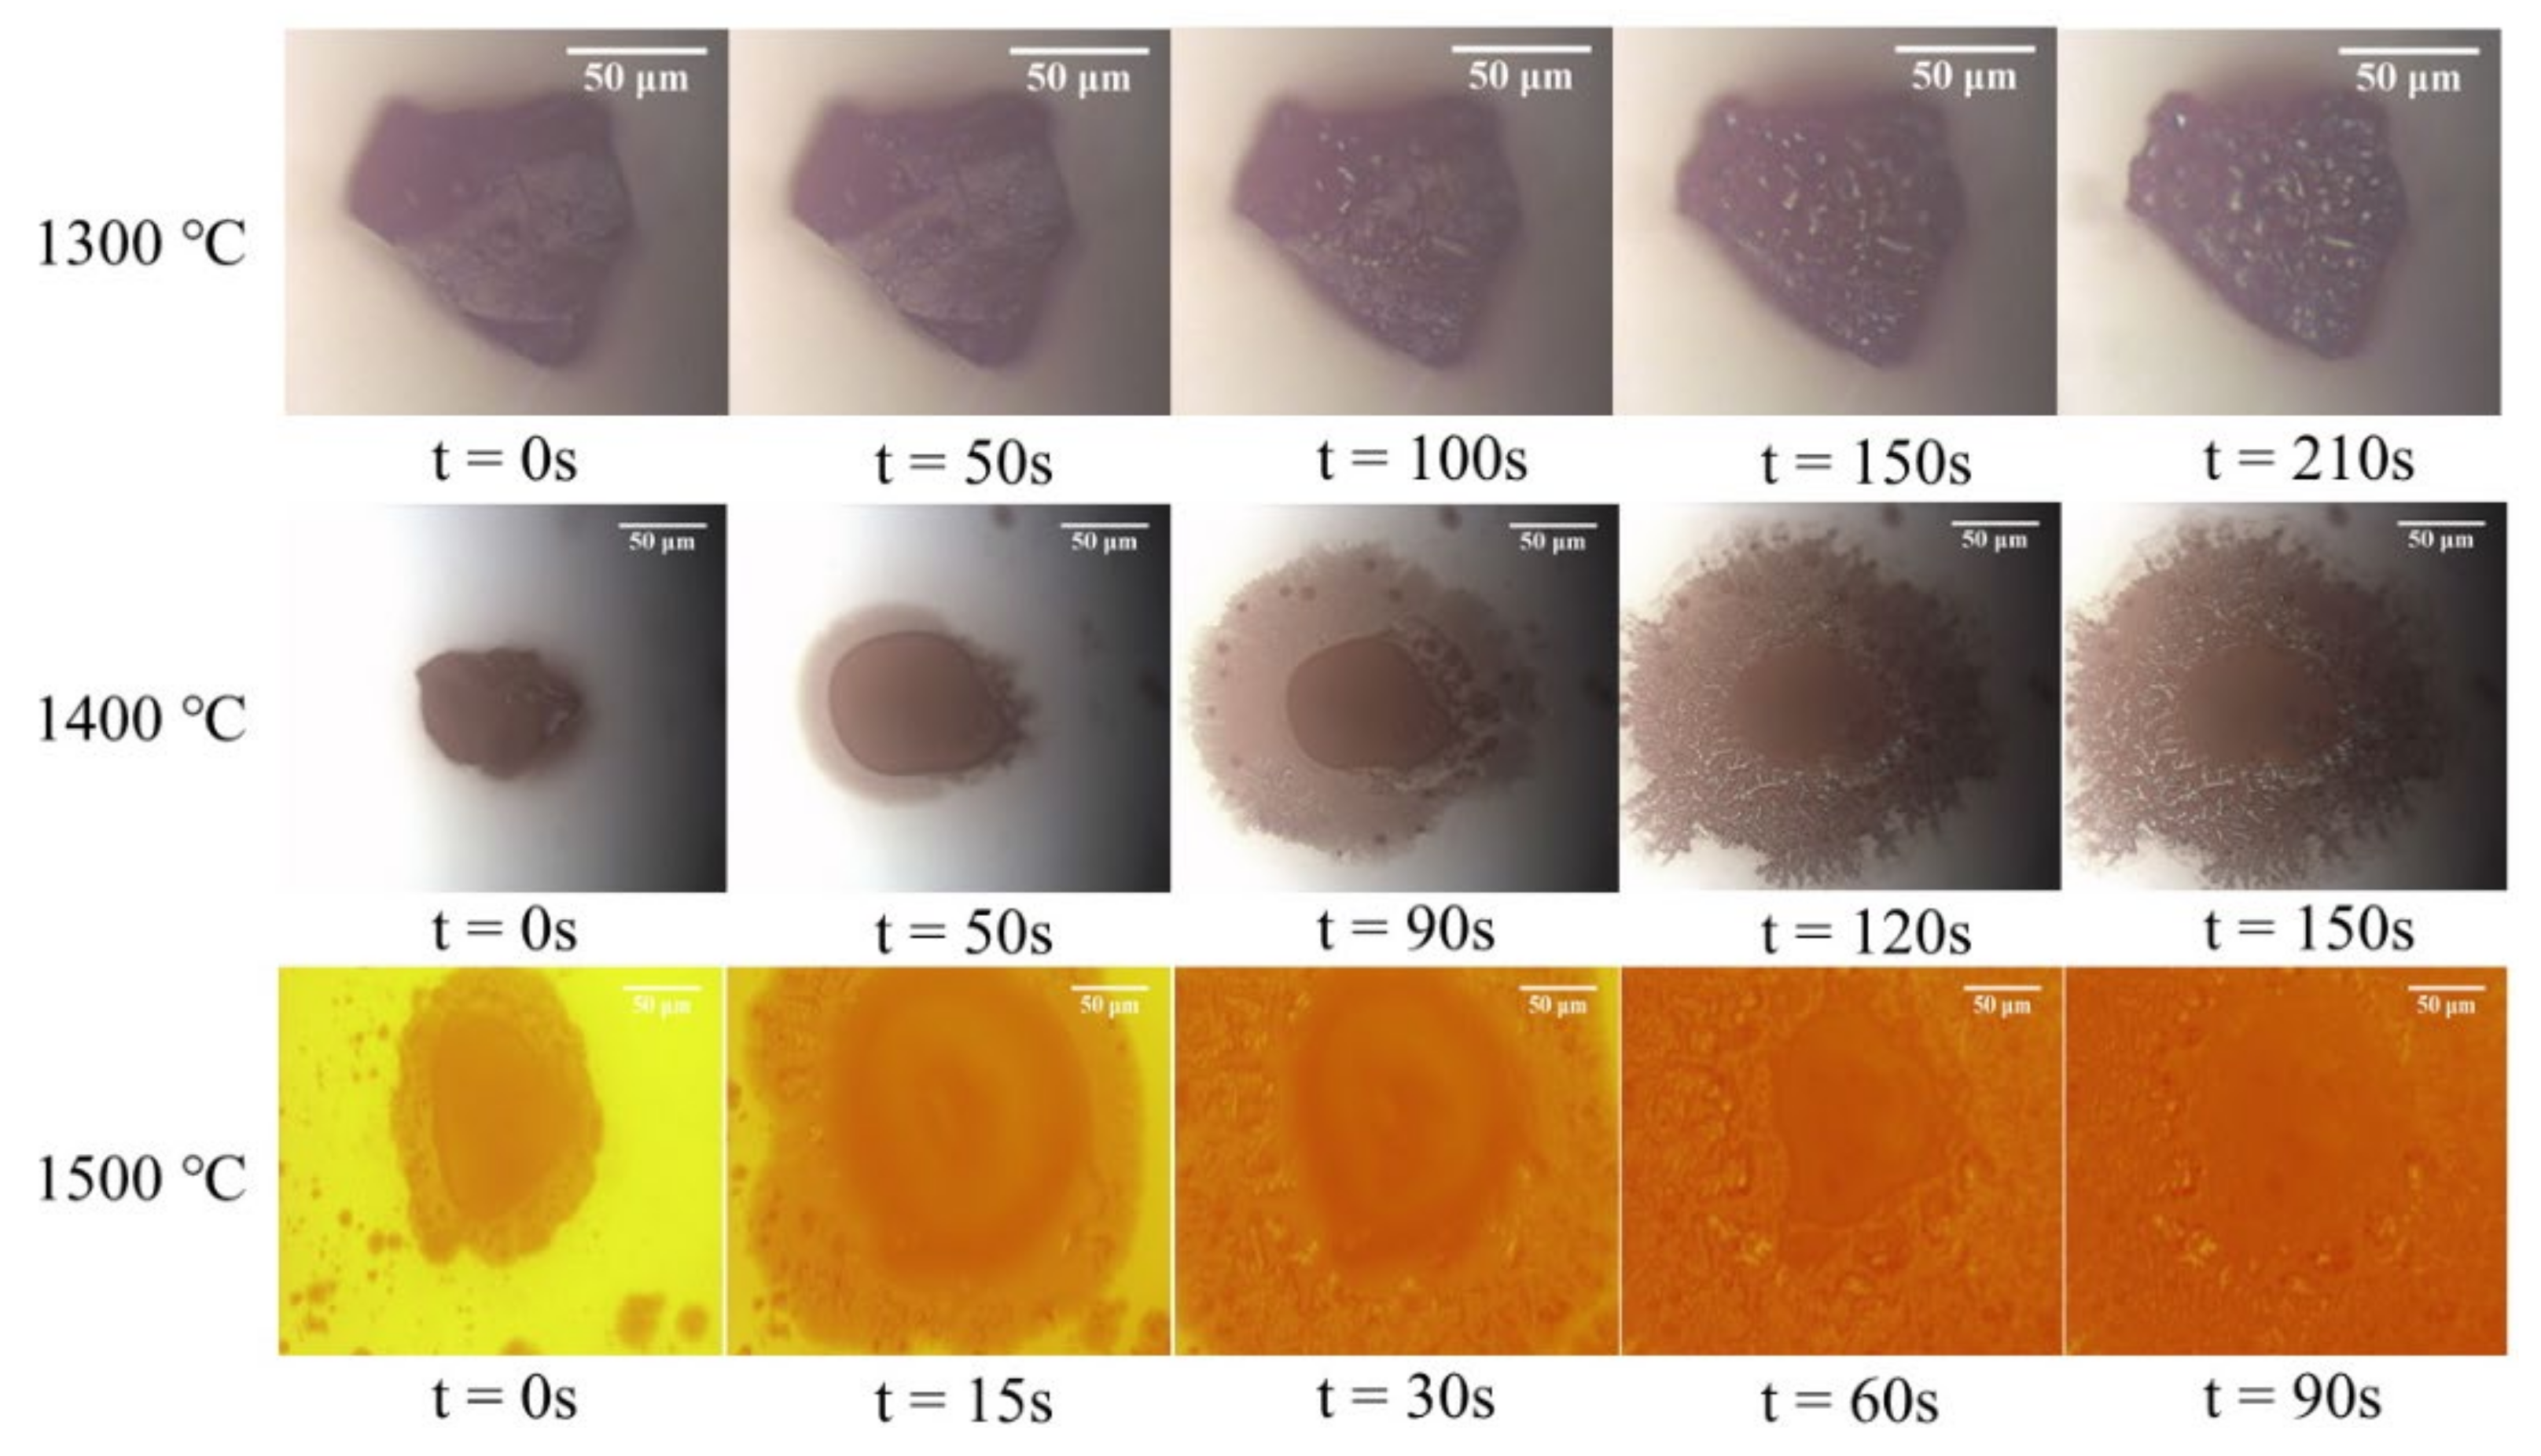
3.1. Single Particle Reduction Process
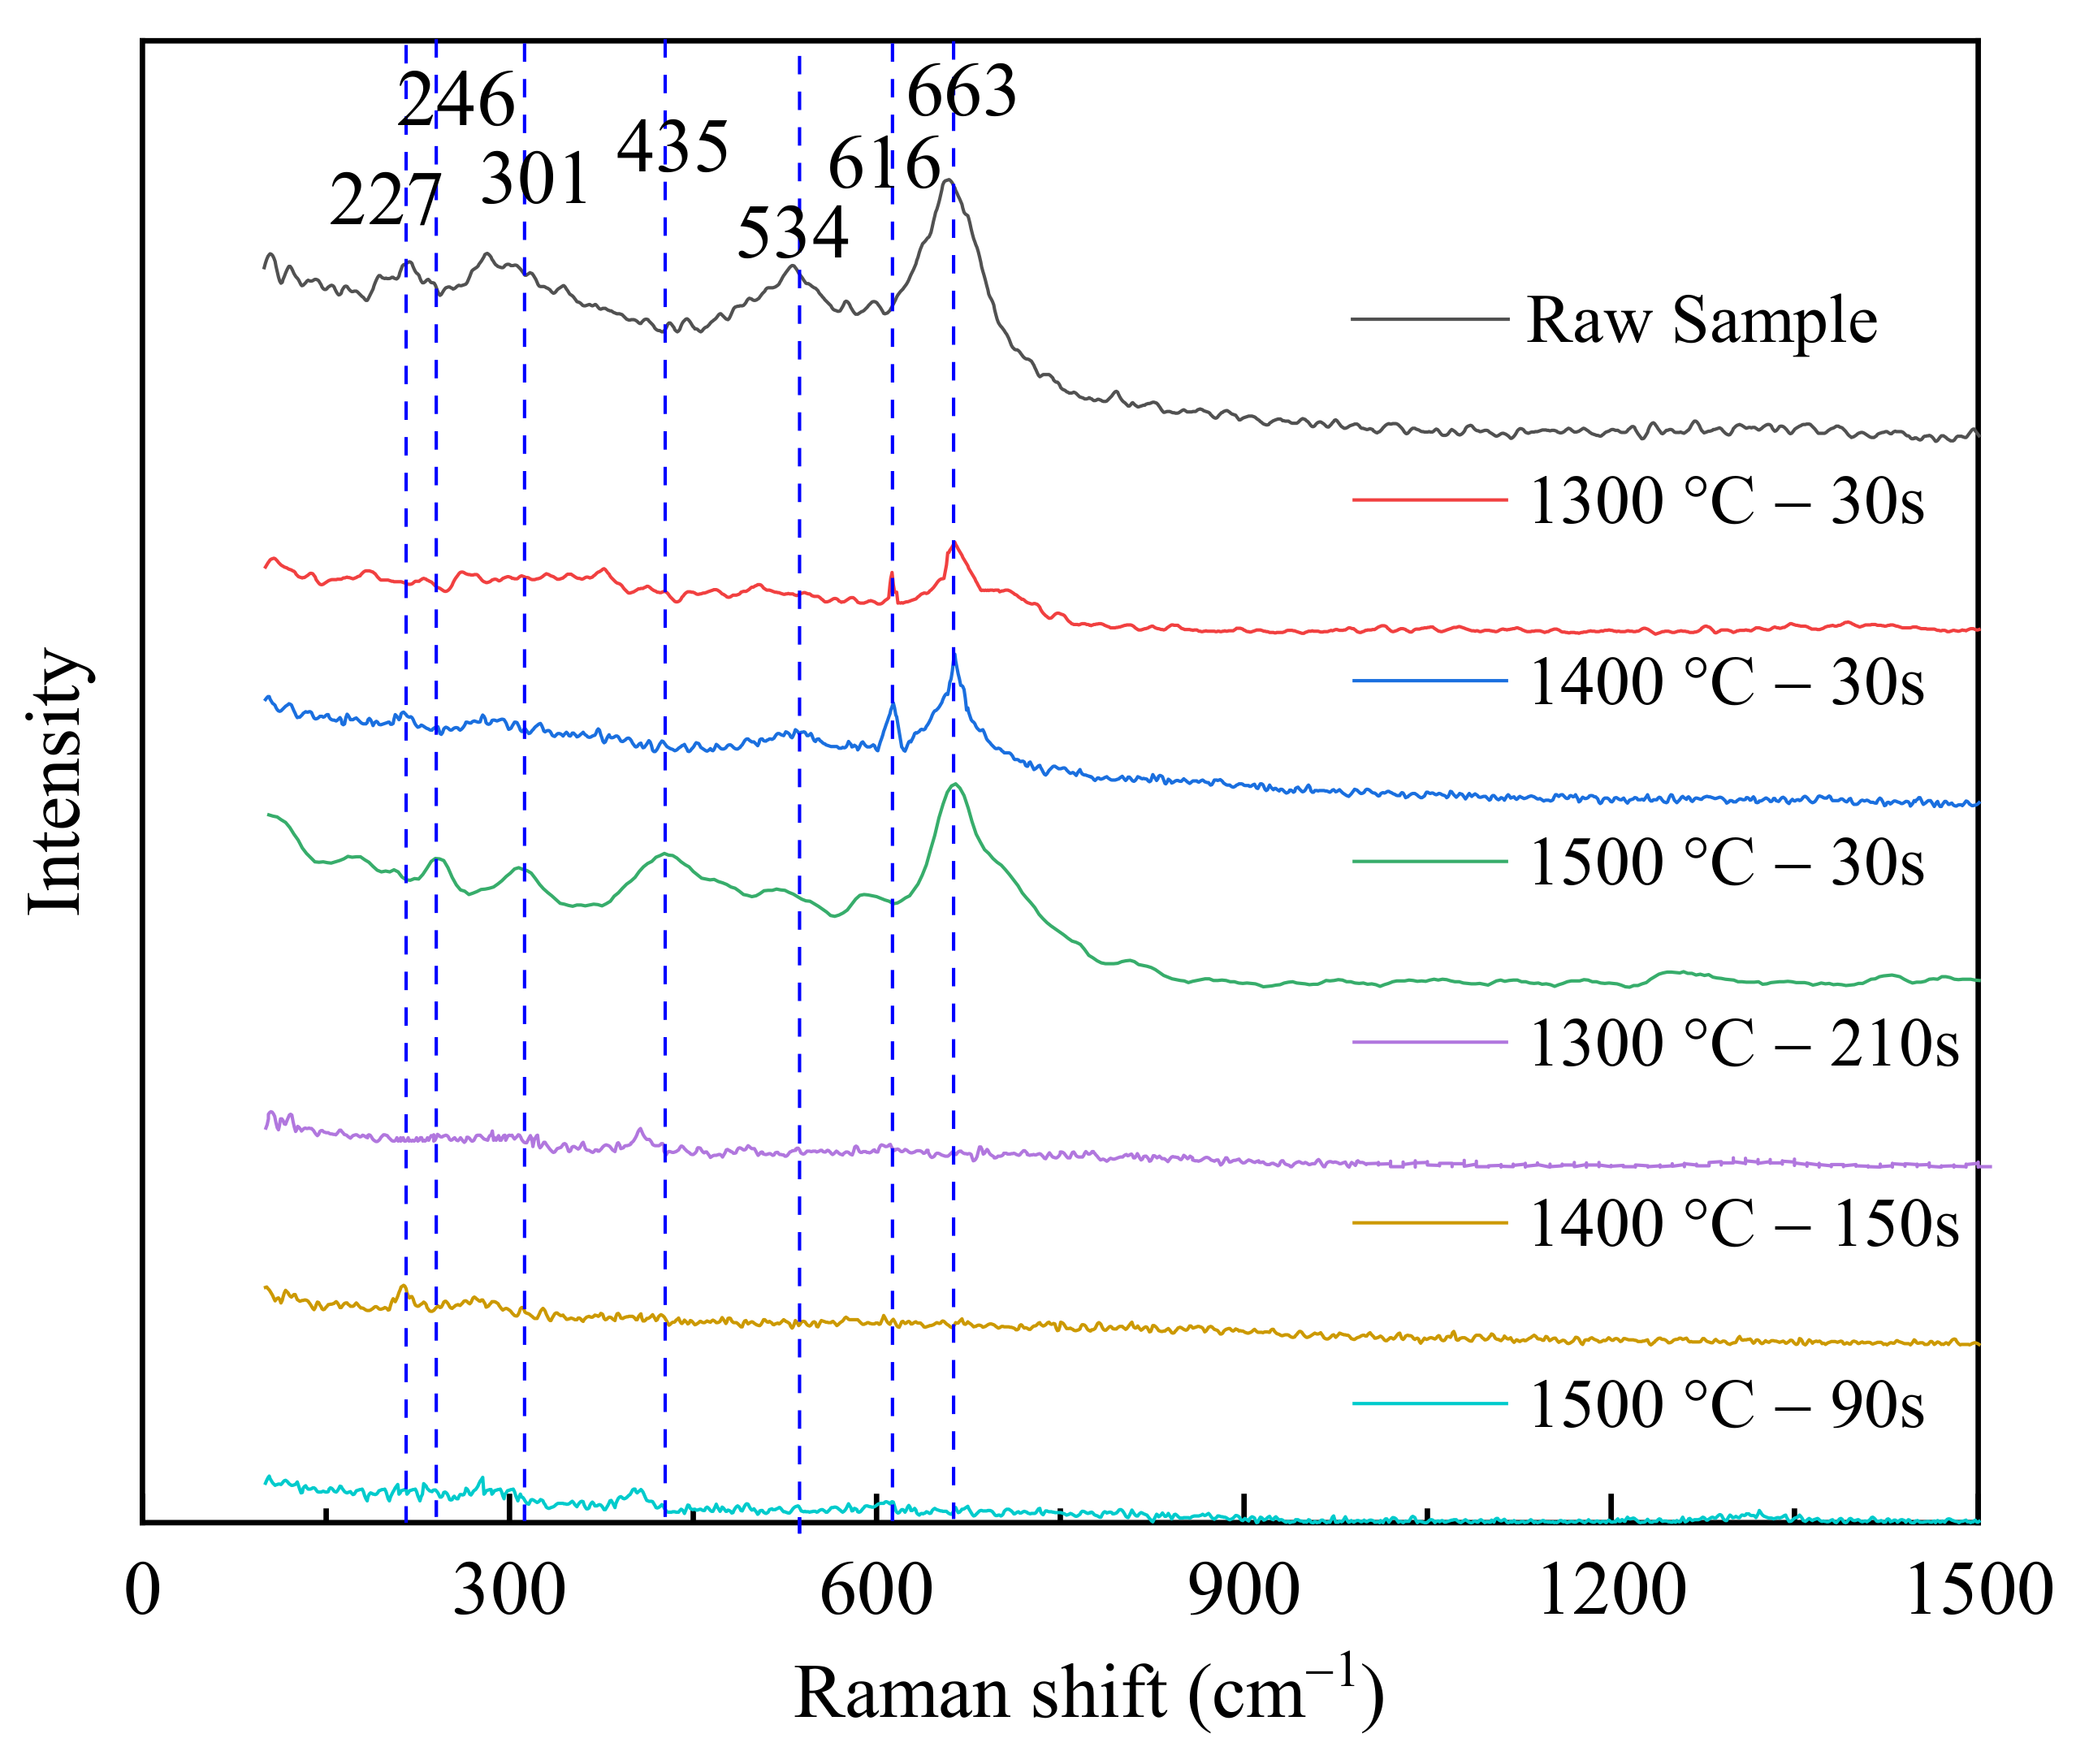
3.2. Raman Analysis
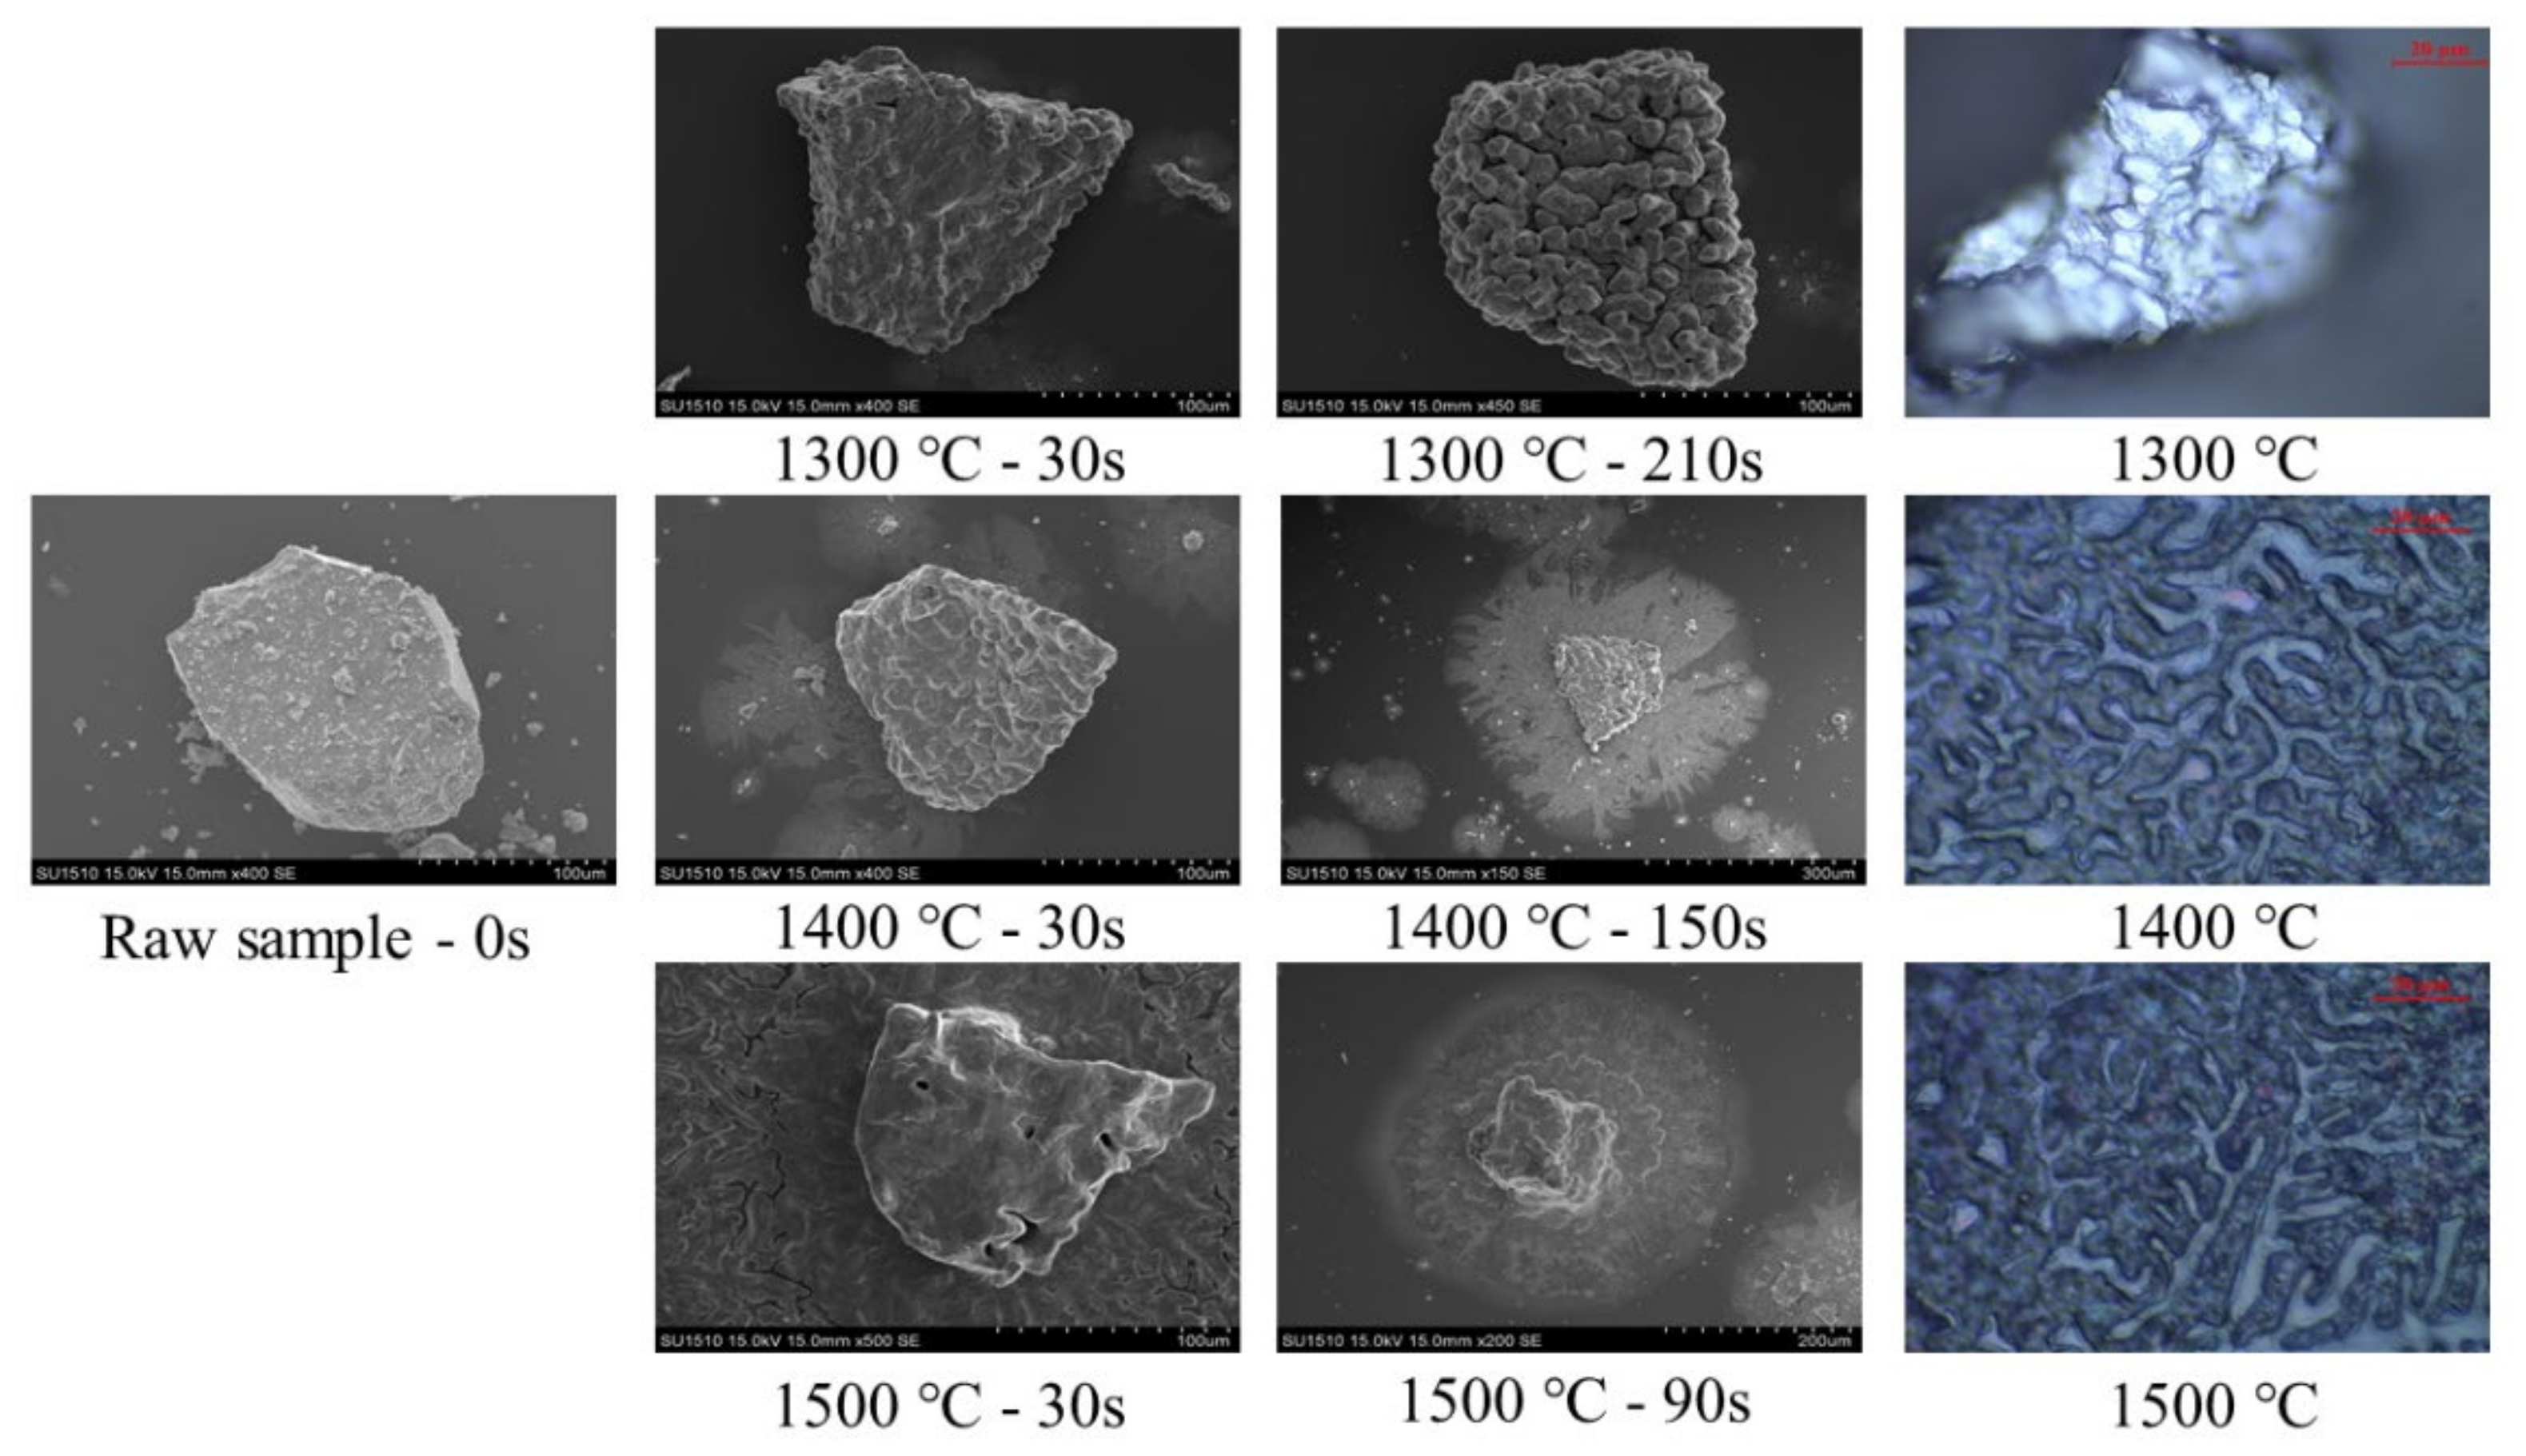
3.3. Particle Morphologies
4. Discussion
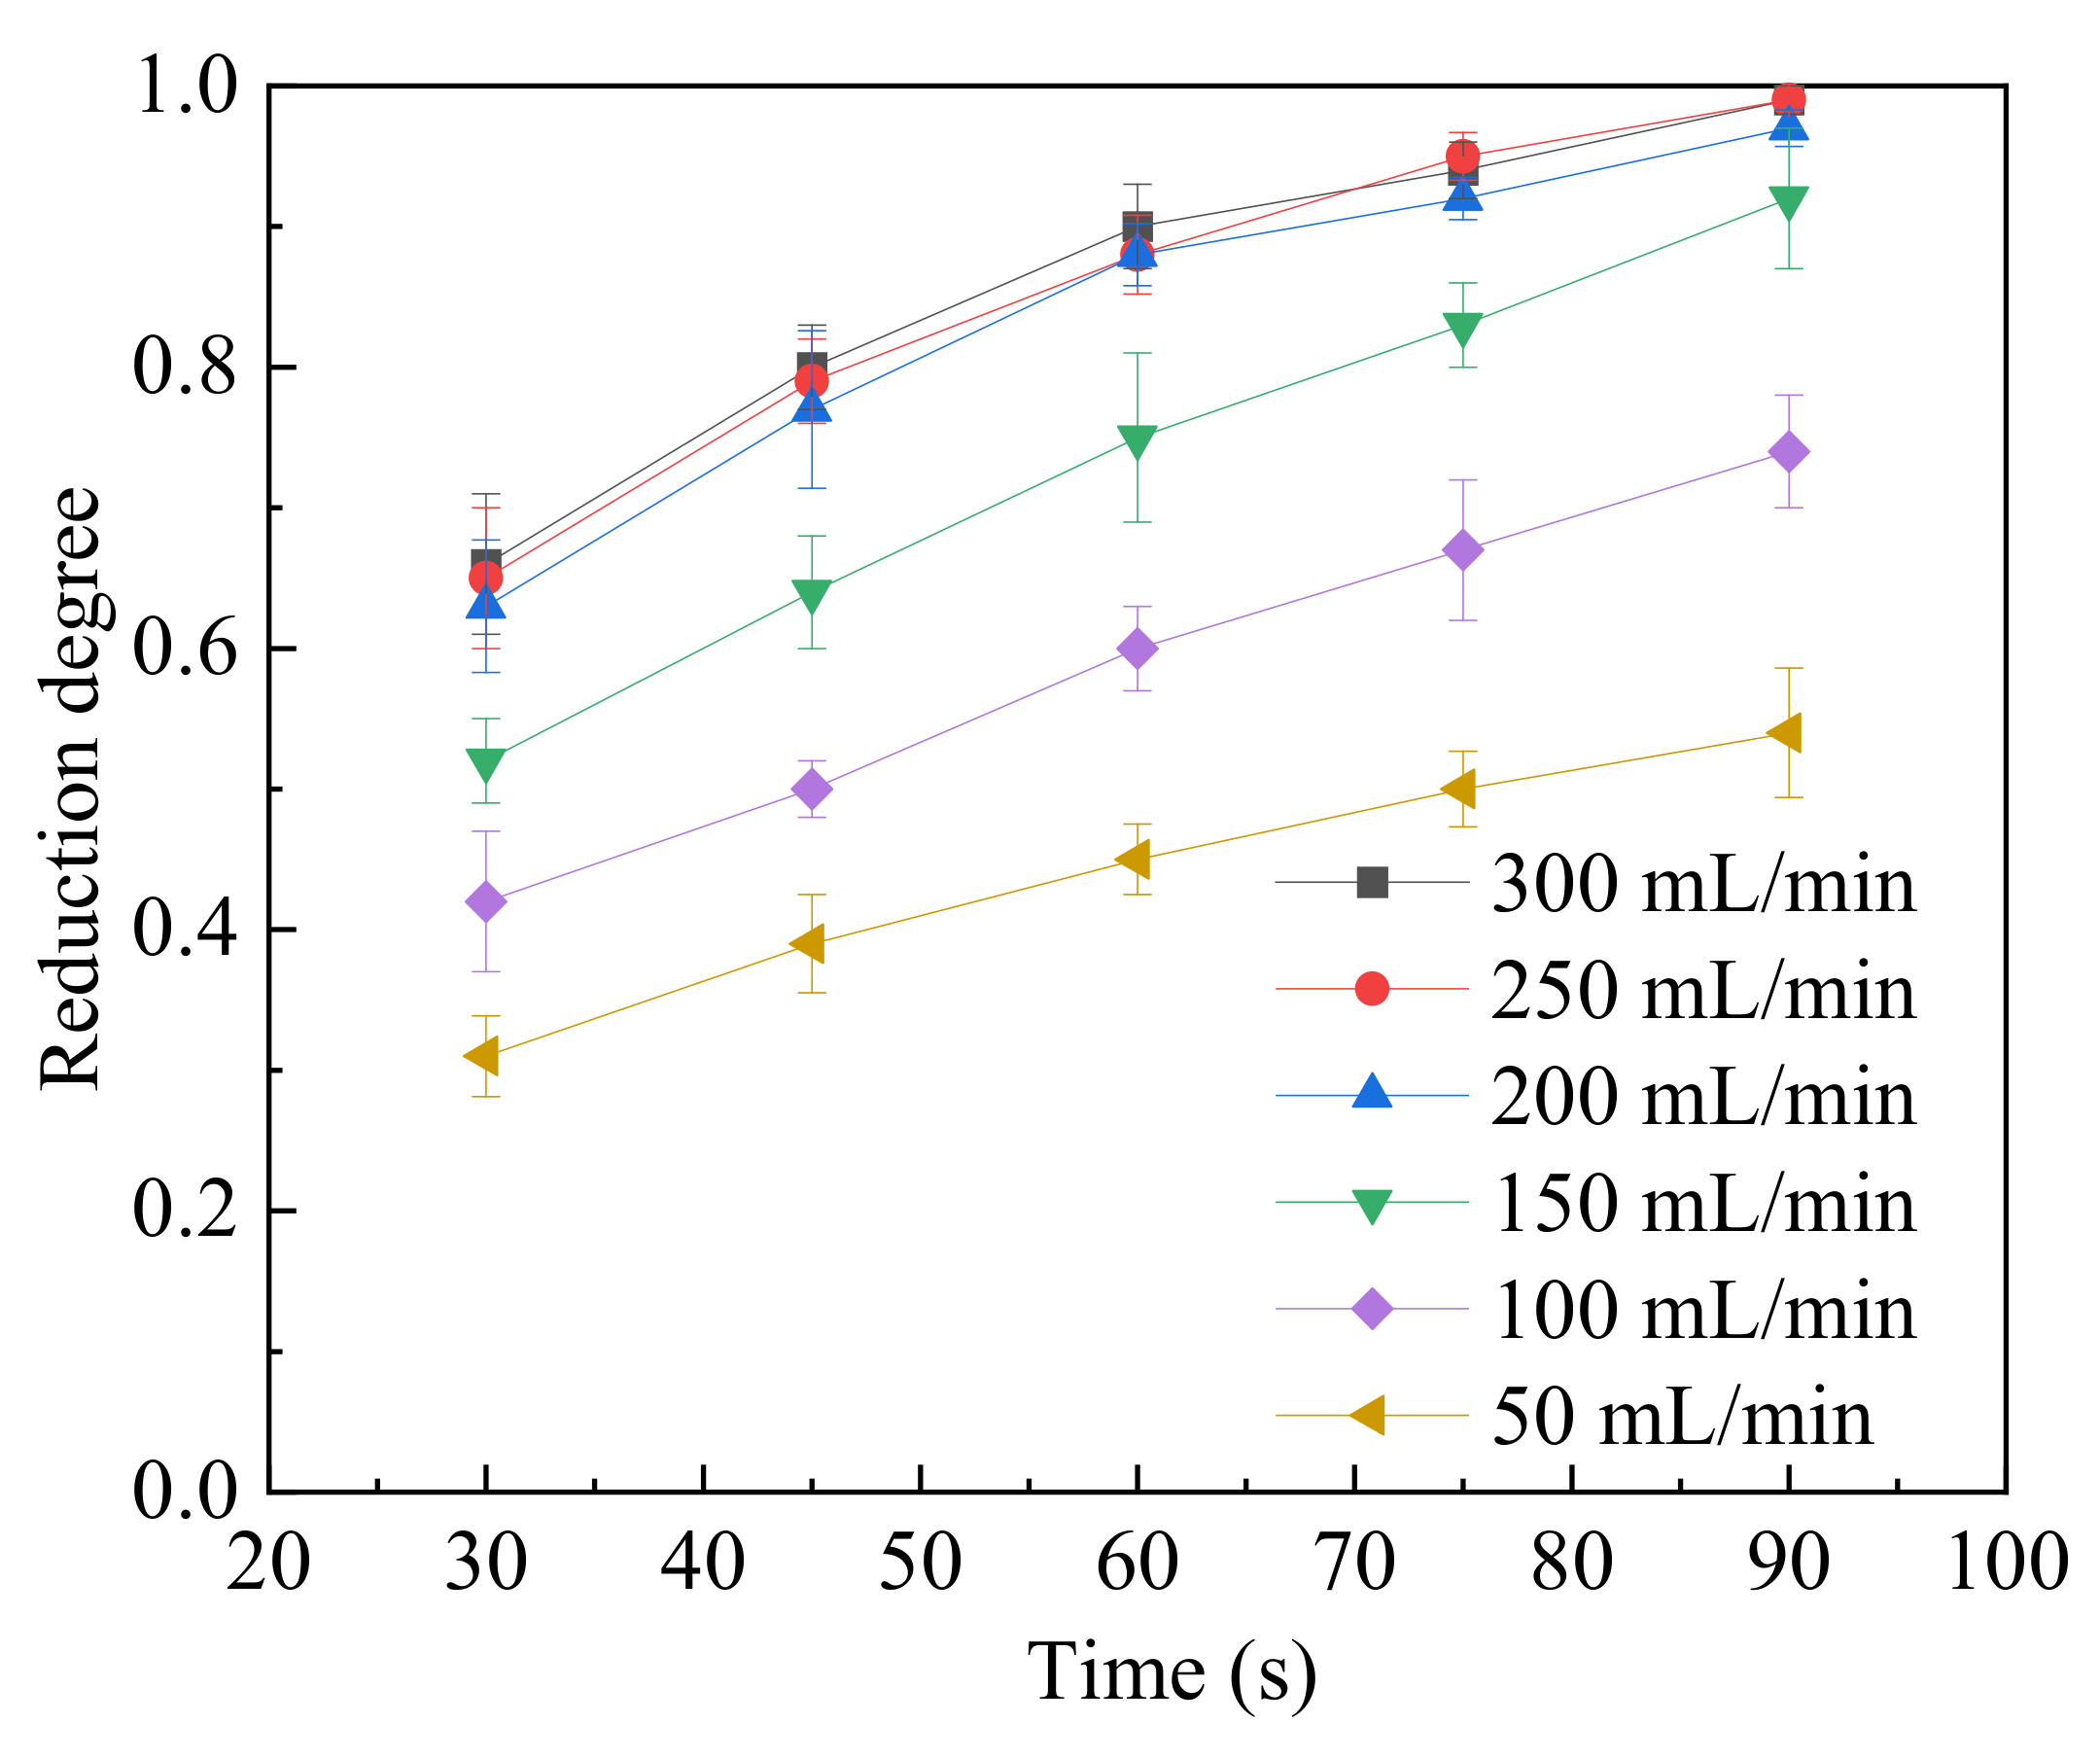
4.1. Effect of Gas Flowrate
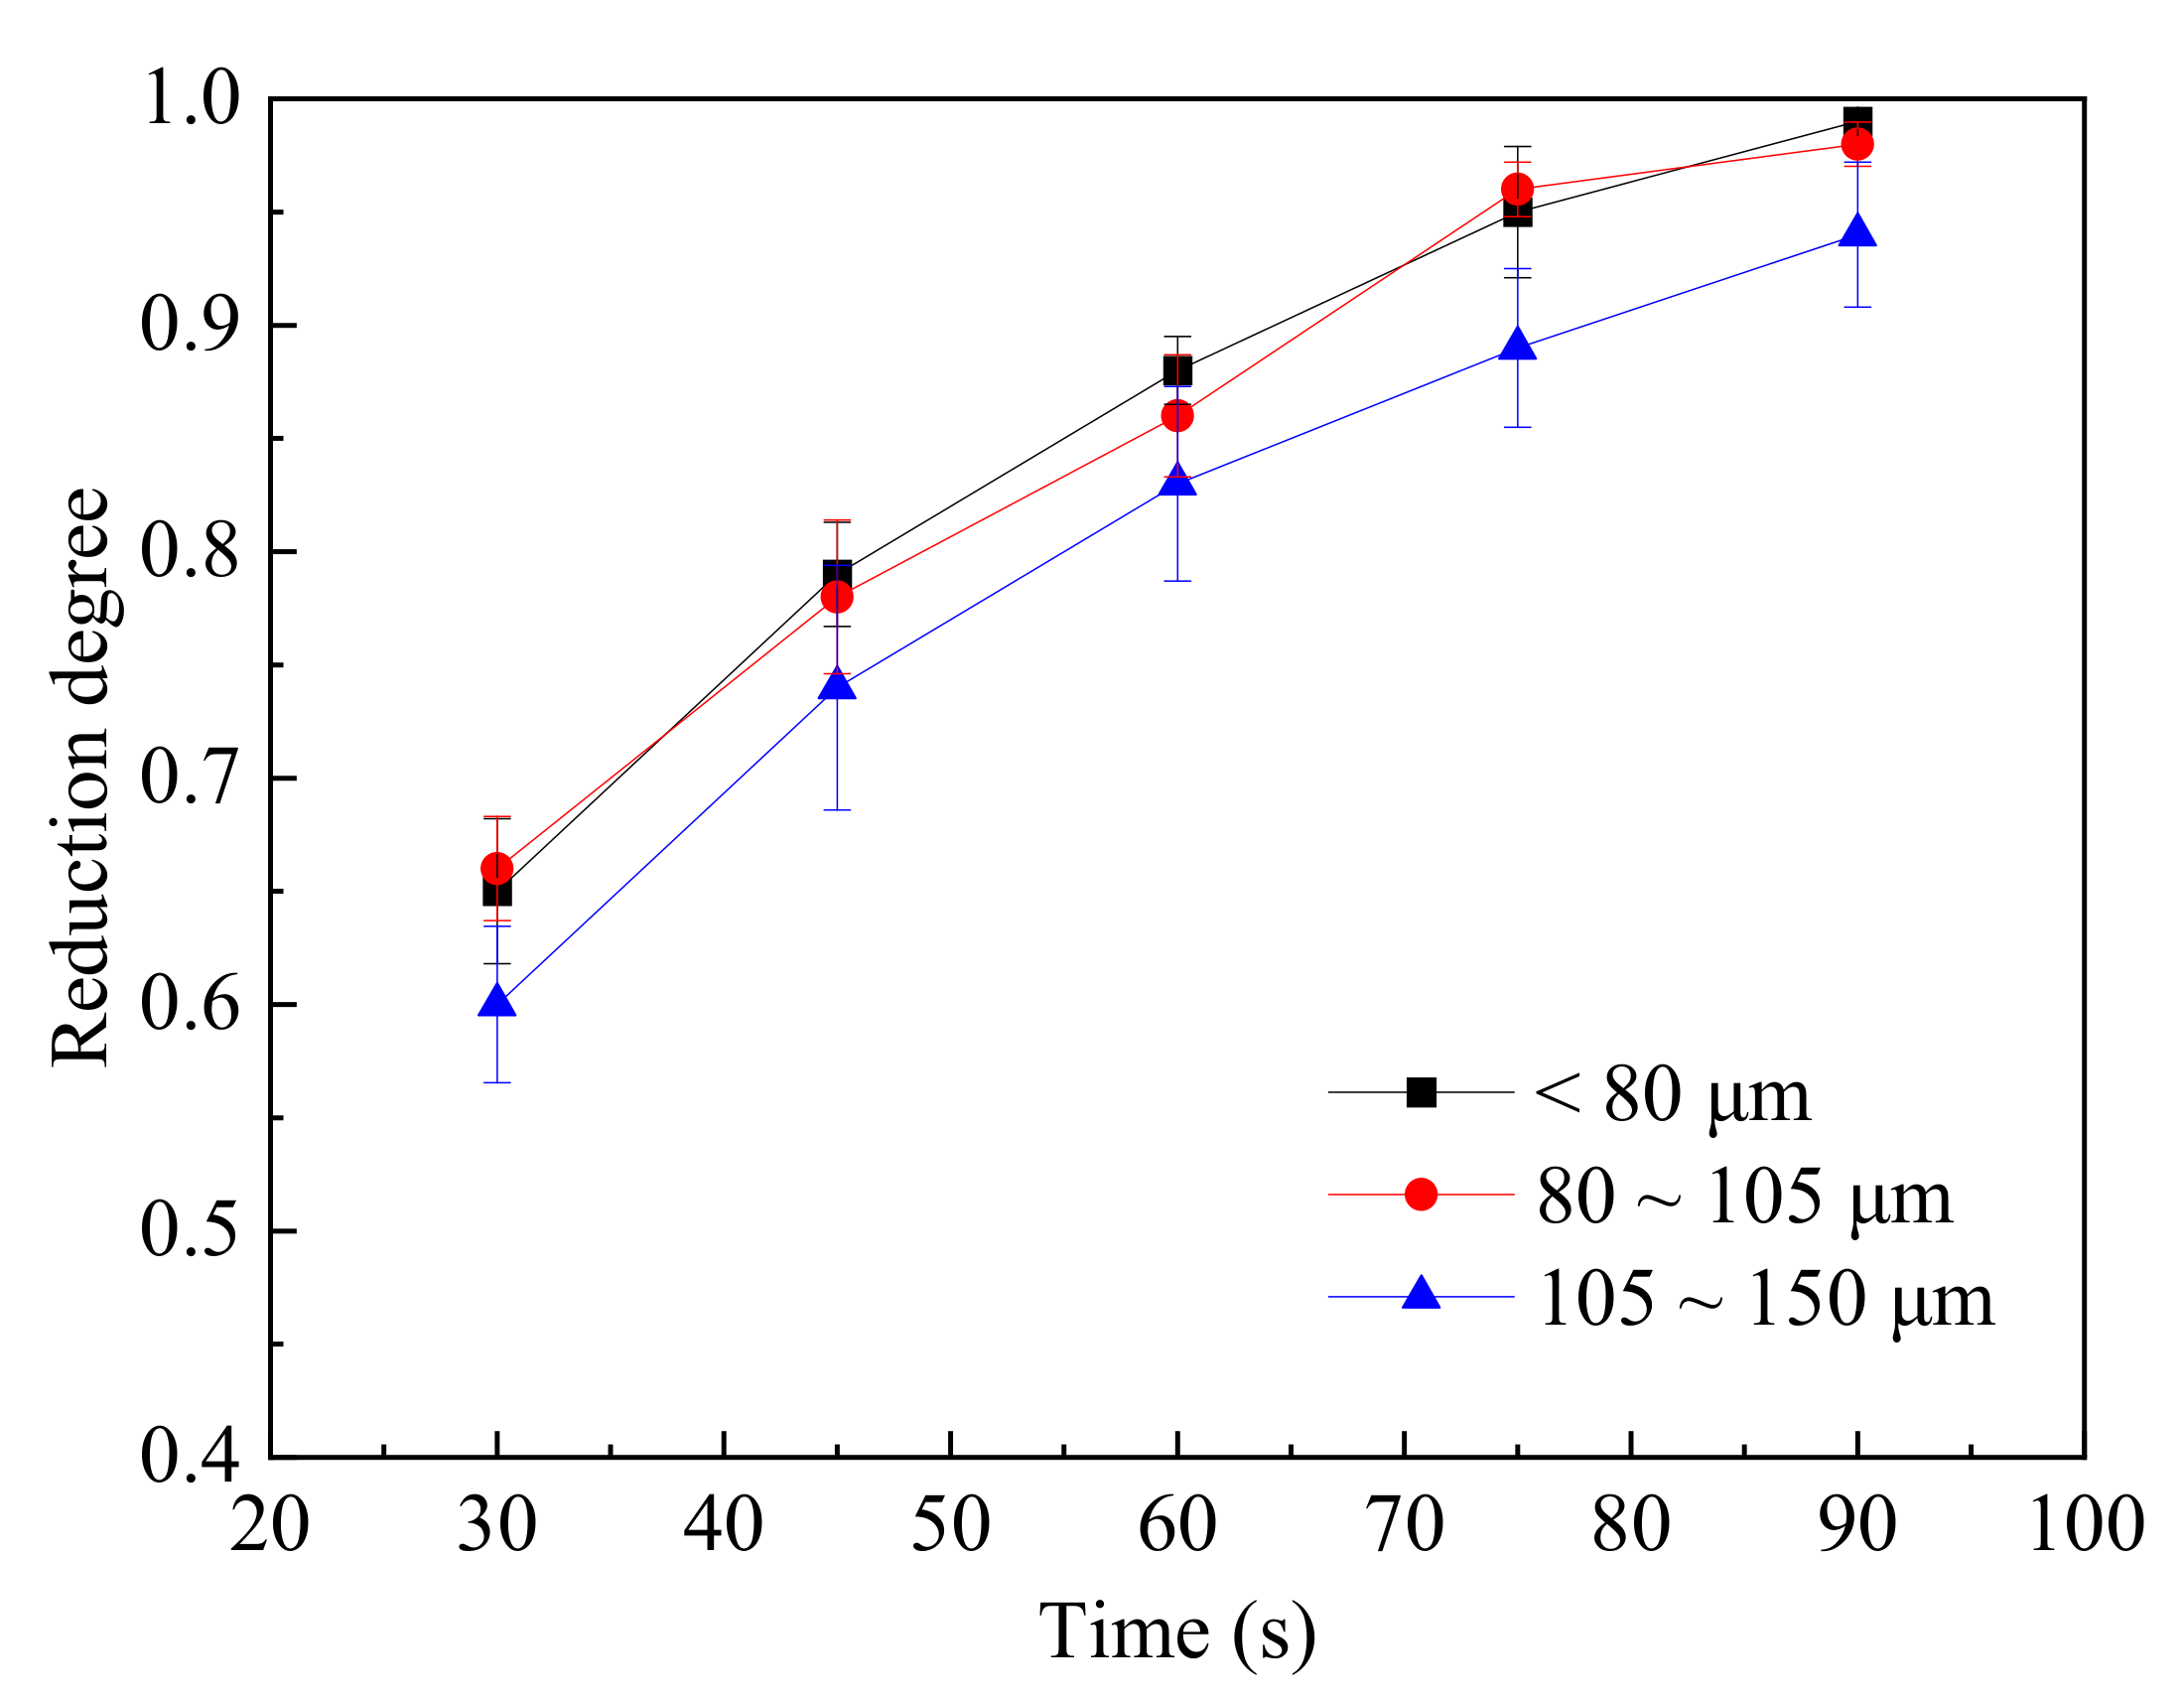
4.2. Effect of Particle Size
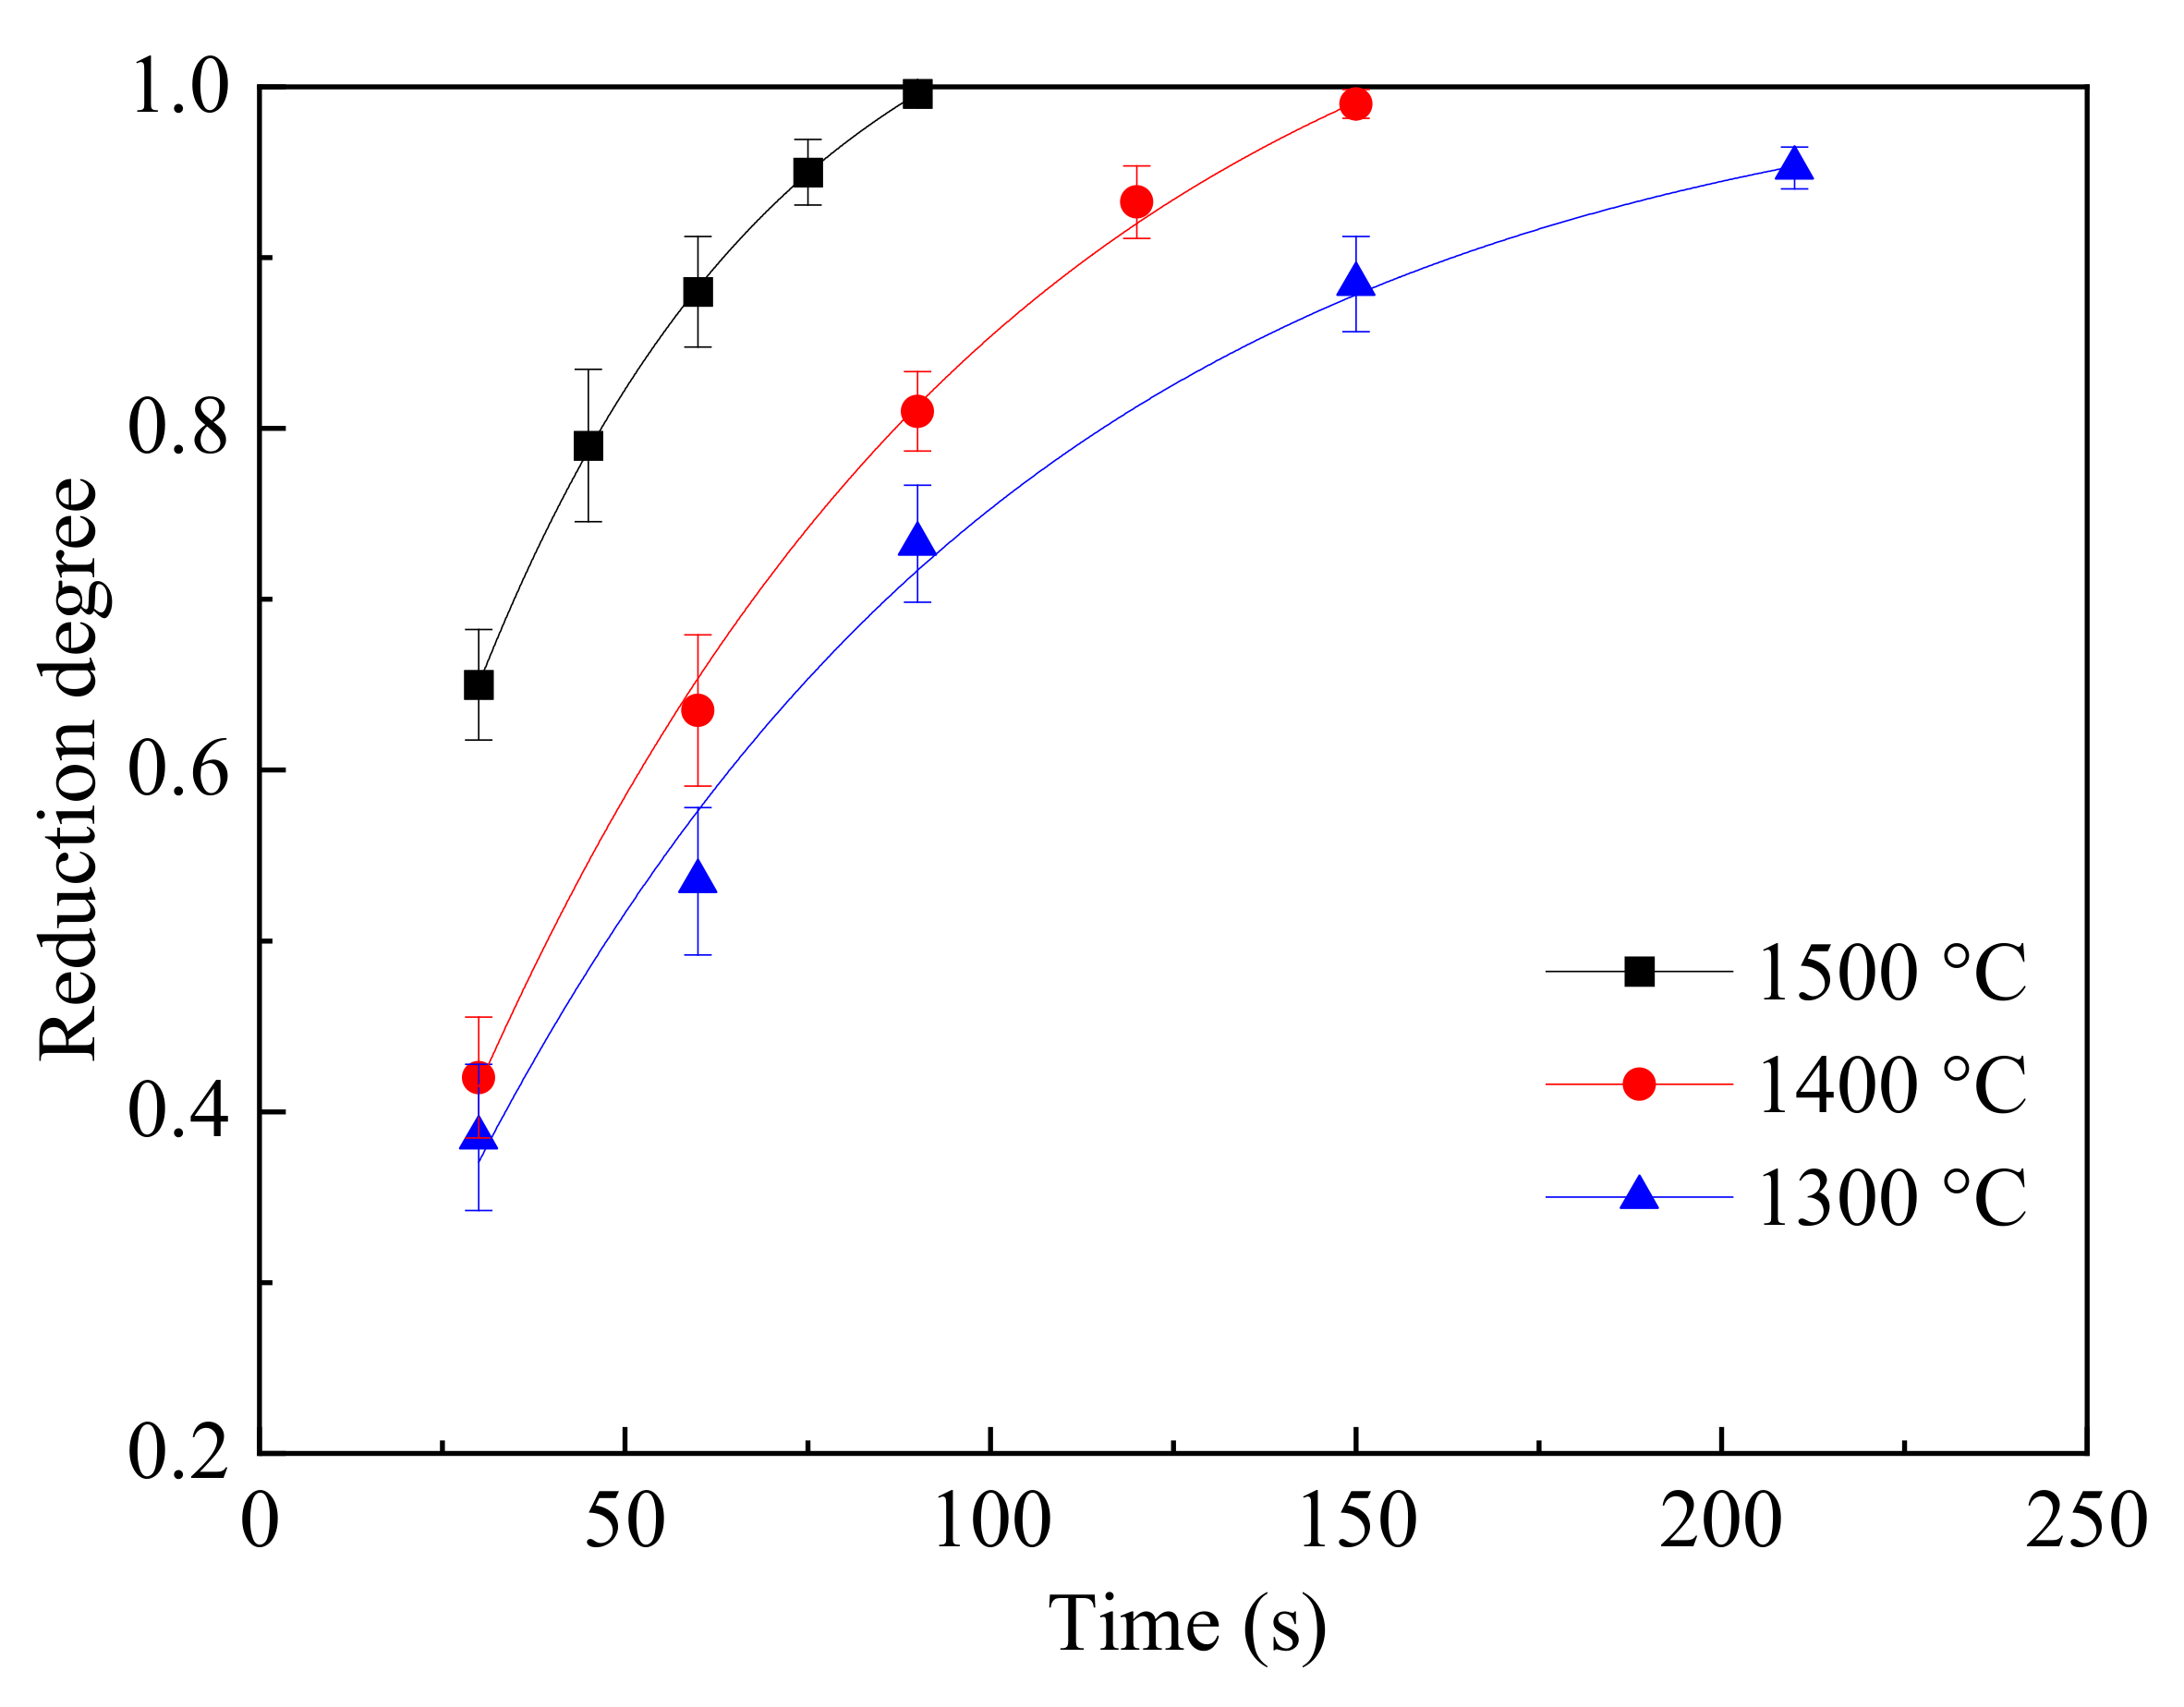
4.3. Effect of Reduction Temperature
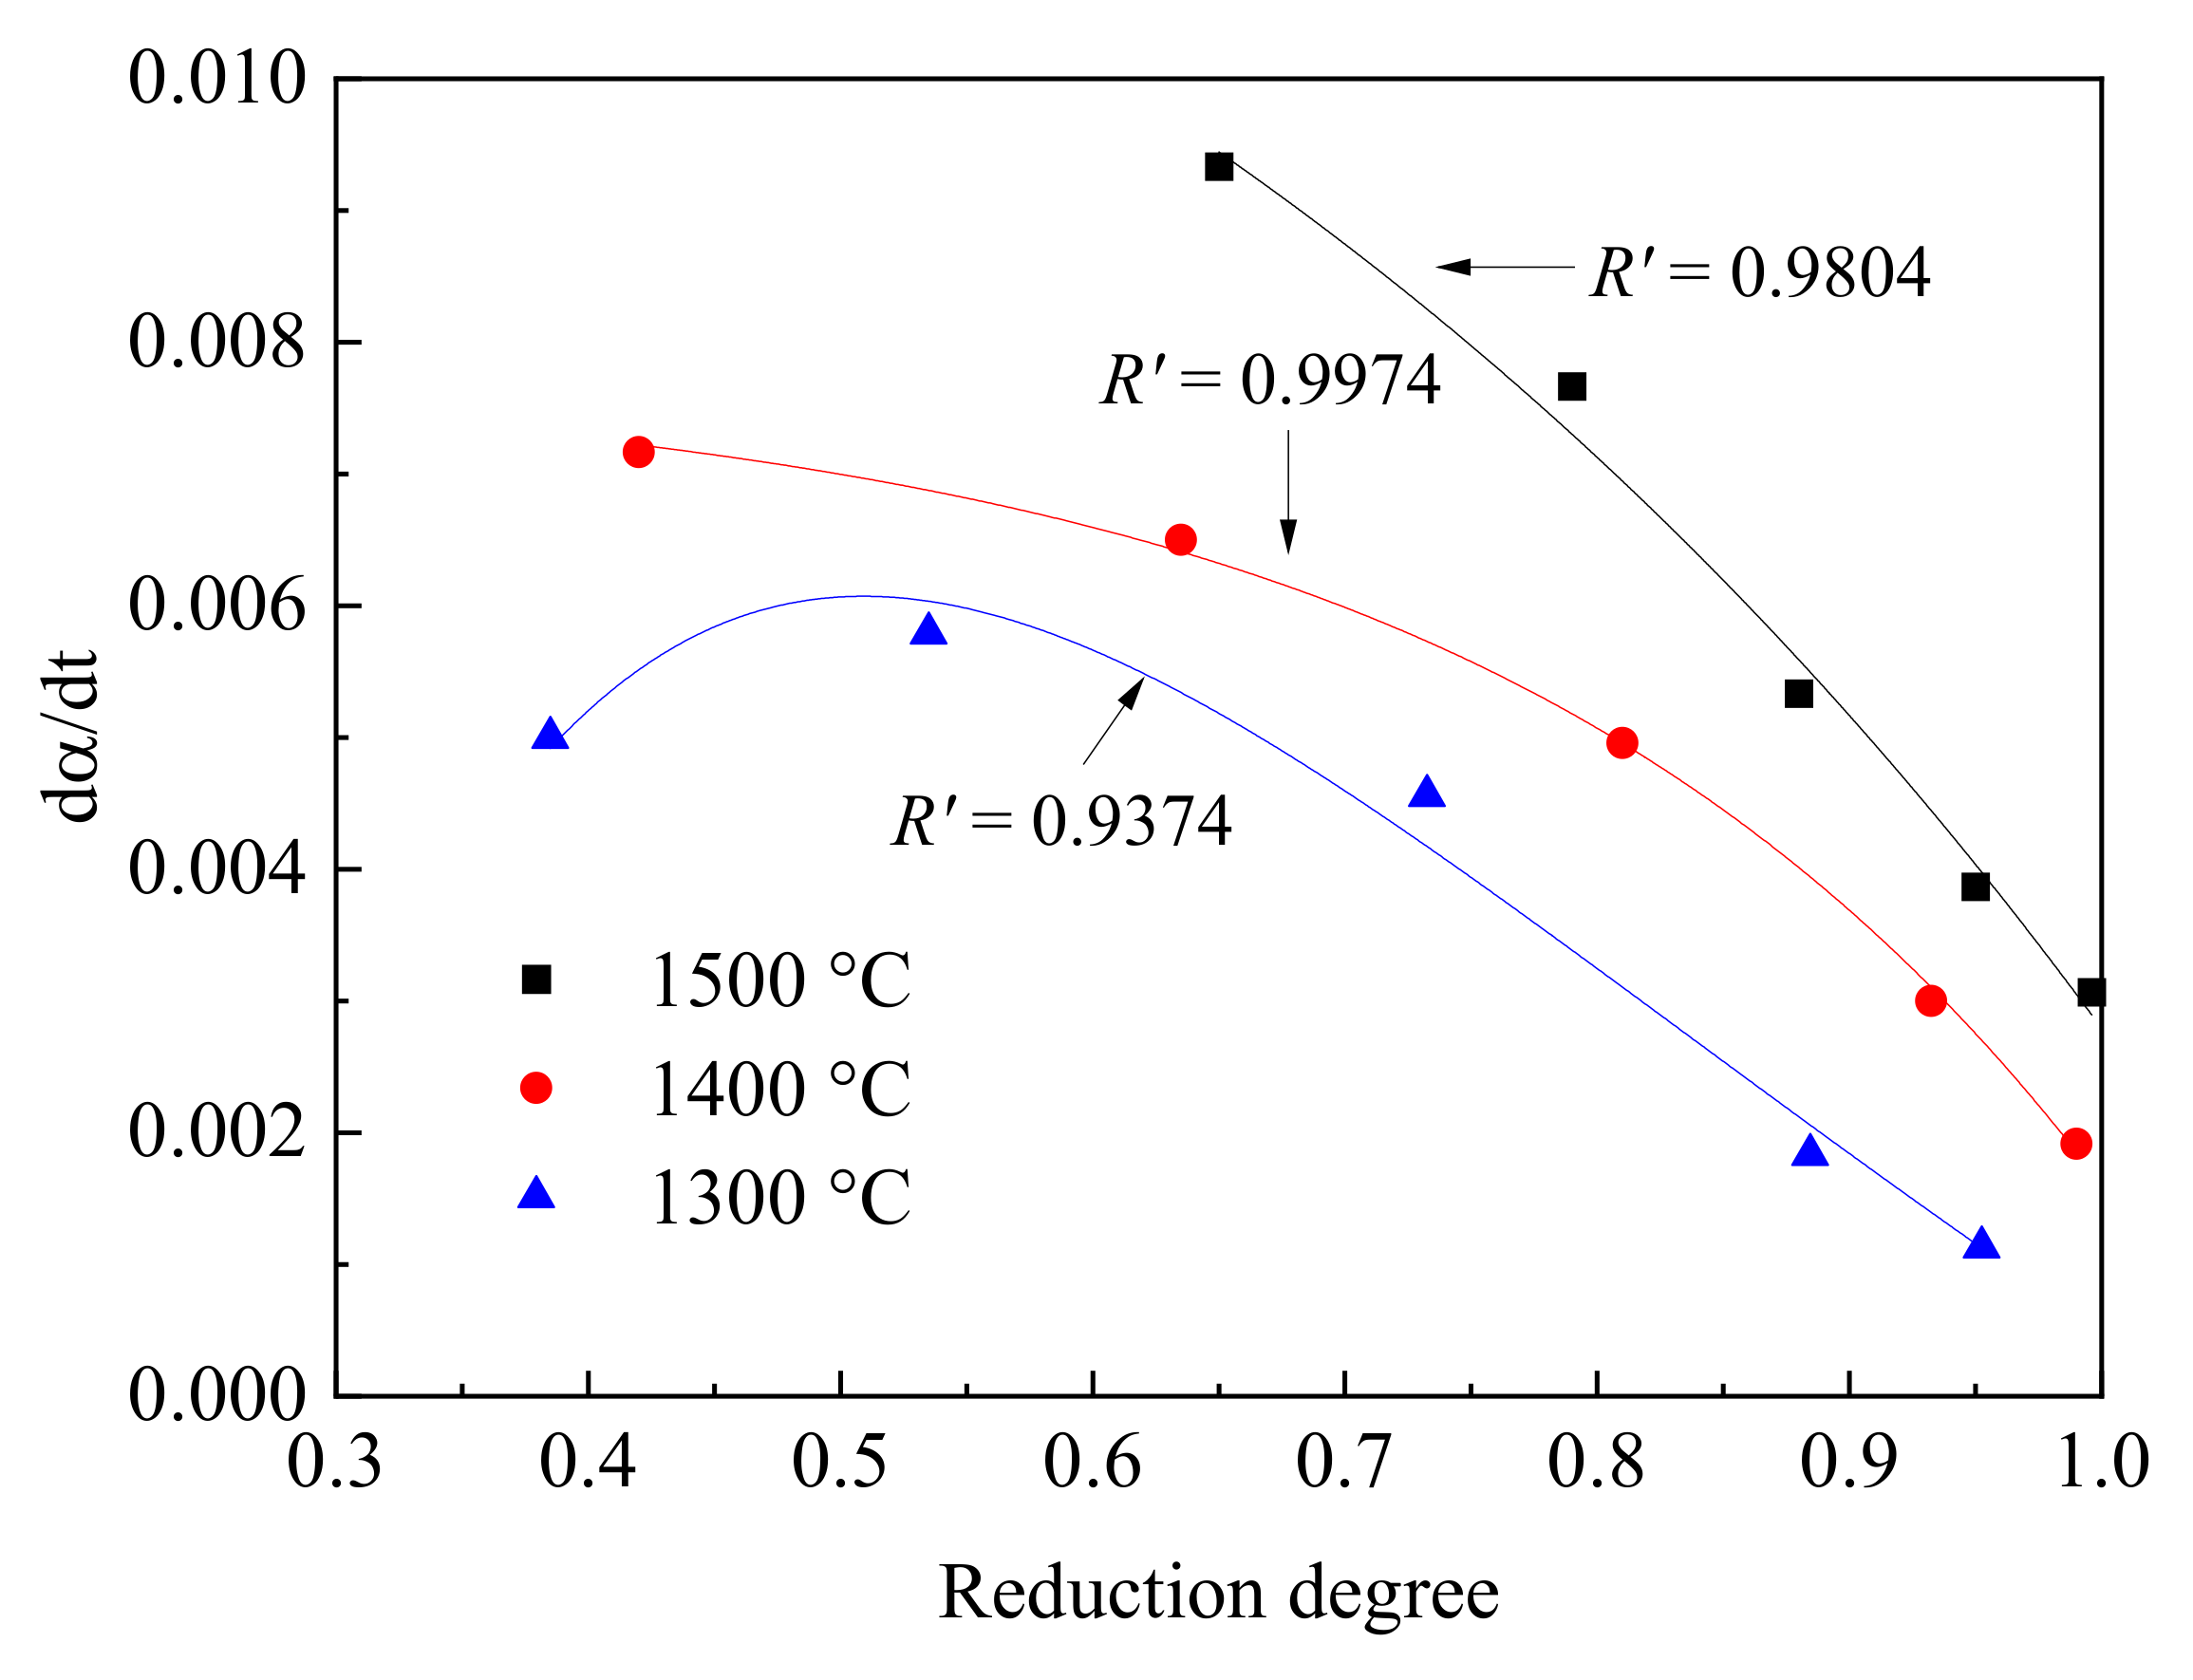
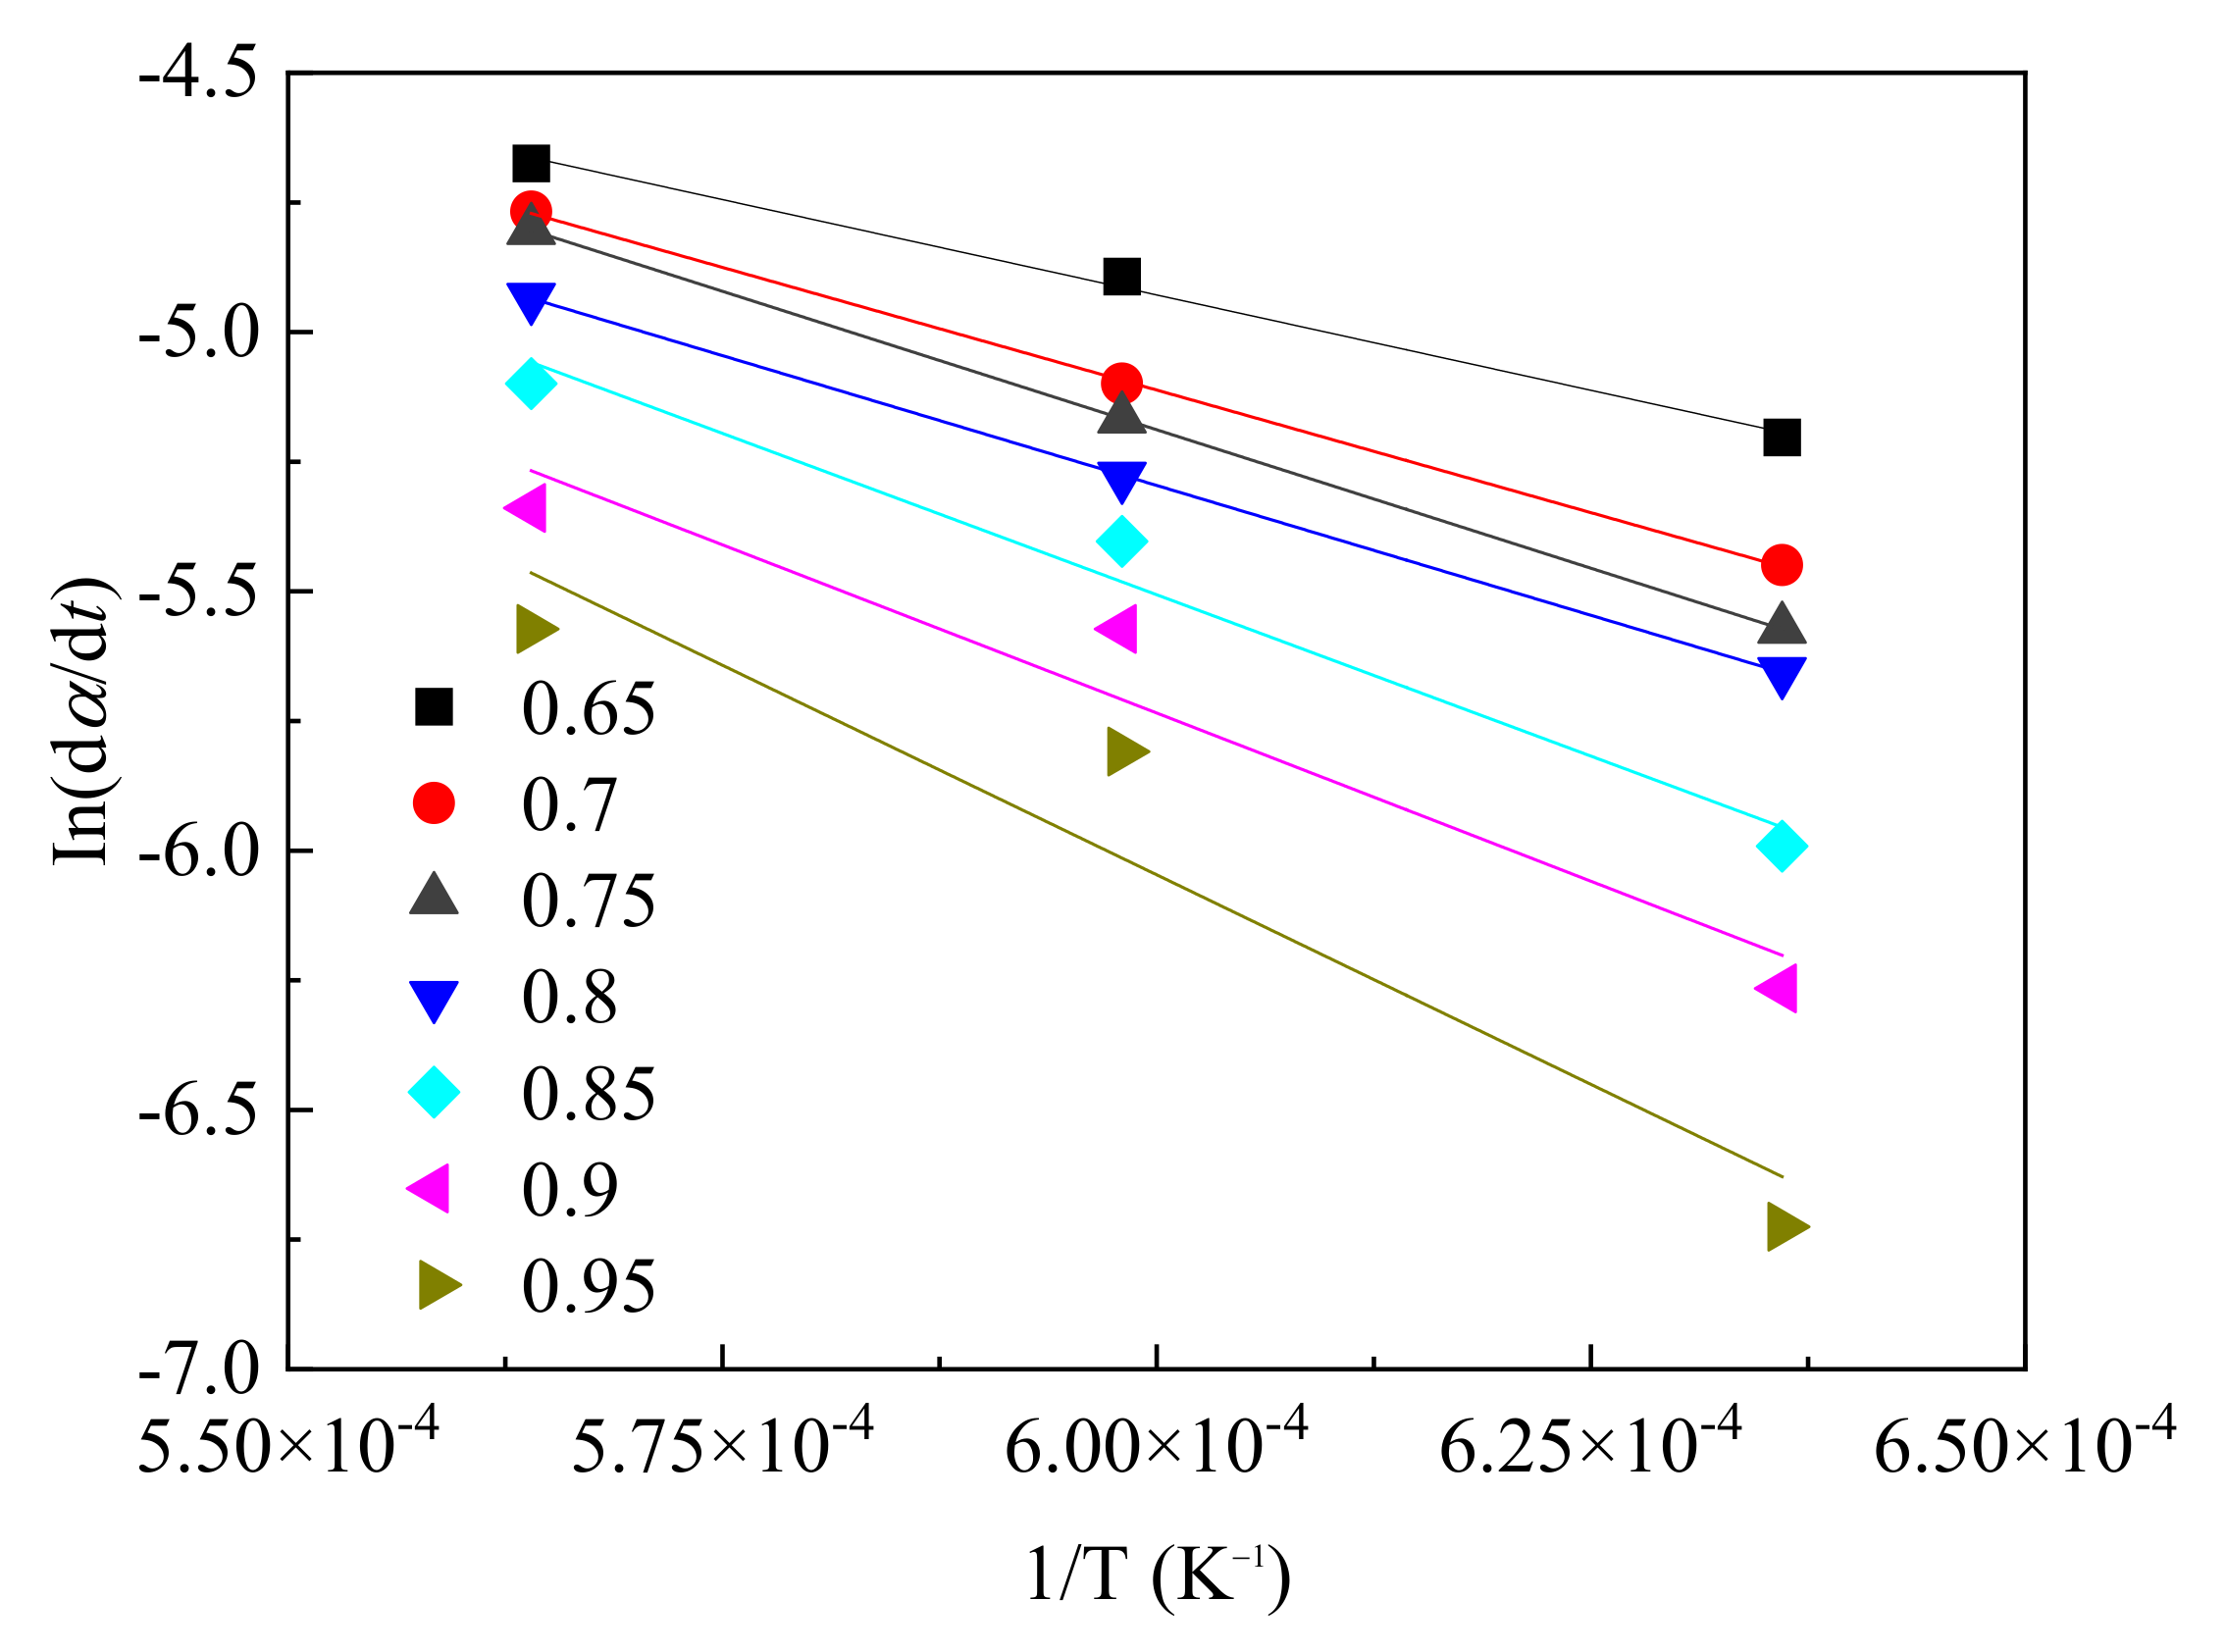
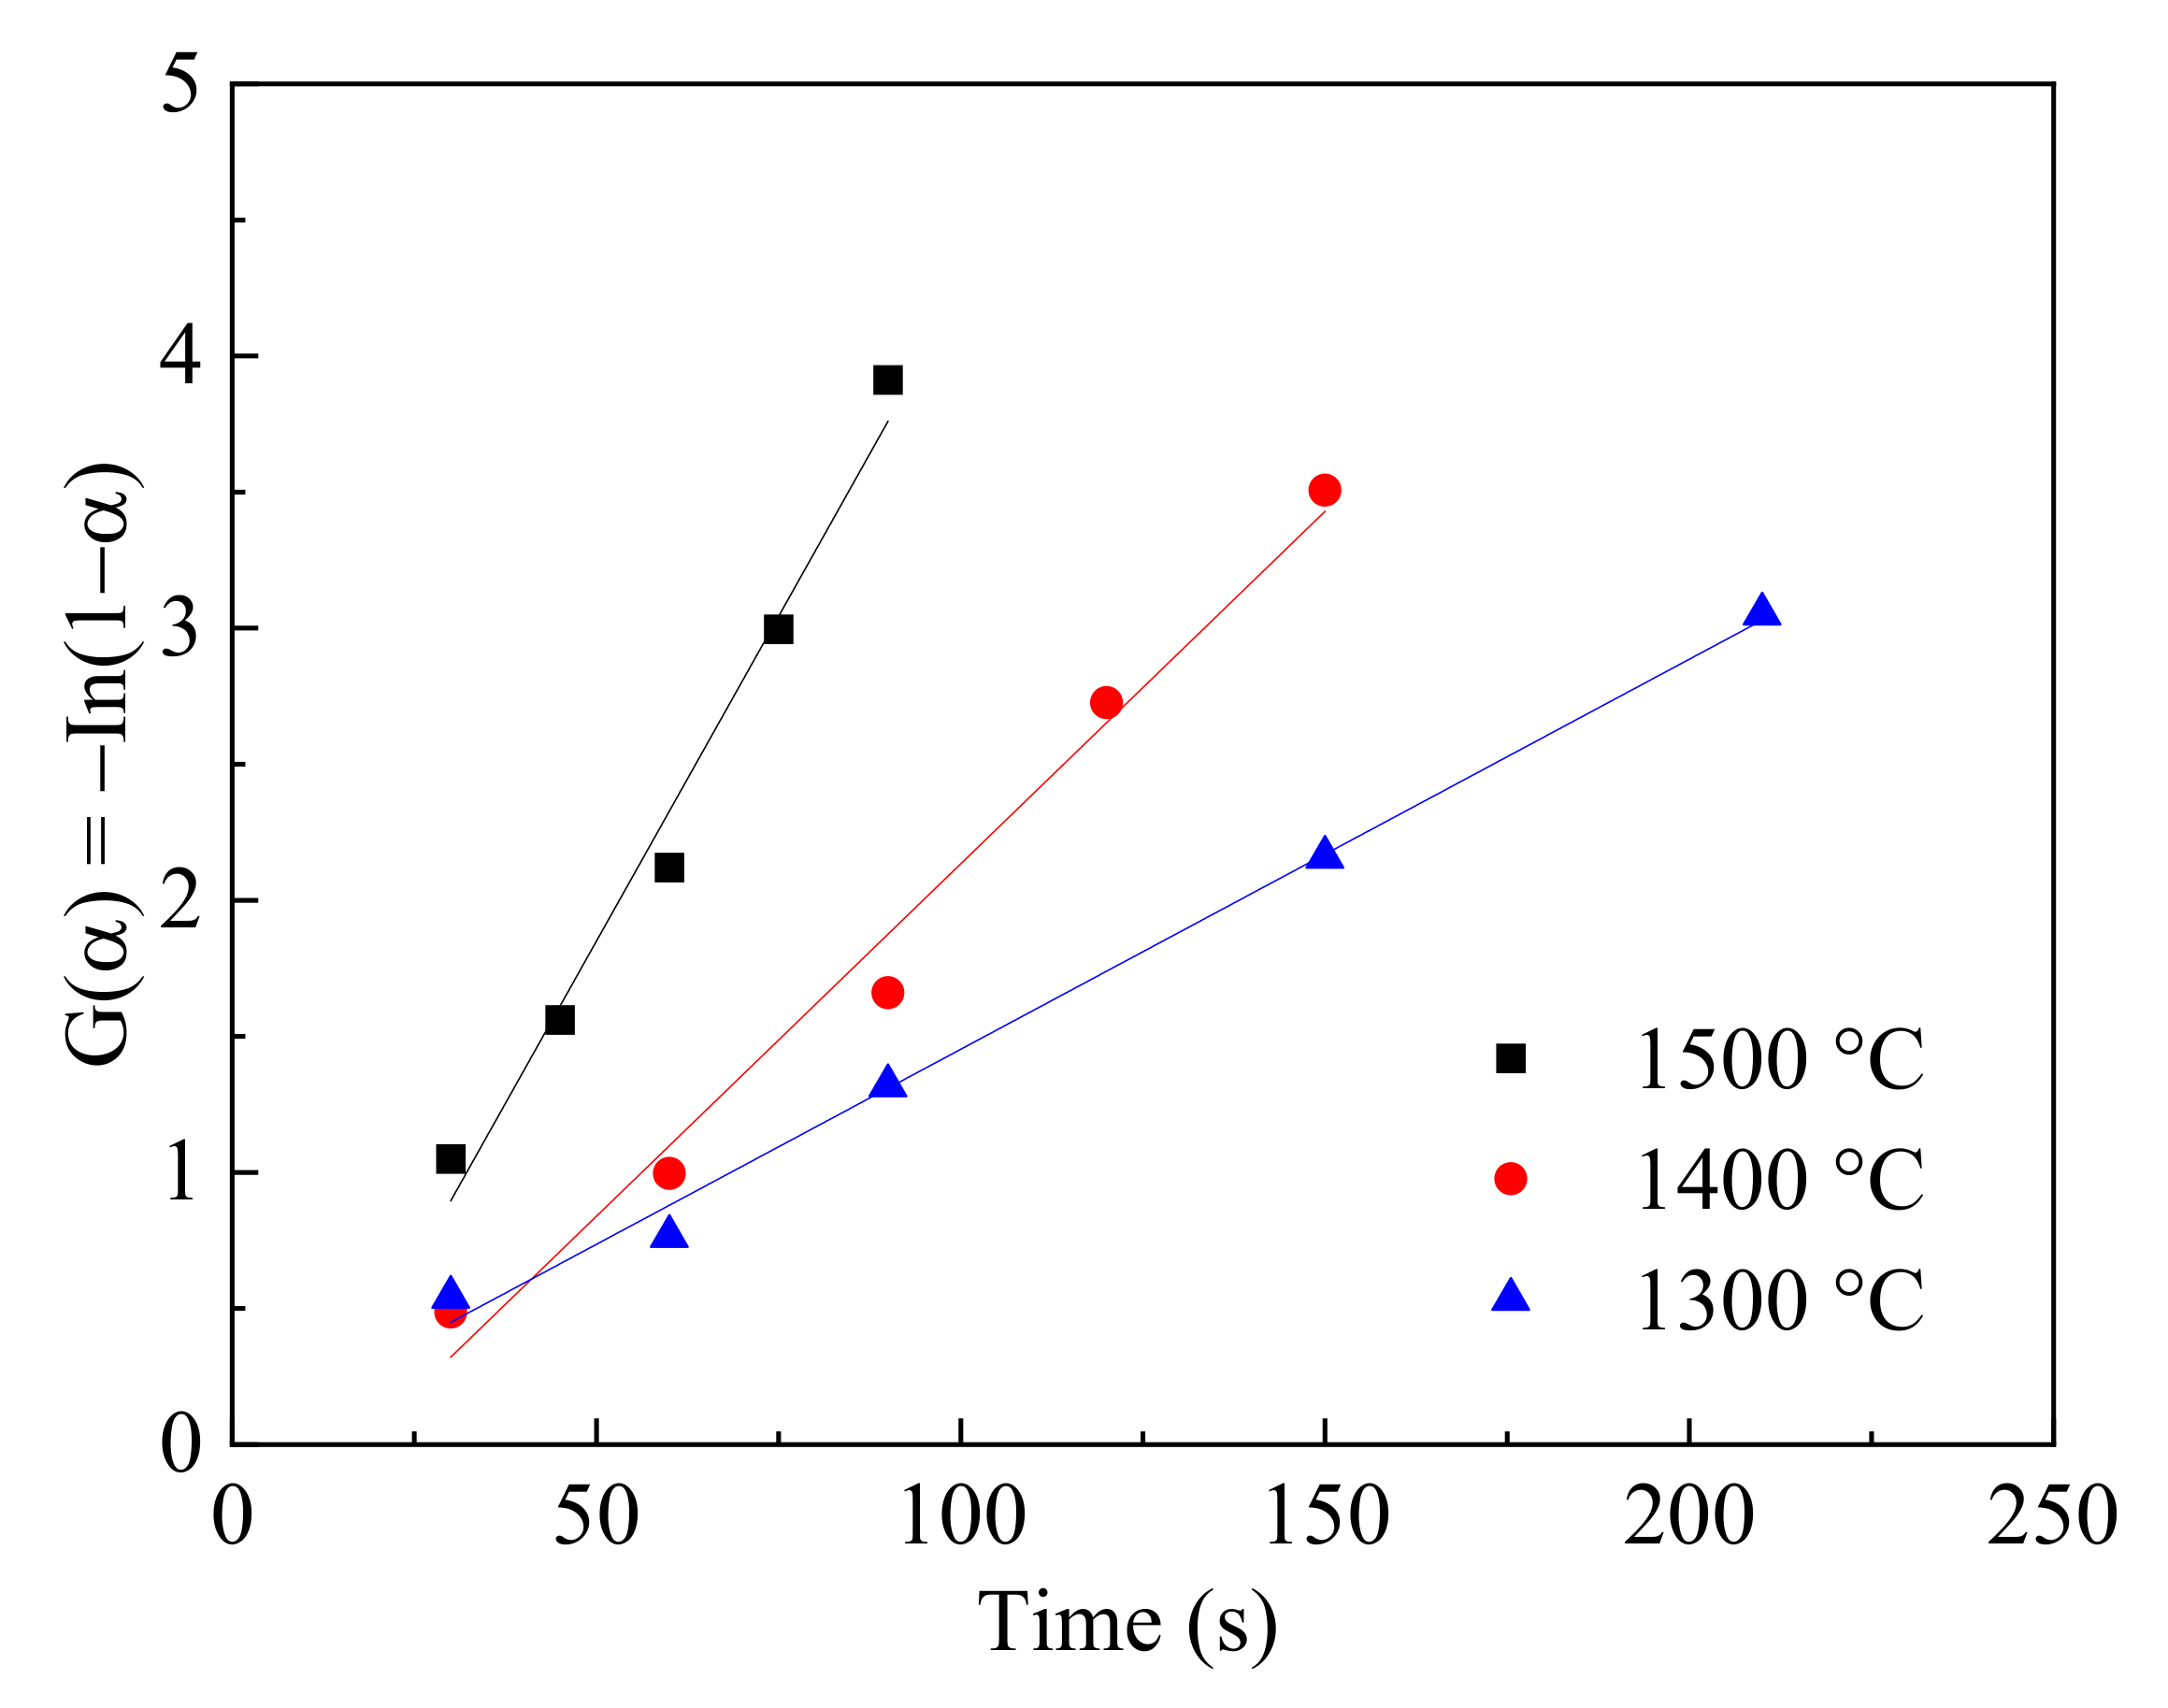
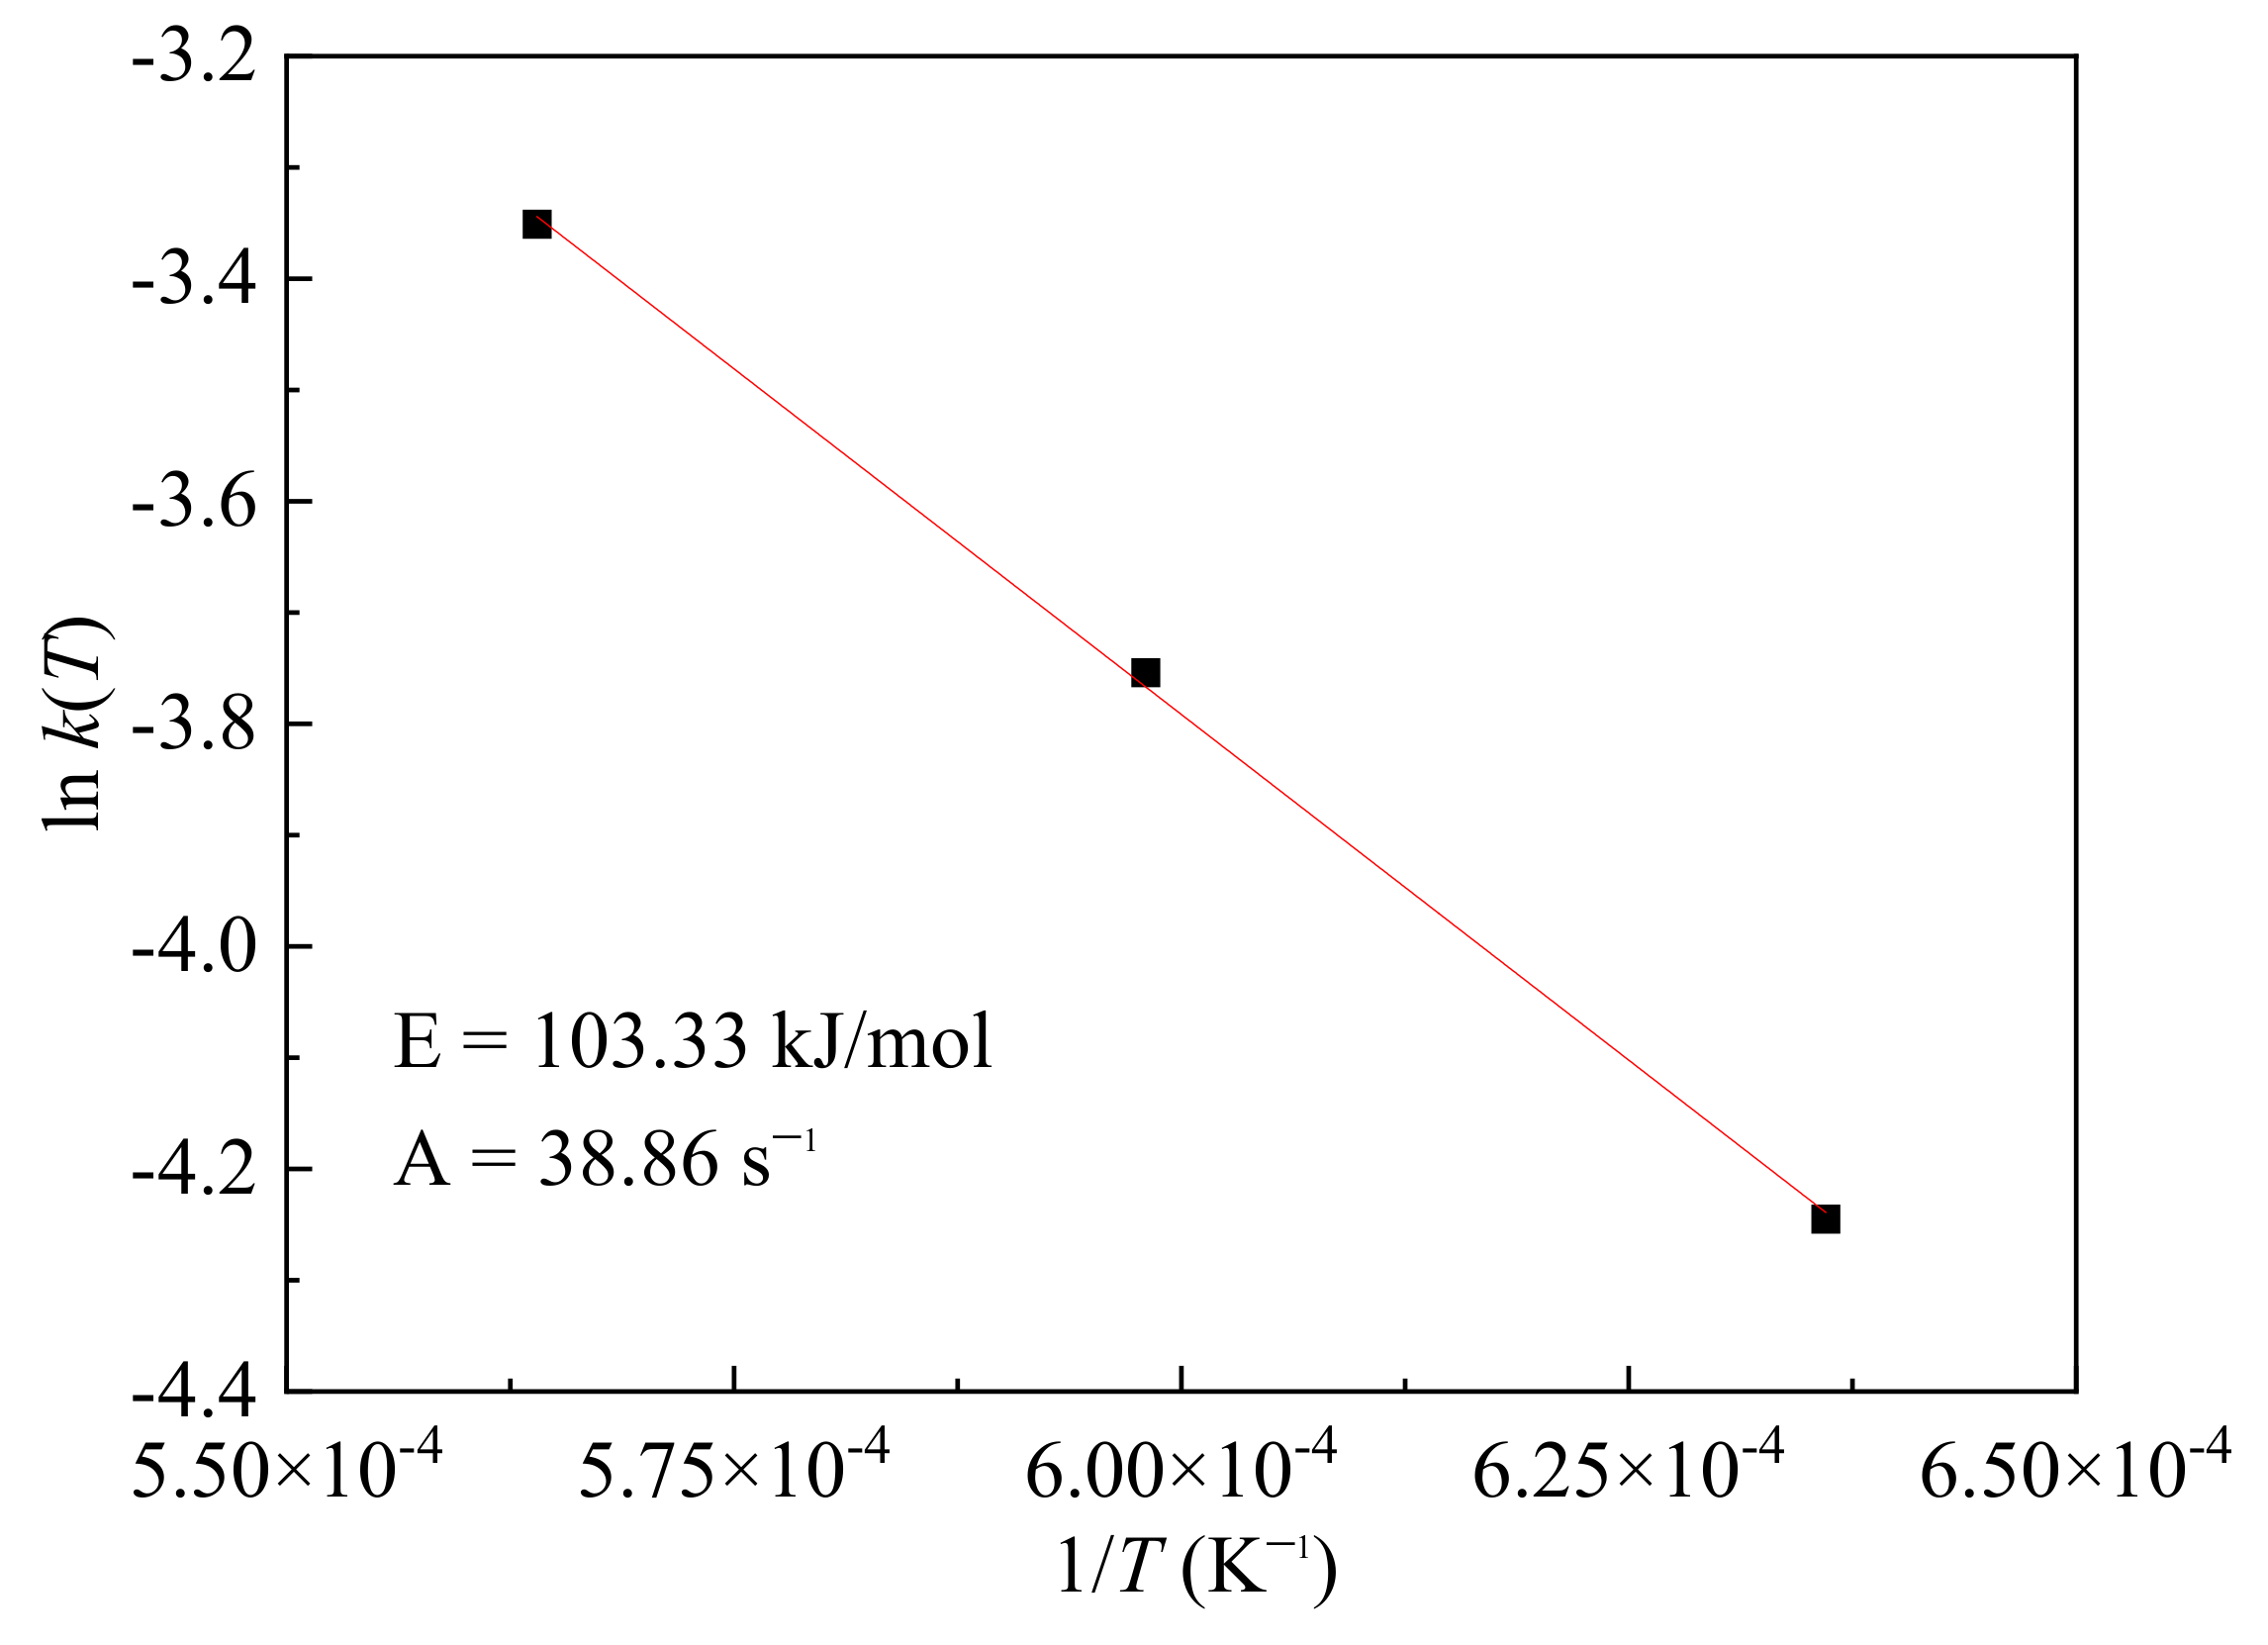
4.4. Parameters of Reaction Kinetics
5. Conclusions
Author Contributions
Funding
Institutional Review Board Statement
Informed Consent Statement
Data Availability Statement
Conflicts of Interest
References
- Zhao, J.; Zuo, H.B.; Wang, Y.J.; Wang, J.S.; Xue, Q.G. Review of green and low-carbon ironmaking technology. Ironmak. Steelmak. 2020, 47, 296–306. [Google Scholar] [CrossRef]
- Wang, Y.J.; Zuo, H.B.; Zhao, J. Recent progress and development of ironmaking in China as of 2019: An overview. Ironmak. Steelmak. 2020, 47, 640–649. [Google Scholar] [CrossRef]
- Naito, M.; Takeda, K.; Matsui, Y. Ironmaking technology for the last 100 years: Development to advanced technologies from introduction of technogical know-how, and evolution to next-generation process. ISIJ Int. 2015, 55, 7–35. [Google Scholar] [CrossRef] [Green Version]
- Anameric, B.; Kawatra, S. Direct iron smelting reduction processes. Miner. Process. Extr. Metall. Rev. 2009, 30, 1–51. [Google Scholar] [CrossRef]
- Qu, Y.X.; Yang, Y.X.; Zou, Z.S.; Zeilstra, C.; Meijer, K.; Boom, R. Thermal decomposition behaviour of fine iron ore particles. ISIJ Int. 2014, 54, 2196–2205. [Google Scholar] [CrossRef] [Green Version]
- Chen, F.; Mohassab, Y.; Zhang, S.Q.; Sohn, Y. Kinetics of the reduction of hematite concentrate partciels by carbon monoxide relevant to a novel flash ironmaking process. Metall. Mater. Trans. B. 2015, 46, 1716–1728. [Google Scholar] [CrossRef]
- Chen, B.J.; Xiong, J.; Li, M.; Feng, Y.; Hou, W.Y.; Li, H.S. Numerical Investigation into Gas-Particle Inter-Phase Combustion and Reduction in the Flash Ironmaking Process. Metals 2020, 10, 711. [Google Scholar] [CrossRef]
- Sohn, H.Y.; Fan, D.Q.; Abdelghany, A. Design of novel flash ironmaking reactors for greatly reduced energy consumption and CO2 emissions. Metals 2021, 11, 332. [Google Scholar] [CrossRef]
- Chen, H.S.; Zheng, Z.; Chen, Z.W.; Bi, X.T. Reduction of hematite (Fe2O3) to metallic iron (Fe) by CO in a micro fluidized bed reaction analyzer: A multistep kinetic study. Powder Technol. 2017, 316, 410–420. [Google Scholar] [CrossRef]
- Kim, W.H.; Lee, S.; Kim, S.M.; Min, D.J. The retardation kinetics of magnetite reduction using H2 and H2-H2O mixtures. Int. J. Hydrog. Energy 2013, 38, 4194–4200. [Google Scholar] [CrossRef]
- Guo, D.B.; Zhu, L.D.; Guo, S.; Cui, B.H.; Luo, S.P.; Laghari, M.; Chen, Z.H.; Ma, C.F.; Zhou, Y.; Chen, J.; et al. Direct reduction of oxidized iron ore pellets using biomass syngas as the reducer. Fuel Process. Technol. 2016, 148, 276–281. [Google Scholar] [CrossRef]
- Yang, Y.R.; Guo, L.; Guo, Z.C. Numerical analysis of gasification characteristics in combined coal gasification and flash ironmaking process. Appl. Therm. Eng. 2020, 171, 115067. [Google Scholar] [CrossRef]
- Spreitzer, D.; Schenk, J. Reduction of Iron Oxides with Hydrogen—A Review. Steel Res. Int. 2019, 90, 1900108. [Google Scholar] [CrossRef] [Green Version]
- Sun, G.; Li, B.; Guo, H.J.; Yang, W.S.; Li, S.Y.; Guo, J. Thermodynamic study on reduction of iron oxides by H2 + CO + CH4 + N2 mixture at 900 °C. Energies 2020, 13, 5053. [Google Scholar] [CrossRef]
- Piotrowski, K.; Mondal, K.; Lorethova, H.; Stonawski, L.; Szymański, T.; Wiltowski, T. Effect of gas composition on the kinetics of iron oxide reduction in a hydrogen production process. Int. J. Hydrog. Energ. 2005, 30, 1543–1554. [Google Scholar] [CrossRef]
- Monazam, E.R.; Breault, R.W.; Siriwardane, R. Reduction of hematite (Fe2O3) to wüstite (FeO) by carbon monoxide (CO) for chemical looping combustion. Chem. Eng. J. 2014, 242, 204–210. [Google Scholar] [CrossRef]
- Bohn, C.D.; Cleeton, J.P.; Müller, C.R.; Davidson, J.F.; Hayhurst, A.N.; Scott, S.A.; Dennis, J.S. The kinetics of the reduction of iron oxide by carbon monoxide mixed with carbon dioxide. AIChE J. 2010, 56, 1016–1029. [Google Scholar] [CrossRef]
- He, S.Y.; Sun, H.Y.; Hu, C.Q.; Li, J.; Zhu, Q.S.; Li, H.Z. Direct reduction of fine iron ore concentrate in a conical fluidized bed. Powder Technol. 2017, 313, 161–168. [Google Scholar] [CrossRef]
- Choi, M.E.; Sohn, H.Y. Development of green suspension ironmaking technology based on hydrogen reduction of iron oxide concentrate: Rate measurements. Ironmak. Steelmak. 2010, 37, 81–88. [Google Scholar] [CrossRef]
- Zhang, T.; Lei, C.; Zhu, Q.S. Reduction of fine iron ore via a two-step fluidized bed direct reduction process. Powder Technol. 2014, 254, 1–11. [Google Scholar] [CrossRef]
- Yi, L.; Huang, Z.C.; Jiang, T. Sticking of iron ore pellets during reduction with hydrogen and carbon monoxide mixtures: Behavior and mechanism. Powder Technol. 2013, 235, 1001–1007. [Google Scholar] [CrossRef]
- Fan, D.Q.; Mohassab, Y.; Elzohiery, M.; Sohn, H.Y. Analysis of the hydrogen reduction rate of magnetite concentrate particles in a drop tube reactor through CFD modeling. Metall. Mater. Trans. B 2016, 47, 1669–1680. [Google Scholar] [CrossRef]
- Fan, D.Q.; Sohn, H.Y.; Mohassab, Y.; Elzohiery, M. Computational fluid dynamics simulation of the hydrogen reduction of magnetite concentrate in a laboratory flash reactor. Metall. Mater. Trans. B 2016, 47, 3489–3500. [Google Scholar] [CrossRef]
- De Faria, D.L.A.; Venâncio Silva, S.; de Oliveira, M. Raman microsectroscopy of some iron oxides and oxyhydroxides. J. Raman Spectrosc. 1997, 28, 873–878. [Google Scholar] [CrossRef]
- Thibeau, R.J.; Brown, C.W.; Heidersbach, R.H. Raman spectra of possible corrosion products of iron. Appl. Spectrosc. 1978, 32, 532–535. [Google Scholar] [CrossRef]
- Chen, H.S.; Zheng, Z.; Shi, W.Y. Investigation on the kinetics of iron ore fines reduction by CO in a micro-fluidized bed. Procedia Eng. 2015, 102, 1726–1735. [Google Scholar] [CrossRef] [Green Version]
- Tiernan, J.M.; Barnes, P.A.; Parkes, G.M.B. Reduction of iron oxide catalysts: The investigation of kinetic parameters esing rate perturbation and linear heating thermoanalytical techniques. J. Phys. Chem. B 2001, 105, 220–228. [Google Scholar] [CrossRef]
- Pourghahramani, P.; Forssberg, E. Reduction kinetics of mechanically activated hematite concentrate with hydrogen gas using nonisothermal methods. Thermochim. Acta 2007, 454, 69–77. [Google Scholar] [CrossRef]
- Chen, H.S.; Zheng, Z.; Chen, Z.W.; Yu, W.Z.; Yue, J.R. Multistep reduction kinetics of fine iron ore powder with carbon monoxide in a micro fluidized bed reaction analyzer. Metall. Mater. Trans. B 2017, 48, 841–852. [Google Scholar] [CrossRef]
- Piotrowski, K.; Mondal, K.; Wiltowski, T.; Rizeg, G. Topochemical approach of kinetics of the reduction of hematite to wüstite. Chem. Eng. J. 2007, 131, 73–82. [Google Scholar] [CrossRef]
- Fan, D.Q.; Elzohiery, M.; Mohassab, Y.; Sohn, H.Y. The kinetics of carbon monoxide reduction of magnetite concentrate particles through CFD modelling. Ironmak. Steelmak. 2021, 48, 1–10. [Google Scholar]
- Jozwiak, W.K.; Kaczmarek, E.; Maniecki, T.P.; Maniukiewicz, W. Reduction behavior of iron oxides in hydrogen and carbon monoxide atmospheres. Appl. Catal. A Gen. 2007, 326, 17–27. [Google Scholar] [CrossRef]

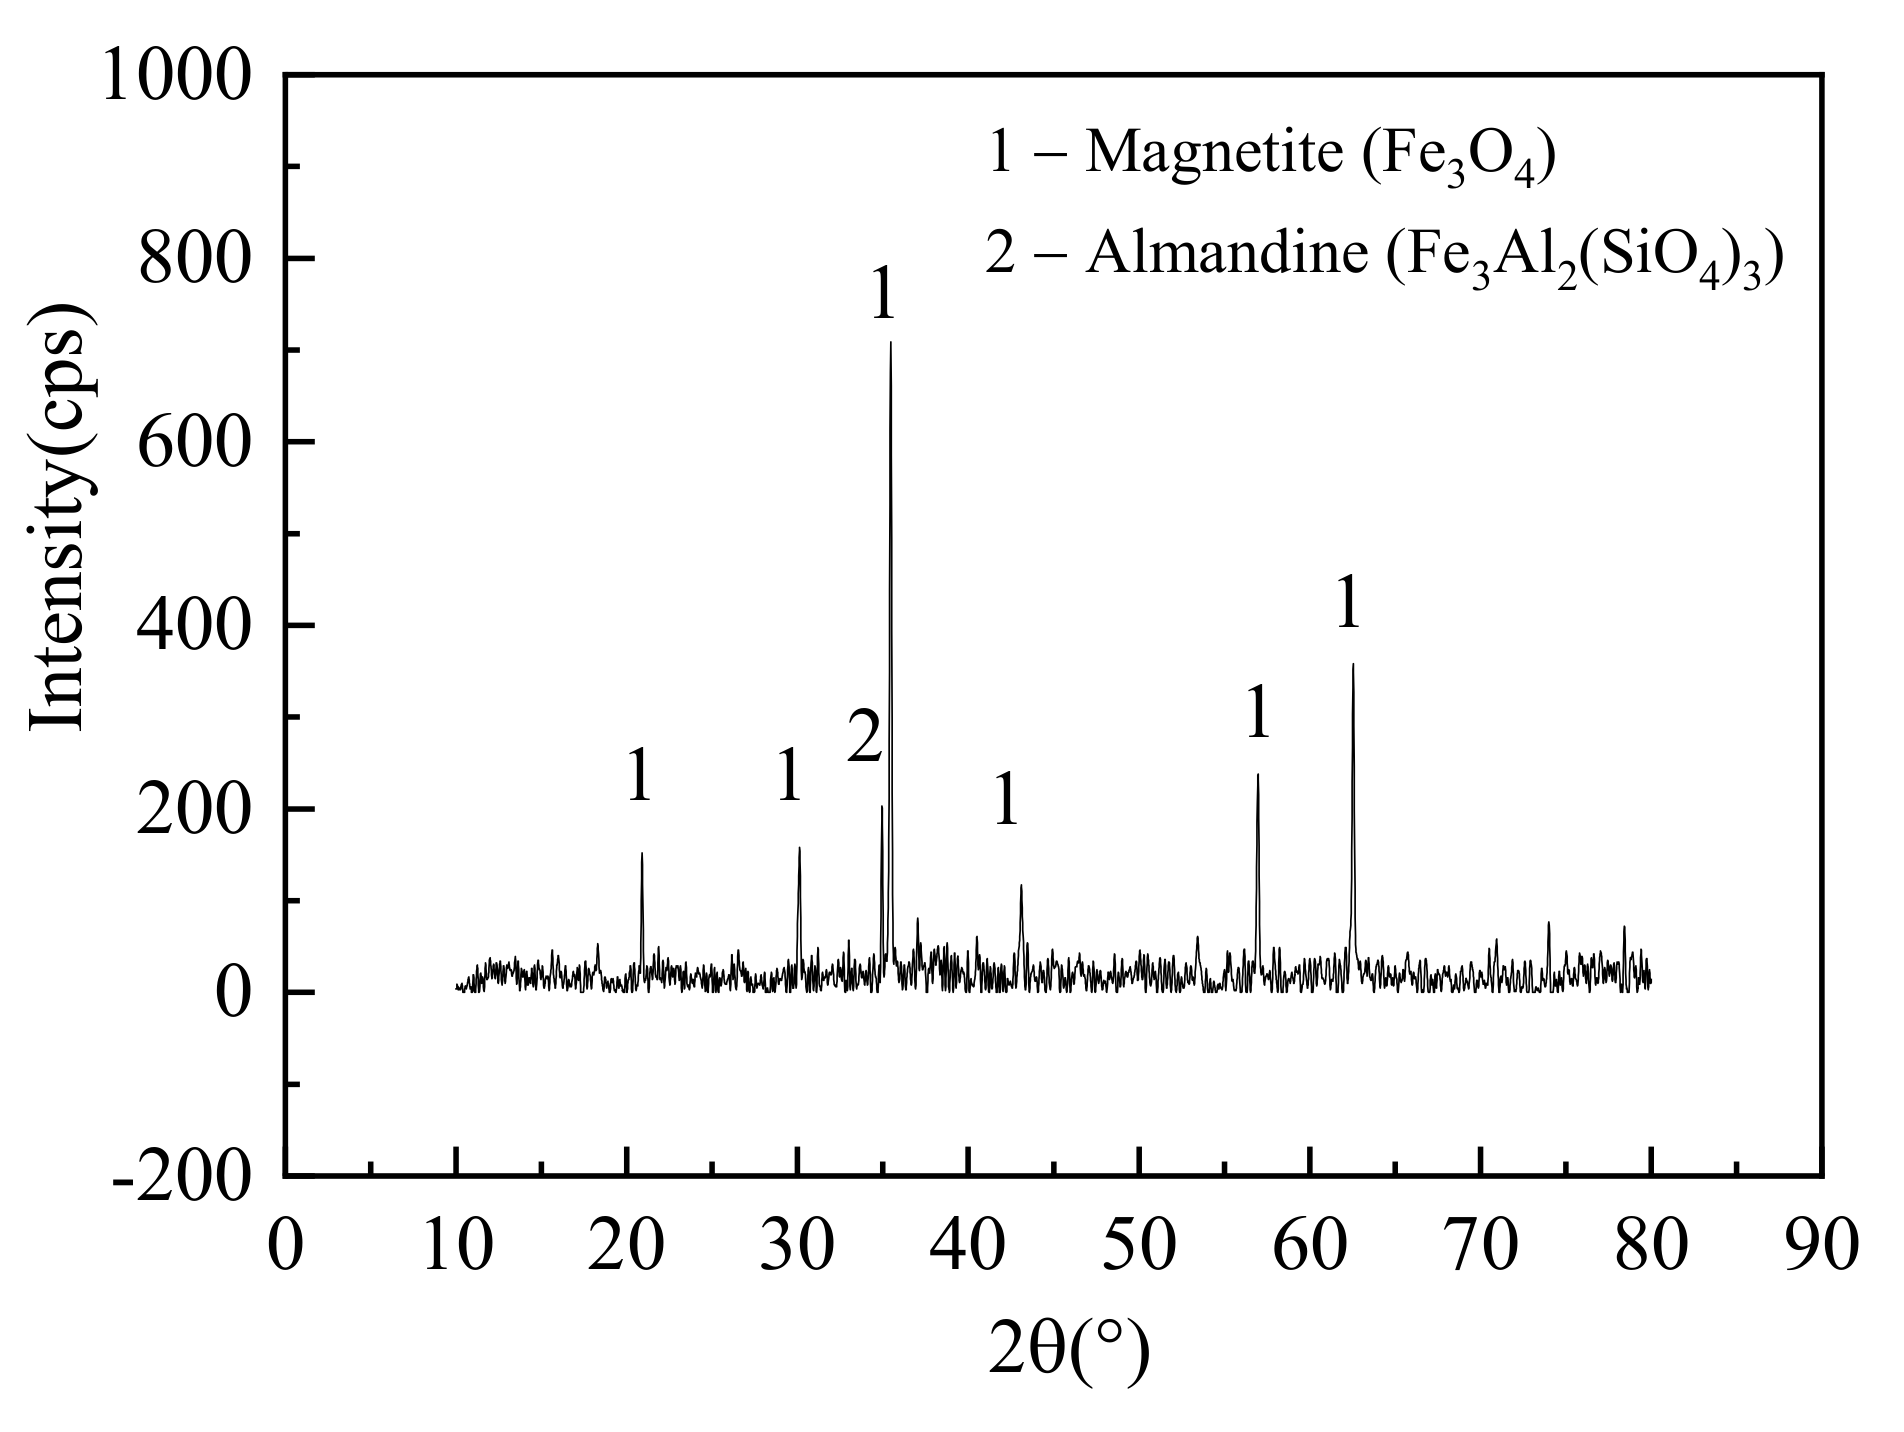
| Sample | Chemical Composition (wt.%) | |||||
|---|---|---|---|---|---|---|
| Total Fe | SiO2 | MgO | CaO | Al2O3 | Na2O | |
| Magnetite sample | 65.40 | 6.07 | 1.24 | 1.15 | 0.79 | 0.43 |
| Components | Raman Shift/cm−1 |
|---|---|
| α-Fe2O3 | 227 246 293 411 497 612 1320 |
| Fe3O4 | 301.6 513 533.6 616 663 |
| FeO | 435 616 663 |
| γ-FeOOH | 252 380 526 650 1307 |
| Reduction Degree | 0.65 | 0.70 | 0.75 | 0.80 | 0.85 | 0.90 | 0.95 | Average |
|---|---|---|---|---|---|---|---|---|
| Activation energy (kJ/mol) | 61.16 | 78.65 | 88.82 | 83.28 | 103.5 | 107.9 | 134.4 | 109.6 |
Publisher’s Note: MDPI stays neutral with regard to jurisdictional claims in published maps and institutional affiliations. |
© 2021 by the authors. Licensee MDPI, Basel, Switzerland. This article is an open access article distributed under the terms and conditions of the Creative Commons Attribution (CC BY) license (https://creativecommons.org/licenses/by/4.0/).
Share and Cite
Shen, Z.; Sun, S.; Zhu, Y.; Han, D.; Du, Z.; Liu, H. A Kinetic Study on the Reduction of Single Magnetite Particle with Melting Products at High Temperature Based on Visual and Surface Analytical Techniques. Metals 2021, 11, 1268. https://doi.org/10.3390/met11081268
Shen Z, Sun S, Zhu Y, Han D, Du Z, Liu H. A Kinetic Study on the Reduction of Single Magnetite Particle with Melting Products at High Temperature Based on Visual and Surface Analytical Techniques. Metals. 2021; 11(8):1268. https://doi.org/10.3390/met11081268
Chicago/Turabian StyleShen, Zhongjie, Shuang Sun, Yulong Zhu, Dong Han, Zhan Du, and Haifeng Liu. 2021. "A Kinetic Study on the Reduction of Single Magnetite Particle with Melting Products at High Temperature Based on Visual and Surface Analytical Techniques" Metals 11, no. 8: 1268. https://doi.org/10.3390/met11081268
APA StyleShen, Z., Sun, S., Zhu, Y., Han, D., Du, Z., & Liu, H. (2021). A Kinetic Study on the Reduction of Single Magnetite Particle with Melting Products at High Temperature Based on Visual and Surface Analytical Techniques. Metals, 11(8), 1268. https://doi.org/10.3390/met11081268