Abstract
In this paper, we report the results obtained from the hot compression behaviour of co-spray-formed Al-Si/7075 bimetallic gradient alloys by investigating the five selected layers divided evenly from top to bottom. It was found that with a decrease in the strain rate and an increase in temperature, the hot compression flow stress of deposited alloys decreases gradually, as expected. The relationship between flow stress, temperature and strain rate follows the Arrhenius relationship. The deformation activation energy of the co-spray formed gradient alloy gradually increases from bottom to top in the height direction, which are 100.15, 167.35, 185.54, 208.78 and 220.83 KJ/mol, indicating that the degree of difficulty in the deformation of the alloy is affected by changes in the silicon content of the alloy. Finally, the flow stress constitutive equation is calculated for each layer of alloy material, which is instructive for the subsequent study of the densification process of co-spray-formed gradient alloys.
1. Introduction
With the rapid development of science and technology, the requirements for the environment and properties of materials are becoming more diversified. The complex and changeable application conditions require materials to have two or more different properties to meet the different needs, however, many traditional homogeneous materials and isotropic materials with a single property cannot provide support. Composite materials formed by dissimilar materials through compounding can meet the requirements for diversity in a function or property [1,2,3]. Although traditional composite materials may have unique properties that are not available in homogeneous materials to some extent, the interface stress caused by sudden changes in the interface bonding strength and the property parameter between materials with different properties can easily cause interface damage and failure [4,5]. Functionally gradient material is an integrated material that continuously changes from one function (component) to another function (component). This type of non-homogeneous gradient structure material with continuous changes in internal composition has no clear interface and can easily provide “new functions” that are not available with traditional homogeneous materials and ordinary composites [6,7,8].
The 7075 alloy is widely used in many fields due to its excellent mechanical properties such as high specific strength and good plastic deformation ability [9,10]. Similarly, the Al-20Si alloy is widely used in the aerospace, and automotive fields, amongst others, due to its excellent wear resistance and thermophysical property [11,12,13]. Therefore, functionally gradient materials composed of these two aluminum alloys combine their excellent properties, such as high strength, good friction, and excellent thermophysic. In previous research [14], bimetallic gradient plates with 7075 and Al-20Si alloys were successfully prepared using a co-spray forming technique.
The study of hot deformation can provide optimal process parameters for further improving the workability of alloys, and important support for the conditions encountered in the processing operations of structural materials such as extrusion, forging, and rolling [15]. Lin et al. constructed a processing map of 7075 alloy by superimposing the instability map onto the power dissipation map [16]. Hu et al. studied the hot deformation behavior of hypereutectic aluminum–silicon alloys, and the deformation constitutive equation established by them can more accurately describe the relationship between flow stress, temperature and strain rate [17]. Cui et al. studied the deformation behavior of spray formed hypereutectic aluminum–silicon alloys under different temperatures and strain rates through compression experiments, and found that flow stress increases with the decrease of compression temperature and the increase in the strain rate [18]. However, research is lacking on the deformation behavior of co-spray formed gradient aluminum alloys. Therefore, the study of the hot deformation behavior of co-spray-formed gradient aluminum alloys is significant. In this paper, the co-spray formed gradient aluminum alloy was divided into five layers from top to bottom, and the thermal deformation behavior of each layer was studied and the constitutive equations were finally obtained.
2. Experimental Details
The composition of the 7075 alloy is listed in Table 1. The Al-20Si and 7075 alloys were atomized by two atomizers of a co-spray forming system, as shown in Figure 1. The substrate was scanned in the transverse direction and at the same time translated horizontally through the two sprays. As the substrate performed a cyclical reciprocating motion, the droplets in the spray cone of 7075 alloy were deposited on the substrate first and formed the lower layer of the deposit. Following that, the droplets in the spray cone of Al–20Si alloy were deposited over the lower layer of the deposit and formed the upper layer. The experimental parameters were as follows: the maximum temperatures of these two alloys for the experimental tests were both set to 850 °C, the distance between the centers of the two atomization cones was set to 50 mm, the advancing speed of the baseboard was set to 1.5 mm·s−1, the oscillating period was set to 1 s, and the deposition substrate stroke was set to 200 mm. The deposition distance of atomization was set to 500 mm, and the atomizer outlet pressure was set to 1.2 MPa.

Table 1.
Chemical composition of 7075 alloy (wt %).
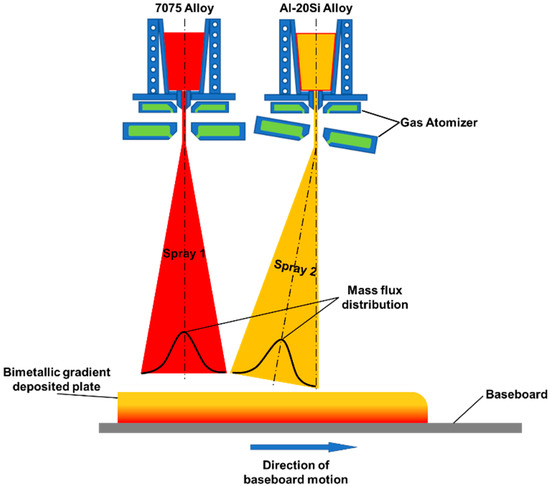
Figure 1.
Schematic diagram of co-spray forming process.
The bimetallic sheet prepared by co-spray forming was pre-layered, and evenly divided into five layers in the height direction, as shown in Figure 2. A hot deformation test was conducted on each layer. A cylindrical sample with a diameter of Φ 7 mm was obtained by using an electrosparking wire cutting machine to cut each layer of the deposited plate along the deposition direction, and was then processed by a lathe into a compressed sample of Φ 6 × 8 mm. The end surface of the sample was smoothed with waterproof abrasive paper.
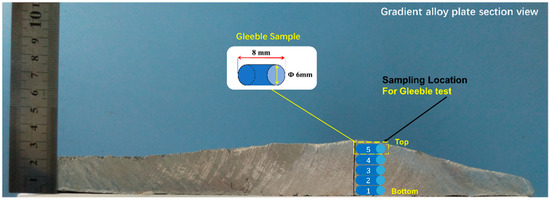
Figure 2.
The sampling location for gleeble test and sample sizeAn isothermal and constant strain rate compression deformation was performed on a Gleeble-1500 testing machine (Dynamic Systems Inc., New York, NY, USA) for hot working simulation. To reduce the friction between the indenter and the sample, graphite was applied as a lubricant on both ends of the sample during compression, which ensured the sample was under unidirectional axial stress during compression. A thermocouple was welded on to the surface of the middle part of the sample to accurately measure the temperature change of the sample during the experiment. The experimental parameters are shown in Table 2.
The sample was heated to different deformation temperatures at a heating rate of 5 °C/s, and then compressed after 3 min of heat preservation. The stress–strain curve data were recorded. The microstructure of the sample was observed with a FEI Helios NanoLab 600 Dual Beam FIB/SEM (SEM, Field Electron and Ion Company, Hillsboro, OR, USA) and the element content in the sample was detected using an energy dispersive spectroscopy detector (EDS, Field Electron and Ion Company, Hillsboro, OR, USA) by plane scanning model.
3. Results and Discussion
3.1. Microstructure of the Deposited Alloy
Figure 3 shows the microstructures and EDS results of five layers selected from co-spray-formed Al-Si/7075 bimetallic gradient alloys. According to EDS results of these five layers, it can be found that the silicon content in the alloy gradually increases from the bottom to the top, while the contents of Mg, Cu and Zn show a downward trend. The microstructures of these five layers showed different morphological characteristics due to the change of silicon content. In the region with low silicon content, the silicon phase generally presents a fine and round morphology, but with the increase of silicon content, the silicon phase gradually changes into a coarse and massive morphology. Besides, it can be found that the bottom of the deposited billet presents a larger number of pores than the top, because the heat at the bottom is more concentrated than at the top, leading to the formation of pores.
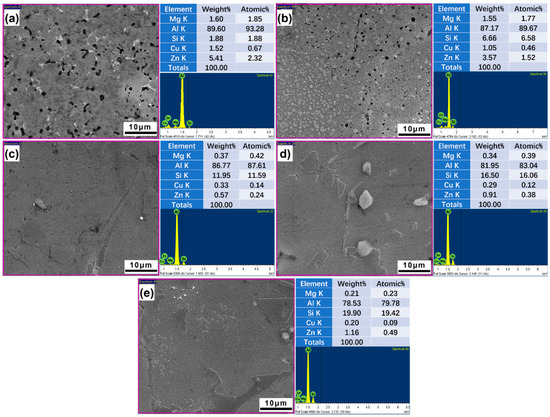
Figure 3.
Microstructures and EDS results of the five layers selected from co-spray-formed Al-Si/7075 bimetallic gradient alloys: (a) first layer, (b) second layer, (c) third layer, (d) fourth layer and (e) fifth layer.
3.2. Hot Deformation Behavior of the Deposited Alloy
Figure 4 shows the true stress–true strain curve of the hot compression deformation of the deposited alloy obtained from the material of the first layer. It can be seen from the figure that the compression curves of the alloys at different temperatures and strain rates present the same rule. In the initial stage of deformation, the flow stress (σ) rises rapidly with the increase in the strain, and then reaches the peak at a certain strain. As the strain increases, the stress begins to decrease. When the deformation is at the same strain rate, the flow stress of the alloy decreases with the increase in temperature. For example, in the case of = 0.001 s−1, when the temperature increases from 300 to 450 °C, the peak stress of the alloy decreases from 98.043 MPa to 46.313 MPa; when the temperature is constant, the flow stress increases with the increase in the strain rate.
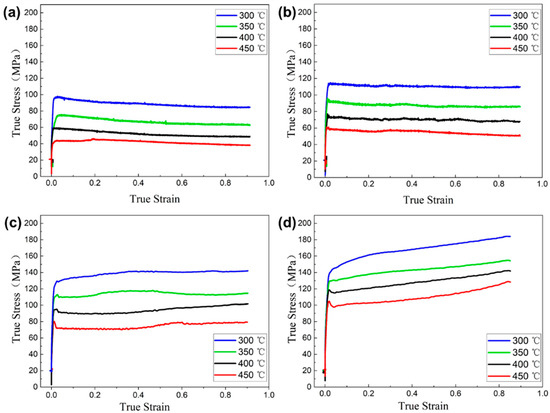
Figure 4.
The true stress–strain curve of the first layer of the gradient alloy by spray deposition: (a) 0.001 s−1, (b) 0.01 s−1, (c) 0.1 s−1, and (d) 1 s−1.
Figure 5 shows the true stress–true strain curve of the hot compression deformation of the deposited alloy obtained from the material of the second layer. The figure shows that the change rule of the hot compression deformation curve in the second layer is similar to that in the first layer material. The flow stress (σ) increases with the increase in the strain at the beginning, and then rises to the maximum at a certain strain. When the strain increases, the stress begins to decrease.
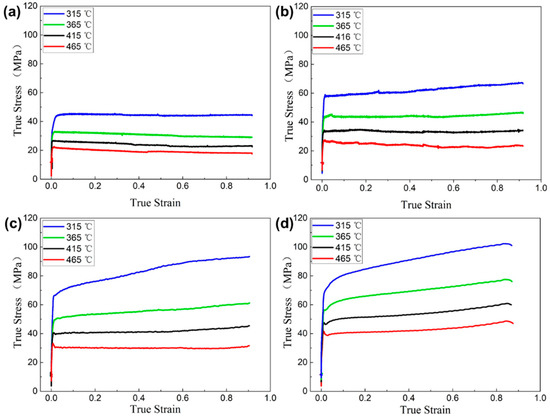
Figure 5.
The true stress–strain curve of the second layer of the gradient alloy by spray deposition: (a) 0.001 s−1, (b) 0.01 s−1, (c) 0.1 s−1, and (d) 1 s−1.
Figure 6 and Figure 7 show the true stress–true strain curve of the hot compression deformation of the deposited alloy obtained from the material of the third and fourth layers, respectively. Compared to the first two layers of materials, the trends of the hot compression deformation curves in the third and fourth layers are generally the same. At a low strain rate, after a short and sharp rise in the initial stage, the stress begins to enter a relatively gentle stage, that is, the stress remains essentially unchanged as the strain increases, and after the temperature increases, it begins to decrease slowly at a certain strain.
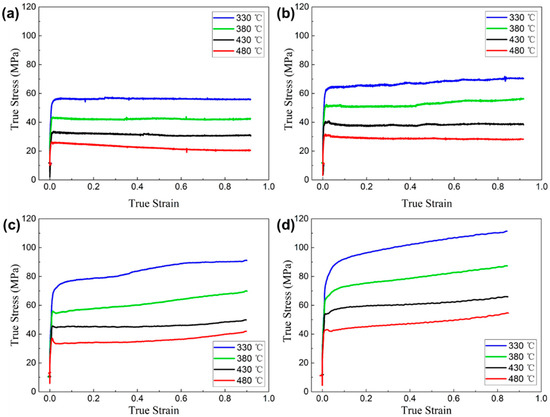
Figure 6.
The true stress–strain curve of the third layer of gradient alloy by spray deposition: (a) 0.001 s−1, (b) 0.01 s−1, (c) 0.1 s−1, and (d) 1 s−1.
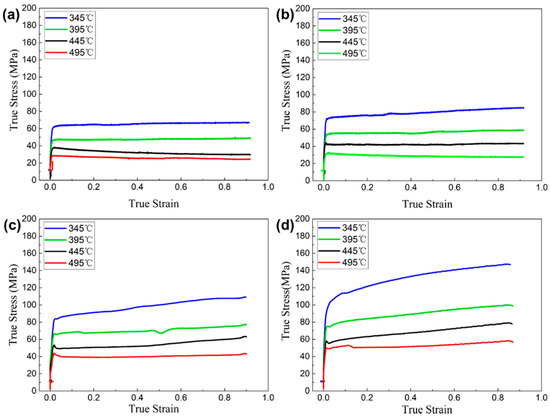
Figure 7.
The true stress–strain curve of the fourth layer of gradient alloy by spray deposition: (a) 0.001 s−1, (b) 0.01 s−1, (c) 0.1 s−1, and (d) 1 s−1.
Figure 8 shows the true stress–true strain curve of the hot compression deformation of the deposited alloy obtained from the material of the fifth layer. Figure 5 shows that the flow stress (σ) also rises rapidly with the increase in the strain in the initial stage of deformation, and then reaches a peak. With a further increase in the strain, except in the case of = 0.001 s−1, the stress of the other three strain rates begins to decrease drastically. In the case of = 1 s−1, the flow stress of the alloy presents a short-term downward trend after reaching the peak, and then at a certain strain, the downward trend tends to be flat, showing a horizontal change with the increase in the strain. The flow stress then starts to decrease after the strain is greater than 0.8. From the true stress-strain curve of each part, the corresponding peak stress of the five layers of materials of the deposited alloy at different temperatures and strain rates can be obtained. The stress values are listed in Table 3.
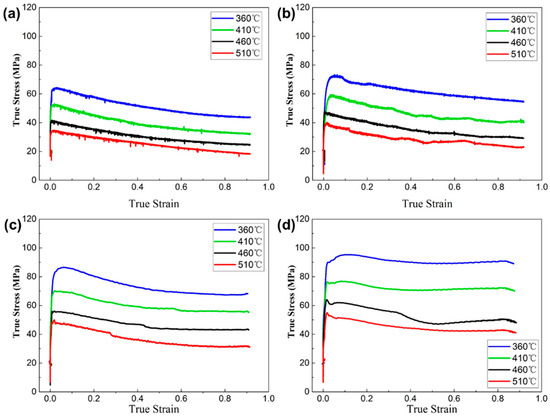
Figure 8.
The true stress–strain curve of the fifth layer of gradient alloy by spray deposition: (a) 0.001 s−1, (b) 0.01 s−1, (c) 0.1 s−1, and (d) 1 s−1.
Table 3.
Peak stress at different temperatures and strain rates (MPa).
During the deformation, the true stress–strain curves of the above five layers of materials are caused by the combined effects of work hardening and dynamic softening [19,20]. The dominant work hardening causes the flow curve to rise rapidly in the initial stage of deformation. When the strain continues to increase, many dislocations and other defects accumulate in the alloy. At this time, the dynamic softening effect gradually increaseand the rising speed of flow stress slows constantly. When the softening rate gradually exceeds the hardening rate and becomes dominant, the flow stress passes the peak point and then decreases [20,21]. As the deformation continues, if the softening rate is greater than the hardening rate, the flow stress continue to decrease. From the change trend of the stress–strain curves, it can be preliminarily judged that the softening process in the hot deformation of the deposited gradient composite alloy includes both dynamic recovery (DRV) and dynamic recrystallization (DRX), which is consistent with the general rule of hot deformation of most aluminum alloys.
With the increase in the strain rate, the deformation time per unit strain shortens, the dislocation density in the alloy increases, and the critical shear stress increases correspondingly in the deformation of the aluminum alloy, resulting in an increase in the flow stress [22,23]. According to dislocation dynamics, the influence of the strain rate on the flow stress during deformation can be explained directly, as shown in Equations (1) and (2) [22,23,24]:
In the equation, ρ refers to the dislocation density;
b refers to the Burgers vector of a dislocation;
v refers to the speed of the dislocation movement, and
m refers to the stress exponent.
As the strain rate increases, the dislocation density or the speed of the dislocation movement increases during compression, and the required external stress increases, resulting in an increase in the flow stress of the aluminum alloy. At the same strain rate, with an increase in strain temperature, the thermal activation of atoms increases, the critical shear stress between atoms decreases, and the softening degree caused by the dynamic recrystallization of the alloy also increase, which ultimately leads to the decrease of stress.
When the strain rate () is constant, the flow stress (σ) decreases significantly with the increase in temperature, which can be attributed to the following points [25]:
- (1)
- As the temperature increases, the kinetic energy of atoms increases, the bonding force between atoms decreases, the movable slip system increases, and the critical shear stress of the dislocation movement decreases, which reduces the deformation resistance and the flow stress.
- (2)
- In the flow softening stage, the softening effect caused by DRV and DRX increase with the increase in temperature. At high temperatures, the cross-slip of screw dislocations and the climb of edge dislocations are more easily excited, making DRV more obvious. With the increase in temperature, both the driving force of the nucleation rate and the grain growth rate of DRX increase, so the softening effect increases and the flow stress decreases.
- (3)
- The increase in temperature reduces the intergranular shear resistance, and facilitates grain boundary sliding. The enhancement in diffusion can eliminate the microcracks caused by grain boundary sliding in time, and increase the amount of grain boundary sliding. In addition, as a result of grain boundary sliding, the stress concentration caused by uneven deformation between adjacent grains can also be relaxed. Therefore, the flow stress decreases.
3.3. Compression Activation Energy of the Deposited Alloy
The results of research on different materials showed that the hot plastic deformation of metals or alloys is a thermal activation process in which dislocations move against resistance. Here, we report the calculation and analysis of the compression activation energy in the respective regions of the five layers of materials obtained from the deposited alloy. According to the Arrhenius relationship, there is a relationship among the macroscopic parameters of hot plastic deformation, such as temperature, flow stress, and strain rate, which can be expressed by the following creep equation [26,27,28,29]:
where Z refers to the Zener–Hollomon parameter, namely, the strain rate (s−1) corrected by temperature;
Q refers to the apparent deformation activation energy (kJ/mol), which reflects the difficulty in the material deformation to an extent (roughly equivalent to the diffusion activation energy of the metal);
R refers to the gas constant, 8.314 J/(mol·K);
and T refers to the absolute temperature (K).
In general, the constitutive equation of a material is a functional relationship between the flow stress of the material and the amount of the strain, strain rate, deformation temperature and other factors. During hot deformation, the peak stress (σp), the steady-state stress (σs), and the flow stress (σ) at each moment all conform to the relationship shown in Equation (4). An ideal constitutive relationship equation is a mathematical relationship model that reflects the relationship among various thermodynamic parameters of a material. There are three commonly used mathematical models as follows:
In the equation, A1, A2, A3, α, and β are all material constants; m and n are stress exponents and applied to the equation α = β/m; Q is the deformation activation energy; and R is the ideal gas constant with a value of 8.314 J·mol−1·K−1. Equation (5) is the power exponential relationship suitable for low stress conditions, Equation (6) is the exponential relationship suitable for high stress conditions, and Equation (7) is the hyperbolic sine function relationship suitable for a wide range of stress levels. We chose to use the hyperbolic sine function relationship.
According to the peak stress at different temperatures and strain rates in each part in Table 1, the relationship curves of ln − lnσs and ln − σs at the respective temperatures in each layer of the deposited alloy are drawn in Figure 9, Figure 10, Figure 11, Figure 12 and Figure 13a,b.
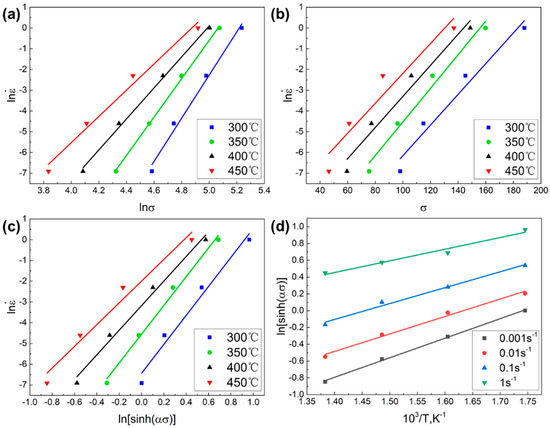
Figure 9.
The relationship between the peak stress, strain rate and deformation temperature in the first layer of the deposited alloy: (a) ln − lnσs, (b) ln − lnσs, (c) ln − ln[sinh(ασ)], (d) ln[sinh(ασ)] − 1/T.
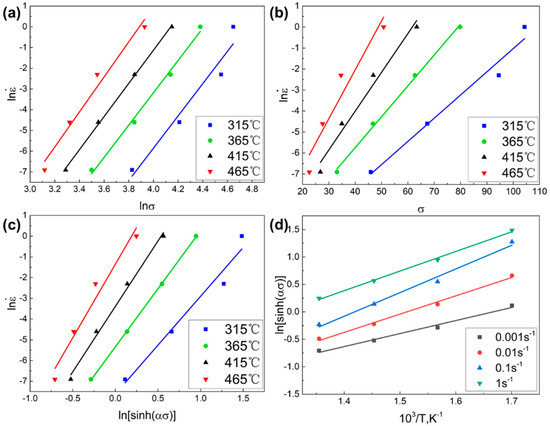
Figure 10.
The relationship between the peak stress, strain rate and deformation temperature in the second layer of the deposited alloy: (a) ln − lnσs, (b) ln − lnσs, (c) ln − ln[sinh(ασ)], (d) ln[sinh(ασ)] − 1/T.
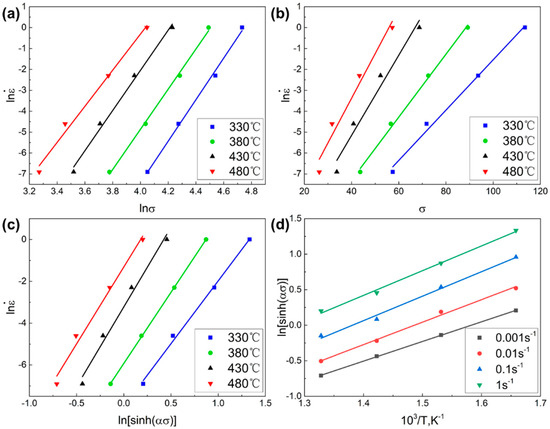
Figure 11.
The relationship between the peak stress, strain rate and deformation temperature in the third layer of the deposited alloy: (a) ln − lnσs, (b) ln − lnσs, (c) ln − ln[sinh(ασ)], (d) ln[sinh(ασ)] − 1/T.
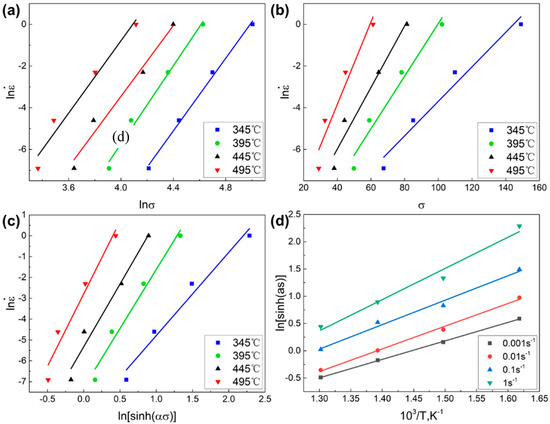
Figure 12.
The relationship between the peak stress, strain rate and deformation temperature in the fourth layer of the deposited alloy: (a) ln − lnσs, (b) ln − lnσs, (c) ln − ln[sinh(ασ)], (d) ln[sinh(ασ)] − 1/T.
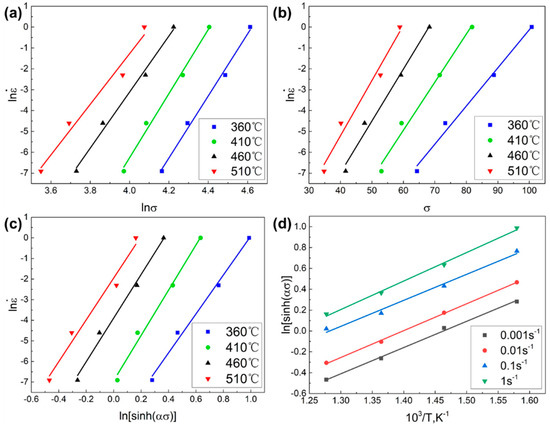
Figure 13.
The relationship between the peak stress, strain rate and deformation temperature in the fifth layer of the deposited alloy: (a) ln − lnσs, (b) ln − lnσs, (c) ln − ln[sinh(ασ)], (d) ln[sinh(ασ)] − 1/T.
A linear regression was then performed on each part. It can be seen from the figure that each line has a linear relationship and is approximately parallel to each other. According to the fitting result, the derivative of ln about lnσs and σs can be obtained; that is, the following relation is satisfied:
Therefore, the slope of each regression curve can be calculated, and then the average value of each slope can be obtained; that is, the values of m and β. According to α = β/m, the corresponding α can then be calculated.
From the relationship between the peak stress, strain rate and deformation temperature of the five layers of materials, the linear fitting results are good, and the linear correlation coefficients of each part are close to one.
According to the values of m and β obtained from the unary linear regression curves of ln − lnσs and ln − σs, the respective α was obtained, and then the relationship curves of ln − ln[sinh(ασ)] at the respective temperatures in each layer of the deposited alloy are drawn, as shown in Figure 9, Figure 10, Figure 11, Figure 12 and Figure 13c. A linear regression was then performed on each part, and the derivative of ln about ln[sinh(ασ)] was obtained according to the fitting results, that is, the following relation is satisfied:
According to the average value of the slope of the regression curve of ln and ln[sinh(ασ)] corresponding to the temperature, n can be obtained. The values of ln[sinh(ασ)] and T of the flow stress of the alloy under different conditions are analyzed, 1000/T and ln[sinh(ασ)] were adopted as the coordinates to draw, and the linear regression was performed. The relationship between 1000/T and ln[sinh(ασ)] is shown in Figure 9, Figure 10, Figure 11, Figure 12 and Figure 13d, from which the slope of each curve can be obtained, and the average value is s. From Equation (7), the expression of the activation energy (Q) of the hyperbolic sine function relationship can be obtained:
According to the above group of diagrams, the slope of the relationship curve between the peak stress, strain rate and deformation temperature in each layer of the deposited alloy can be calculated, and the average value can be used to obtain the values of m, β, n and s. According to Equation (11), the activation energy (Q) corresponding to each part of the deposited alloy can then be calculated, as shown in Table 4. The deformation activation energy of the material can indirectly reflect its deformation ability. It is shown that the refinement of grains increases the number of grain boundaries in the alloy, and facilitates grain boundary sliding during the hot compression deformation of the alloy, which reduces the area of stress concentration and reduces the stress of the alloy during hot compression. For the same type of alloy, the activation energy is proportional to the grain size of the alloy. Therefore, a small grain size can reduce the activation energy of the material, resulting in an easier deformation of the alloy [30,31,32].
Table 4.
Parameters and activation energy in each layer of the material.
As can be seen from the Figure 9, Figure 10, Figure 11, Figure 12 and Figure 13, for each layer of the deposited alloy, both ln[sinh(ασ)] and T−1 reflect a relatively good linear relationship, indicating that the relationship between the flow stress, strain rate and deformation temperature conforms to the Arrhenius relationship. Therefore, the hot deformation flow stress of the deposited alloy can be described by Z. The parameters of each layer of material in Table 2 were applied to Equation (3), and the corresponding values of Z were obtained after a calculation. The relationship curve of lnZ − ln[sinh(ασ)] was then drawn, and the linear fitting then performed, as shown in Figure 14.
Table 2.
Deformation parameters of the deposited alloy.
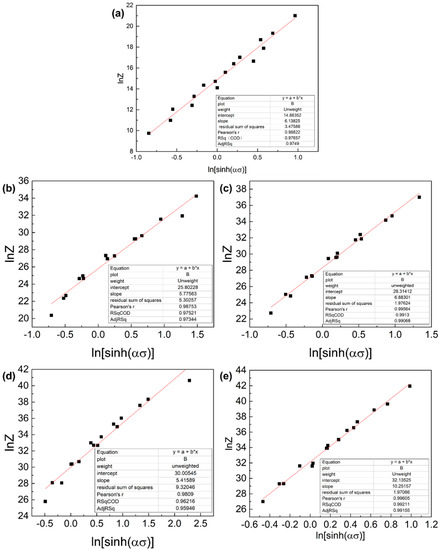
Figure 14.
The relationship curve between lnZ and ln[sinh(ασ)] of each layer of alloy: (a) first layer, (b) second layer, (c) third layer, (d) fourth layer and (e) fifth layer.
Figure 14 that the lnZ − ln[sinh(ασ)] relationship curve corresponding to each layer of material conforms to the linear law well. The slope of each straight line is its stress index n value, and its intercept is lnA. After fitting all the data, n and lnA of each part can be obtained. The Z parameter has the following relationship with the flow stress σ:
Take the logarithm of both sides of Equation (12) at the same time to obtain:
The calculated values of Q, σ, n, and A for each layer of material are entered into Equations (3) and (7) to obtain the flow stress constitutive equation of each layer of the deposited alloy during the thermal compression deformation:
4. Conclusions
In this paper, the hot compression deformation behavior of different composition layers of a co-spray-formed gradient deposited alloy was studied. According to the microstructure analysis and EDS results of the five layers from gradient deposited alloy, the silicon content gradually increases from bottom to top, and the microstructures of the gradient alloy at different heights show the characteristics corresponding to the silicon content. It was found that with the decrease in the strain rate and the increase in temperature, the hot compression flow stress of the deposited alloy gradually decreased. The magnitude of the flow stress during the hot compression was mainly determined by work hardening and flow softening. The relationship between the flow stress, temperature and strain rate conformed to the Arrhenius relationship. The deformation activation energy of the co-spray formed gradient alloy gradually increased from bottom to top in the height direction, which were 100.15, 167.35, 185.54, 208.78 and 220.83 KJ/mol. The degree of difficulty in the deformation of co-spray-formed gradient alloys increased with the increase in the height of the alloy layer. This rule was consistent with the distribution trend of the silicon content in the alloy, due to the influence of silicon content and morphology on the thermal deformation behavior of the bimetallic gradient alloy. Finally, the flow stress constitutive equation was calculated for each layer of alloy, which is of use to understanding the deformation behavior of the co-spray-formed gradient alloy and the subsequent study of the densification process.
Author Contributions
Conceptualization, methodology, L.Y., F.C. and J.S.; investigation, H.S. (Heqian Song) and X.G.; visualization, L.Y., S.J. and H.S. (Hongxian Shen); data curation, L.Y., H.S. (Hongxian Shen), H.S. (Heqian Song) and X.G.; formal analysis, L.Y., L.Z. and J.S.; writing—original draft preparation, L.Y., F.C. and L.Z.; writing—review and editing, H.S. (Hongxian Shen) and J.S. All authors have read and agreed to the published version of the manuscript.
Funding
This study was supported by the National Natural Science Foundation of China (grant nos. 51901057, 51801044, and 52071118); the China Postdoctoral Science Foundation (nos. 2019M661275 and 2020T130030ZX); the Scientific Research Foundation of Harbin Institute of Technology, China (grant no. AUGA5710001320); and the “Head Goose” project of Heilongjiang Province (grant no. AUEA5640208620).
Institutional Review Board Statement
Not applicable.
Informed Consent Statement
Not applicable.
Data Availability Statement
Data sharing is not applicable.
Conflicts of Interest
The authors declare no conflict of interest.
References
- Debroy, T.; Wei, H.L.; Zuback, J.S.; Mukherjee, T.; Elmer, J.W.; Milewski, J.O.; Beese, A.M.; Wilson-Heid, A.D.; De, A.; Zhang, W. Additive manufacturing of metallic components-Process, structure and properties. Prog. Mater Sci. 2018, 92, 112–224. [Google Scholar] [CrossRef]
- Gupta, A.; Talha, M. Recent development in modeling and analysis of functionally graded materials and structures. Prog. Aeronaut. Sci. 2015, 79, 1–14. [Google Scholar] [CrossRef]
- Kieback, B.; Neubrand, A.; Riedel, H. Processing techniques for functionally graded materials. Mater. Sci. Eng. A 2003, 362, 81–106. [Google Scholar] [CrossRef]
- Li, W.; Karnati, S.; Kriewall, C.; Liou, F.; Newkirk, J.; Taminger, K.M.B.; Seufzer, W.J. Fabrication and characterization of a functionally graded material from Ti-6Al-4V to SS316 by laser metal deposition. Addit. Manuf. 2017, 14, 95–104. [Google Scholar] [CrossRef]
- Naebe, M.; Shirvanimoghaddam, K. Functionally graded materials: A review of fabrication and properties. Appl. Mater. Today 2016, 5, 223–245. [Google Scholar] [CrossRef]
- Sobczak, J.J.; Drenchev, L. Metallic Functionally Graded Materials: A Specific Class of Advanced Composites. J. Mater. Sci. Technol. 2013, 29, 297–316. [Google Scholar] [CrossRef]
- Sola, A.; Bellucci, D.; Cannillo, V. Functionally graded materials for orthopedic applications-an update on design and manufacturing. Biotechnol. Adv. 2016, 34, 504–531. [Google Scholar] [CrossRef]
- Xiao, L.; Song, W. Additively-manufactured functionally graded Ti-6Al-4V lattice structures with high strength under static and dynamic loading: Experiments. Int. J. Impact Eng. 2018, 111, 255–272. [Google Scholar] [CrossRef]
- Lee, S.W.; Yeh, J.W.; Liao, Y.S. Premium 7075 Aluminium Alloys Produced by Reciprocating Extrusion. Adv. Eng. Mater. 2004, 6, 936–943. [Google Scholar] [CrossRef]
- Liu, D.; Atkinson, H.V.; Kapranos, P.; Jirattiticharoean, W.; Jones, H. Microstructural evolution and tensile mechanical properties of thixoformed high performance aluminium alloys. Mater. Sci. Eng. A 2003, 361, 213–224. [Google Scholar] [CrossRef]
- Ma, P.; Prashanth, K.G.; Scudino, S.; Jia, Y.; Wang, H.; Zou, C.; Wei, Z.; Eckert, J. Influence of Annealing on Mechanical Properties of Al-20Si Processed by Selective Laser Melting. Metals 2014, 4, 28–36. [Google Scholar] [CrossRef]
- Raghukiran, N.; Kumar, R. Processing and dry sliding wear performance of spray deposited hyper-eutectic aluminum–silicon alloys. J. Mater. Process. Technol. 2013, 213, 401–410. [Google Scholar] [CrossRef]
- Wang, Z.; Wang, A.; Xie, J.; Liu, P. Hot Deformation Behavior and Strain-Compensated Constitutive Equation of Nano-Sized SiC Particle-Reinforced Al-Si Matrix Composites. Materials 2020, 13, 1812. [Google Scholar] [CrossRef] [Green Version]
- Yu, L.; Cao, F.; Hou, L.; Jia, Y.; Shen, H.; Li, H.; Ning, Z.; Xing, D.; Sun, J. The study of preparation process of spray formed 7075/Al–Si bimetallic gradient composite plate. J. Mater. Res. 2017, 32, 3109–3116. [Google Scholar] [CrossRef]
- Jia, Y.; Cao, F.; Shu, G.; Pan, M.; Liu, J.; Sun, J.F. Hot deformation behavior of spray-deposited Al–Zn–Mg–Cu alloy. Mater. Des. 2014, 53, 79–85. [Google Scholar] [CrossRef]
- Lin, Y.C.; Li, L.T.; Xia, Y.C.; Jiang, Y.Q. Hot deformation and processing map of a typical Al–Zn–Mg–Cu alloy. J. Alloy. Compd. 2013, 550, 438–445. [Google Scholar] [CrossRef]
- Hu, X.G.; Yang, B.C.; Jun, X.; Wang, H.J. Hot Deformation Behavior of A390 Hypereutectic Al-Si Alloy. Mater. Sci. Forum 2013, 749, 88–95. [Google Scholar] [CrossRef]
- Cui, C.; Schulz, A.; Schimanski, K.; Zoch, H.W. Spray forming of hypereutectic Al–Si alloys. J. Mater. Process. Technol. 2009, 209, 5220–5228. [Google Scholar] [CrossRef]
- Lei, X.; Dai, G.; Huang, X.; Zhao, J.; Jing, H.; Gao, J. Foundation and application of Al–Zn–Mg–Cu alloy flow stress constitutive equation in friction screw press die forging. Mater. Des. 2013, 47, 465–472. [Google Scholar]
- Cui, C.; Schulz, A.; Epp, J.; Zoch, H.W. Deformation behavior of spray-formed hypereutectic Al–Si alloys. J. Mater. Sci. 2010, 45, 2798–2807. [Google Scholar] [CrossRef]
- Ha, T.K.; Park, W.J.; Ahn, S.; Chang, Y.W. Fabrication of spray-formed hypereutectic Al–25Si alloy and its deformation behavior. J. Mater. Process. Technol. 2002, 130, 691–695. [Google Scholar] [CrossRef]
- Martin, J.L.; Piccolo, B.L.; Kruml, T.; Bonneville, J. Characterization of thermally activated dislocation mechanisms using transient tests. Mater. Sci. Eng. A. 2002, 322, 118–125. [Google Scholar] [CrossRef]
- Walgraef, D. Rate equation approach to dislocation dynamics and plastic deformation. Mater. Sci. Eng. A. 2002, 322, 167–175. [Google Scholar] [CrossRef]
- Charlton, T.M. Progress in Solid Mechanics. Nature 1962, 194, 60. [Google Scholar] [CrossRef]
- Guo, S. Solidification Behavior of Spray Deposited Al-Zn-Mg-Cu Alloys and Their Microstructure Evolution during Thermal Processing. Ph.D. Thesis, Harbin Institute of Technology, Harbin, China, 2011. [Google Scholar]
- Lv, B.J.; Peng, J.; Shi, D.W.; Tang, A.T.; Pan, F.S. Constitutive modeling of dynamic recrystallization kinetics and processing maps of Mg–2.0Zn–0.3Zr alloy based on true stress–strain curves-ScienceDirect. Mater. Sci. Eng. A. 2013, 560, 727–733. [Google Scholar] [CrossRef]
- Cheng, L.; Chang, H.; Tang, B.; Kou, H.C.; Li, J.S. Deformation and dynamic recrystallization behavior of a high Nb containing TiAl alloy. J. Alloy. Compd. 2013, 552, 363–369. [Google Scholar] [CrossRef]
- Mcqueen, H.J.; Ryan, N.D. Constitutive analysis in hot working. Mater. Sci. Eng. A. 2002, 322, 43–63. [Google Scholar] [CrossRef]
- Bhattacharya, R.; Wynne, B.P.; Rainforth, W.M. Flow softening behavior during dynamic recrystallization in Mg–3Al–1Zn magnesium alloy. Scr. Mater. 2012, 67, 277–280. [Google Scholar] [CrossRef]
- Zhang, H.; Jin, N.P.; Chen, J.H. Hot deformation behavior of 7150 aluminum alloy during compression at elevated temperature. Trans. Nonferr. Met. Soc. China 2011, 21, 437–442. [Google Scholar] [CrossRef]
- Cai, Y.H.; Lang, Y.J.; Cao, L.Y.; Zhang, J.S. Enhanced grain refinement in AA7050 Al alloy by deformation-induced precipitation. Mater. Sci. Eng. A. 2012, 549, 100–104. [Google Scholar] [CrossRef]
- Rokni, M.R.; Zarei-Hanzaki, A.; Roostaei, A.A.; Abolhasani, A. Constitutive base analysis of a 7075 aluminum alloy during hot compression testing. Mater. Des. 2011, 32, 4955–4960. [Google Scholar] [CrossRef]
Publisher’s Note: MDPI stays neutral with regard to jurisdictional claims in published maps and institutional affiliations. |
© 2021 by the authors. Licensee MDPI, Basel, Switzerland. This article is an open access article distributed under the terms and conditions of the Creative Commons Attribution (CC BY) license (https://creativecommons.org/licenses/by/4.0/).