Article

The Effect of Solidification Rate on the Microstructure and Mechanical Properties of Pure Magnesium

1
Department of Materials Science and Engineering, University of Wisconsin Milwaukee, EMS Bldg. CEAS, 3200 N Cramer St, Milwaukee, WI 53211, USA
2
Industrial Engineering Departement, University of Wisconsin Milwaukee, EMS Bldg. CEAS, 3200 N Cramer St, Milwaukee, WI 53211, USA
*
Author to whom correspondence should be addressed.
Metals 2021, 11(8), 1264; https://doi.org/10.3390/met11081264
Submission received: 19 July 2021 / Revised: 1 August 2021 / Accepted: 3 August 2021 / Published: 11 August 2021

Abstract

:
Magnesium, Mg, has been widely investigated due to its promising potential as magnesium alloys for various applications, particularly as biomedical implantation devices among other medical applications. This work investigates the influence of different cooling rates on the strength of pure Mg. The cooling rates were set to cover a low cooling rate LCR (0.035 °C/s) in an insulated furnace, a moderate cooling rate MCR (0.074 °C/s) in uninsulated-ends furnace, and a high cooling rate HCR (13.5 °C/s) in liquid CO2. The casting process was accomplished using a closed system of melting and cooling due to the reactivity-flammability of magnesium in order to minimize processing defects and increase the safety factor. The as-cast samples were metallographically examined for their microstructure, and properties such as impact strength, hardness, and tension were determined. Increasing the solidification rate from 0.035 °C/s to 0.074 °C/s increased the hardness from 30 to 34 Rockwell Hardness and the UTS from 48 to 67 MPa. A higher solidification rate of 13.5 °C/s further enhanced the hardness to 48 Rockwell Hardness and the UTS to 87 MPa in comparison to the 0.074 °C/s cooling rate. Additionally, the fracture behavior and morphology were investigated. It was found that in general, the mechanical properties tended to improve by refining the grain structure.

1. Introduction

Lately, the field of bio-medical implants has made tremendous progress in employing advanced alloying systems and techniques for fabricating implantation devices. Besides Mg, other metals have been used in orthopedic applications such as titanium, stainless steel, cobalt, zinc, and others [1,2]. Moreover, Mg and its alloys have been used in various applications such as automotive, aerospace, medical, electronic, non-structural, hydrogen storage, and sports [3,4]. Throughout the development of biomedical implantation devices, several alloys have been tested for their properties and bio-compatibility. It has been found that some metals such as iron have poor biocompatibility. Iron stents implanted in rabbits caused an inflammatory response and/or neointimal proliferation, even though this did not lead to systemic toxicity [5]. Other bio-absorbable implantation devices made with different metals had limited use due to the low recommended daily dosage. However, Mg shows good compatibility with a high allowable intake and no systemic toxicity.
In addition, the density of magnesium and its alloys (1.73–1.85 g/cm3) is close to the cortical bone density (1.75 g/cm3). The elastic modulus of magnesium (41–45 GPa) is also close to that of natural bone (3–20 GPa) in comparison with other metals, which helps in reducing stress shielding of the human bone (i e reduction in bone density) [6,7]. Mg possesses an adequate specific ratio [8], with an hexagonal close-packed (HCP) crystal structure, a density of 1.738 g/cm3 including an electrochemical potential of −2.37 V. In the as-cast condition, Mg exhibits poor mechanical properties (yield strength, ultimate tensile strength, and elongations of 27.5 MPa, 97.5, and 7.31, respectively [9]. Additionally, Mg exhibits a fast degradation rate of 2.89 mm/year in 0.9% NaCl solution [6,7,10]. Moreover, the formability of as-cast Mg at room temperature is relatively poor due to the localized slip and the build-up of localized stresses at the grain boundaries [10]. Redha and Sreekanth [11] reviewed the use of magnesium alloys and composites in orthopedic implants. Their work highlighted the close match of the physical and mechanical properties of Mg to the bone, besides other benefits of using magnesium for orthopedic applications. The set of advantages can be summarized as a low density, high specific strength, high damping capacity, good biocompatibility, and reduced stress shielding effect. Nevertheless, Mg and its alloys need further development in order to have improved corrosion performance and exhibited mechanical properties if they are to be employed as highly efficient orthopedic implants.
In particular, Mg shows good biocompatibility with a high allowable daily dosage (240–420 mg/day) and no systemic toxicity or infection [6,7]. In general, for biomedical applications, different elements, which can be a specific type of metal or combination of metals, have been considered as bio-absorbable elements as discussed in numerous studies [12,13,14,15,16,17,18,19,20,21,22,23,24,25,26,27,28,29,30,31,32,33,34,35]. Due to the physical properties and good biocompatibility of Mg alloys in the human body, magnesium and its alloys have been used in several biomedical applications such as stents, screws, pins, needles, and for load-bearing orthopedic applications. The results of using Mg alloys as implants have been reported to be positive in animals and humans. As an example, consider the case where a stent was implanted in the left lung of a baby whose weight was 1.7 kg and the healing process post-implantation was reported to be highly successful [36].
The main advantages of using biodegradable implants include the elimination of multiple surgeries and the biodegradation process, which occurs spontaneously due to the low thermodynamic stability of magnesium alloys. Furthermore, Mg can be absorbed as a vitamin by the body during the healing process. In addition, it stimulates multiple enzyme systems and leads to increased formation of new bones. However, pure Mg has poor mechanical properties and low corrosion resistance in the as-cast condition. In addition, the flammability and reactivity of magnesium increases the probability of inducing processing defects during the melting and solidification processes. These defects such as gas porosity and impurities also contribute to reducing the strength of Mg alloys and to increase the tendency of these alloys to accelerated corrosion [6,37,38,39].
Alternatively, several strengthening mechanisms have been targeted in order to improve the performance of magnesium. One of these mechanisms is grain refinement, which is governed by the Hall–Petch equation. This can be achieved by implementing high solidification rates. Pang et al. [40] investigated the relationship between cooling rates and the performance of Mg-rare earth element-based alloys. In their work, they investigated the influence of low cooling rates (0.7–3.6 °C/s) on the mechanical properties and microstructure of Mg–10Gd–3Y–0.5Zr. The mold was designed with a gradual tapered shape of various thicknesses to meet the goal of having multiple zones with different cooling rates. A sand casting process was used in this study. Although the difference in cooling rates was not significant, a change in grain size from 59 µm to 39 µm was found to take place with increasing cooling rates. It was found that the strength and hardness were both improved due to the effect of refining the grain microstructure. Accordingly, in this work, the influence of the rate of solidification on the exhibited microstructure and mechanical properties of pure Mg is investigated.

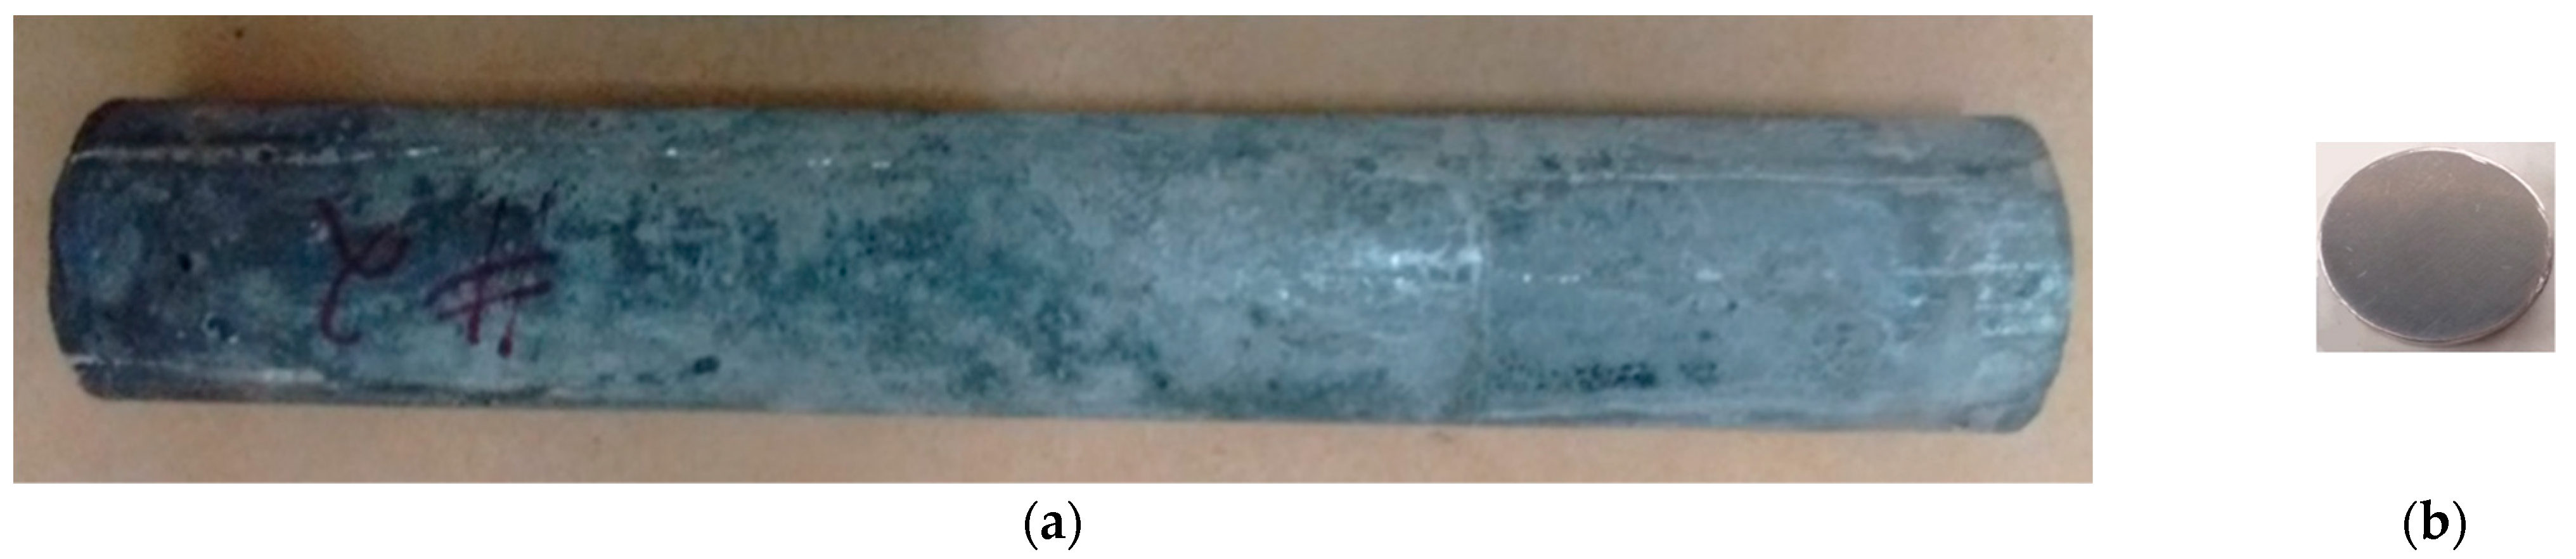
2. Materials and Methods

Various fabrication steps were conducted in casting the final samples from raw materials. Due to the high reactivity and flammability of Mg, the casting process was carried out in closed melting and cooling systems. Pure magnesium (99.8%) in the form of rods (1.3” diameter × 12” length) were purchased from Alfa Aesar and the certificate of analysis was obtained using inductively coupled plasma to confirm the impurity content. Table 1 shows the impurity content, which was found to be below the tolerance limits [41,42].
Mg has a high decomposition (evaporation) rate, which increases with increasing temperature, in addition to the oxidation that occurs during processing, not to mention other process defects that may occur in the castings. Alternatively, using traditional methods to achieve rapid solidification compromises the safety due to the high flammability-reactivity of magnesium. Optimized casting systems and procedures were developed to enhance the casting process. The process consisted of two parts: melting and quenching. The designed system for melting used a combination of negative and positive pressure both static and dynamic, which can be used for different types of alloying systems, especially flammable-reactive metals with high decomposition rates. The designed system was set to achieve four goals: producing a safe and efficient system; reducing the processing defects to attain alloys with optimum properties; reducing the manufacturing cost; and improving the environmental efficiency. Figure 1a shows a casted sample of Mg. The cooling rates were set to cover a low cooling rate LCR (0.035 °C/s) in an insulated furnace, moderate cooling rate MCR (0.074 °C/s) in an uninsulated-ends furnace, and high cooling rate HCR (13.5 °C/s) in liquid CO2. High solidification (13.5 °C/s) was achieved by liquid CO2 quenching after dropping the crucible down into the developed quenching equipment that was stationed right under the melting setup. Moreover, the established procedure reduced the fabrication cost and risk factor of casting magnesium since Mg is highly flammable and oxidation prone at high temperatures. Magnesium is rather soft physically and fast to degrade in water, hence the samples were briefly exposed to water during the grinding process with SiC paper up to 1200. Hence, the grinding process was achieved by using two polishing stages. The first one was done using 1 µm alumina solution for a rather short time. To obtain a good surface finishing, further polishing in a vibratory polisher (ViboMet 2 from Buehler, IL, USA) was performed with a developed recipient that consisted of 200 mL polishing oil and 0.5 g of Al2O3 powder (0.05 µm), as shown in Figure 1b.
A Stemi 2000-C stereoscope from Zeiss equipped with an Axiocam ERc 5s camera equipped with acquired flexibility and 5 megapixel color imaging capability was used to analyze the macrostructure and fracture mechanism after impact. For microstructural determinations, an Axio vert A1 from Zeiss was used. The instrument was used to measure the grain size and to observe the microstructural features. The samples were taken from different locations of each casting. The grain size was determined according to the ASTM standard E112-G6, where fifteen measurements were taken for each sample after grinding, polishing, and etching. For further microstructural analysis, a JEOL JSM-6460 LV scanning electron microscope (SEM) with an energy dispersive x-ray spectrometer (EDS) were employed.
Tensile tests were carried out using an Instron Bluehill 3365 universal testing machine. Four samples were made for each casting according to ASTM B557-subsize. Charpy impact properties were determined using a Tinus Olsen impact testing machine (model IT 504). Four samples from different locations were machined out and tested for each alloy according to ASTM E23-16b. The hardness of the alloys was measured using a Rockwell Hardness tester, digital model Macromet II Twin from Bueler. The test was done according to the ASTM E-18 standard, where a scale H with 1/8” ball indenter made of tungsten carbide was used. The load weight was 60 kg and the speed control had 5 and 10 s load time. For assessing the hardness properties, a minimum of 30 readings from different regions of each alloy were recorded. Additionally, error bars were added where applicable.

3. Results and Discussion
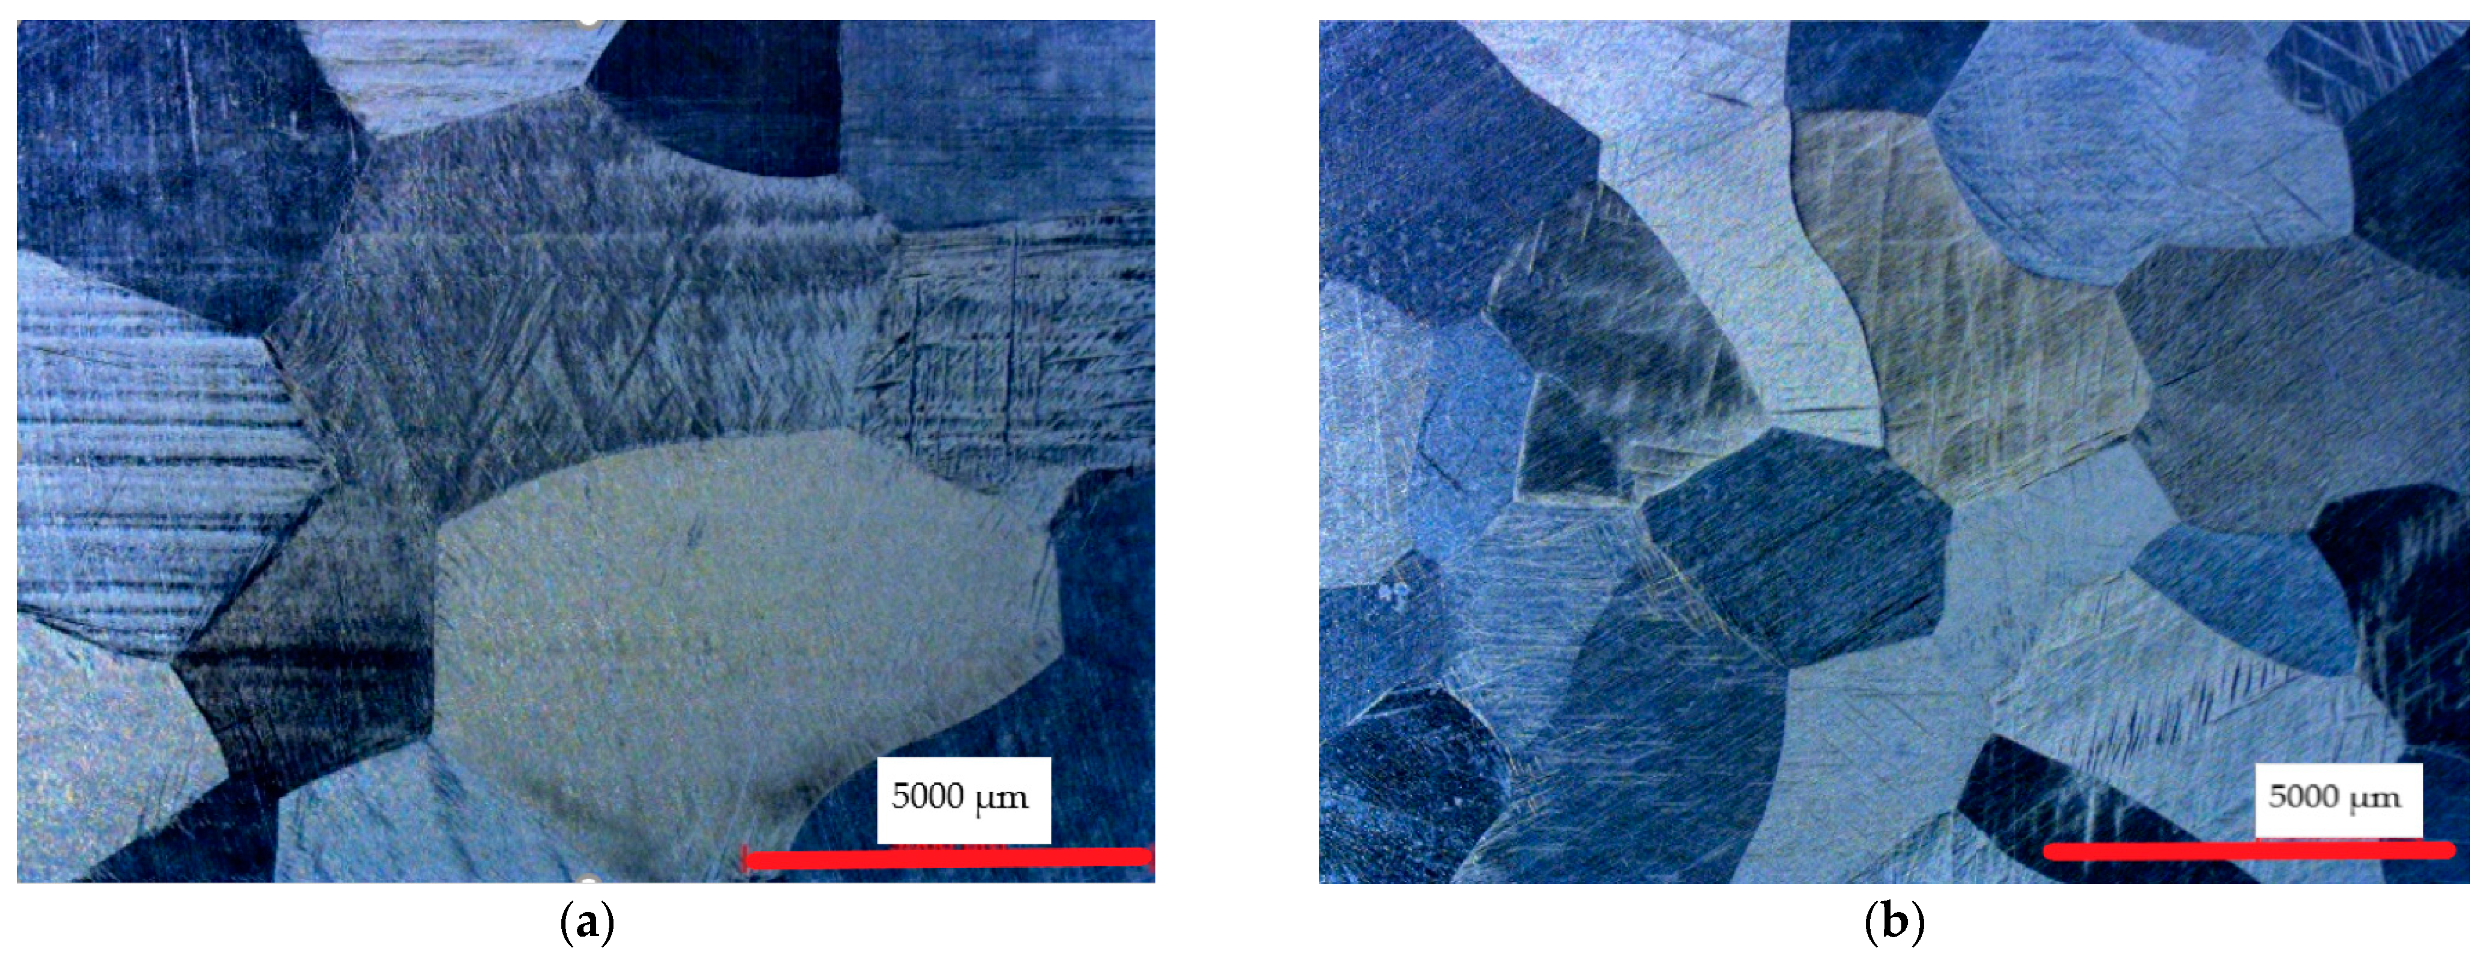
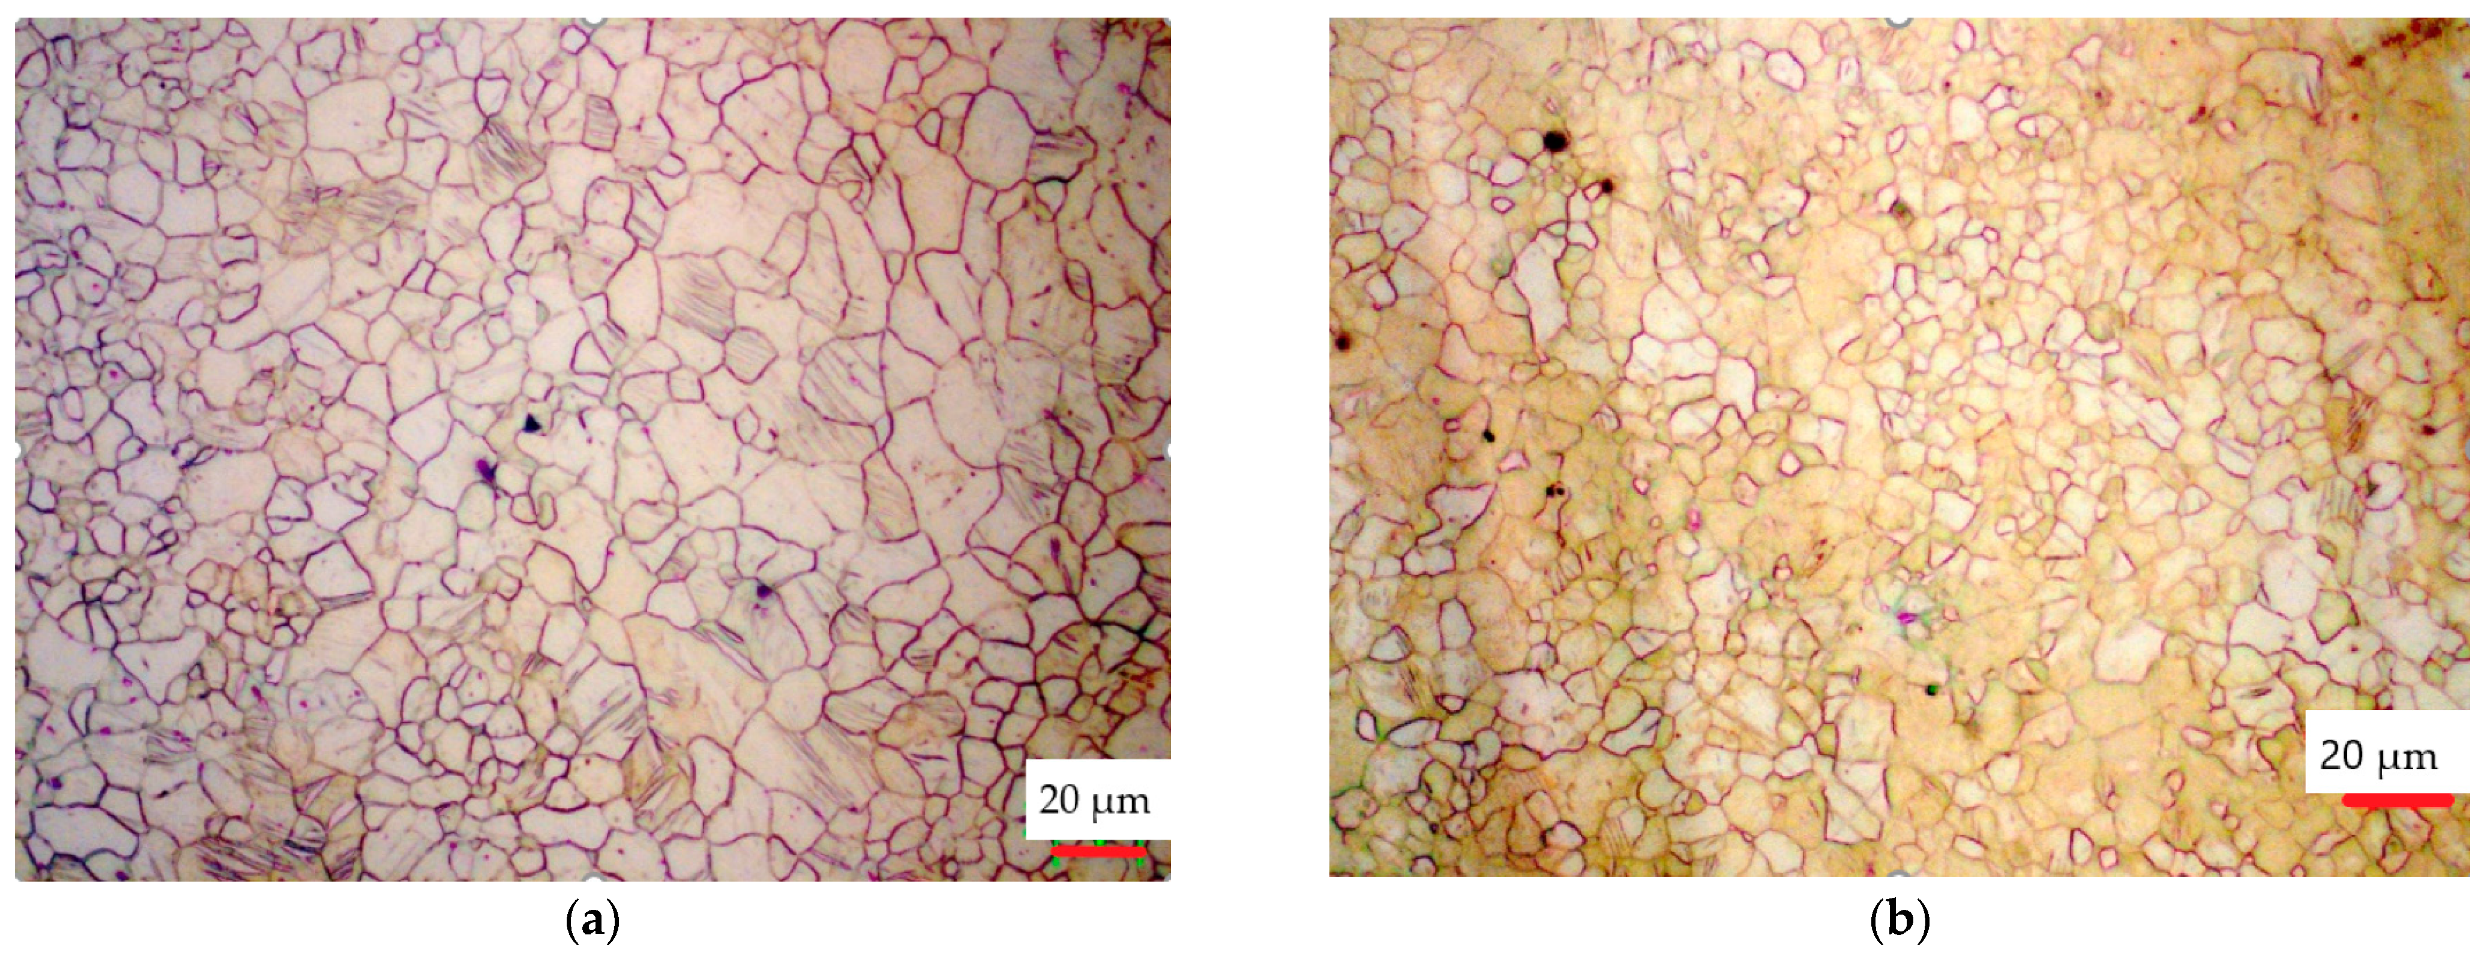
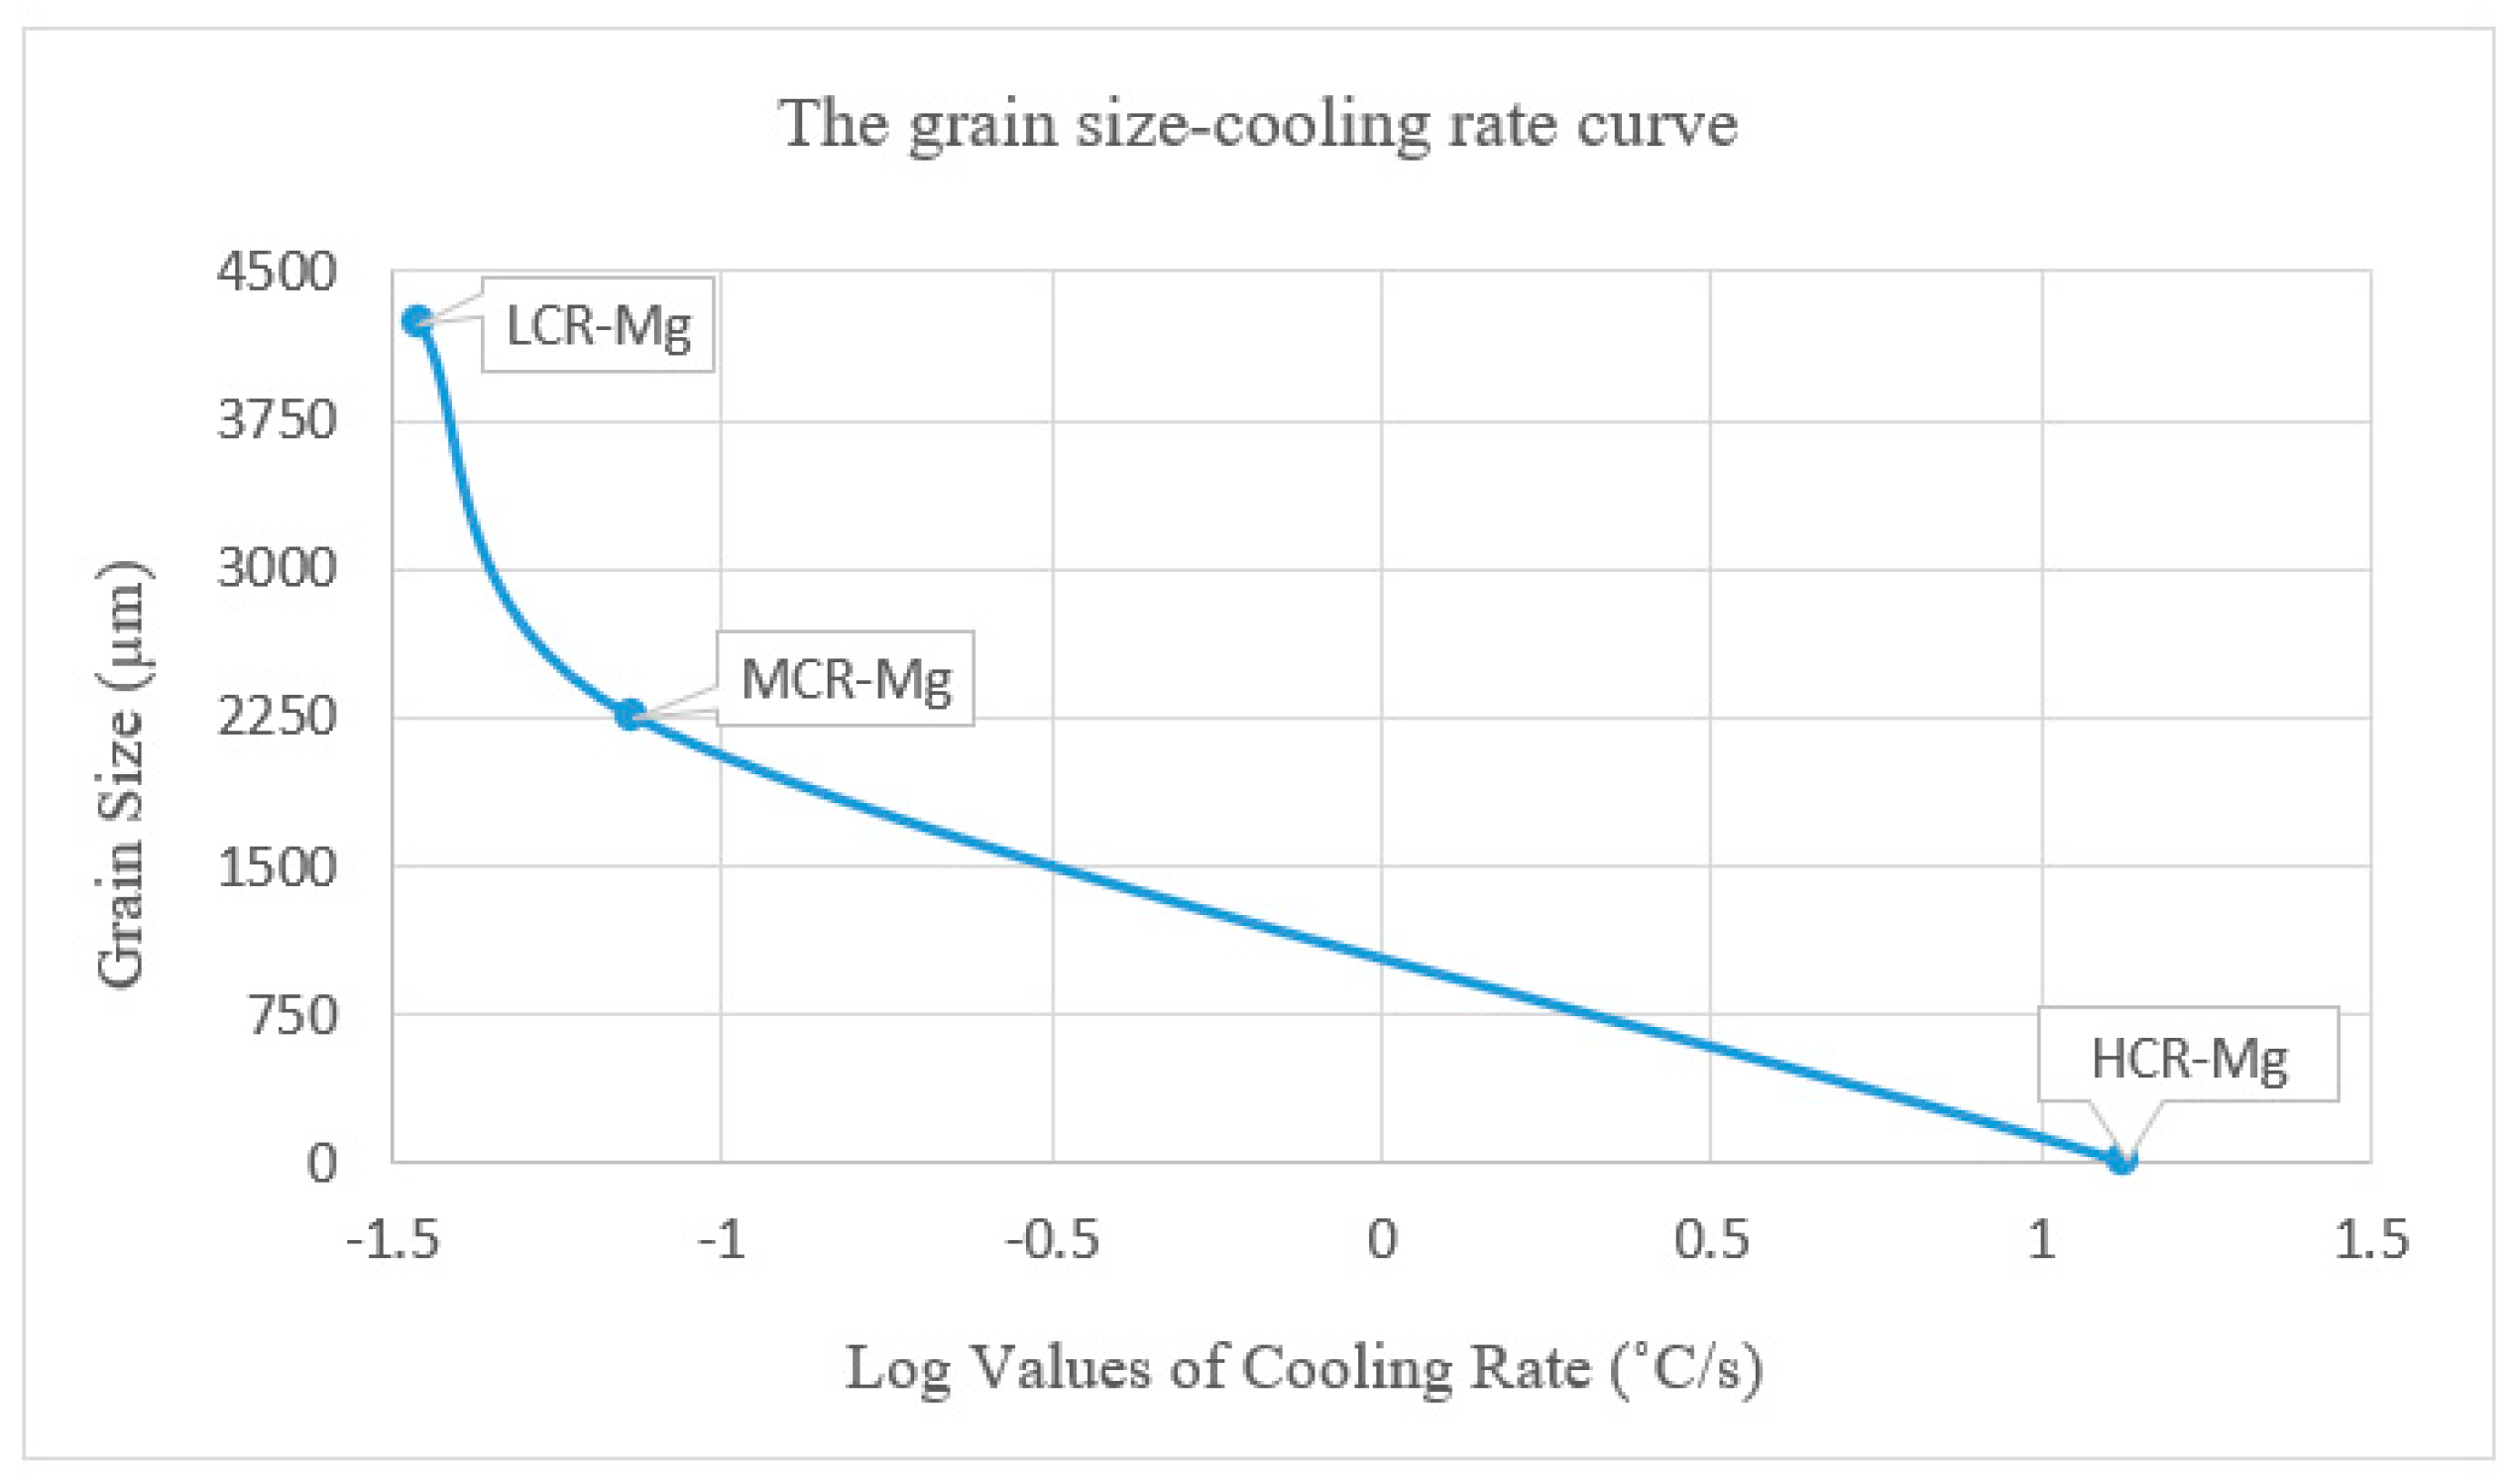
3.1. Microstructure

Imaging of the exhibited microstructures was conducted after etching the polished samples with a modified etchant solution consisting of 24 mL of distilled water, 75 mL ethylene glycol, and 2 mL of nitric acid for 1 min [41]. The microstructure of pure Mg was analyzed for grain size determinations, microstructural observations, and for determinations of the effect of the various cooling rates.
The average grain size of pure Mg that was slowly cooled in a completely insulated furnace LCR-Mg (0.035 °C/s) was found to be 4235 µm, as shown in Figure 2a. Under a moderate cooling rate MCR-Mg (0.074 °C/s), the grain size was found to be 2257 µm, (see Figure 2b), but it decreased significantly when quenched in liquid CO2 (13.5 °C/s) down to an average range of 6 µm to 12 µm, as shown in Table 2. Figure 3 shows the microstructure of rapidly cooled HCR-Mg. The influence of the cooling rate on the grain size of pure magnesium is illustrated in Figure 4, which was constructed to show the full scale of the grain size and the log values of cooling rate.

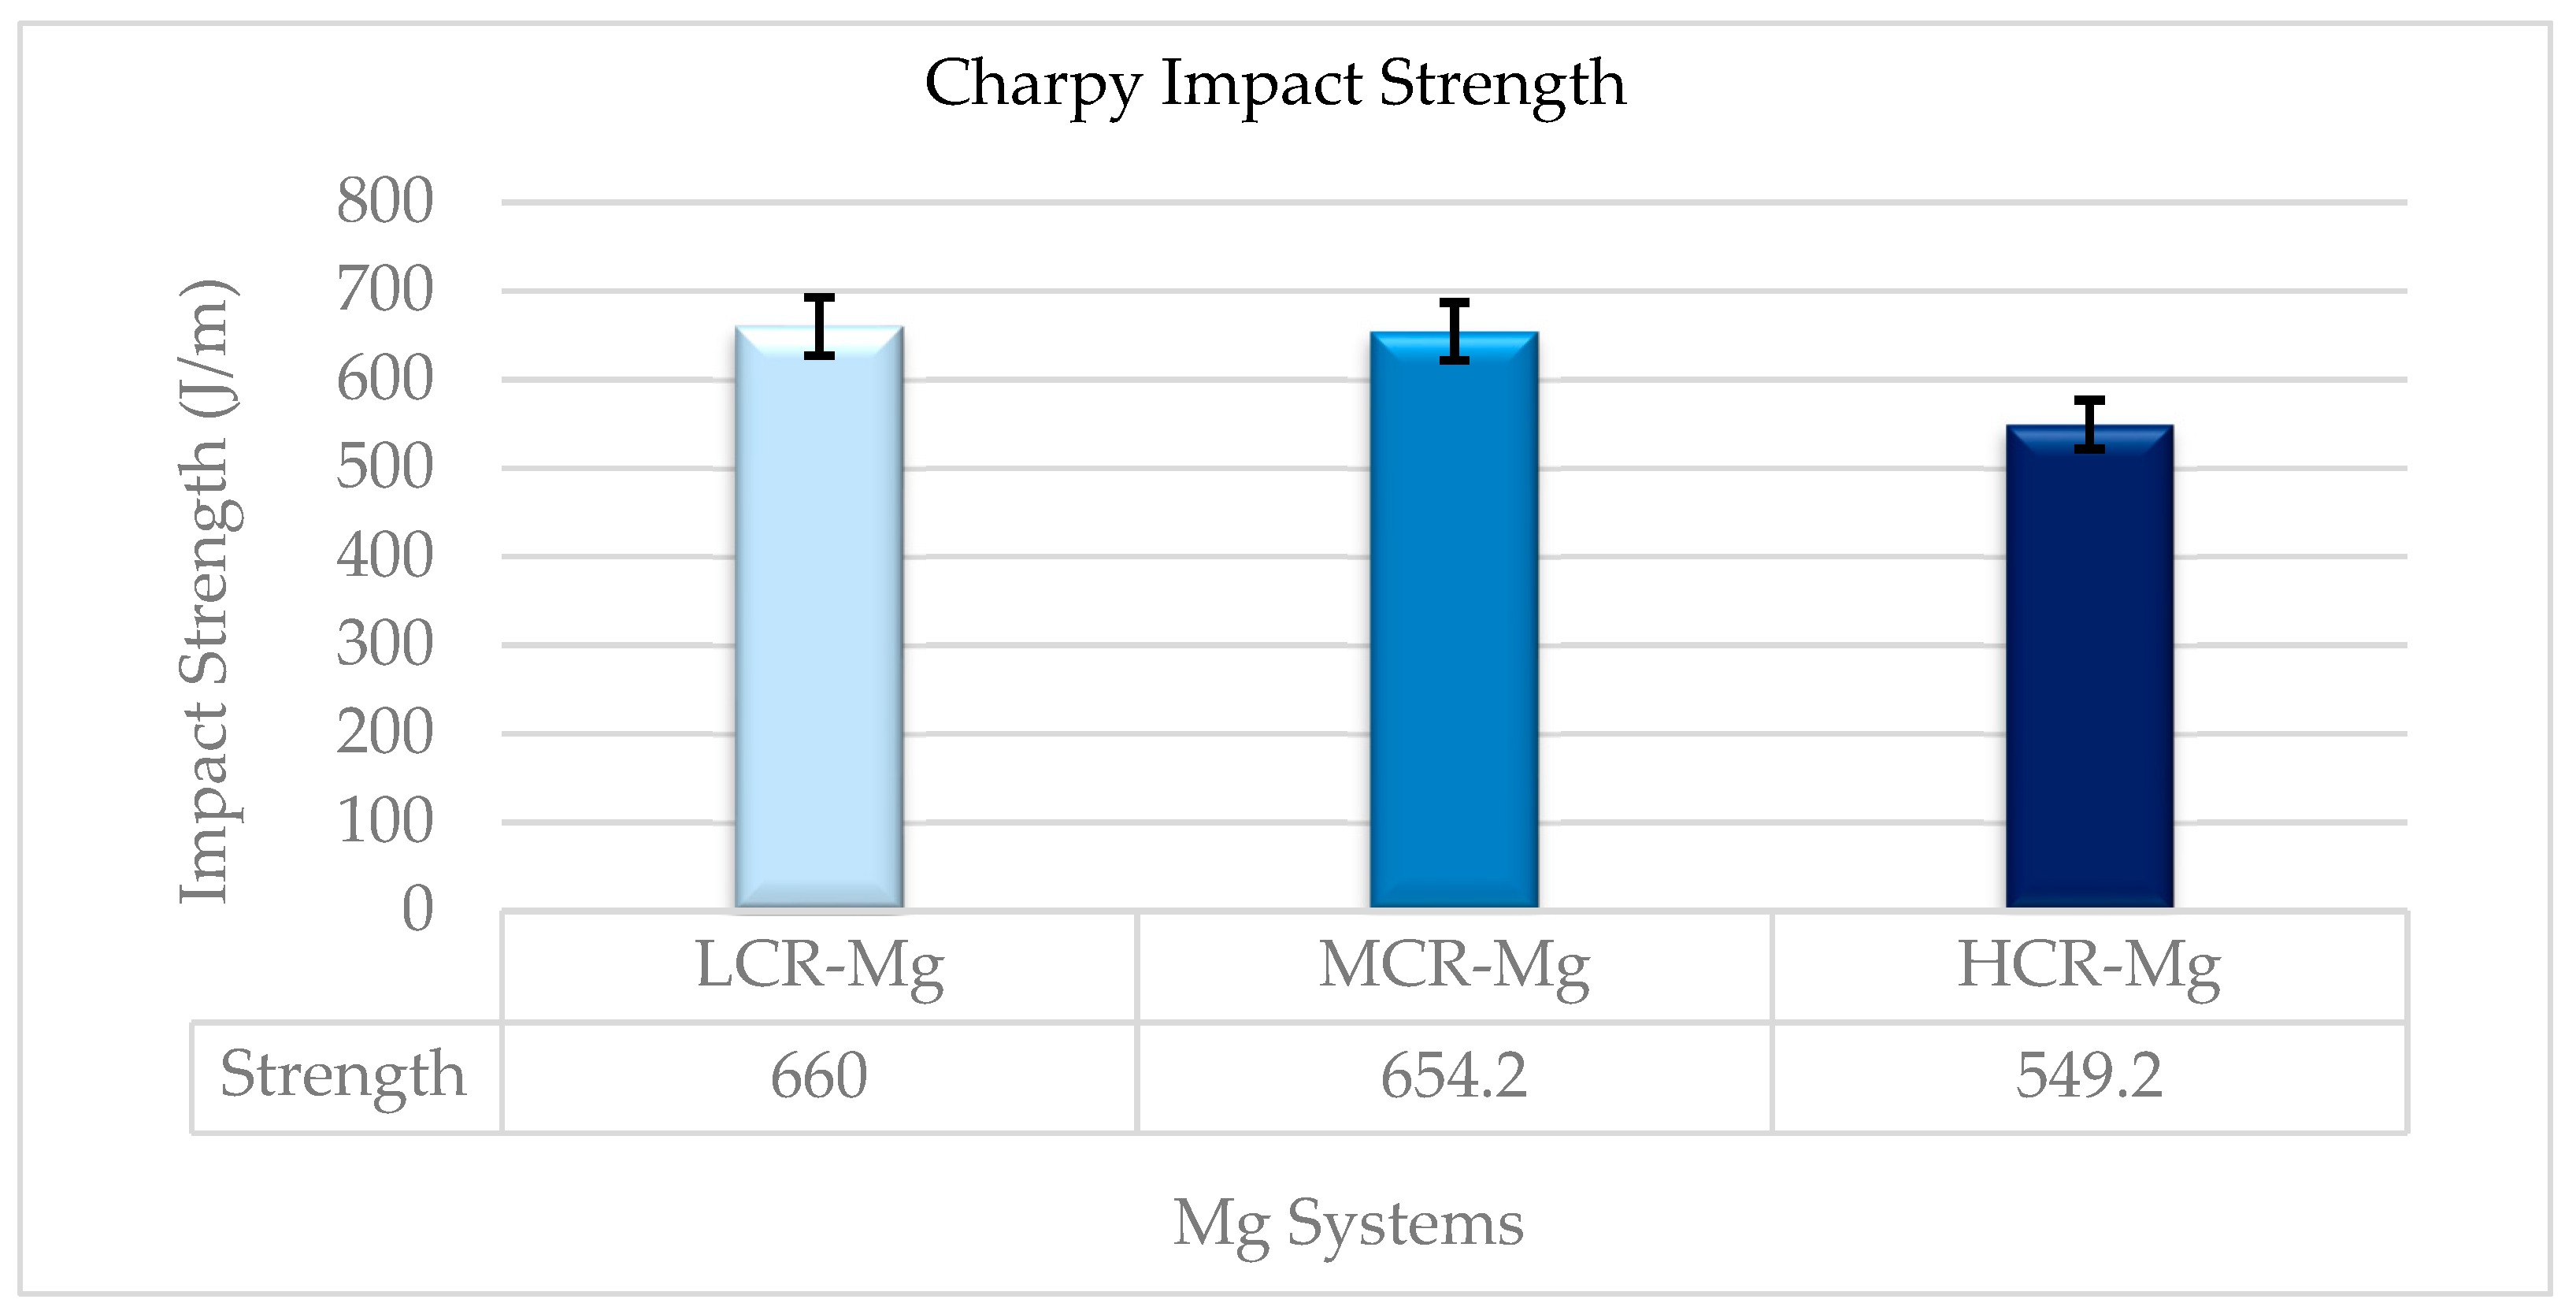
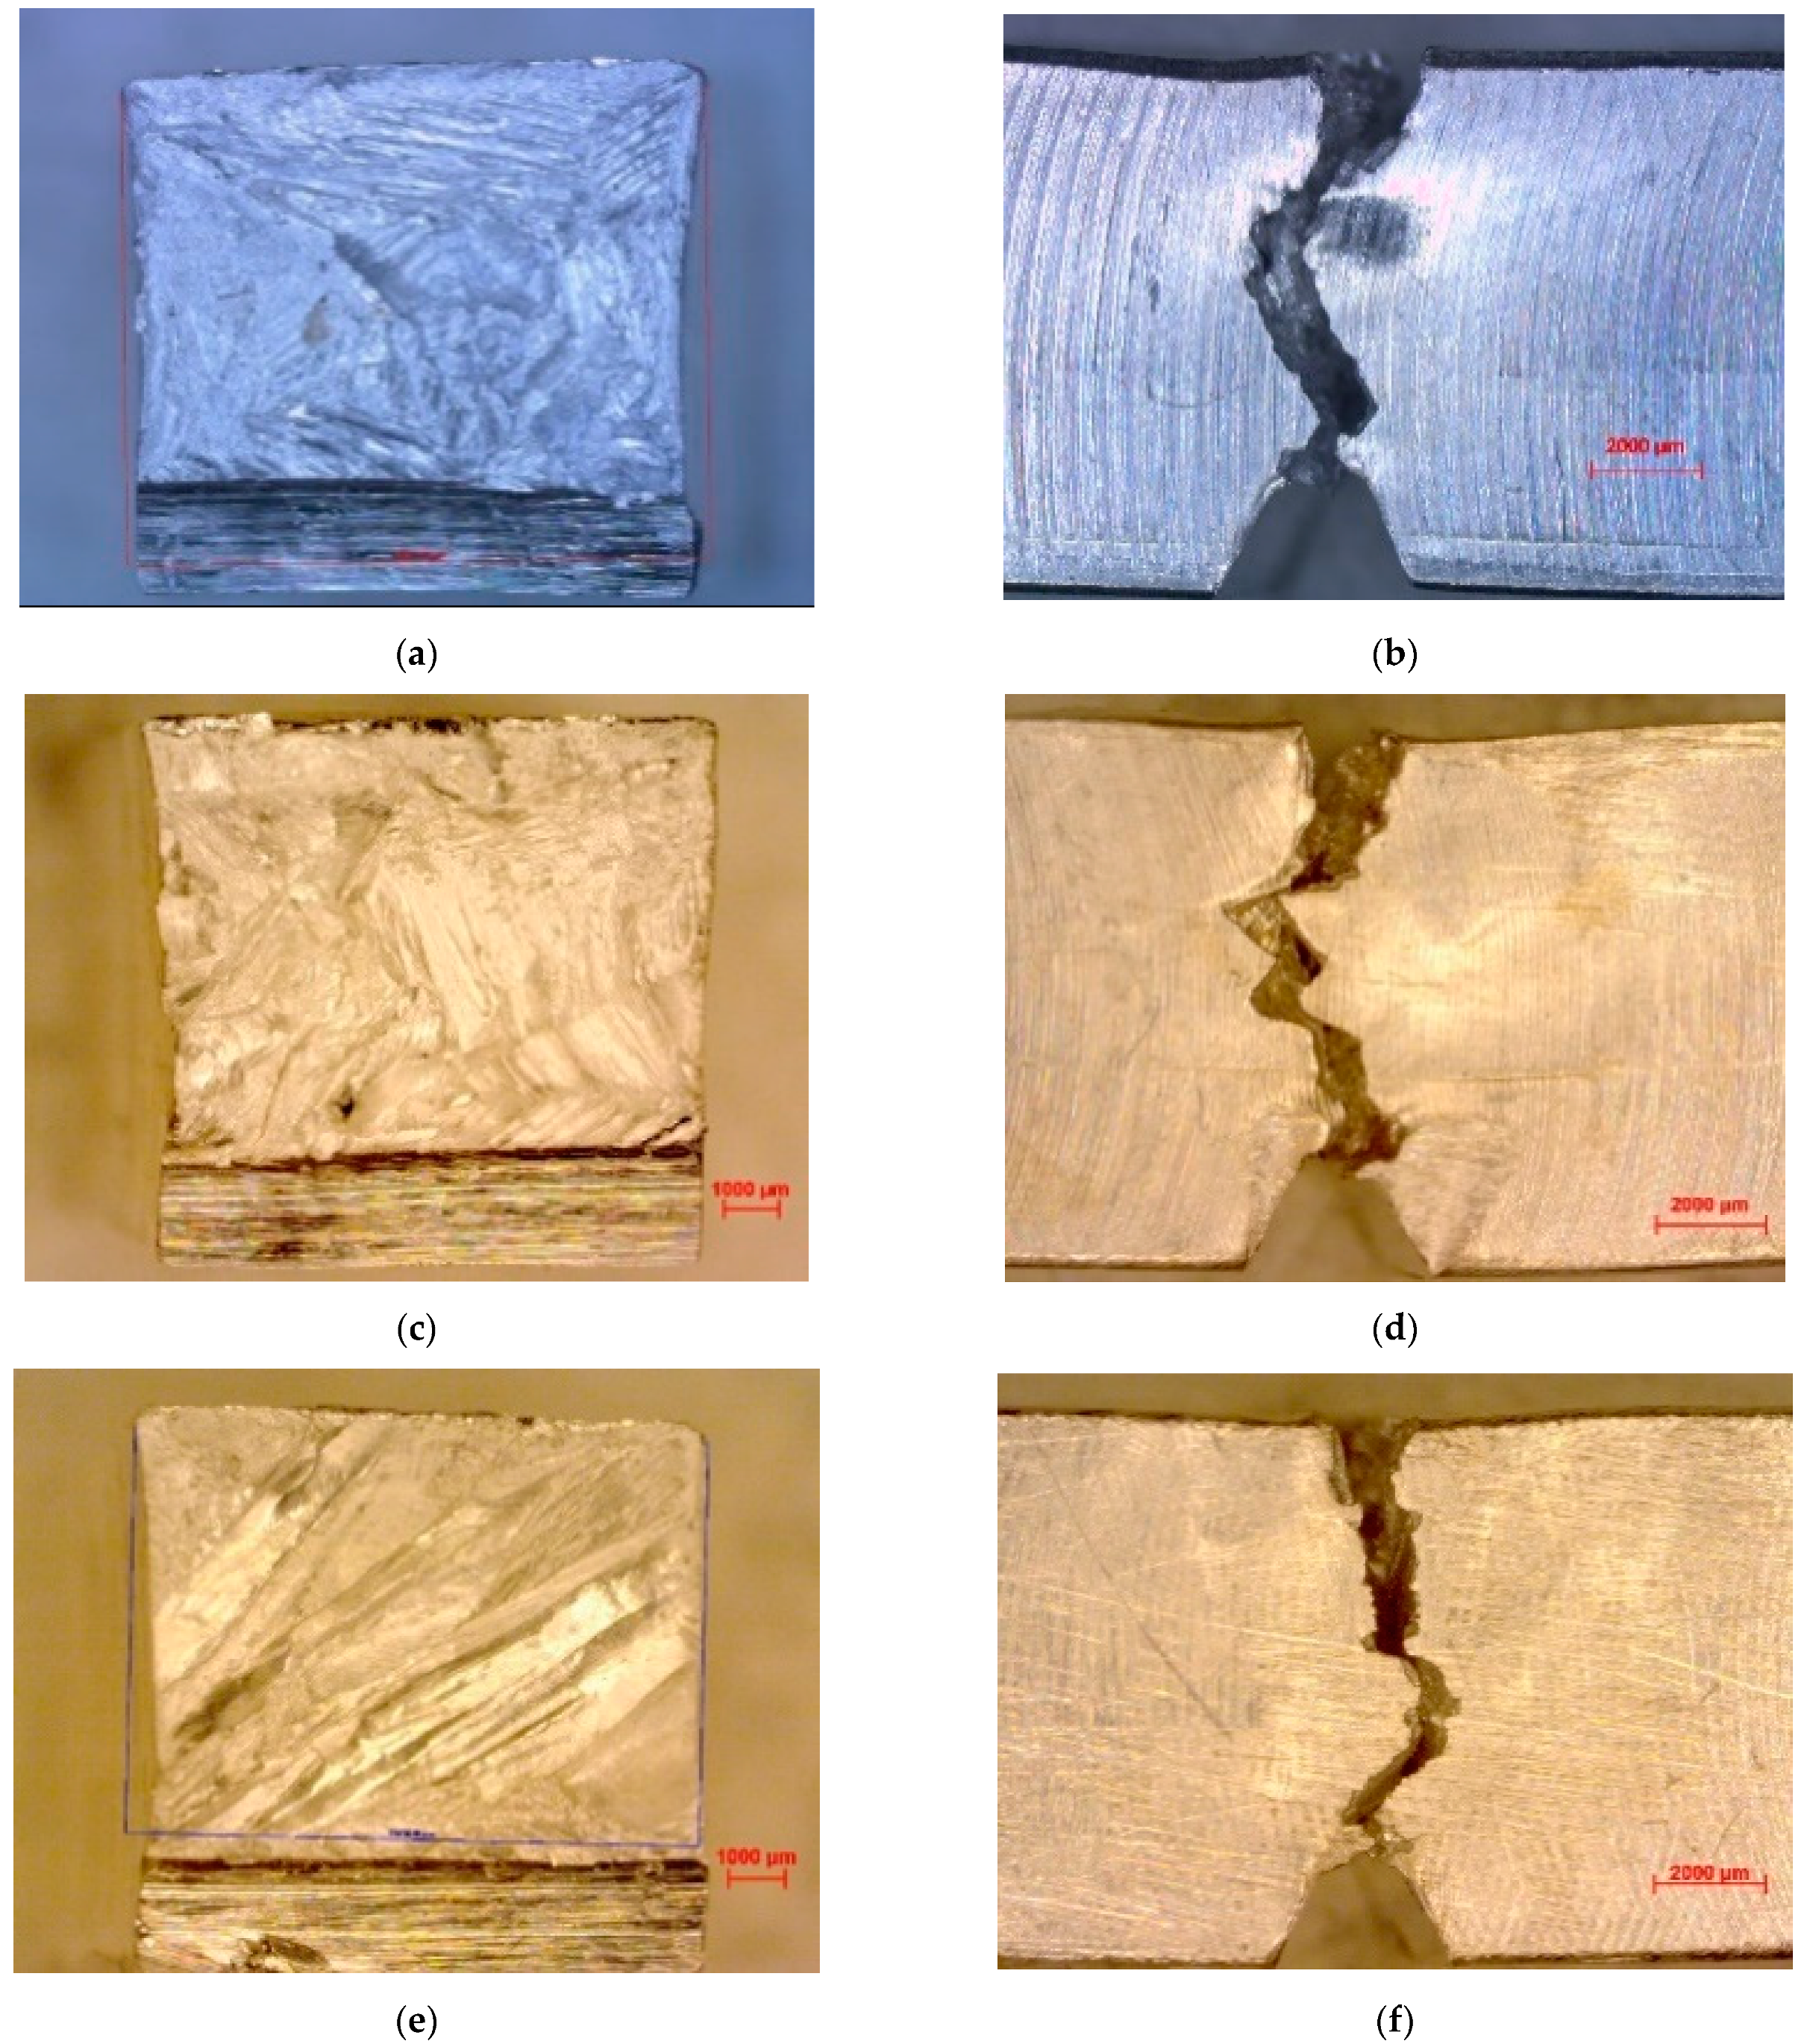
3.2. Impact and Fracture Mechanism
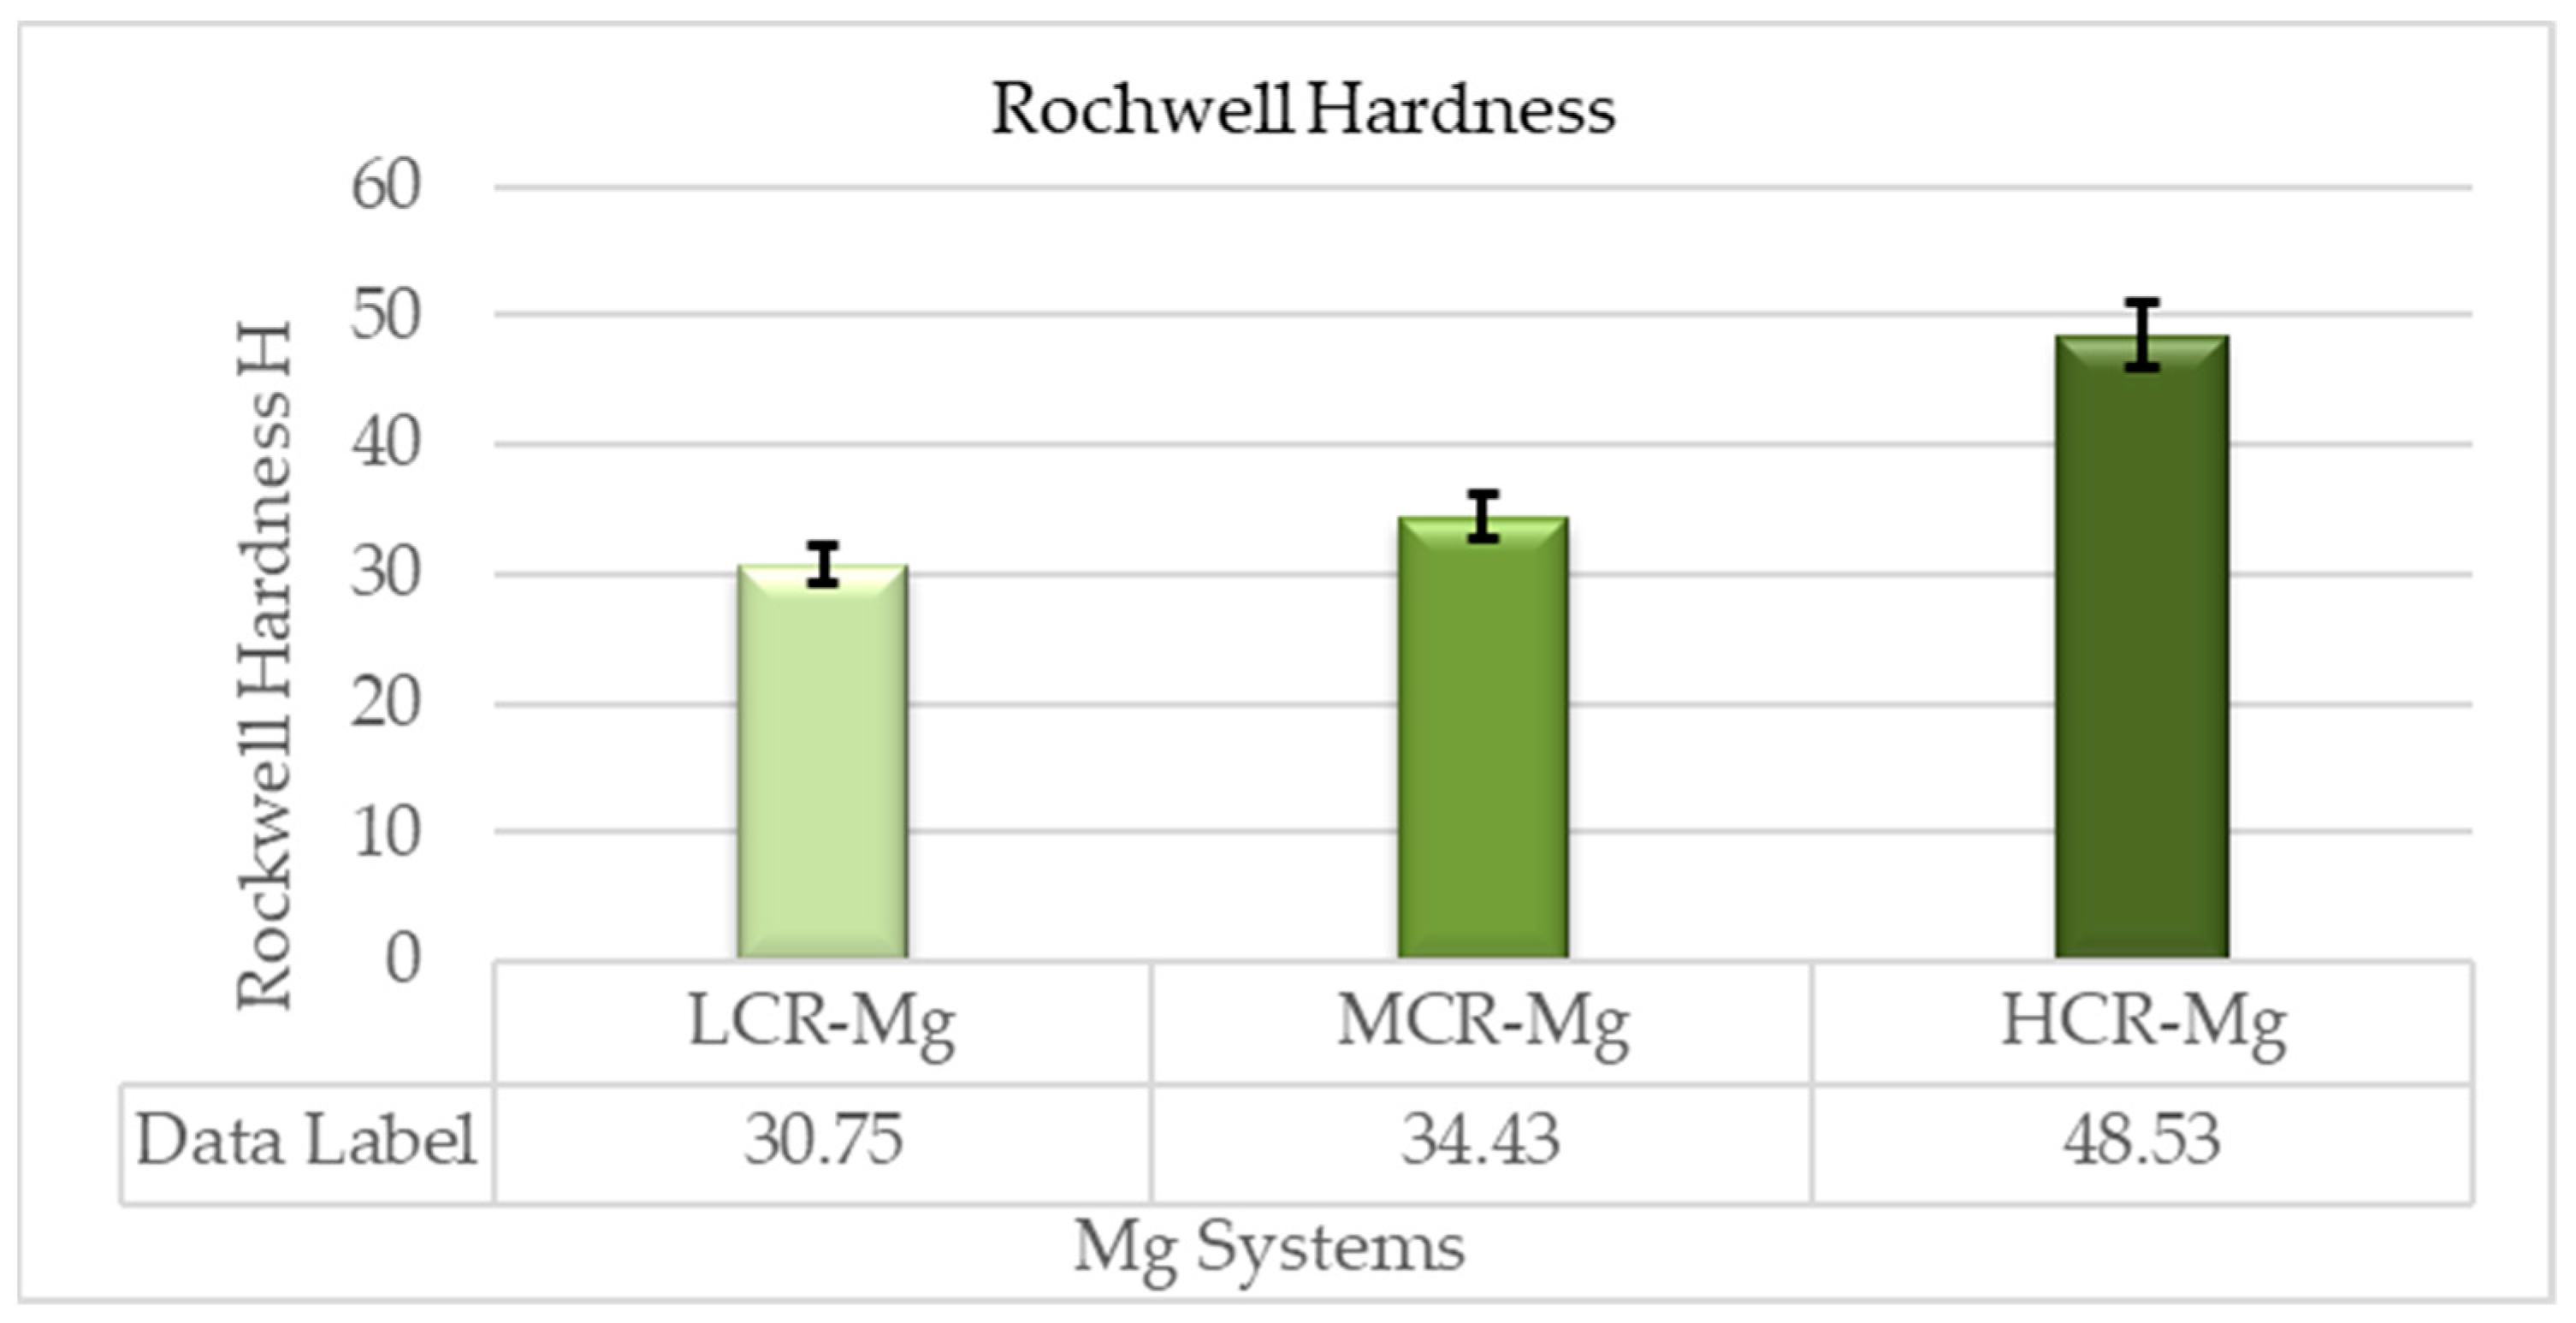
Four samples for each casting condition were tested by using the Charpy impact tester according to ASTM E23-16b. Table 3 illustrates the summary of the results for all alloying systems. The impact strength of the slowly cooled pure magnesium in a completely insulated furnace (LCR-Mg) and moderately cooled pure magnesium Mg-cooled in a tube furnace with uninsulated eends (MCR-Mg) exhibited the highest values of 660 and 654.29 J/m among the other types, respectively, as shown in Figure 5. The total absorbed energy was consumed by two mechanisms: the energy needed for fracture propagation and the ductile deformation. The high deformation and long fracture path, in Figure 6a–d, justifies the increase in the absorbed energy.
Generally, pure magnesium has low mechanical properties. However, high deformation indicates high ductility that was due to the large grain size of LCR-Mg (4235 µm) and MCR-Mg (2252 µm). The impact strength was decreased to 549.19 J/m for quenched pure Mg (HCR-Mg), which was attributed to the reduction in the ductility of pure Mg. As discussed in the previous section, quenched pure Mg has an average grain size of 6–12 µm, which is smaller than unquenched Mg and reduces the ductility of the sample. Figure 6e,f shows the fracture of quenched pure Mg.

3.3. Hardness

A minimum of 30 readings were obtained from each sample by using scale H-Rockwell Hardness HRH. Figure 7 summarizes the results of the hardness test. The hardness of pure Mg increased with an increase in the cooling rate. MCR-Mg hardness improved slightly by 11% in comparison to the slowly cooled Mg, while the hardness for the rapidly cooled pure magnesium (HCR-Mg) significantly increased to 40% and 57% in comparison to LCR-Mg and MCR-Mg, respectively, as shown in Figure 7.

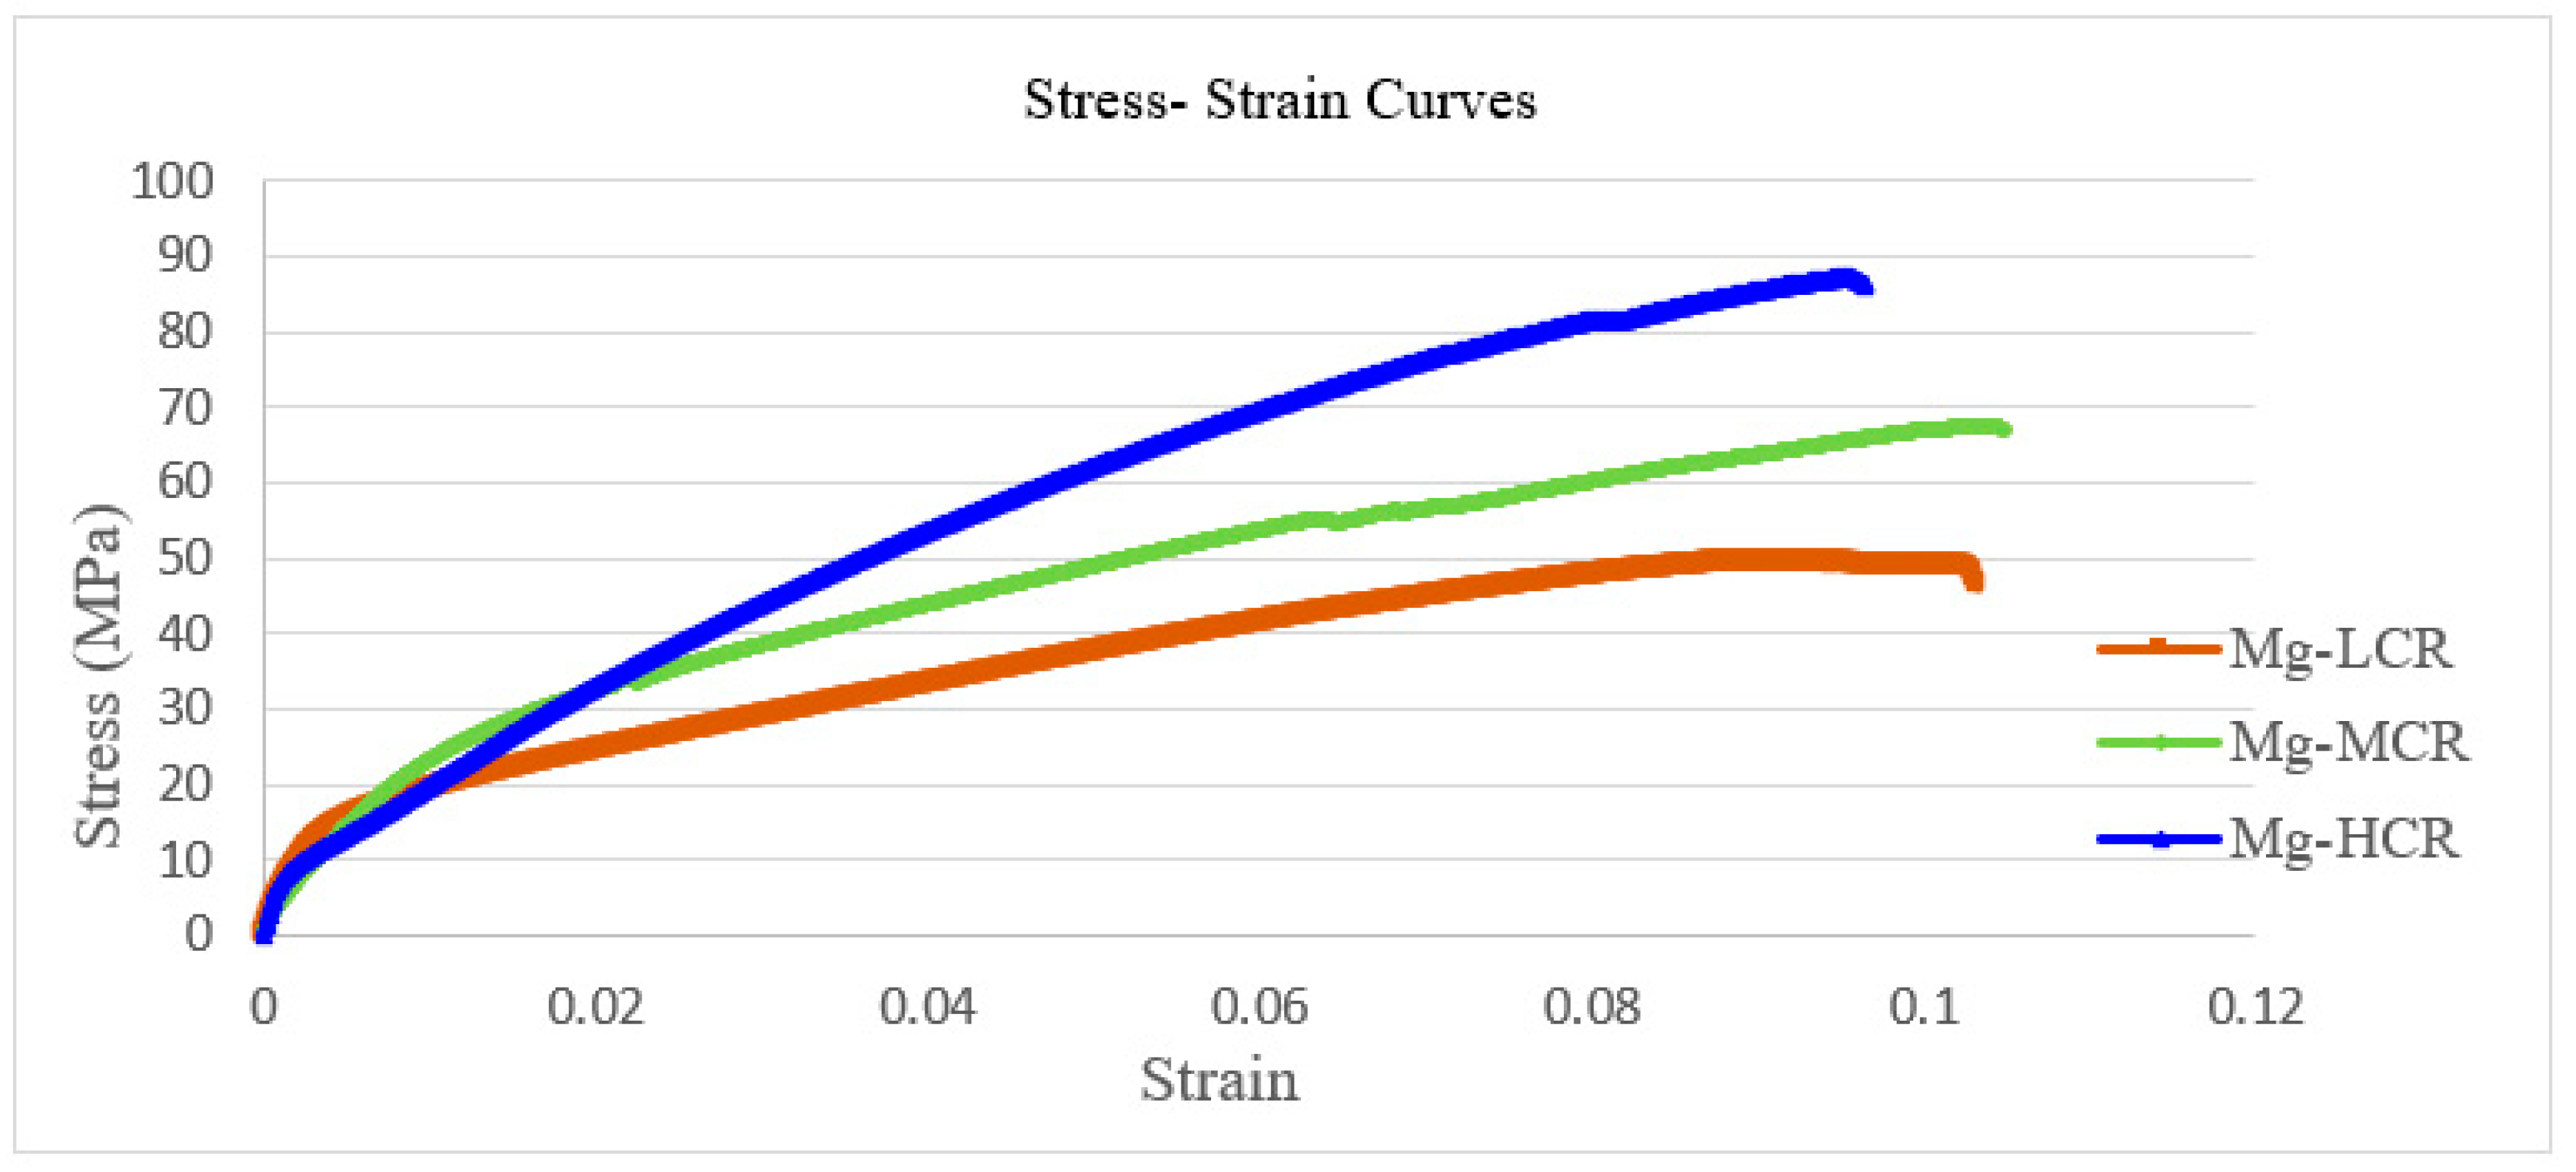
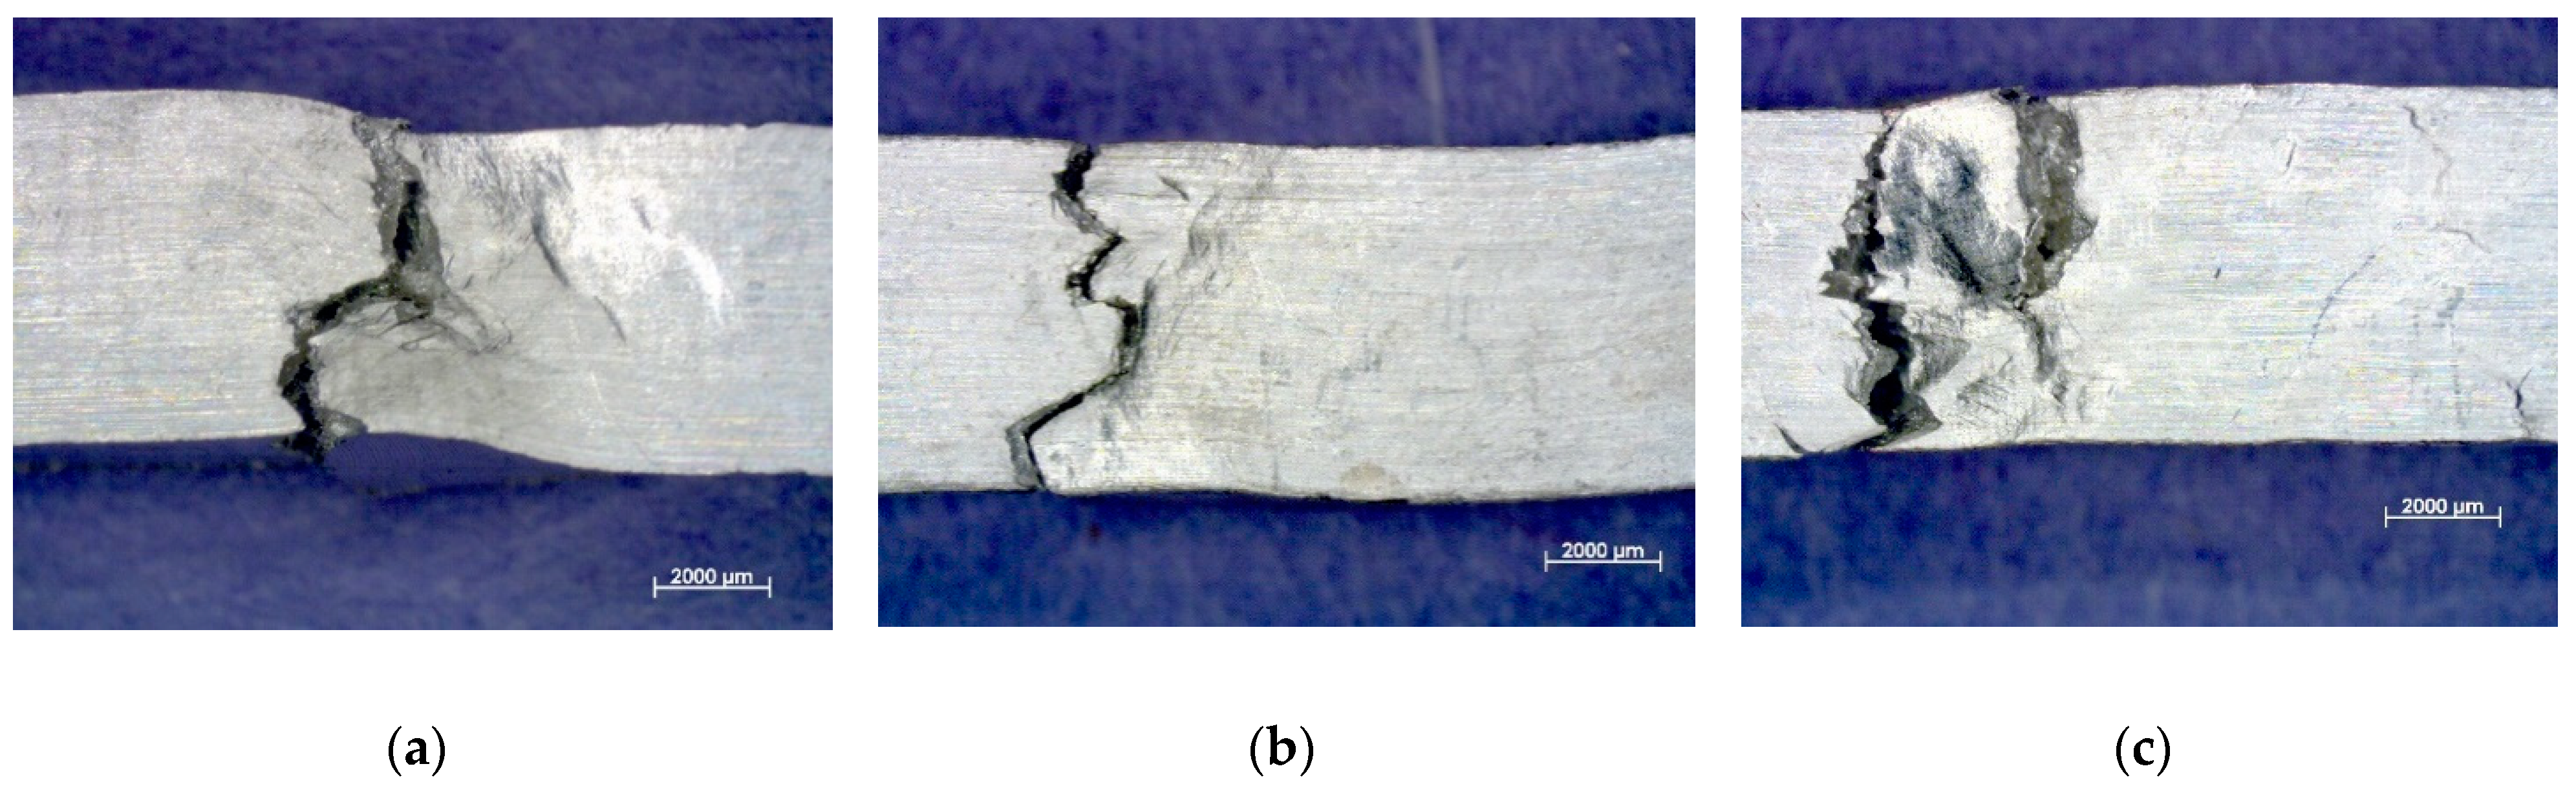
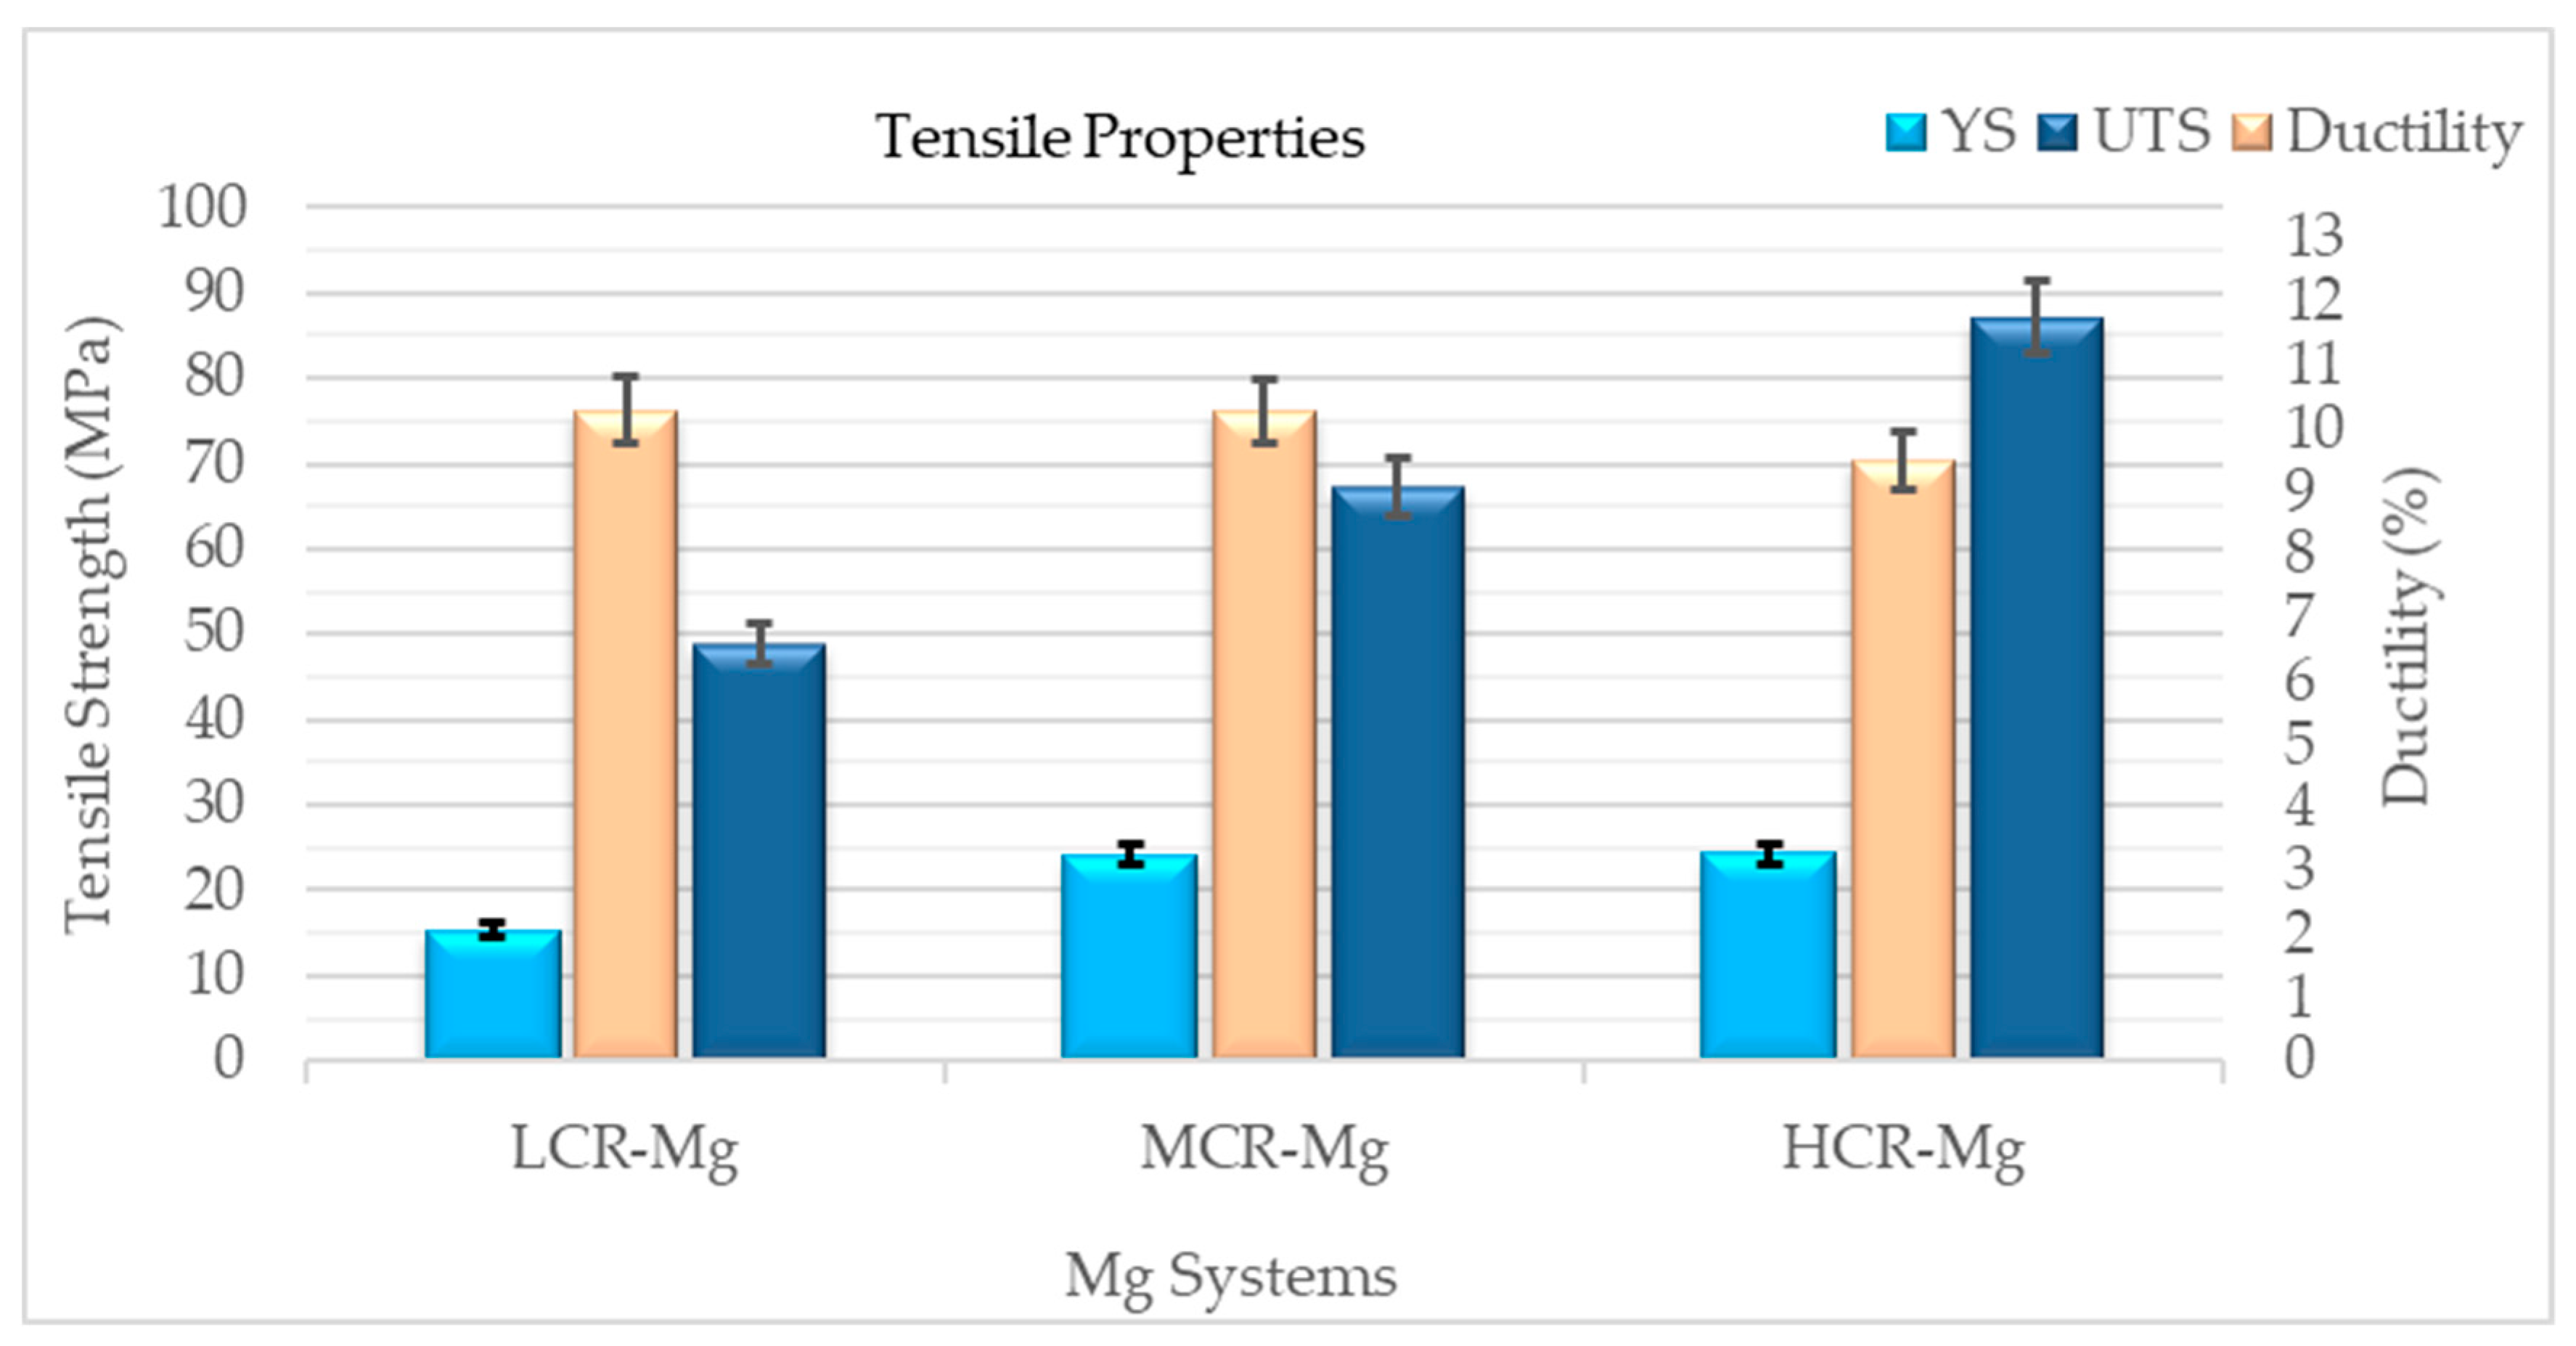
3.4. Tensile and Fracture Mechanism
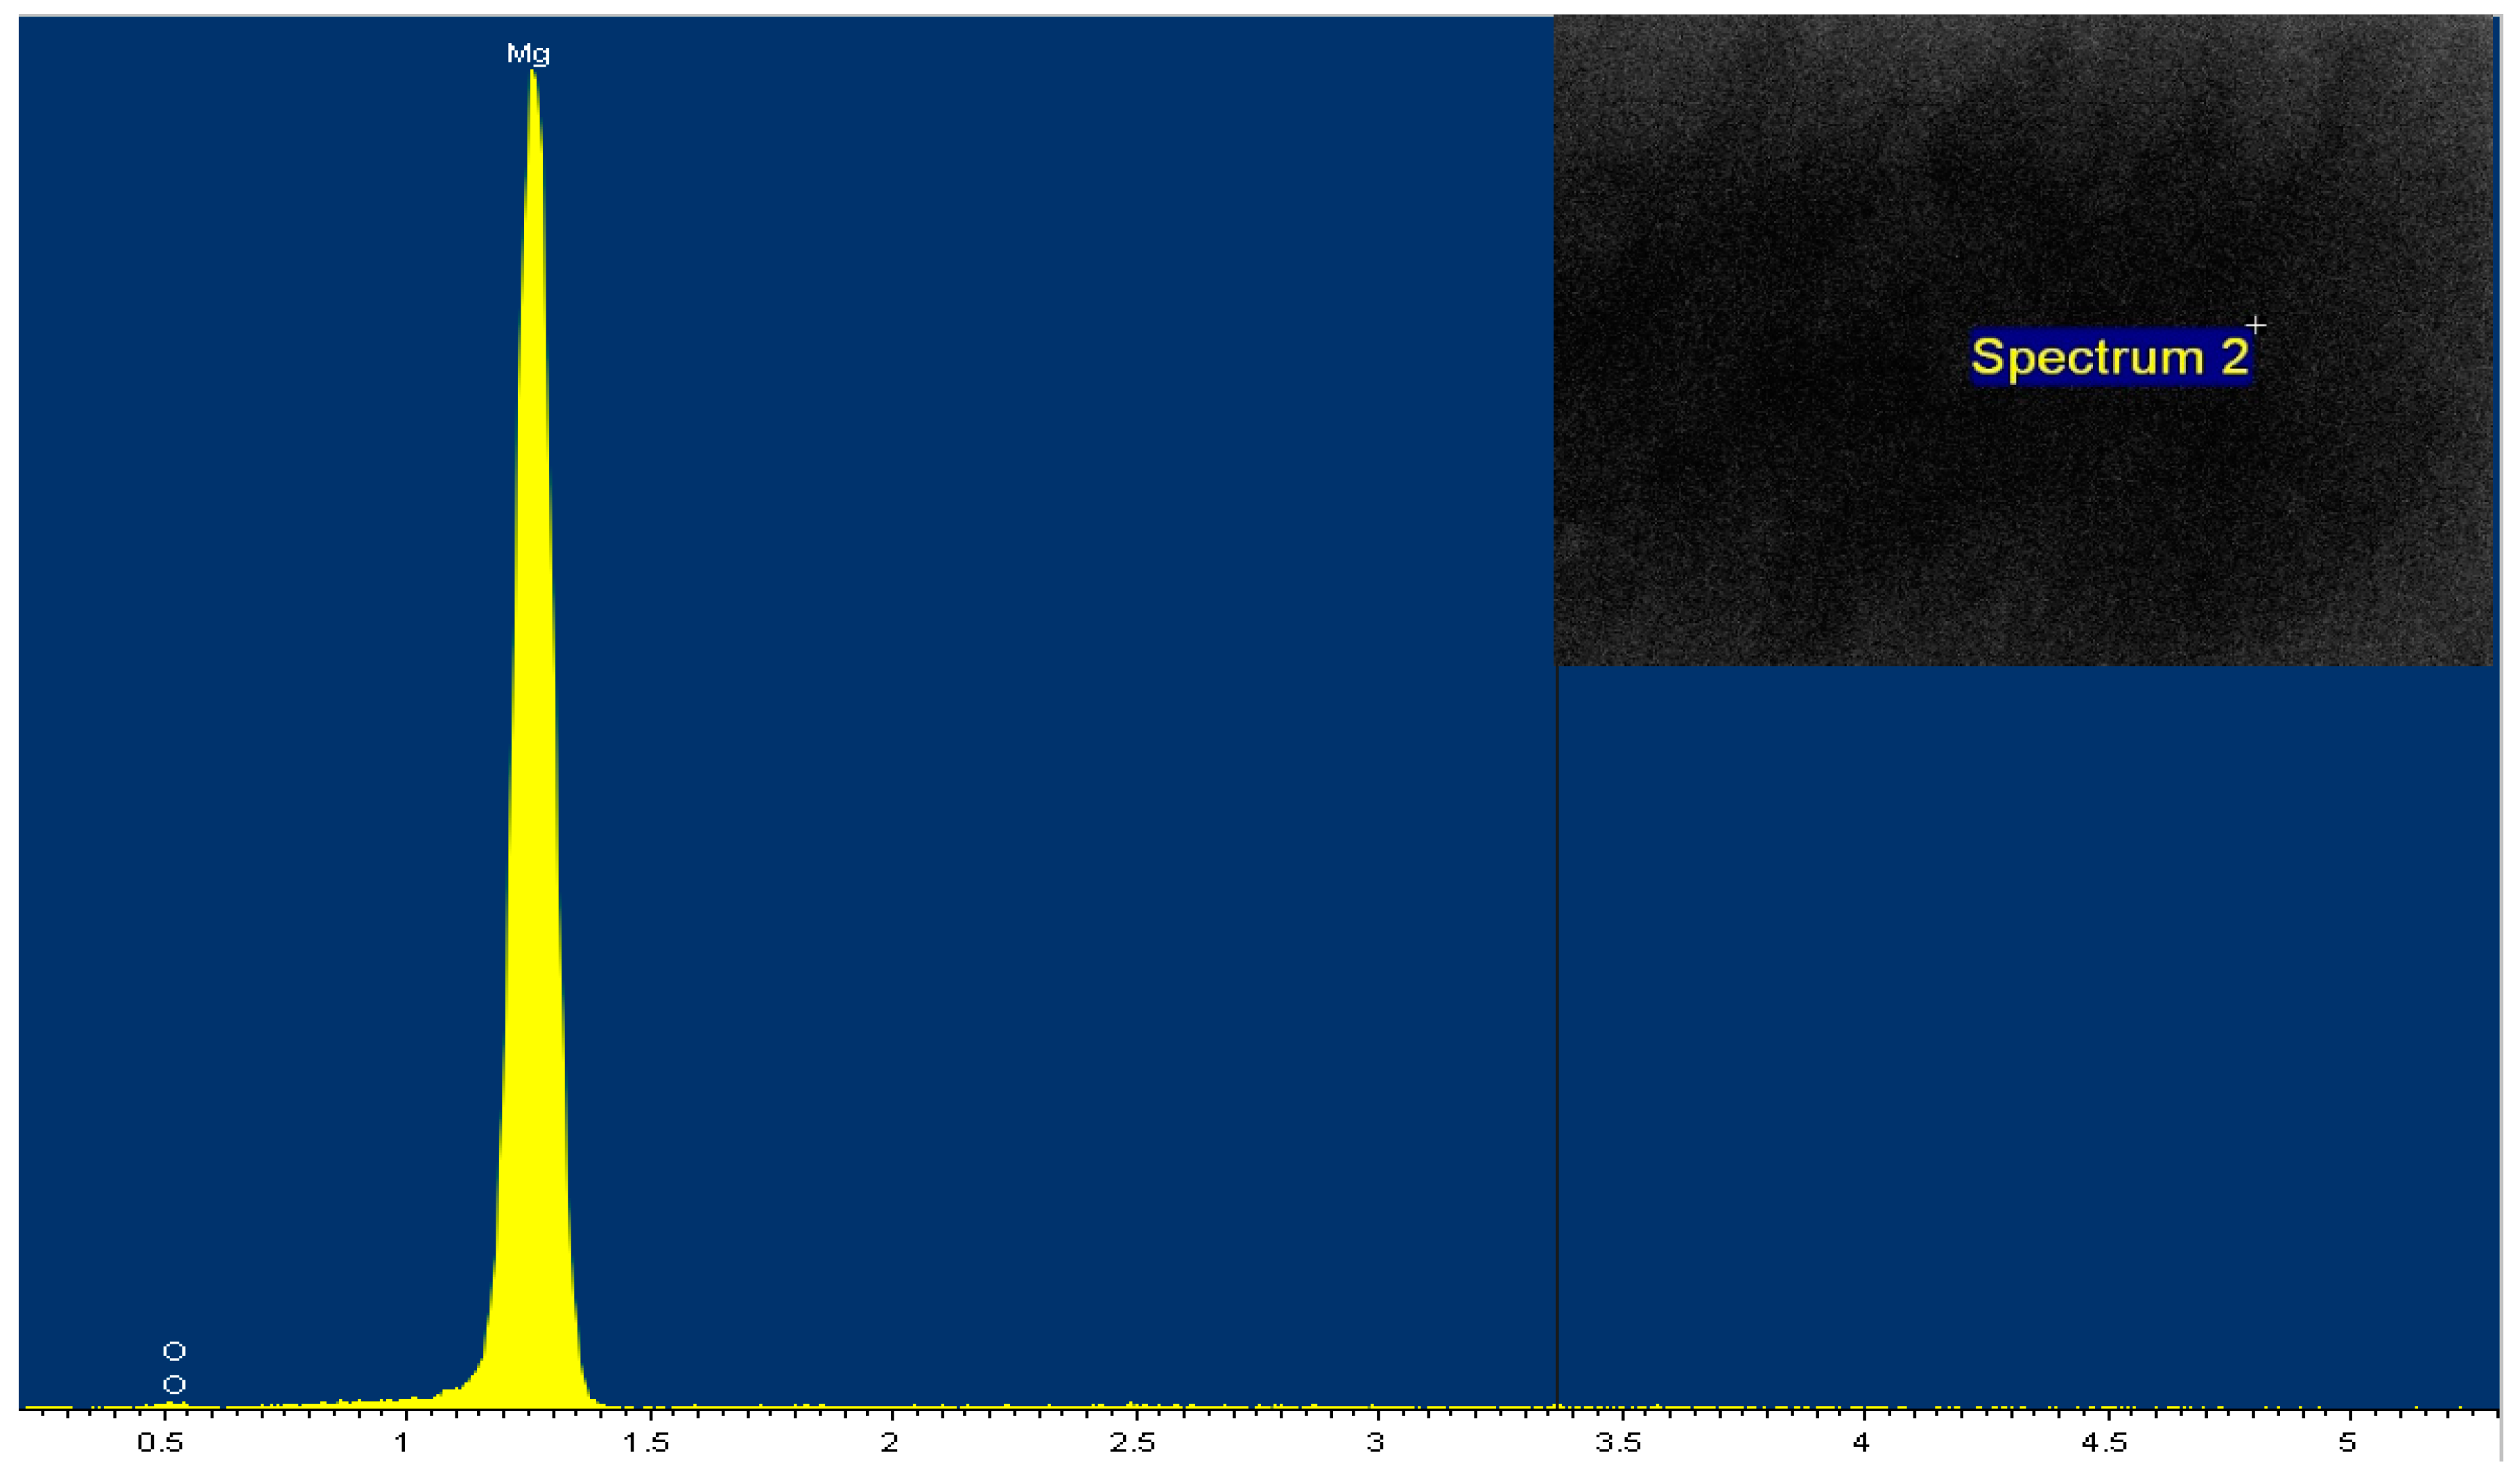
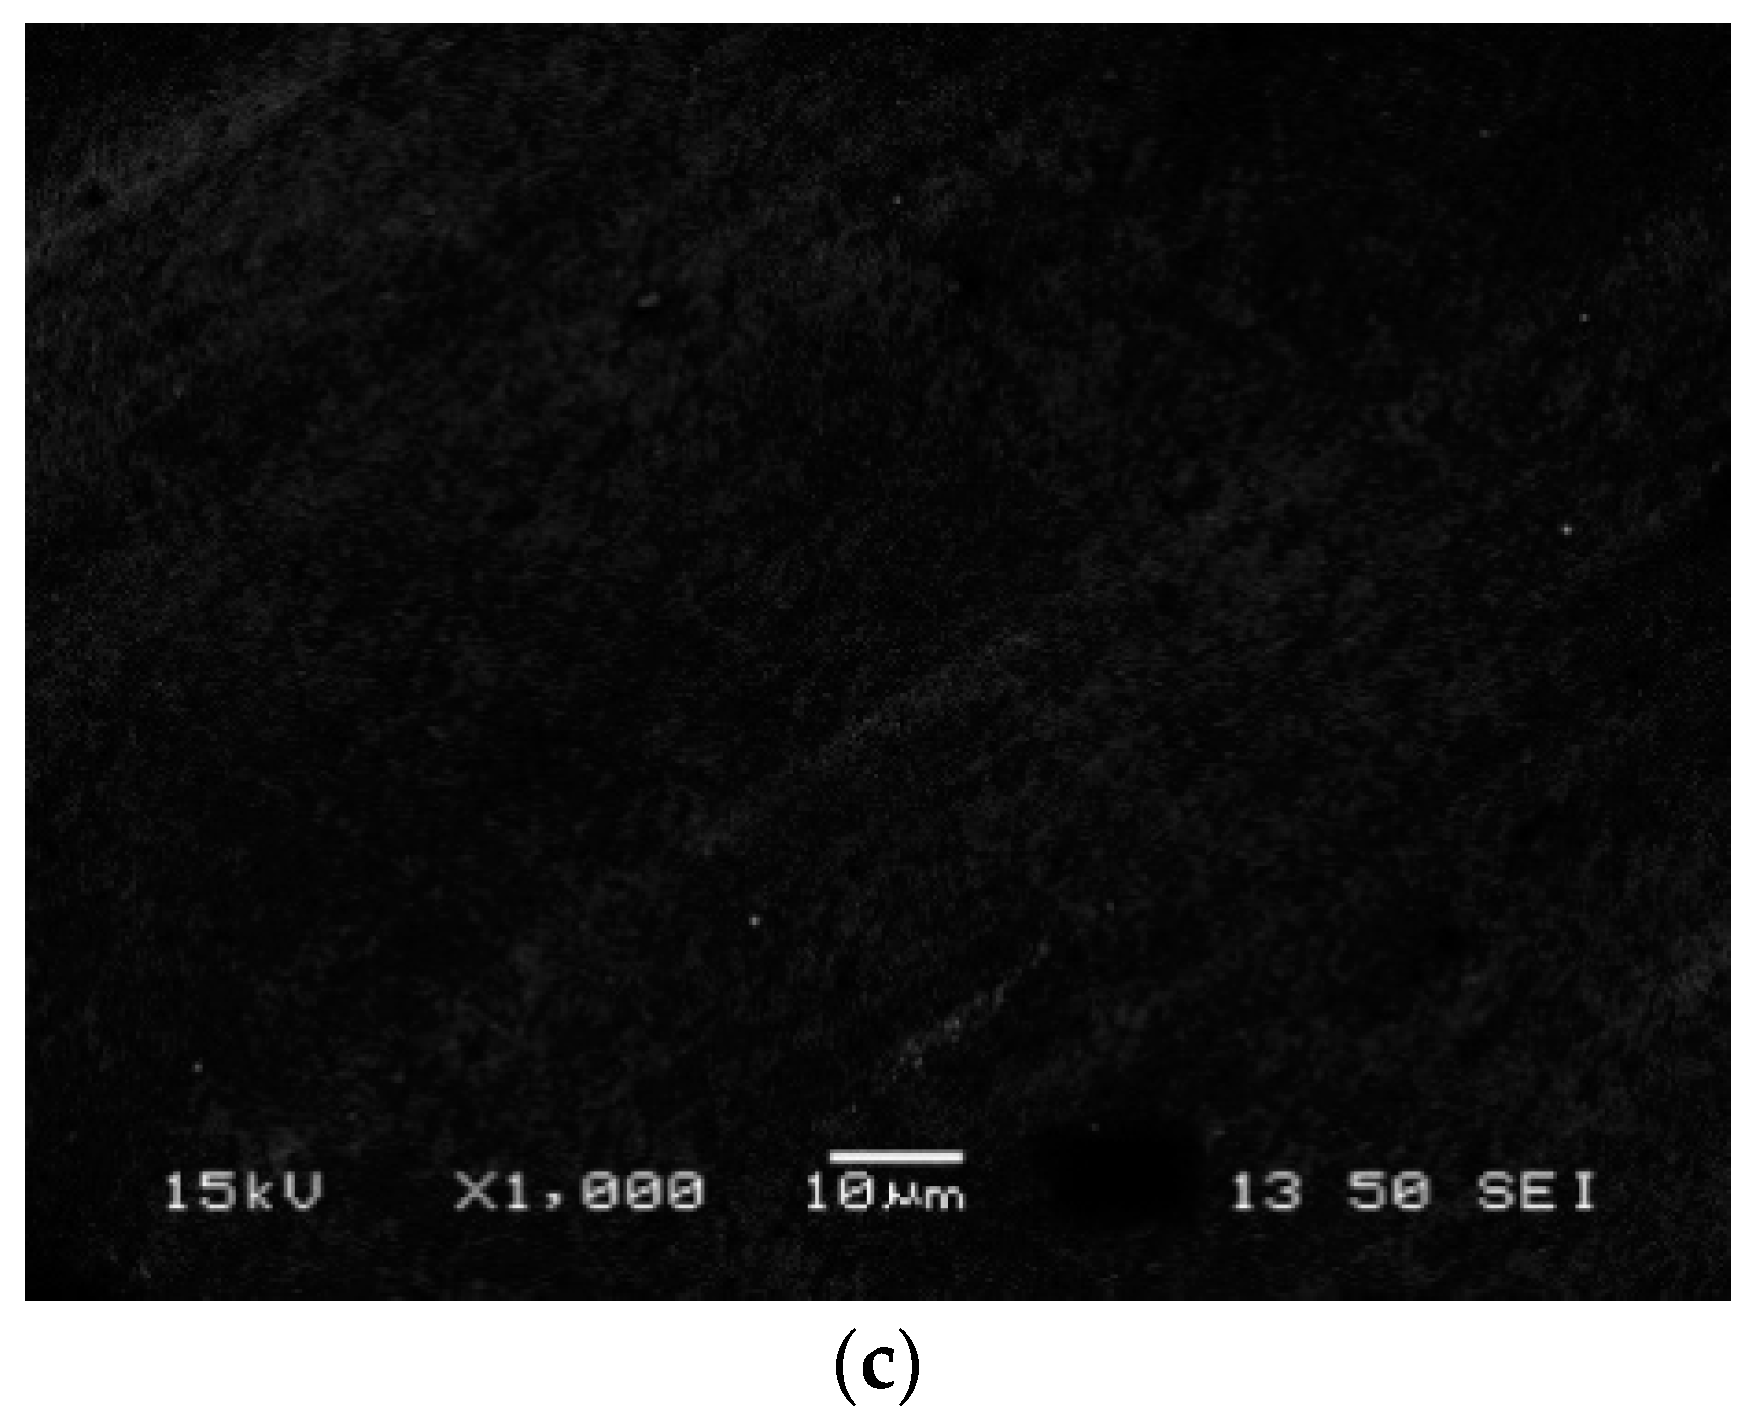
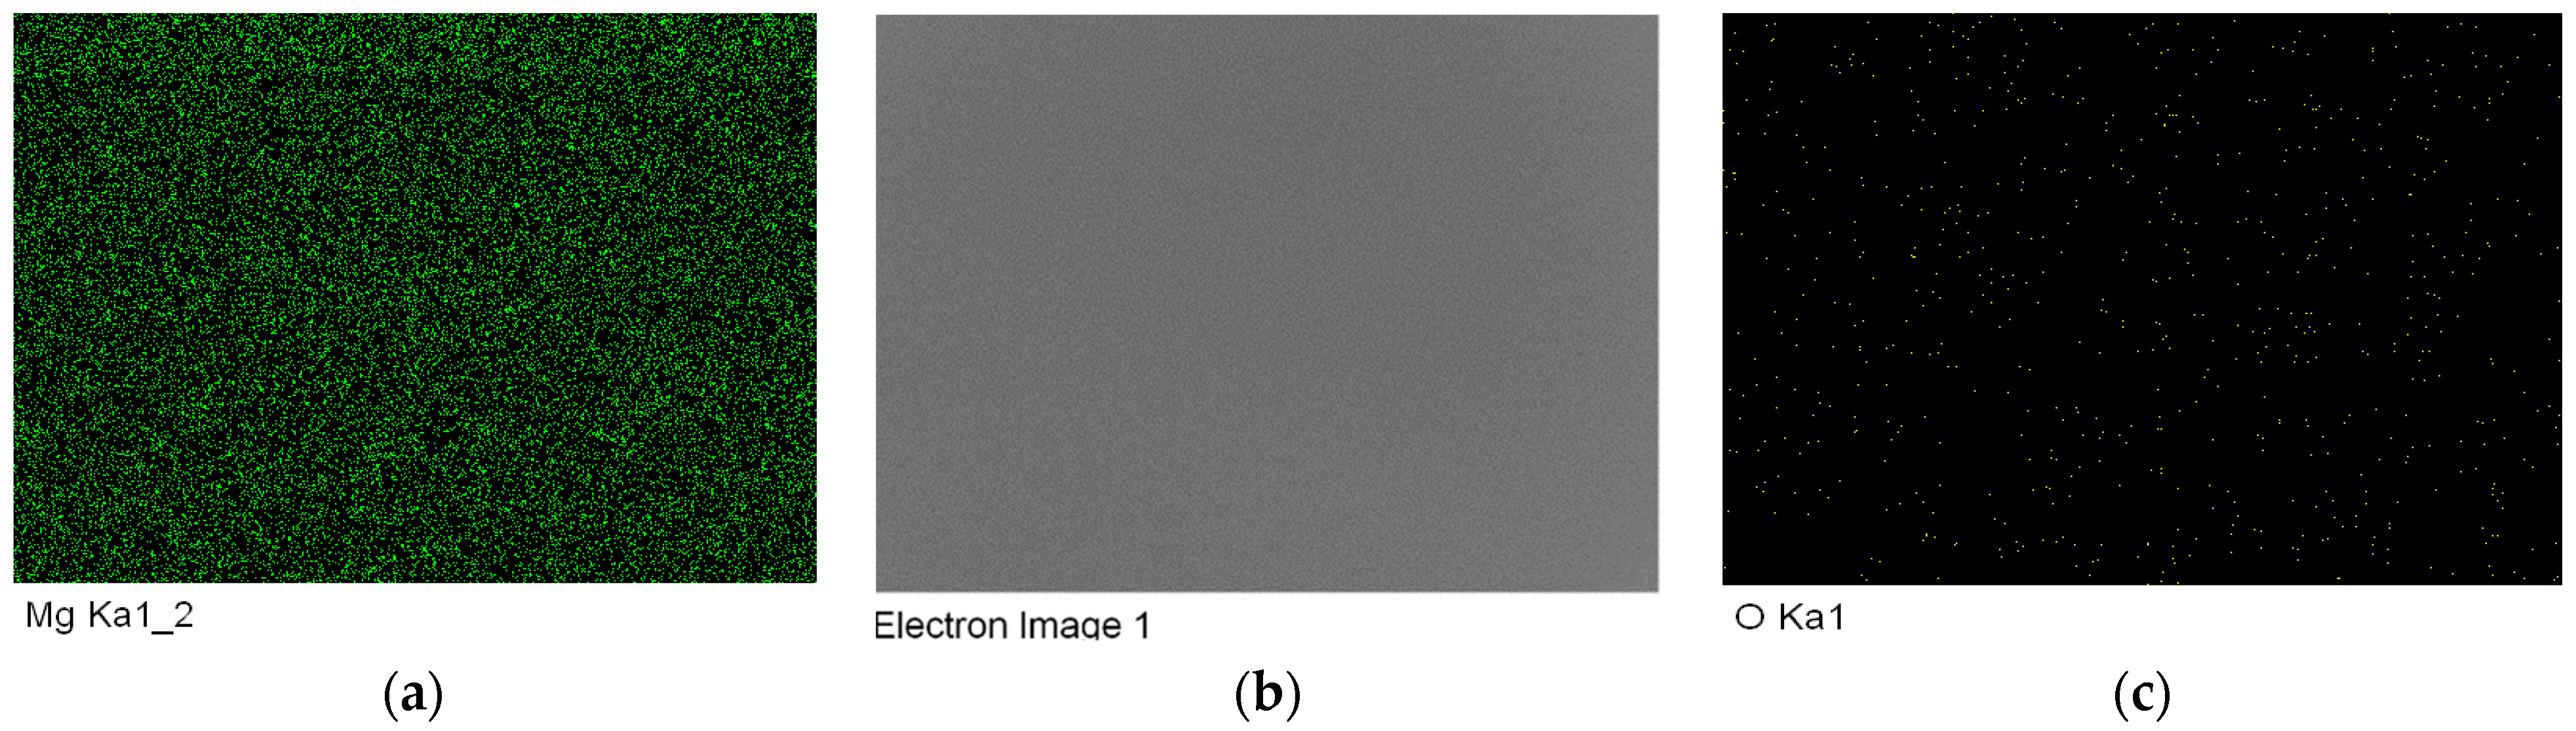
The tensile properties of the alloying systems were collected to study the effect of the solidification rates. Four samples were tested for each alloying system. The test was carried out in an INSTRON universal testing machine with a strain rate of 1 mm/min. Table 4 summarizes the tensile properties of the Mg casting conditions. The first set of testing was conducted on pure magnesium samples to study the effect of the solidification rates.
The slowly cooled pure magnesium showed low yield strength and ultimate tensile strength of 15.4 MPa and 48.9 MPa, respectively. However, the LCR-Mg exhibited a good ductility of 10.3%. Increasing the solidification rate to 0.074 °C/s improved the yield and ultimate tensile strengths considerably. The YS and UTS of MCR-Mg increased in comparison with LCR-Mg by 57% and 37%, respectively. On the other hand, the ultimate tensile strength of the quenched pure magnesium increased by 78% and 29% with respect to LCR-Mg and MCR-Mg, respectively. However, the effect of the solidification rate on the ductility was found to be insignificant, as shown in Figure 8.
Figure 2 and Figure 3 show the microstructure of pure magnesium at different magnifications of 6.5× for slowly and moderately cooled pure Mg and 500× for quenched Mg. Comparing between Figure 2, Figure 3 and Figure 8, there was a correlation between the significant improvement of the tensile properties of Mg and cooling rate. The fracture morphology of all pure magnesium samples is shown in Figure 9. LCR-Mg showed enormous deformation (twisted around the shape), which is due to the large grain size (4235 µm for a cooling rate of 0.035 °C/s). The deformation of the samples was decreased and became more uniform with an increase in the solidification rates. Additionally, Figure 10 illustrate the tensile properties of the Mg casting conditions.

3.5. SEM and EDS

Scanning electron microscopy (SEM) and energy dispersive x-ray spectrometer (EDS) analysis were conducted to further investigate the microstructure and phase composition of the examined Mg castings. The samples were machined, mounted in conductive filler mounting compound, ground, and polished to 0.05 µm. Wide range magnifications were performed to obtain a complete analysis for the matrix using secondary electron imaging with an account voltage of 15 KV.
Different samples of pure magnesium LCR-Mg, MCR-Mg, and HCR-Mg were analyzed at 1000× and 20,000×, as shown in Figure 11. The SEM images did not show a noticeable difference. While microstructure and the grain size were detectable by using the optical microscope, as was observed in Figure 2 and Figure 3, the images showed a clear structure at different magnifications and no detectable grain boundaries in both secondary electron imaging (SEI) and backscattered electron imaging (BSI). Figure 12 shows the EDS elements map, and the map shows the magnesium element as a main element with the existence of oxygen distributed across the examined area. Furthermore, the sample was analyzed using the EDS spectrum to confirm the elemental content of the system. Figure 13 shows an example of pure magnesium spectrum. The presence of magnesium and oxygen were found to have a weight percentage of 98.5 and 1.08% for LCR-Mg, 99.19% and 0.81 % for MCR-Mg, and 99.24% and 0.76% for HCR-Mg, respectively.

4. Conclusions

In this work, three solidification rates were considered and it was found that increasing the solidification rate from 0.035 °C/s to 0.074 °C/s reduced the grain size by 46%. The change in the solidification rate improved the hardness, yield strength, and UTS by 11%, 57%, and 37%, respectively. Further increase in the solidification rate to 13.5 °C/s for HCR-Mg reduced the grain size significantly by 99% and enhanced the hardness and UTS by (57–40%) and (78–29%) in comparison to LCR-Mg and MCR-Mg, respectively. The fracture morphology showed less deformation with an increase in the solidification rates. Additionally, structural and compositional analysis using SEM/EDS did not show any noticeable differences and the grain boundaries were not detectable.

Author Contributions

M.M.J. is the main author, supervision under H.L. and B.S.; review and editing by W.O. All authors have read and agreed to the published version of the manuscript.

Funding

This research received no external funding.

Institutional Review Board Statement

N/A.

Informed Consent Statement

N/A.

Data Availability Statement

N/A.

Acknowledgments

I am grateful to Professor Benjamin Church for his continuous assistance and invaluable advice. I would like to express my appreciation to the University of Wisconsin-Milwaukee, the H.H. Harris Foundation, the Minerals-Metals-Materials Society (TMS), the American Institute of Mining-Metallurgical-Petroleum Engineers (AIME), the Foundry Educational Foundation (FEF)-Northeastern Wisconsin-George J. Barker Memorial, the American Foundry Society (AFS), and the Association for Iron & Steel Technology (AIST) for honoring and supporting me with their awards.

Conflicts of Interest

The funders had no role in the design of the study; in the collection, analyses, or interpretation of data; in the writing of the manuscript, or in the decision to publish the results. The authors declare no conflict of interest.

References

  1. Brooks, E.K.; Ehrensberger, M.T. Bio-Corrosion of Magnesium Alloys for Orthopaedic Applications. J. Funct. Biomater. 2017, 8, 38. [Google Scholar] [CrossRef] [PubMed] [Green Version]
  2. Liu, X.; Sun, J.; Qiu, K.; Yang, Y.; Pu, Z.; Li, L.; Zheng, Y. Effects of alloying elements (Ca and Sr) on microstructure, mechanical property and in vitro corrosion behavior of biodegradable Zn–1.5Mg alloy. J. Alloys Compd. 2016, 664, 444–452. [Google Scholar] [CrossRef]
  3. International Magnesium Association. International Magnesium Association. Available online: https://www.intlmag.org/ (accessed on 1 January 2019).
  4. Abdessameud, S.; Mezbahul-Islam, M.; Medraj, M.; Mikuli, E. Thermodynamic Modeling of Hydrogen Storage Capacity in Mg-Na Alloys. Sci. World J. 2014, 2014, 16. [Google Scholar] [CrossRef] [Green Version]
  5. Pogorielov, M.; Husak, E.; Solodivnik, A.; Zhdanov, S. Magnesium-based biodegradable alloys: Degradation, application, and alloying elements. (Report). Interv. Med. Appl. Sci. 2017, 9, 27–38. [Google Scholar] [CrossRef]
  6. Chen, Y.; Xu, Z.; Smith, C.; Sankar, J. Recent advances on the development of magnesium alloys for biodegradable implants. Acta Biomater. 2014, 10, 4561–4573. [Google Scholar] [CrossRef]
  7. Li, N.; Zheng, Y. Novel Magnesium Alloys Developed for Biomedical Application. J. Mater. Sci. Technol. 2013, 29, 489–502. [Google Scholar] [CrossRef]
  8. ASM Charles Moosbrugger. In Engineering Properties of Magnesium Alloys; ASM International: Almere, The Netherlands, 2017; Chapter 1, 3.
  9. Bakhsheshi-Rad, H.; Idris, M.; Abdul-Kadir, M.; Ourdjini, A.; Medraj, M.; Daroonparvar, M.; Hamzah, E. Mechanical and bio-corrosion properties of quaternary Mg-Ca-Mn-Zn alloys compared with binary Mg-Ca alloys. Mater. Des. 2014, 53, 283–292. [Google Scholar] [CrossRef]
  10. Guo, K.K.W. A Review of Magnesium/Magnesium Alloys Corrosion and its Protection. Recent Pat. Corros. Sci. 2010, 2, 13–21. [Google Scholar] [CrossRef] [Green Version]
  11. Radha, R.; Sreekanth, D. Insight of magnesium alloys and composites for orthopedic implant applications—A review. J. Magnes. Alloys 2017, 5, 286–312. [Google Scholar] [CrossRef]
  12. Stulikova, I.; Smola, B. Mechanical properties and phase composition of potential biodegradable Mg–Zn–Mn–base alloys with addition of rare earth elements. Mater. Charact. 2010, 61, 952–958. [Google Scholar] [CrossRef]
  13. El-Mahallawy, N.; Palkowski, H.; Klingner, A.; Diaa, A.; Shoeib, M. Effect of 1.0 wt. % Zn addition on the microstructure, mechanical properties, and bio-corrosion behaviour of micro alloyed Mg-0.24Sn-0.04Mn alloy as biodegradable material. Mater. Today Commun. 2020, 24, 100999. [Google Scholar] [CrossRef]
  14. Rosalbino, F.; de Negri, S.; Scavino, G.; Saccone, A. Microstructure and in vitro degradation performance of Mg–Zn–Mn alloys for biomedical application. J. Biomed. Mater. Res. Part A 2013, 101, 704–711. [Google Scholar] [CrossRef]
  15. Hänzi, A.C.; Gerber, I.; Schinhammer, M.; Löffler, J.F.; Uggowitzer, P.J. On the in vitro and in vivo degradation performance and biological response of new biodegradable Mg–Y–Zn alloys. Acta Biomater. 2010, 6, 1824–1833. [Google Scholar] [CrossRef] [PubMed]
  16. Gu, X.; Zheng, Y.; Zhong, S.; Xi, T.; Wang, J.; Wang, W. Corrosion of, and cellular responses to Mg–Zn–Ca bulk metallic glasses. Biomaterials 2010, 31, 1093–1103. [Google Scholar] [CrossRef] [PubMed]
  17. Li, T.; He, Y.; Zhang, H.; Wang, X. Microstructure, mechanical property and in vitro biocorrosion behavior of single-phase biodegradable Mg–1.5Zn–0.6Zr alloy. J. Magnes. Alloys 2014, 2, 181–189. [Google Scholar] [CrossRef] [Green Version]
  18. Song, Y.; Han, E.-H.; Dong, K.; Shan, D.; Yim, C.D.; You, B.S. Effect of hydrogen on the corrosion behavior of the Mg–xZn alloys. J. Magnes. Alloys 2014, 2, 208–213. [Google Scholar] [CrossRef] [Green Version]
  19. Song, Y.; Han, E.-H.; Shan, D.; Yim, C.D.; You, B.S. The effect of Zn concentration on the corrosion behavior of Mg–xZn alloys. Corros. Sci. 2012, 65, 322–330. [Google Scholar] [CrossRef]
  20. Song, Y.; Han, E.-H.; Shan, D.; Yim, C.D.; You, B.S. The role of second phases in the corrosion behavior of Mg–5Zn alloy. Corros. Sci. 2012, 60, 238–245. [Google Scholar] [CrossRef]
  21. Zhang, E.; Yang, L.; Xu, J.; Chen, H. Microstructure, mechanical properties and bio-corrosion properties of Mg–Si(–Ca, Zn) alloy for biomedical application. Acta Biomater. 2010, 6, 1756–1762. [Google Scholar] [CrossRef] [PubMed]
  22. Liu, X.; Shan, D.; Song, Y.; Han, E.-H. Influence of yttrium element on the corrosion behaviors of Mg–Y binary magnesium alloy. J. Magnes. Alloys 2017, 5, 26–34. [Google Scholar] [CrossRef]
  23. Bi, G.; Li, Y.; Zang, S.; Zhang, J.; Ma, Y.; Hao, Y. Microstructure, mechanical and corrosion properties of Mg–2Dy–xZn (x = 0, 0.1, 0.5 and 1 at.%) alloys. J. Magnes. Alloys 2014, 2, 64–71. [Google Scholar] [CrossRef]
  24. Li, D.; Wang, Q.; Ding, W. Effects of Ho on the microstructure and mechanical properties of Mg-Zn-Ho-Zr magnesium alloys. Rare Met. 2011, 30, 131–136. [Google Scholar] [CrossRef]
  25. Sajuri, Z.B.; Miyashita, Y.; Hosokai, Y.; Mutoh, Y. Effects of Mn content and texture on fatigue properties of as-cast and extruded AZ61 magnesium alloys. Int. J. Mech. Sci. 2006, 48, 198–209. [Google Scholar] [CrossRef]
  26. Lugo, M.; Jordon, J.; Solanki, K.; Hector, L.; Bernard, J.; Luo, A.; Horstemeyer, M. Role of different material processing methods on the fatigue behavior of an AZ31 magnesium alloy. Int. J. Fatigue 2013, 52, 131–143. [Google Scholar] [CrossRef]
  27. Azeem, M.; Tewari, A.; Ramamurty, U. Effect of recrystallization and grain growth on the mechanical properties of an extruded AZ21 Mg alloy. Mater. Sci. Eng. A 2010, 527, 898–903. [Google Scholar] [CrossRef]
  28. Khan, S.A.; Miyashita, Y.; Mutoh, Y.; Sajuri, Z.B. Influence of Mn content on mechanical properties and fatigue behavior of extruded Mg alloys. Mater. Sci. Eng. A 2006, 420, 315–321. [Google Scholar] [CrossRef]
  29. Nam, N.D.; Mathesh, M.; Forsyth, M.; Jo, D.S. Effect of manganese additions on the corrosion behavior of an extruded Mg–5Al based alloy. J. Alloy. Compd. 2012, 542, 199–206. [Google Scholar] [CrossRef]
  30. Crosby, W.H.; Likhite, V.V.; O’Brien, J.E.; David, F. Serum Iron Levels in Ostensibly Normal People. JAMA 1974, 227, 310–312. [Google Scholar] [CrossRef] [PubMed]
  31. Hou, L.; Li, Z.; Pan, Y.; Du, L.; Li, X.; Zheng, Y.; Li, L. In vitro and in vivo studies on biodegradable magnesium alloy. Prog. Nat. Sci. Mater. Int. 2014, 24, 466–471. [Google Scholar] [CrossRef] [Green Version]
  32. Haghshenas, M. Mechanical characteristics of biodegradable magnesium matrix composites: A review. J. Magnes. Alloys 2017, 5, 189–201. [Google Scholar] [CrossRef]
  33. Liu, X.; Sun, J.; Zhou, F.; Yang, Y.; Chang, R.; Qiu, K.; Pu, Z.; Li, L.; Zheng, Y. Micro-alloying with Mn in Zn–Mg alloy for future biodegradable metals application. Mater. Des. 2016, 94, 95–104. [Google Scholar] [CrossRef]
  34. Li, H.; Zheng, Y.; Qin, L. Progress of biodegradable metals. Prog. Nat. Sci. Mater. Int. 2014, 24, 414–422. [Google Scholar] [CrossRef] [Green Version]
  35. Peron, M.; Torgersen, J.; Berto, F. Mg and Its Alloys for Biomedical Applications: Exploring Corrosion and Its Interplay with Mechanical Failure. Metals 2017, 7, 252. [Google Scholar] [CrossRef] [Green Version]
  36. Atrens, A.; Liu, M.; Zainal Abidin, N.I. Corrosion mechanism applicable to biodegradable magnesium implants. Mater. Sci. Eng. B 2011, 176, 1609–1636. [Google Scholar] [CrossRef]
  37. Trumbo, P.; Schlicker, S.; Yates, A.A.; Poos, M. Dietary Reference Intakes for Energy, Carbohydrate, Fiber, Fat, Fatty Acids, Cholesterol, Protein and Amino Acids. J. Am. Diet. Assoc. 2002, 102, 1621–1630. [Google Scholar] [CrossRef]
  38. Xin, Y.; Hu, T.; Chu, P. In vitro studies of biomedical magnesium alloys in a simulated physiological environment: A review. Acta Biomater. 2011, 7, 1452–1459. [Google Scholar] [CrossRef]
  39. Van der Biest, O.; Pelegrin, I.M. Degradation Testing of Magnesium and its Alloys aiming at Biodegradable Implant Applications; Degradatietesten van magnesium en magnesium legeringen voor biologisch afbreekbare implantaten. Dissertation 2016, 19–24. [Google Scholar]
  40. Pang, S.; Wu, G.; Liu, W.; Sun, M.; Zhang, Y.; Liu, Z.; Ding, W. Effect of cooling rate on the microstructure and mechanical properties of sand-casting Mg–10Gd–3Y–0.5Zr magnesium alloy. Mater. Sci. Eng. A 2013, 562, 152–160. [Google Scholar] [CrossRef]
  41. Petzow, G. Metallographic Etching: Metallographic and Ceramographic Methods for Revealing Microstructure, 5th ed.; American Society for Metals: Geauga, OH, USA, 1978; pp. 72–74. [Google Scholar]
  42. Ding, Y.; Wen, C.; Hodgson, P.; Li, Y. Effects of alloying elements on the corrosion behavior and biocompatibility of biodegradable magnesium alloys: A review. J. Mater. Chem. B 2014, 2, 1912–1933. [Google Scholar] [CrossRef] [PubMed]
  43. Poinern, G.E.J.; Brundavanam, S.; Fawcett, D. Biomedical Magnesium Alloys: A Review of Material Properties, Surface Modifications and Potential as a Biodegradable Orthopaedic Implant. Am. J. Biomed. Eng. 2012, 2, 218–2540. [Google Scholar] [CrossRef] [Green Version]
Figure 1. (a) Cast sample of Mg. (b) Prepared sample for microstructure and compositional analysis.
Metals 11 01264 g001
Figure 2. Stereoscope imaging of the macrostructure of pure magnesium at 6.5×. (a) Cooled in the furnace LCR-Mg (low cooling rate) with scale bar of 5000 µm, (b) cooled in the furnace with uninsulated-ends MCR-Mg (moderate cooling rate) with scale bar of 5000 µm.
Metals 11 01264 g002
Figure 3. Microscope images of the microstructure of pure magnesium quenched in liquid CO2 at 500×. (a) The far side from the cooling inlet with scale bar of 20 µm, (b) the near side from the cooling inlet with scale bar of 20 µm.
Metals 11 01264 g003
Figure 4. The grain size-cooling rate curve for low cooling rate LCR-Mg (0.035 °C/s) in an insulated furnace, moderate cooling rate MCR-Mg (0.074 °C/s) in an uninsulated-ends furnace, and high cooling rate HCR-Mg (13.5 °C/s) in liquid CO2.
Metals 11 01264 g004
Figure 5. Charpy impact strength of the alloying systems.
Metals 11 01264 g005
Figure 6. The fracture surface morphology of impact samples of pure magnesium at 6.5×. (a) Top view and (b) side view are for slowly cooled pure magnesium (LCR-Mg), (c) top view and (d) side view are for moderately cooled pure magnesium (MCR-Mg), (e) top view and (f) side view are for quenched pure magnesium (HCR-Mg).
Metals 11 01264 g006
Figure 7. Scale-H Rockwell Hardness of pure magnesium at different solidification rates.
Metals 11 01264 g007
Figure 8. The stress-strain curves for pure magnesium cooled at different solidification rates.
Metals 11 01264 g008
Figure 9. The tensile fracture morphology for pure magnesium that were cooled by different solidification rates with scale bar of 2000 µm. (a) LCR-Mg, (b) MCR-Mg, (c) HCR-Mg.
Metals 11 01264 g009
Figure 10. Tensile properties chart for pure magnesium with different solidification rates.
Metals 11 01264 g010
Figure 11. SEM images of pure magnesium cooled in the furnace (low cooling rate) at different magnifications. (a) At 10,000× with scale bar of 1 µm, (b) at 20,000× with scale bar of 1 µm, and (c) pure magnesium rapidly cooled in liquid CO2 at different magnifications at 1000× with scale bar of 10 µm.
Metals 11 01264 g011aMetals 11 01264 g011b
Figure 12. EDS elements map of LCR-Mg cooled in the furnace (slow cooling rate). (a) Area of interest. (b) Magnesium map. (c) Oxygen map.
Metals 11 01264 g012
Figure 13. The EDS spectrum images of LCR-Mg cooled in the furnace (low cooling rate).
Metals 11 01264 g013
Table 1. Impurity content of the purchased magnesium (nominal) [42,43].
ElementsWeight (%)
Manganese<0.05
Silicon<0.05
Cobalt<0.01
Aluminum<0.005
Copper<0.005
Iron<0.001
Lead<0.001
Nickel<0.001
Zinc<0.001
Table 2. Average grain size of pure magnesium under different cooling rates.
Pure Mg~Grain Size (µm)
LCR-Mg (0.035 °C/s)4235
MCR-Mg (0.074 °C/s)2252
HCR-Mg (13.5 °C/s)6 to 12
Table 3. Summary of Charpy impact testing results.
Mg SystemsBreak Energy (J)Impact Strength (J/m)
LCR-Mg6.6660
MCR-Mg6.54654.2
HCR-Mg5.49549.2
Table 4. The results summary for tensile properties for all Mg alloying systems.
Alloying SystemsE (GPa)YS (MPa)UTS (MPa)Ductility (%)
LCR-Mg4.615.4048.9710.30
MCR-Mg2.624.1967.410.29
HCR-Mg7.724.3487.189.50
Publisher’s Note: MDPI stays neutral with regard to jurisdictional claims in published maps and institutional affiliations.

