
Reliability Design of Mechanical Systems Such as Compressor Subjected to Repetitive Stresses †


Abstract
:1. Introduction
2. Parametric ALT for Mechanical Product
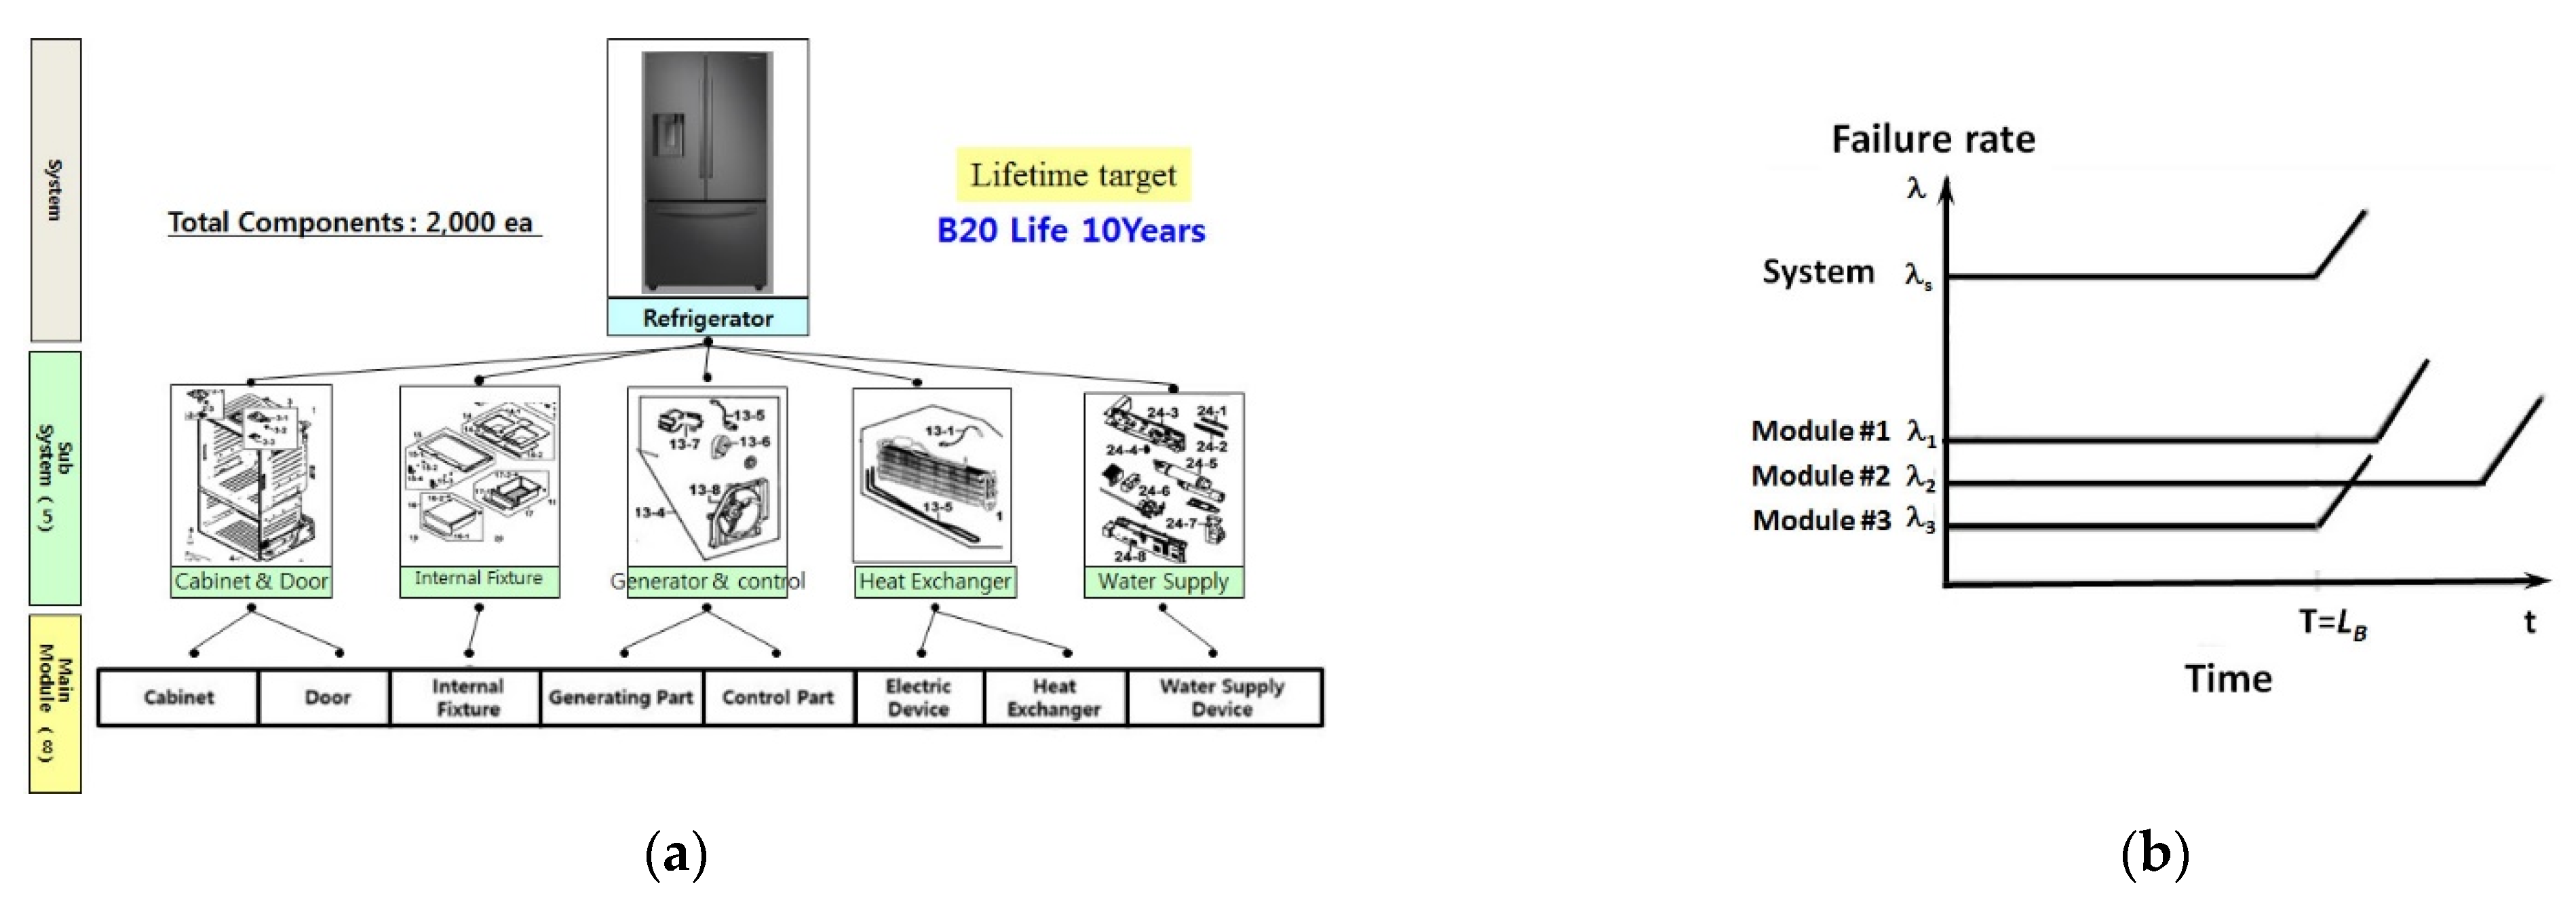
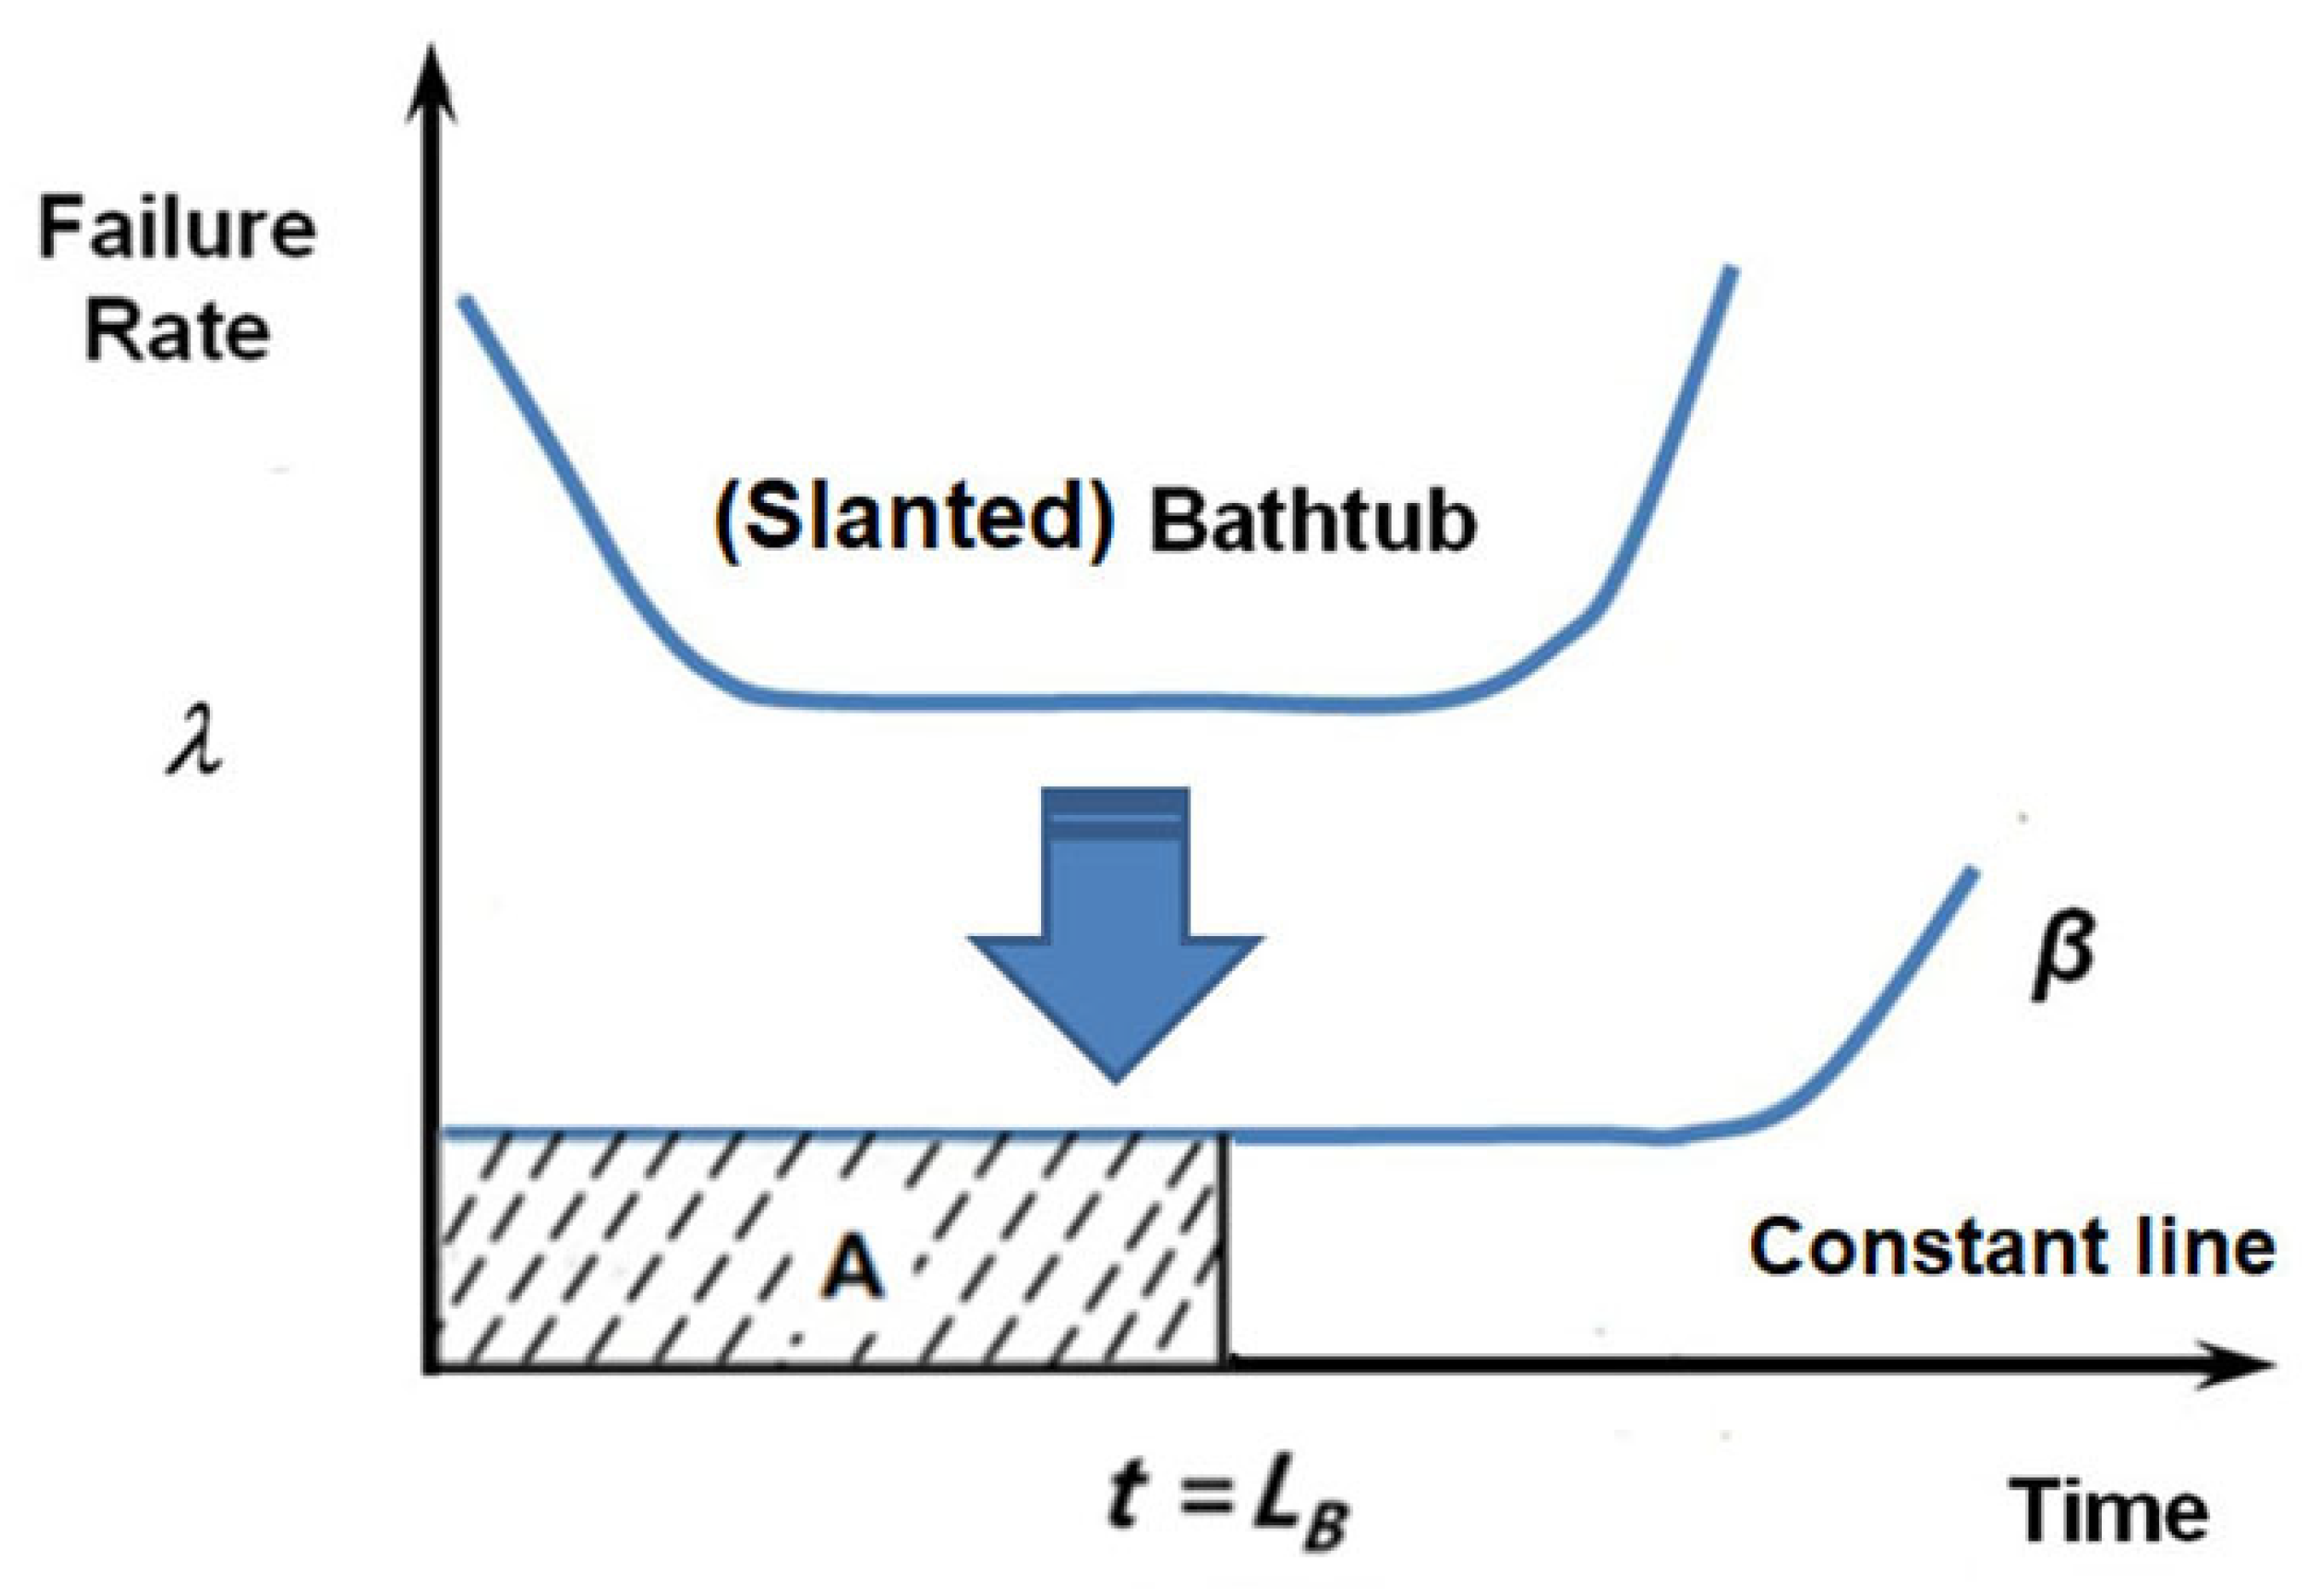
2.1. BX Lifetime of a Mechanical System
2.2. Placing an Entire Parametric ALT Scheme
2.3. Failure Mechanics and Parametric ALT for Redesign
- at first has a little linear result;
- has what is regarded as a medium result;
- at end is large.
2.4. Parametric ALT for Mechanical Systems
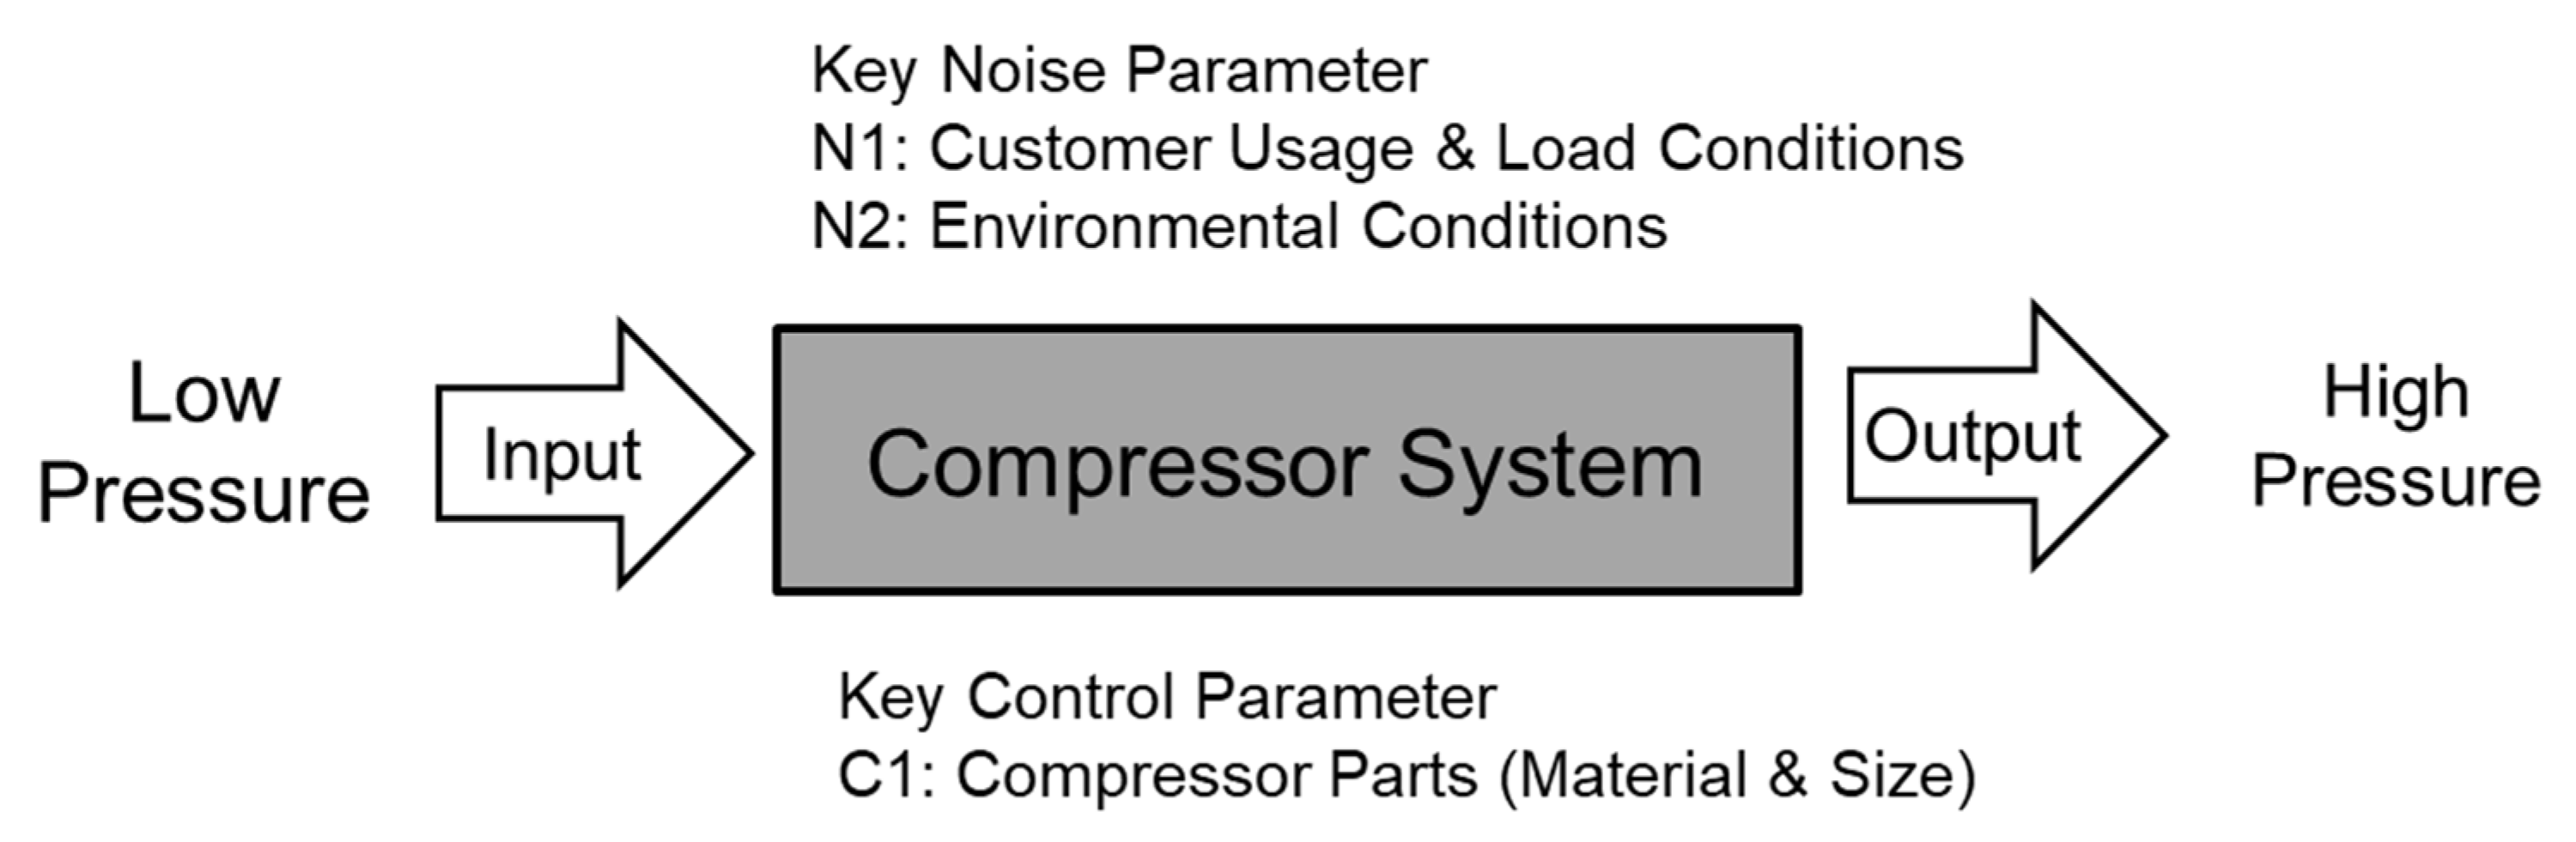
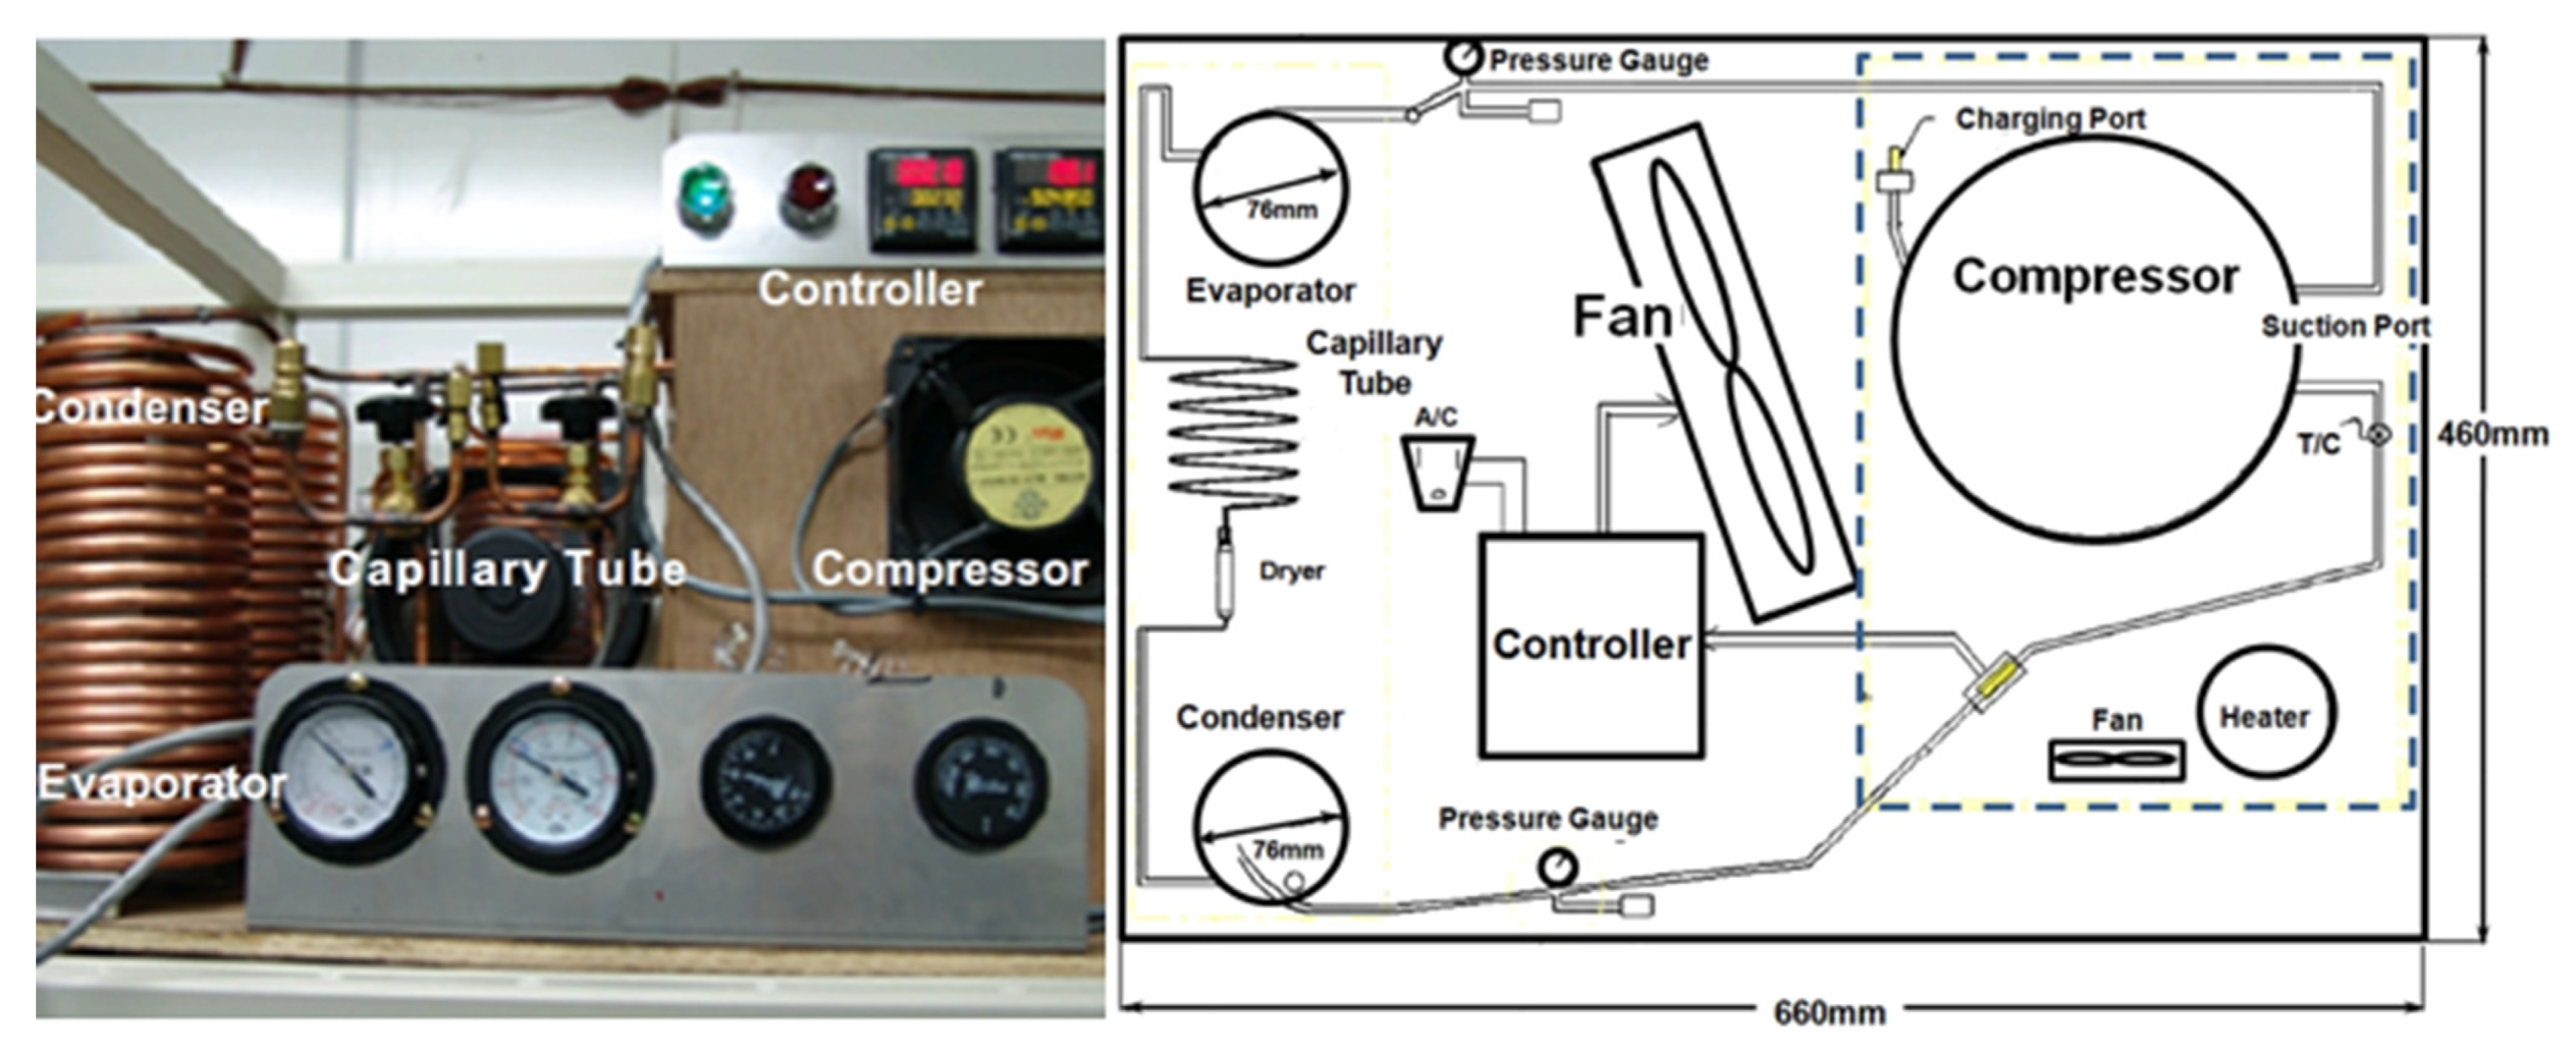
2.5. Case Study—Design of a Recently Designed Domestic Compressor in a Refrigerator
3. Results and Discussion
4. Conclusions
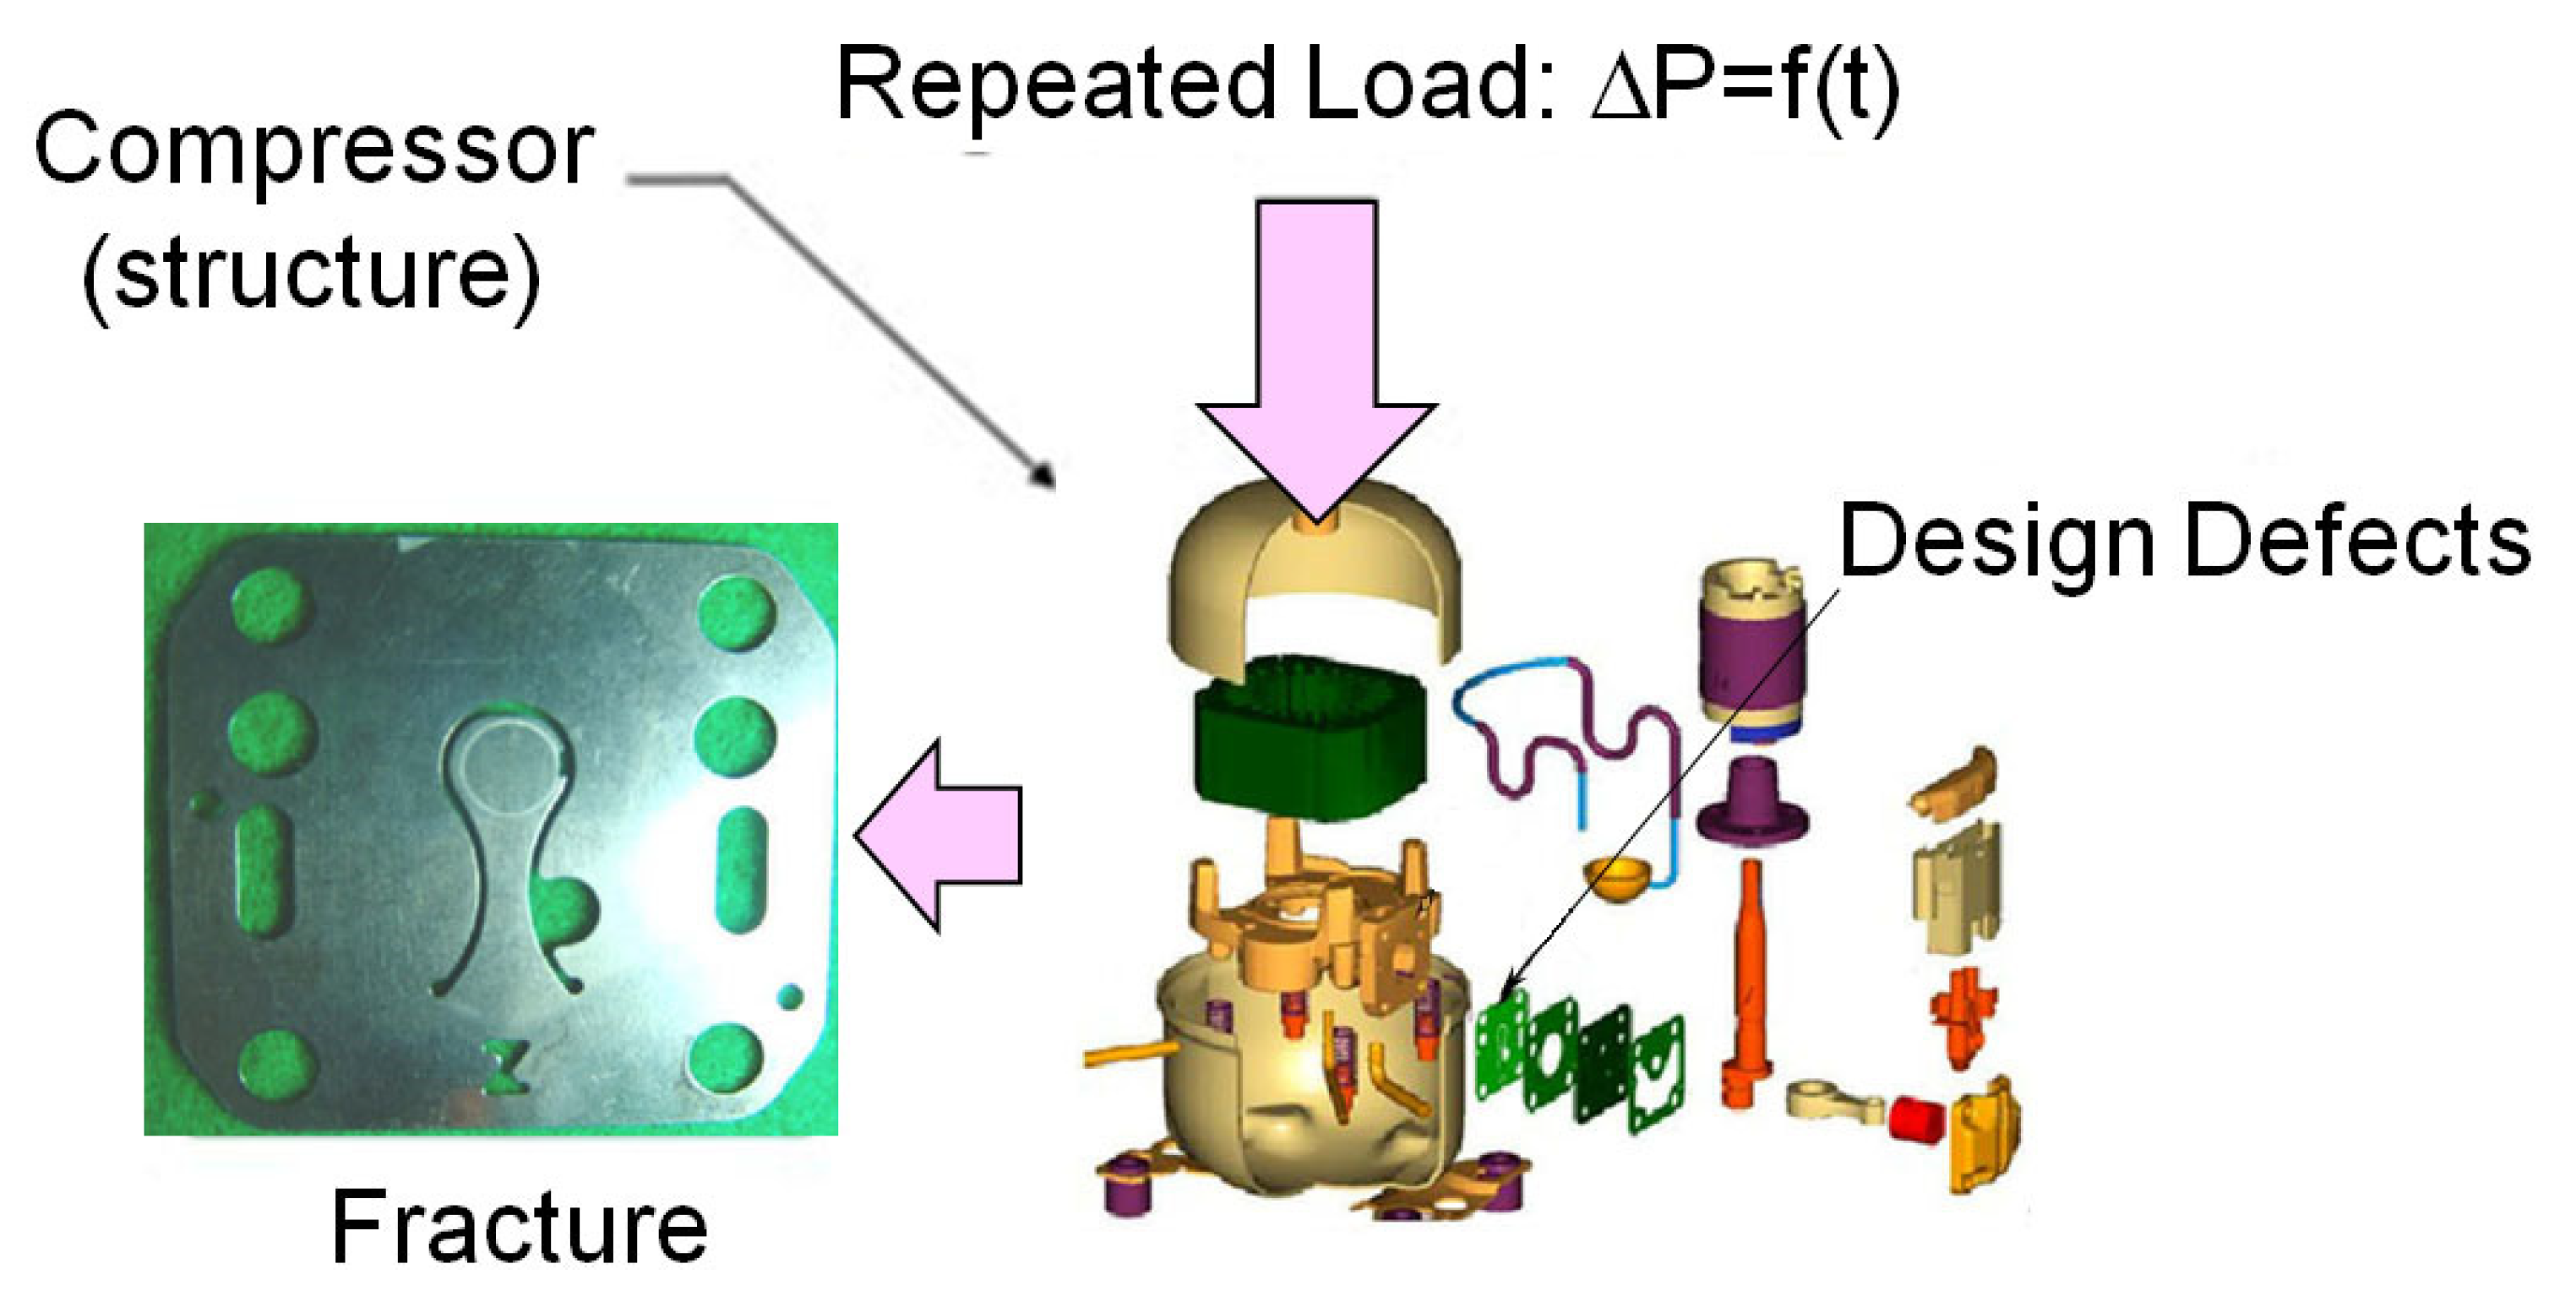
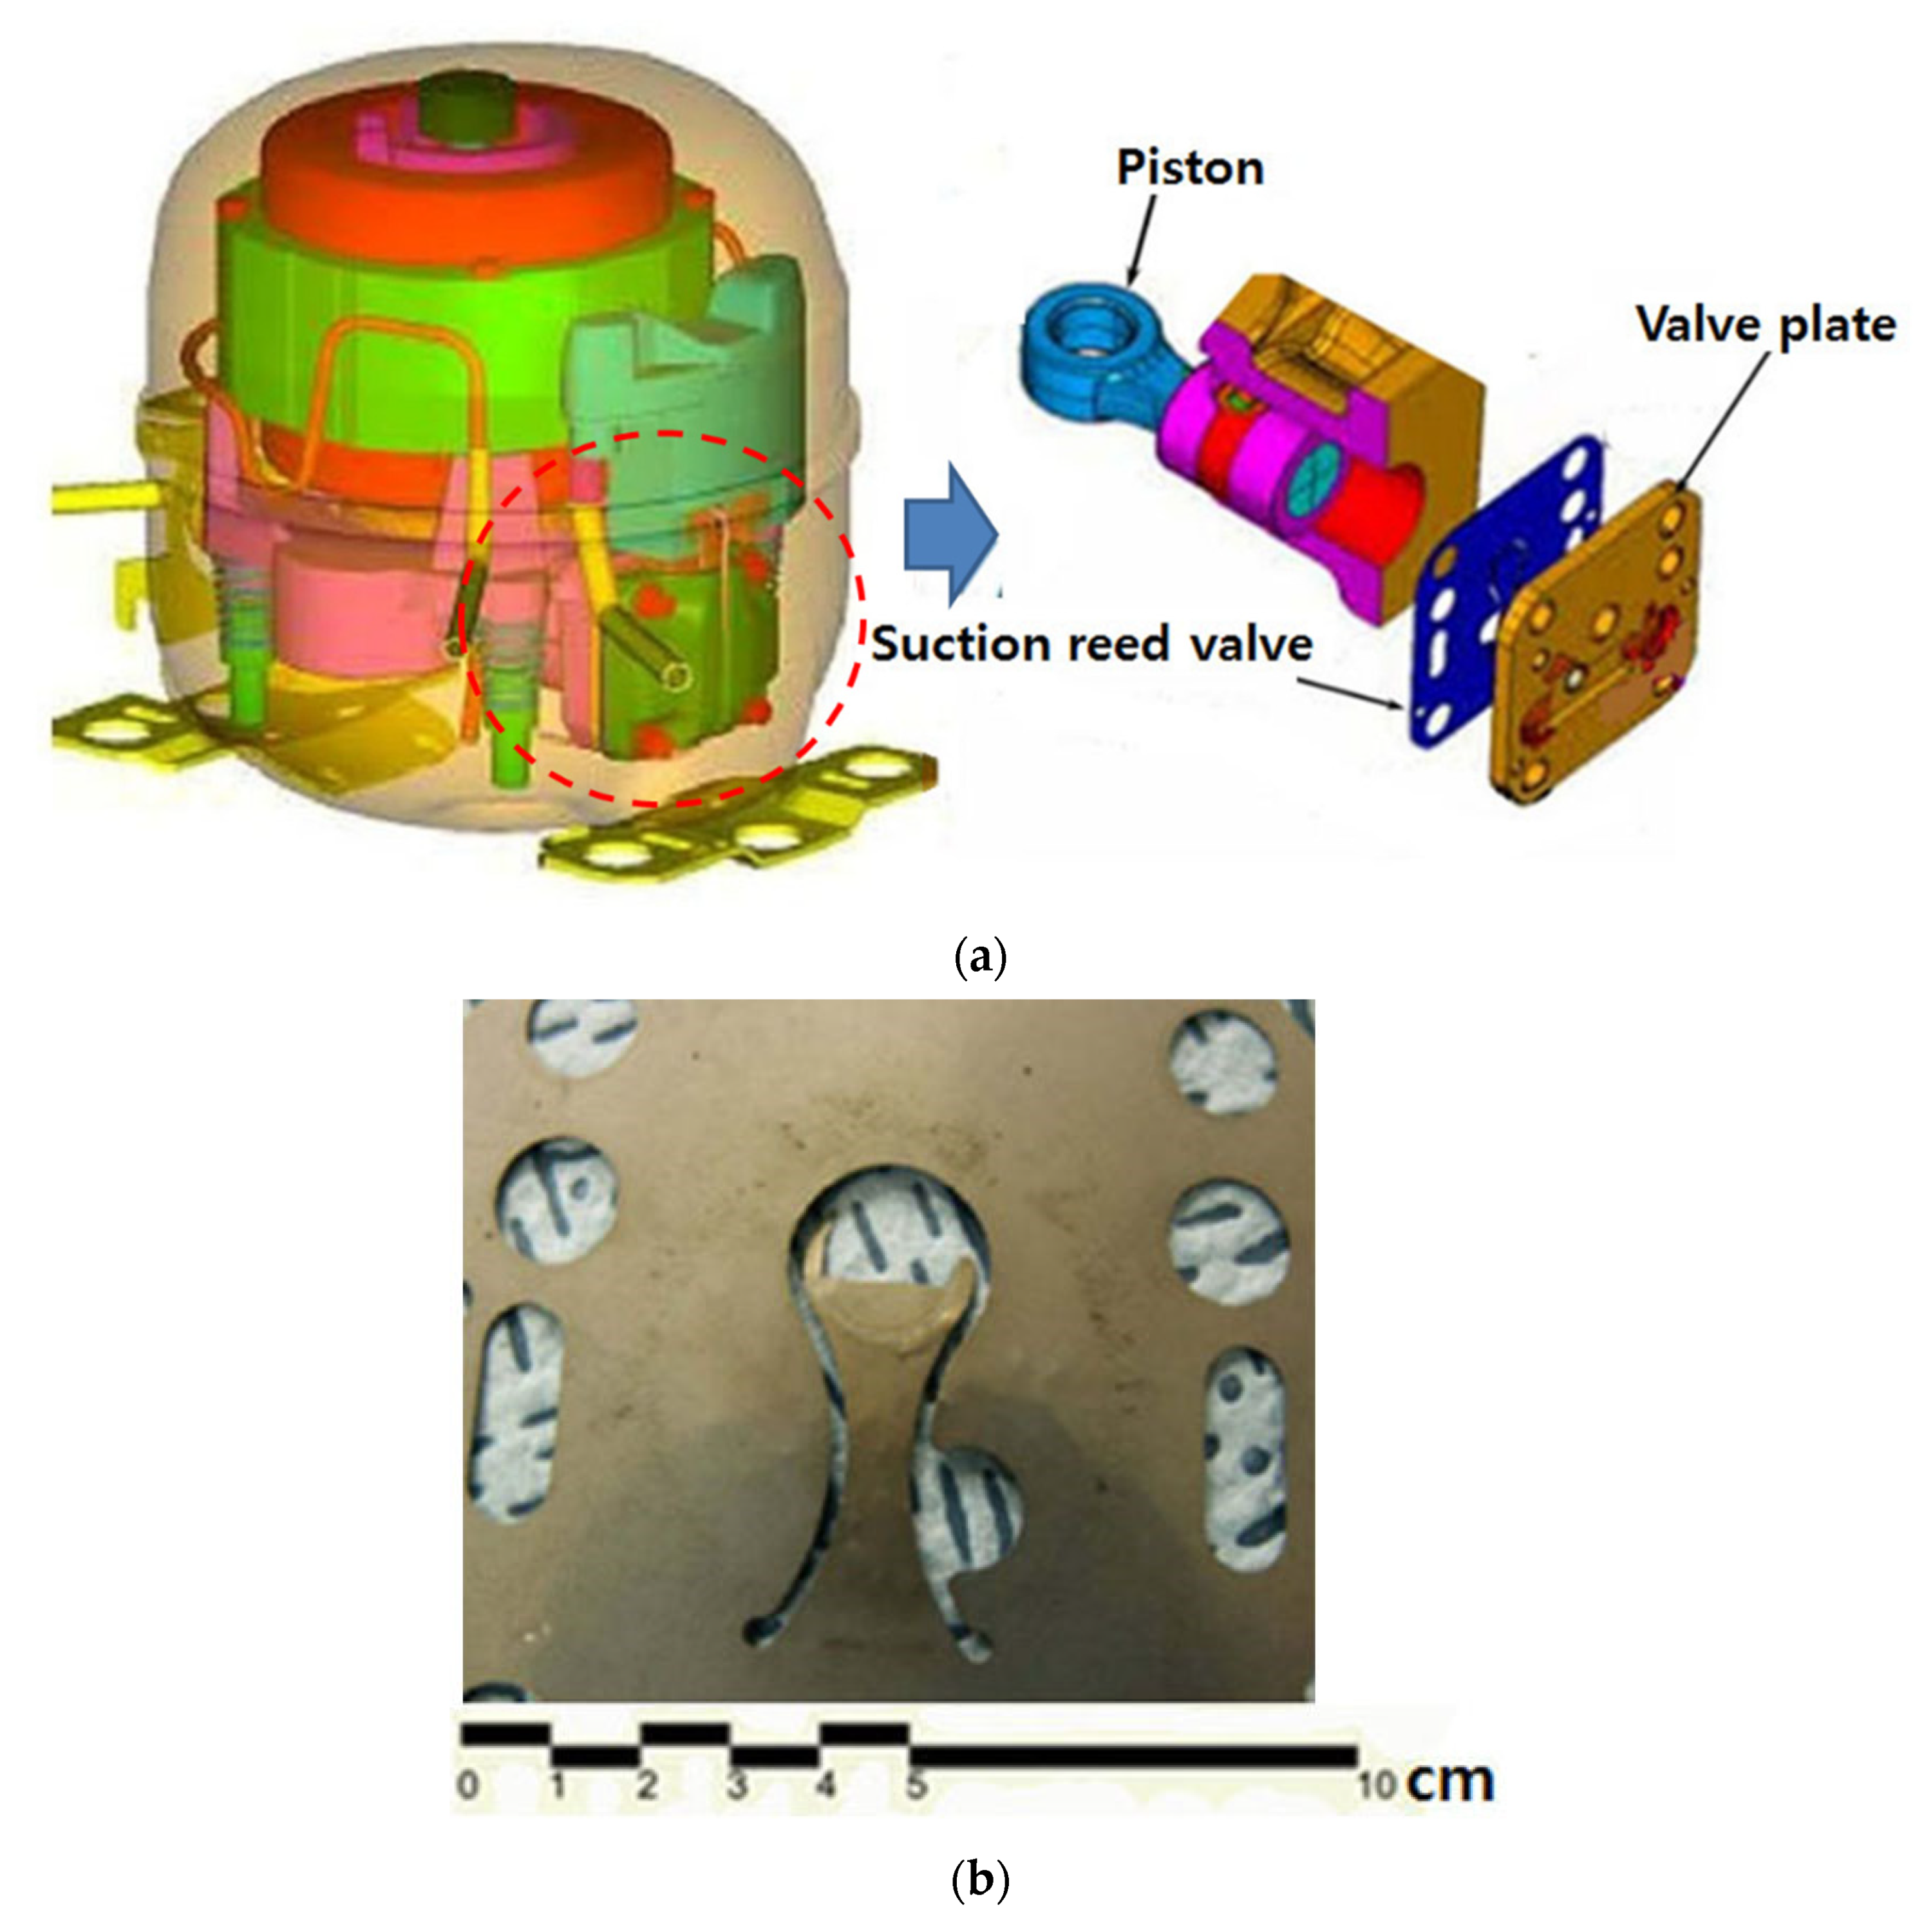
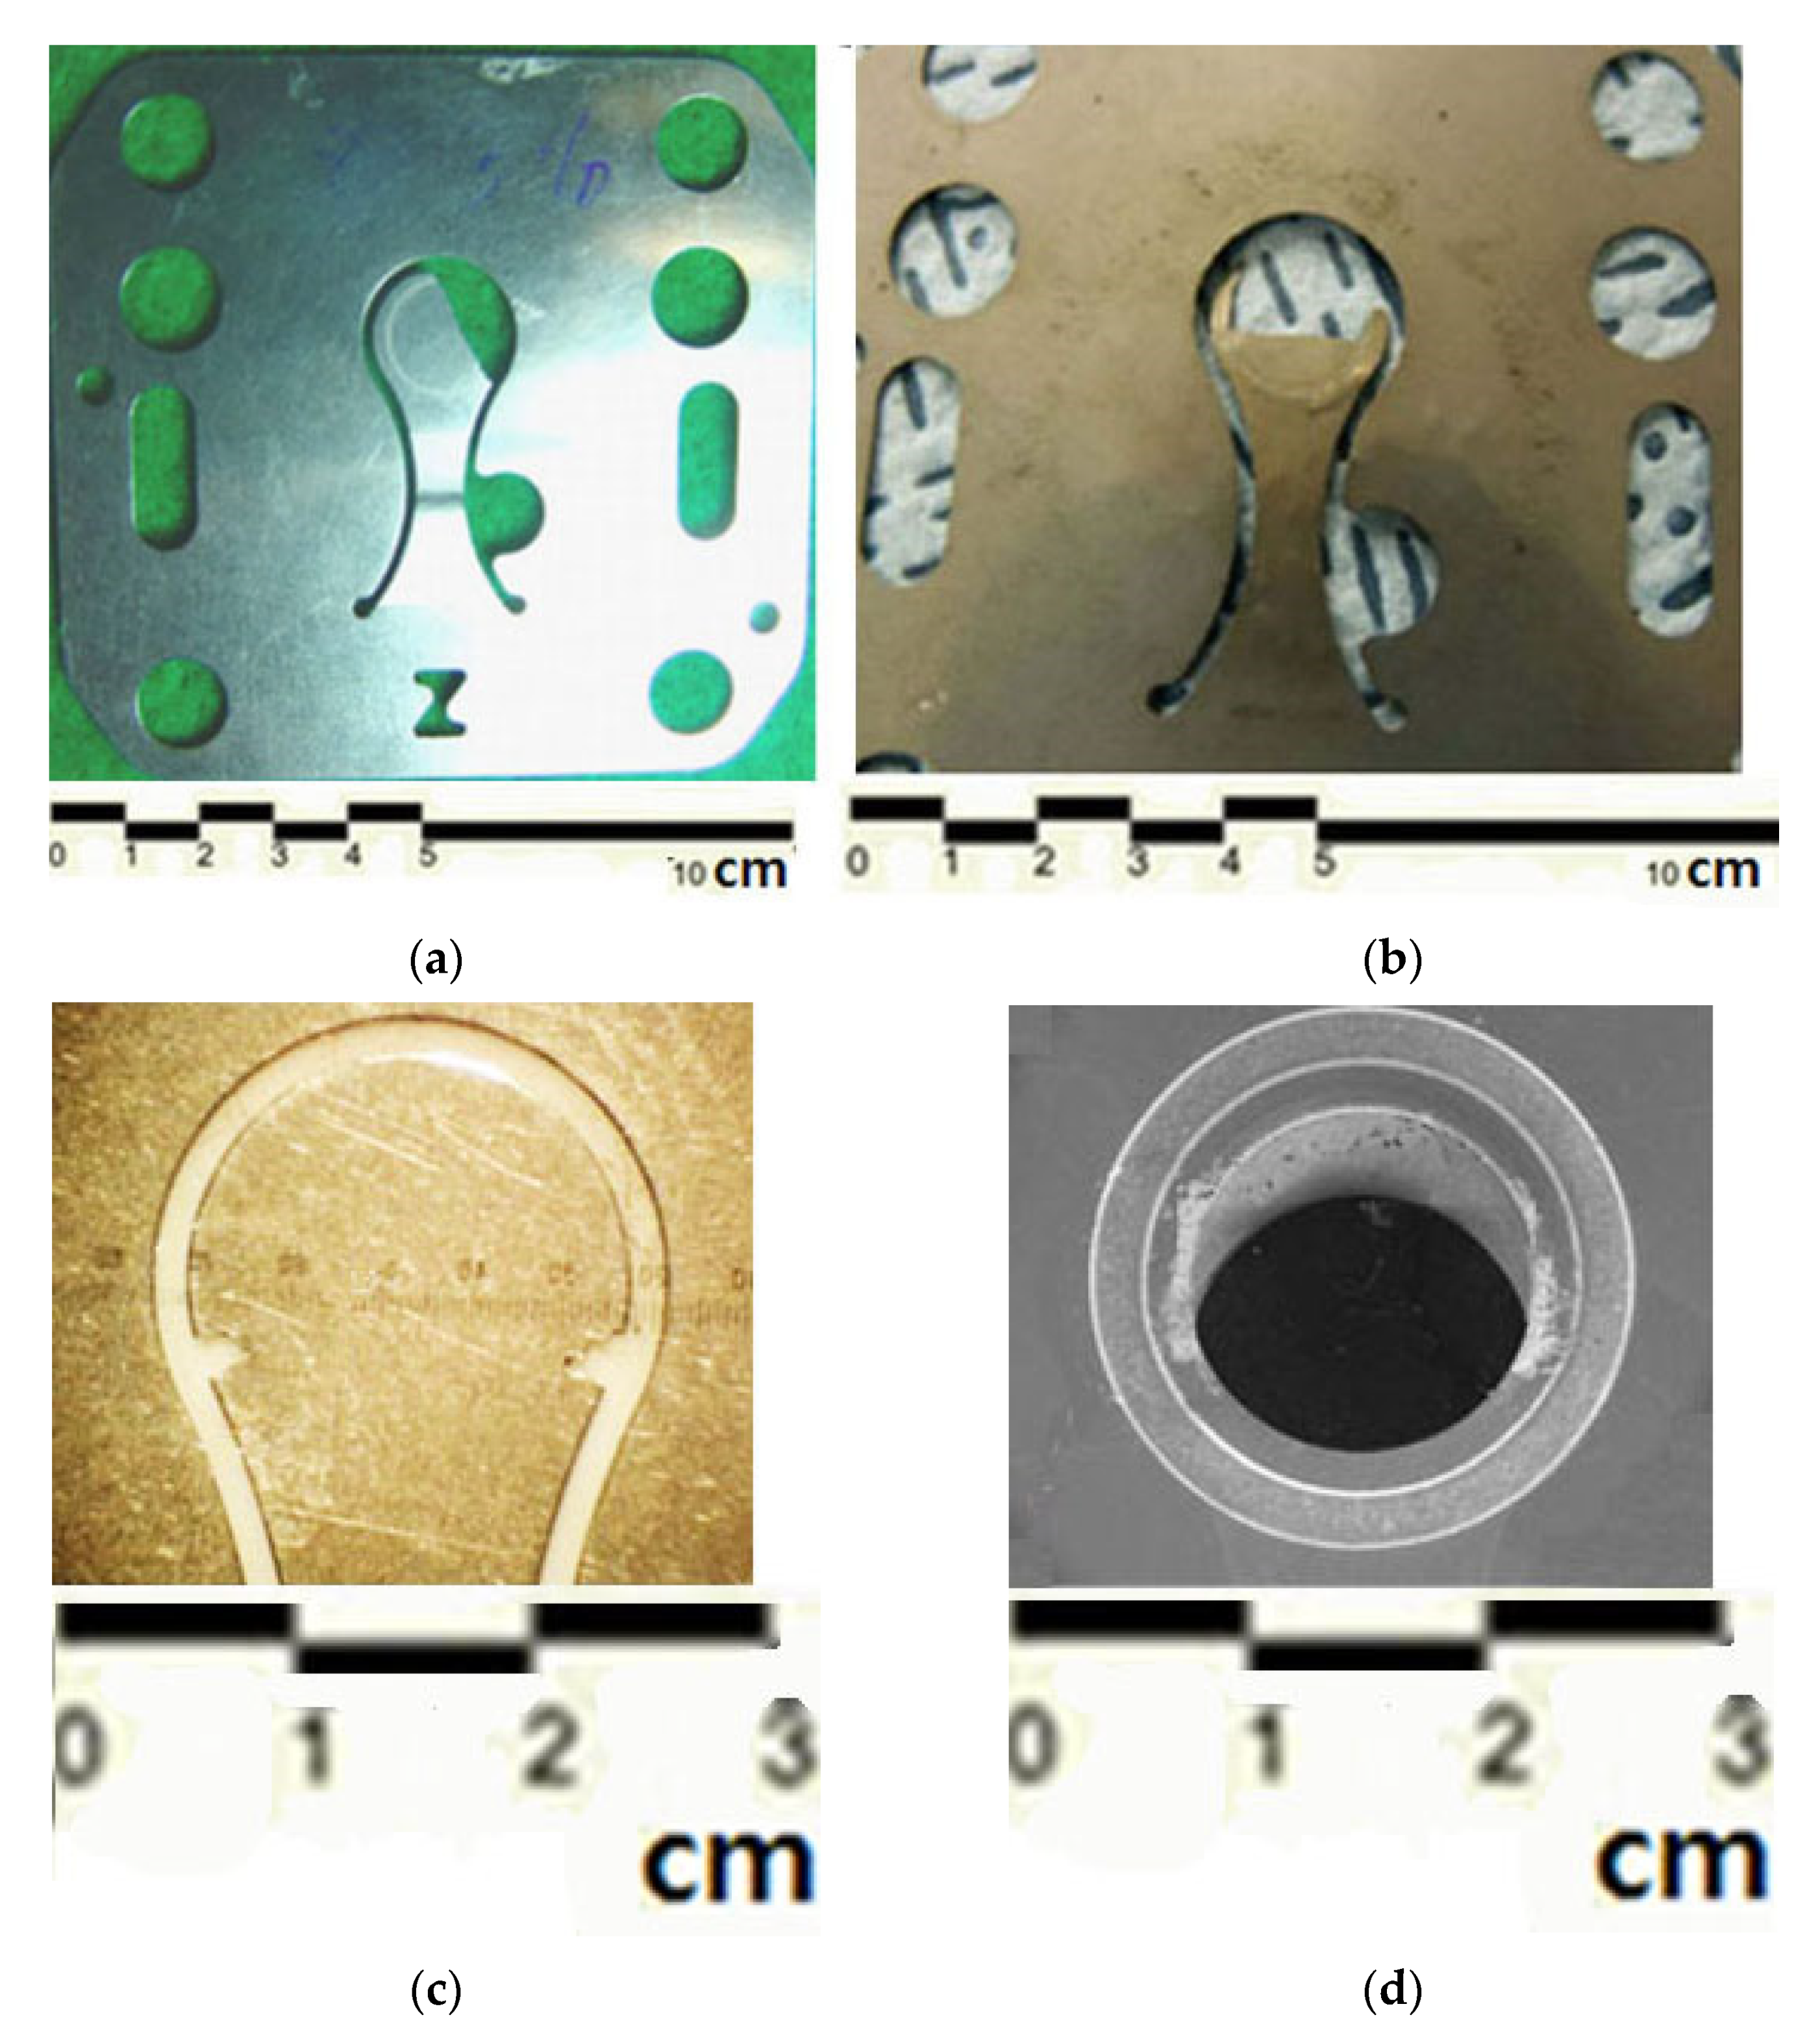
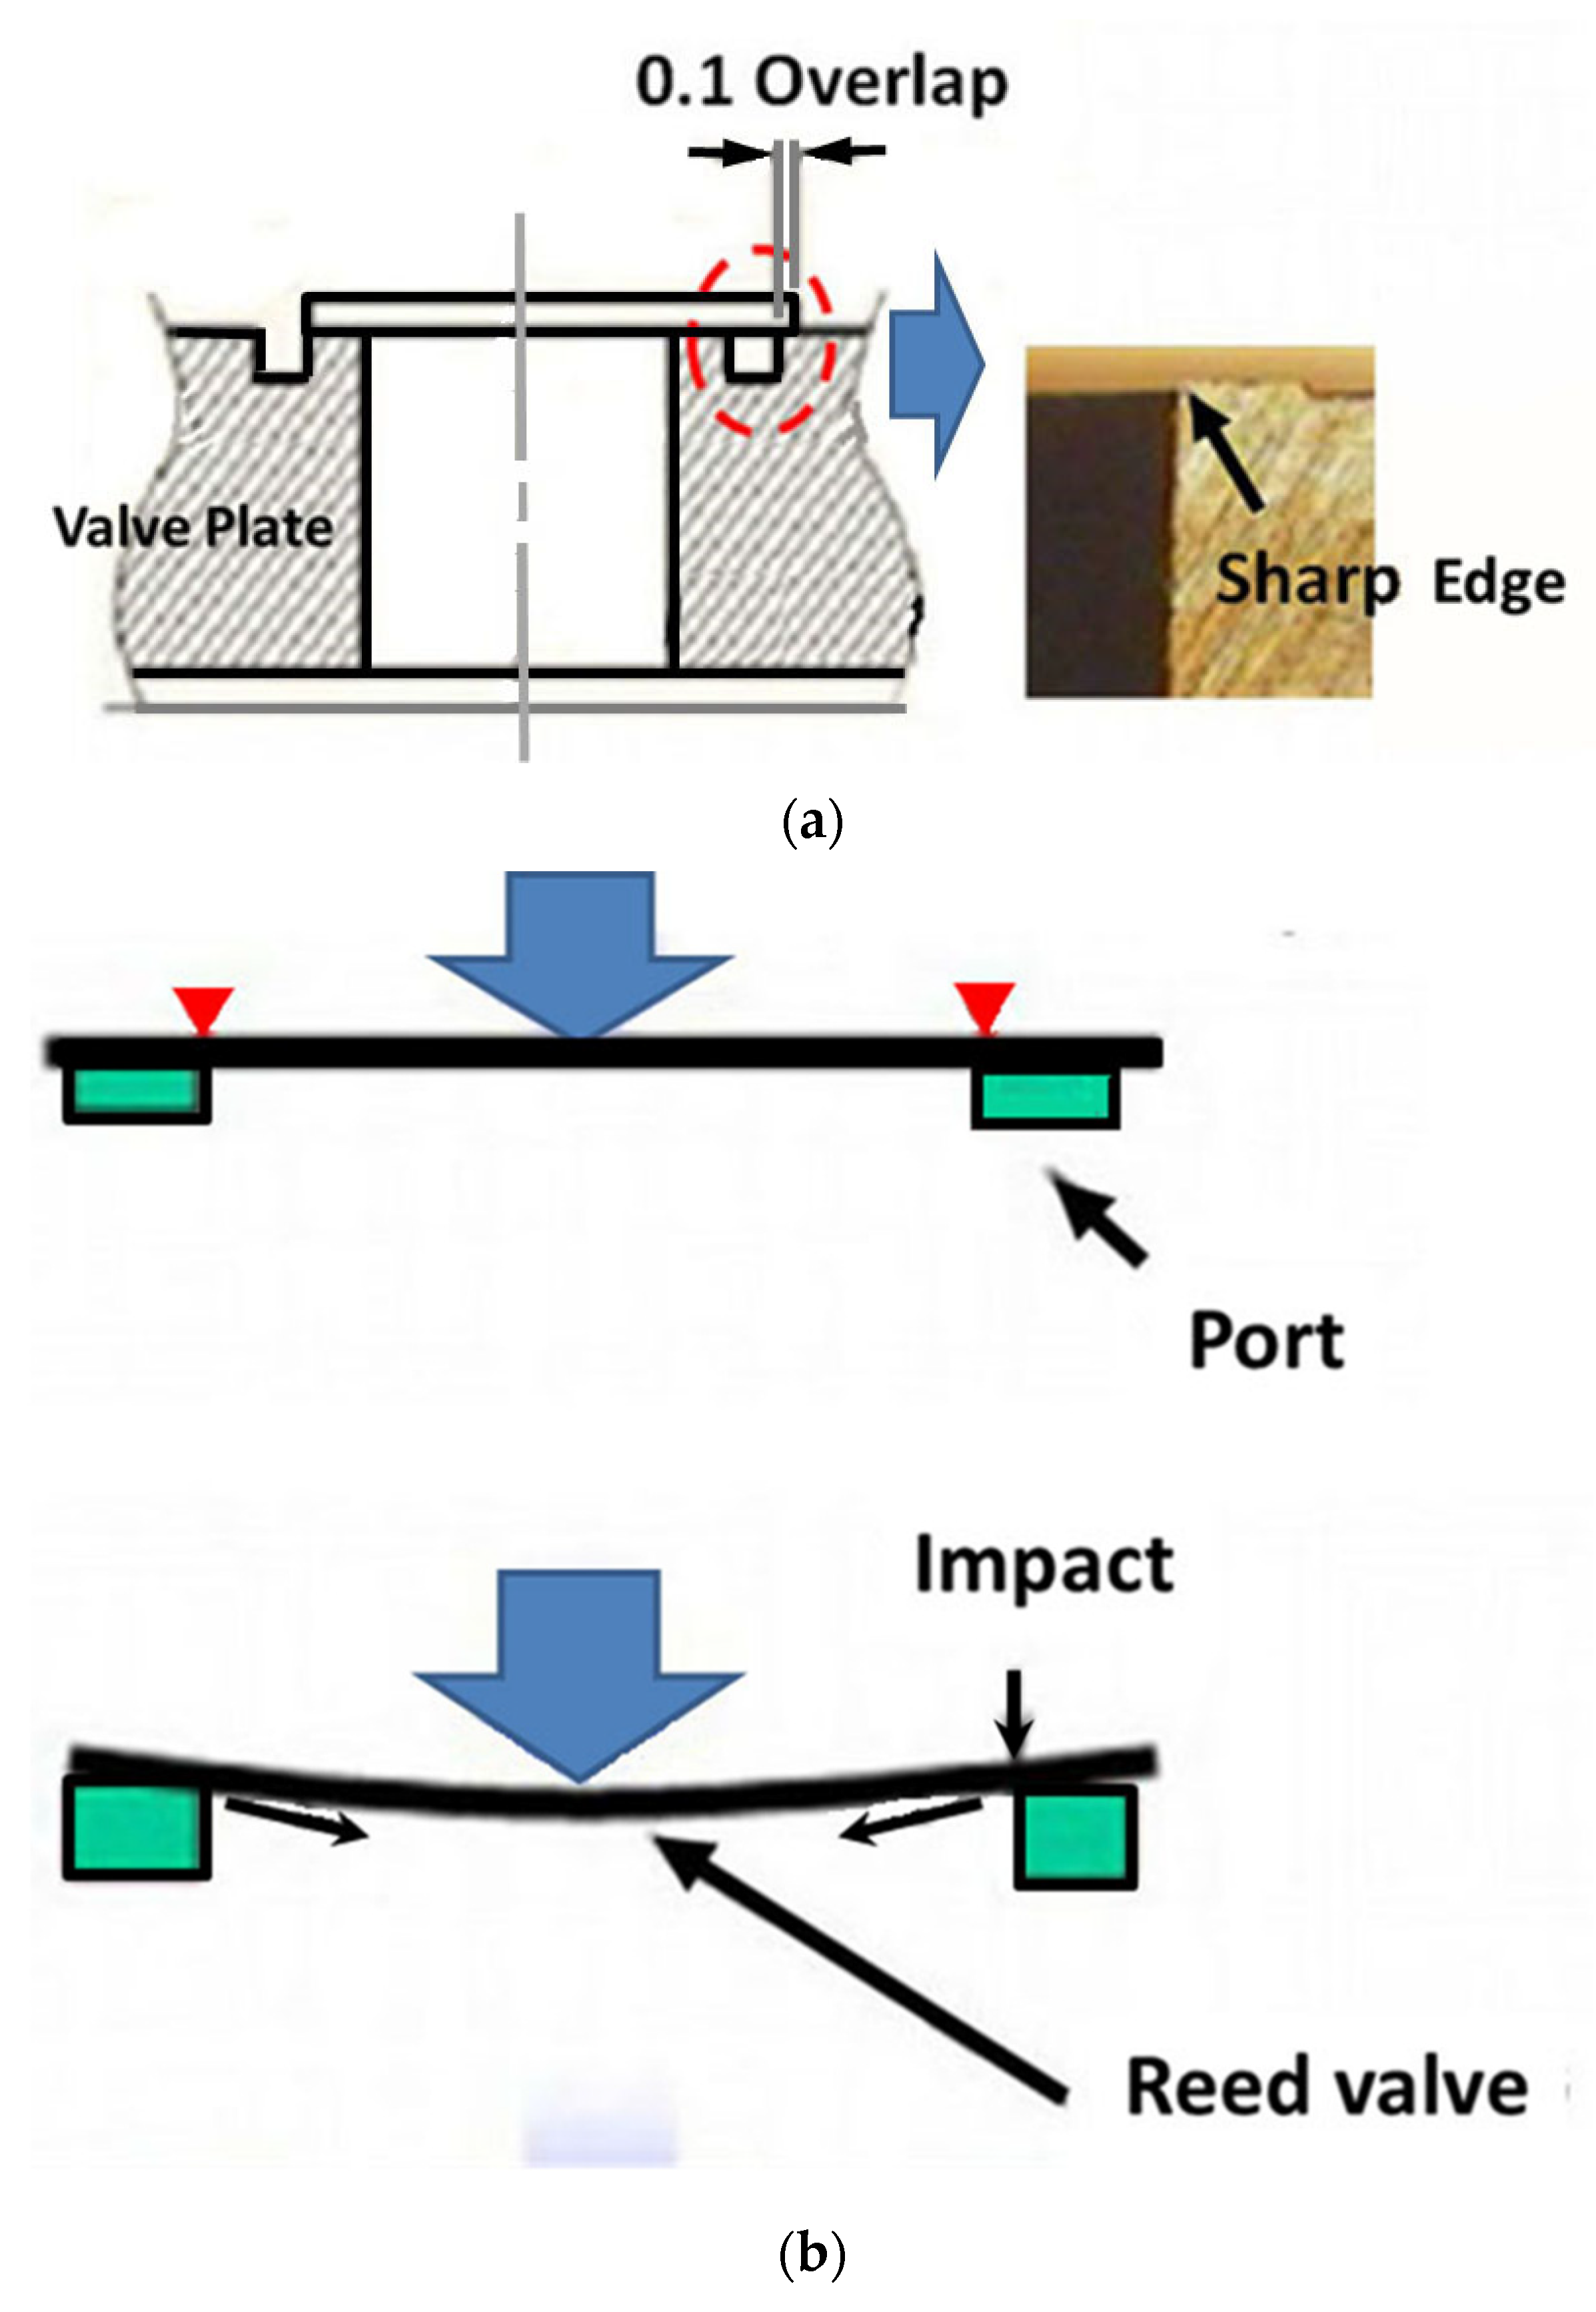
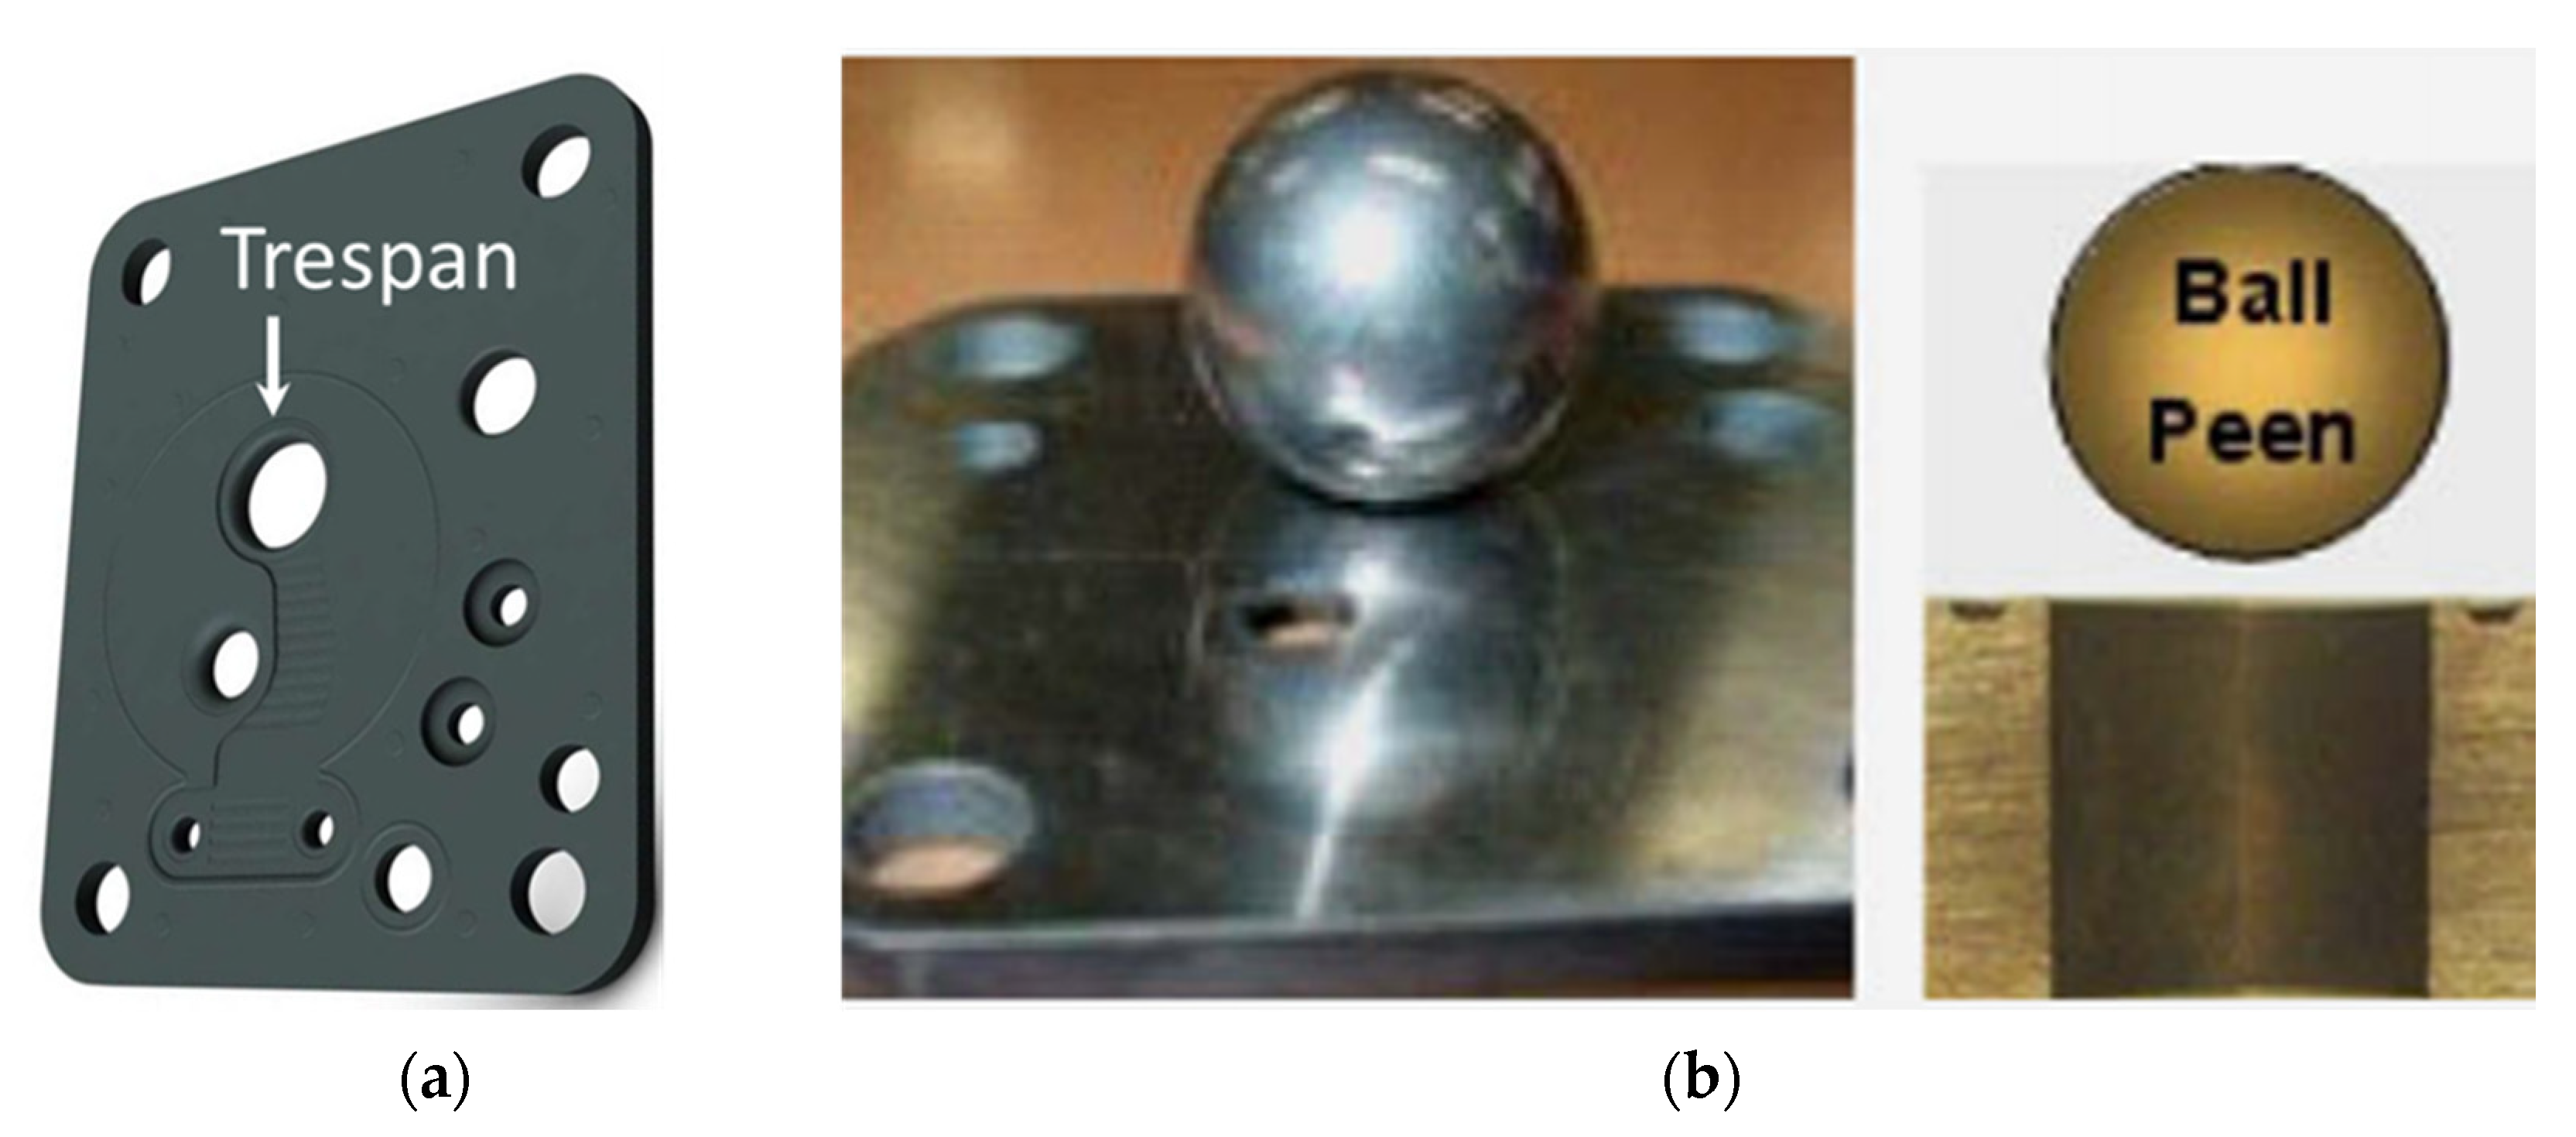
- In the marketplace and the first ALT, we found that the failed suction reed valve in a compressor originated from the following design flaws: (1) a small overlap between the valve with the valve plate, (2) a sharp edge on the valve plate, and (3) inadequate width of the suction reed valve (SANDVIK20 C0.178t). As design modifications, the trepan on the valve plate was extended from 0.73 mm to 1.25 mm, and a ball peening technique was secured to eliminate the sharp edge.For the second ALT, we found that three samples failed near 17,000 cycles because of the intrusion between the crankshaft and thrust washer. As an action plan, the crankshaft was heat-treated.
- During the third ALT, no problems were found. The compressor systems should attain the lifetime target—B1 life of 10 years with about a 60% confidence level.
- By examining problematic products returned from the marketplace and performing parametric ALTs with design modifications, it was possible to improve the expected lifetime of the compressor.
Author Contributions
Funding
Institutional Review Board Statement
Informed Consent Statement
Data Availability Statement
Conflicts of Interest
Abbreviations
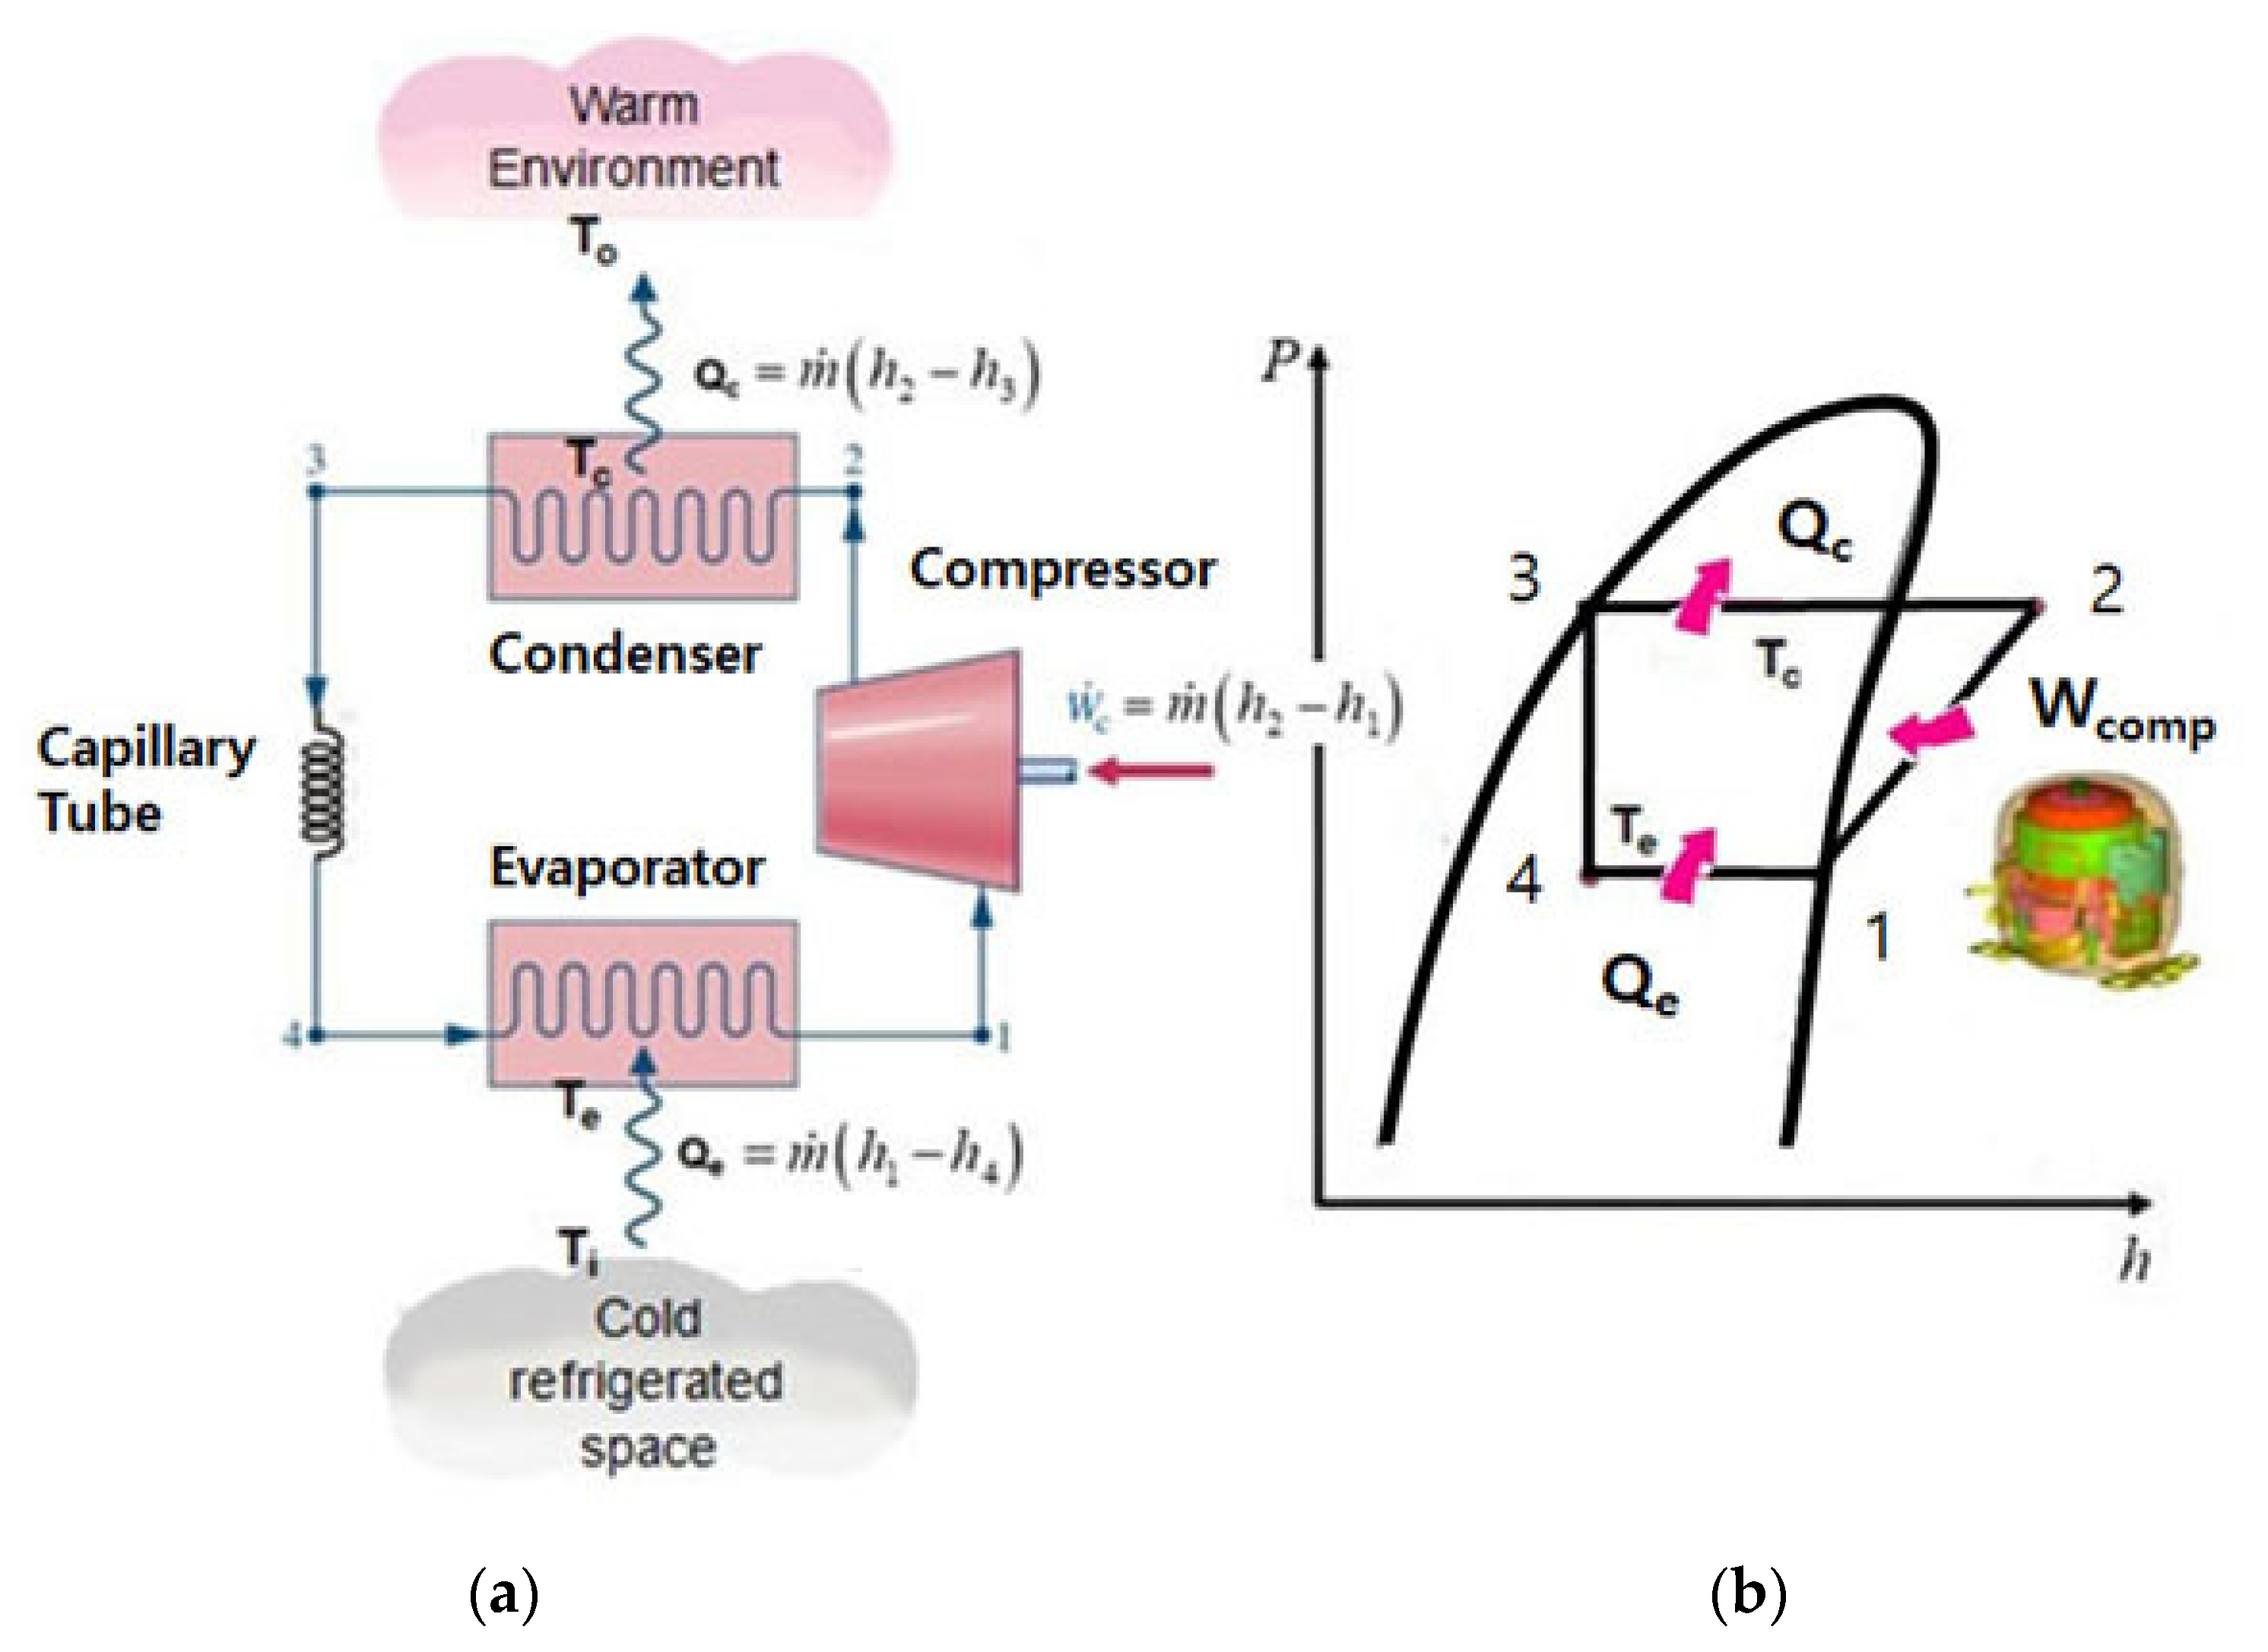
| A | Cross-sectional area of the capillary tube: cm2 |
| BX | Time which is a cumulated failure rate of X%: durability index |
| Ea | Activation energy, eV |
| e | Effort |
| f | Flow |
| F | Impact force, kN |
| F(t) | Unreliability |
| h | Testing cycles (or cycles) |
| h* | Non-dimensional testing cycles, |
| J | Junction function equation |
| K | Boltzmann’s constant, 8.62 × 10⁻⁵ eV/deg |
| ΔL | Capillary tube distance in the two-phase |
| LB | Target BX life and x = 0.01X, on the condition that x ≤ 0.2 |
| n | Number of test samples |
| ΔP | Pressure difference between the condenser and evaporator, MPa |
| PD | Volume flow rate in compressor, m3/s |
| Pc | Pressure in the condenser, MPa |
| Pe | Pressure in the evaporator, MPa |
| Psuc | Pressure at compressor suction, MPa |
| Pdis | Pressure at compressor discharge, MPa |
| Q | Amount of energy absorbed or released during the reaction. For the semiconductor, total number of dopants per unit area |
| Qc | Heat transfer by temperature difference in the condenser, kW |
| Qe | Heat transfer by temperature difference in the evaporator, kW |
| R | Ratio for minimum stress to maximum stress in stress cycle, σmin/σmax |
| r | Failed numbers |
| Rc | Thermal resistance in the condenser, K/kW |
| Re | Thermal resistance in the evaporator, K/kW |
| S | Stress |
| T | Temperature, K |
| Tc | Absolute temperature in the condenser, K |
| Te | Absolute temperature in the evaporator, K |
| ti | Test time for each sample |
| TF | Time to failure |
| X | Accumulated failure rate, % |
| x | x = 0.01X, on condition that x ≤ 0.2 |
| Wc | Compressor power, kW |
| Greek symbols | |
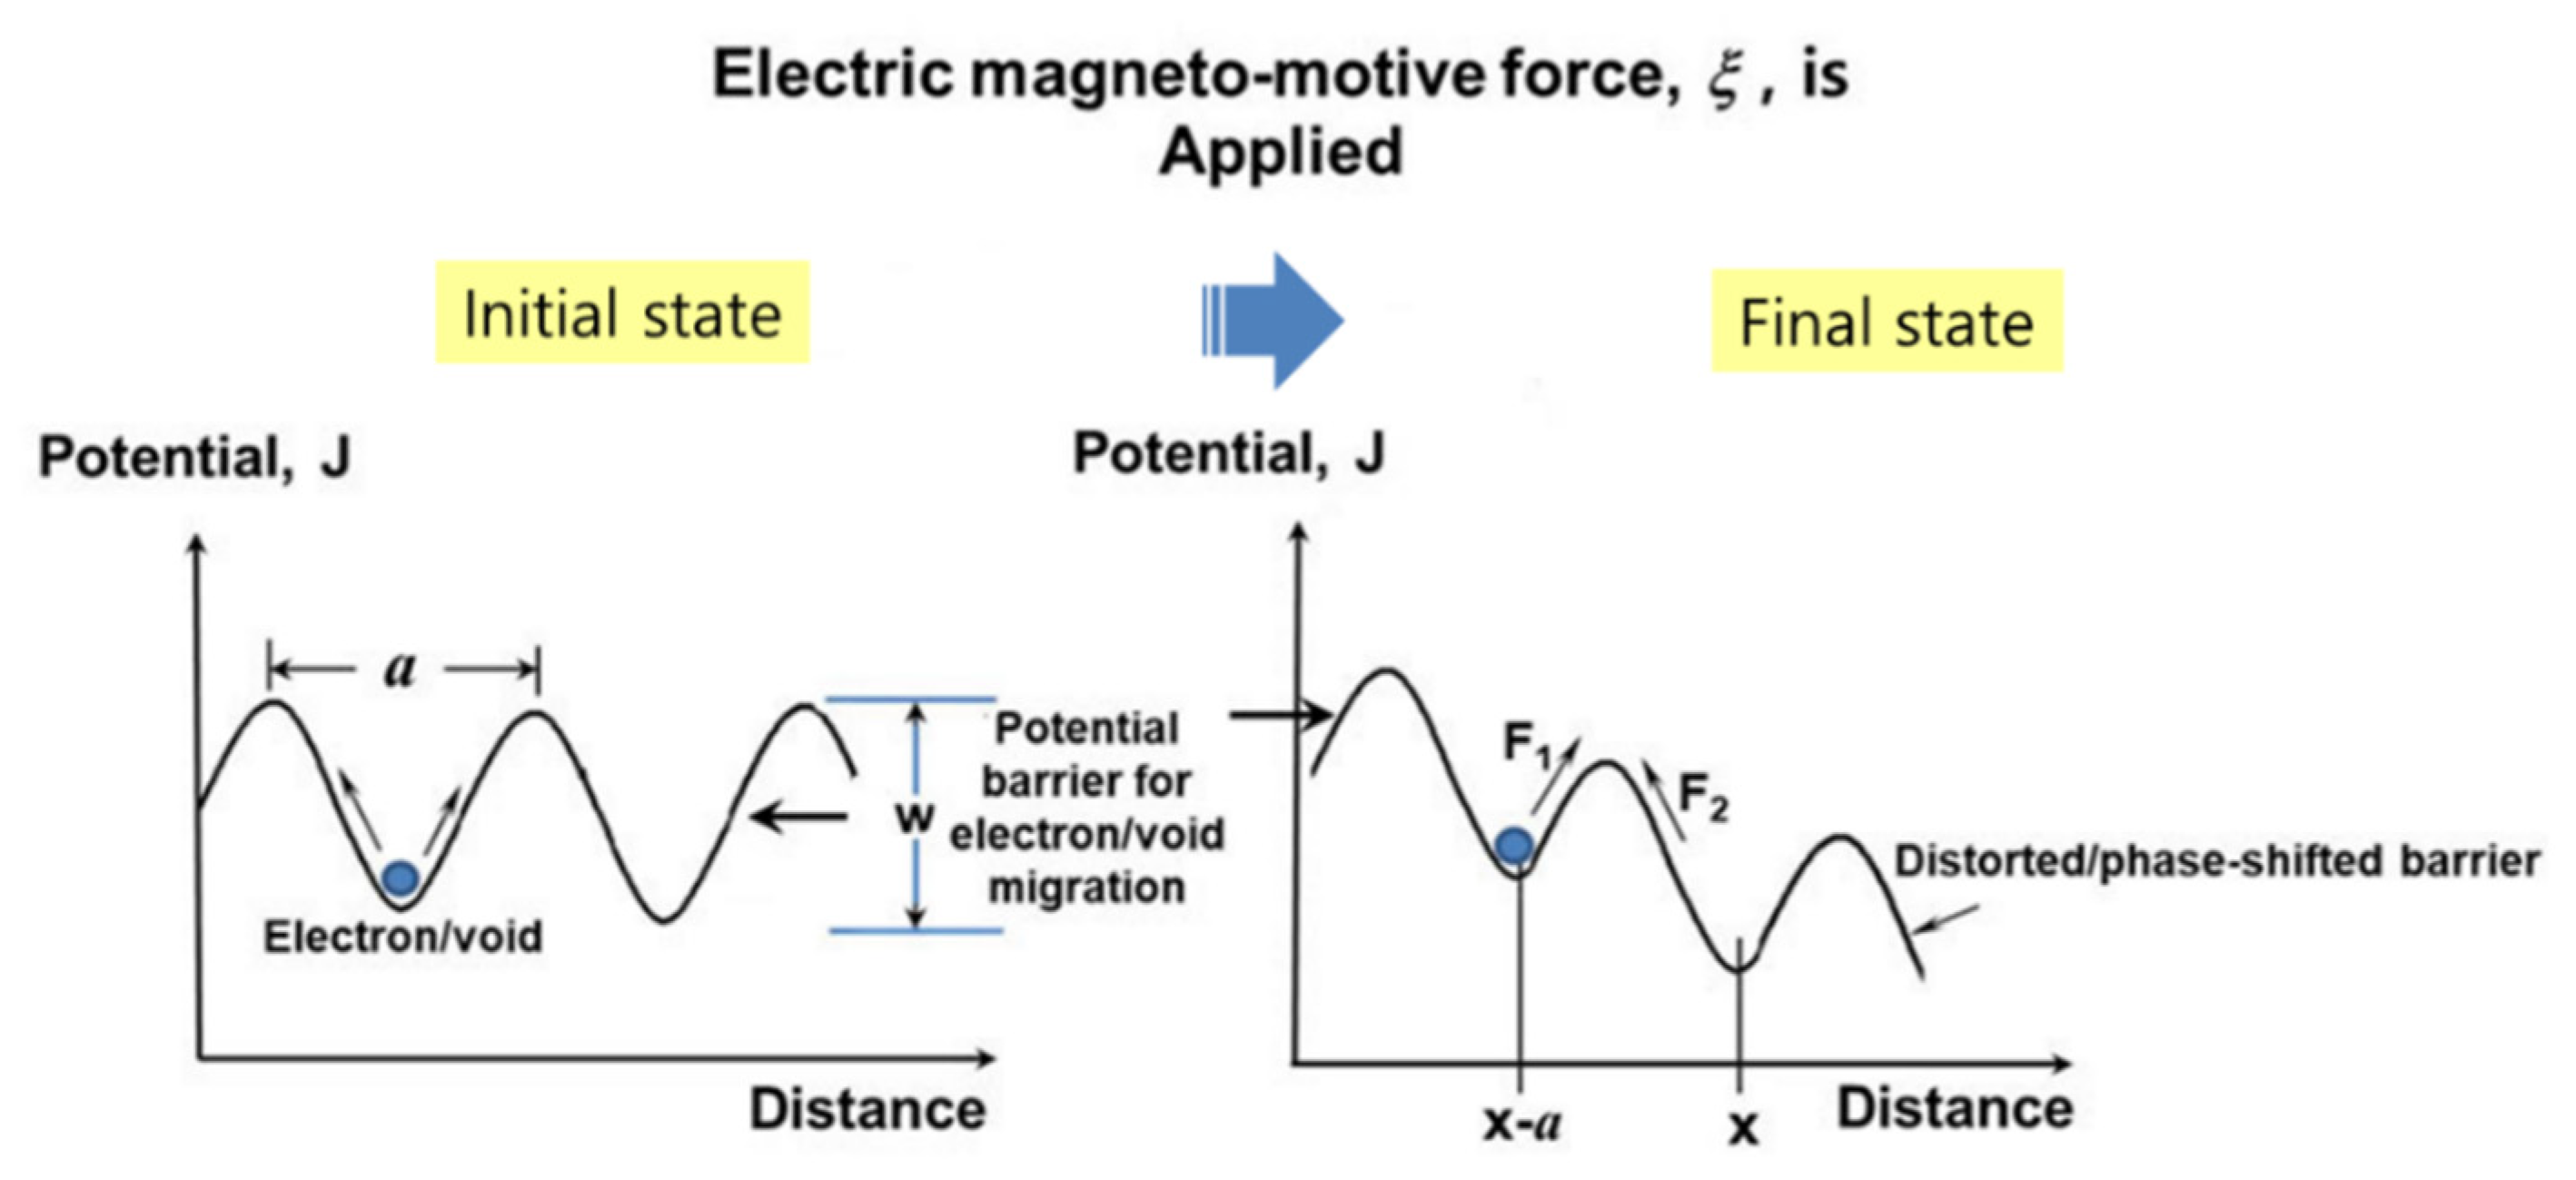
| ξ | Electrical field exerted |
| η | Characteristic life |
| λ | Cumulative damage exponent in Palmgren–Miner’s rule |
| χ2 | Chi-square distribution |
| α | Confidence level |
| νsuc | Specific volume of refrigerant at compressor suction, m3/kg |
| ρ | Refrigerant density, kg/m3 |
| ηv | Volumetric efficiency |
| ω | Angular velocity, rad/s |
| Superscripts | |
| β | Shape parameter in Weibull distribution |
| n | Stress dependence, |
| Subscripts | |
| 0 | Normal stress conditions |
| 1 | Accelerated stress conditions |
Appendix A. Derivation of Sample Size Equation for Parametric ALT
References
- Woo, S.; O’Neal, D.; Woldemichael, D.E.; Atnaw, S.M.; Tulu, M.M. Improving the Fatigue of Newly Designed Mechanical System Subjected to Repeated Impact Loading. Metals 2021, 11, 139. [Google Scholar] [CrossRef]
- CMMI Product Team. Capability Maturity Model Integration (CMMI) Version 2.0, Continuous Representation; Report CMU/SEI-2002-TR-011; Software Engineering Institute: Pittsburgh, PA, USA, 2018. [Google Scholar]
- Magaziner, I.C.; Patinkin, M. Cold competition: GE wages the refrigerator war. Harv. Bus. Rev. 1989, 89, 114–124. [Google Scholar]
- Rosa, J.L.; Robin, A.; Silva, M.B.; Baldan, C.A.; Peres, M.P. Electrodeposition of copper on titanium wires: Taguchi experimental design approach. J. Mater. Process. Technol. 2009, 209, 1181–1188. [Google Scholar] [CrossRef]
- Chowdhury, S.; Taguchi, S. Robust Optimization: World’s Best Practices for Developing Winning Vehicles, 1st ed.; John Wiley & Sons Inc.: Hoboken, NJ, USA, 2016. [Google Scholar]
- Allen, P. Design of Experiments for 21st Century Engineers, 1st ed.; Lulu Press: Morrisville, NC, USA, 2020. [Google Scholar]
- Duga, J.J.; Fisher, W.H.; Buxaum, R.W.; Rosenfield, A.R.; Buhr, A.R.; Honton, E.J.; McMillan, S.C. The Economic Effects of Fracture in the United States; Final Report; Available as NBS Special Publication 647-2; Battelle Laboratories: Columbus, OH, USA, 30 September 1982. [Google Scholar]
- Toribio, J.; Kharin, V.; Ayaso, F.J.; González, B.; Matos, J.C.; Vergara, D.; Lorenzoc, M. Failure analysis of a lifting platform for tree pruning. Eng. Fail. Anal. 2010, 17, 739–747. [Google Scholar] [CrossRef]
- Akama, M. Fatigue Crack Growth under Non-Proportional Mixed Mode Loading in Rail and Wheel Steel Part 1: Sequential Mode I and Mode II Loading. Appl. Sci. 2019, 9, 2866. [Google Scholar] [CrossRef] [Green Version]
- Fatigue. In Elements of Metallurgy and Engineering Alloys; Campbell, F.C. (Ed.) ASM International: Materials Park, OH, USA, 2008. [Google Scholar]
- Modarres, M.; Kaminskiy, M.; Krivtsov, V. Reliability Engineering and Risk Analysis: A Practical Guide, 3rd ed.; CRC Press: Boca Raton, FL, USA, 2016. [Google Scholar]
- Elsayed, E.A. Reliability Engineering; John Wiley & Sons: Hoboken, NJ, USA, 2012. [Google Scholar]
- Hahn, G.J.; Meeker, W.Q. How to Plan an Accelerated Life Test (E-Book); ASQ Quality Press: Milwaukee, WI, USA, 2004. [Google Scholar]
- McPherson, J. Accelerated testing. In Electronic Materials Handbook Volume 1: Packaging; ASM International Publishing: Materials Park, OH, USA, 1989; pp. 887–894. [Google Scholar]
- McPherson, J. Reliability Physics and Engineering: Time-to-Failure Modeling; Springer: New York, NY, USA, 2010. [Google Scholar]
- Griffith, A.A. The phenomena of rupture and flow in solids. Philos. Trans. R Soc. Lond. A 1921, 221, 163–198. [Google Scholar]
- Irwin, G. Analysis of stresses and strains near the end of a crack traversing a plate. J. Appl. Mech. 1957, 24, 361–364. [Google Scholar] [CrossRef]
- Anderson, T.L. Fracture Mechanics—Fundamentals and Applications, 3rd ed.; CRC: Boca Raton, FL, USA, 2017. [Google Scholar]
- ASTM E606/E606M. Standard Test Method for Strain-Controlled Fatigue Testing; ASTM International: West Conshohocken, PA, USA, 2019. [Google Scholar]
- ASTM E399. Standard Test Method for Linear-Elastic Plane-Strain Fracture Toughness of Metallic Materials; ASTM International: West Conshohocken, PA, USA, 2020. [Google Scholar]
- ASTM E647. Standard Test Method for Measurement of Fatigue Crack Growth Rates; ASTM International: West Conshohocken, PA, USA, 2015. [Google Scholar]
- ASTM E739-10. Standard Practice for Statistical Analysis of Linear or Linearized Stress-Life (S-N) and Strain-Life (ε-N) Fatigue Data; ASTM International: West Conshohocken, PA, USA, 2015. [Google Scholar]
- Braco, R.; Prates, P.; Costa, J.D.M.; Berto, F. New methodology of fatigue life evaluation for multiaxially loaded notched components based on two uniaxial strain-controlled tests. Int. J. Fatigue 2018, 111, 308–320. [Google Scholar] [CrossRef]
- Weingart, R.G.; Stephen, P. Timoshenko: Father of Engineering Mechanics in the U.S. Structure Magazine, August 2007. [Google Scholar]
- Sánchez, M.; Cicero, S.; Arroyo, B.; Álvarez, J.A. Coupling Finite Element Analysis and the Theory of Critical Distances to Estimate Critical Loads in Al6060-T66 Tubular Beams Containing Notches. Metals 2020, 10, 1395. [Google Scholar] [CrossRef]
- Li, Q.; Xie, L. Analysis and Optimization of Tooth Surface Contact Stress of Gears with Tooth Profile Deviations, Meshing Errors and Lead Crowning Modifications Based on Finite Element Method and Taguchi Method. Metals 2020, 10, 1370. [Google Scholar] [CrossRef]
- Hertzberg, R.W.; Vinci, R.P.; Hertzberg, J.L. Deformation and Fracture Mechanics of Engineering Materials, 6th ed.; John Wiley and Sons Inc.: Hoboken, NJ, USA, 2020. [Google Scholar]
- Zupančič, B.; Prokop, Y.; Nikonov, A. FEM analysis of dispersive elastic waves in three-layered composite plates with high contrast properties. Finite Elem. Anal. Des. 2021, 193, 103553. [Google Scholar] [CrossRef]
- IEEE Standard Glossary of Software Engineering Terminology. IEEE STD 610.12-1990. Standards Coordinating Committee of the Computer Society of IEEE. (reaffirmed September 2002). Available online: https://ieeexplore.ieee.org/document/159342 (accessed on 31 December 2020).
- Kreyszig, E. Advanced Engineering Mathematics, 10th ed.; John Wiley and Son: Hoboken, NJ, USA, 2011; p. 683. [Google Scholar]
- Grove, A. Physics and Technology of Semiconductor Device, 1st ed.; Wiley International Edition: New York, NY, USA, 1967; p. 37. [Google Scholar]
- Minges, M.L. Electronic Materials Handbook; ASM International: Cleveland, OH, USA, 1989; Volume 1, p. 888. [Google Scholar]
- Karnopp, D.C.; Margolis, D.L.; Rosenberg, R.C. System Dynamics: Modeling, Simulation, and Control of Mechatronic Systems, 6th ed.; John Wiley & Sons: New York, NY, USA, 2012. [Google Scholar]
- Whitesel, H.A. Capillary two-phase flow Part II. Refrig. Eng. 1957, 65, 35–40. [Google Scholar]
- Abernethy, R.B. The New Weibull Handbook; Reliability Analysis Center: North Palm Beach, FL, USA, 2000; pp. 1–310. [Google Scholar]


| Modules | Field Data | Expected Reliability | Aimed Reliability | |||||
|---|---|---|---|---|---|---|---|---|
| Failure Rate per Year, %/Year | BX Life, Year | Failure Rate per Year, %/Year | BX Life, Year | Failure Rate per Year, %/Year | BX Life, Year | |||
| A | 0.35 | 2.9 | Similar | ×1 | 0.35 | 2.9 | 0.10 | 10(BX = 1.0) |
| B | 0.24 | 4.2 | New | ×5 | 1.20 | 0.83 | 0.10 | 10(BX = 1.0) |
| C | 0.30 | 3.3 | Similar | ×1 | 0.30 | 3.33 | 0.10 | 10(BX = 1.0) |
| D | 0.31 | 3.2 | Altered | ×2 | 0.62 | 1.61 | 0.10 | 10(BX = 1.0) |
| E | 0.15 | 6.7 | Altered | ×2 | 0.30 | 3.33 | 0.10 | 10(BX = 1.0) |
| Others | 0.50 | 10.0 | Similar | ×1 | 0.50 | 10.0 | 0.50 | 10(BX = 5.0) |
| Product | 1.9 | 2.9 | - | - | 3.27 | 0.83 | 1.00 | 10(BX = 10) |
| System | Effort, e(t) | Flow, f(t) |
|---|---|---|
| Translation system | Force, F(t) | Velocity, V(t) |
| Rotation system | Torque, τ(t) | Angular velocity, ω(t) |
| Pump, compressor | Pressure difference, ΔP(t) | Volume flow rate, Q(t) |
| Electric system | Voltage, V(t) | Current, i(t) |
| Magnetic | Magneto-motive force, em | Magnetic flux, φ |
| System States | Worst Case | ALT | AF | |
|---|---|---|---|---|
| Pressure (MPa) | High-side Low-side ΔP | 1.27 0.0 1.27 | 2.94 0.0 2.94 | 5.36 ① - - |
| Temperature (°C) | Dome | 90 | 120 | 1.37 ② |
| Total AF (=(① × ②)) | - | - | - | 7.32 |
| Parametric ALT | First ALT | Second ALT | Third ALT |
|---|---|---|---|
| Original Design | Design | Final Design | |
| In 49,000 cycles, there are no issues in the compressor | 3500 cycles: 1/100 locking 7500 cycles: 1/100 broken suction reed valve | 17,000 cycles: 3/100 locking | 49,000 cycles: 100/100 OK |
| Structure | 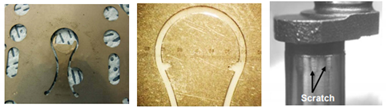 | ||
| Action plans | C1: Trepan size: 0.73 mm→1.25 mm C2: attaching ball peening and brush process C3: SANDVIK 20C: 0.178 t→0.203 t C4: expanding tumbling: 4 h→14 h | C5: FCD500 + no heat treatment → FCD500 + heat treatment on the crankshaft | |
Publisher’s Note: MDPI stays neutral with regard to jurisdictional claims in published maps and institutional affiliations. |
© 2021 by the authors. Licensee MDPI, Basel, Switzerland. This article is an open access article distributed under the terms and conditions of the Creative Commons Attribution (CC BY) license (https://creativecommons.org/licenses/by/4.0/).
Share and Cite
Woo, S.; O’Neal, D.L. Reliability Design of Mechanical Systems Such as Compressor Subjected to Repetitive Stresses. Metals 2021, 11, 1261. https://doi.org/10.3390/met11081261
Woo S, O’Neal DL. Reliability Design of Mechanical Systems Such as Compressor Subjected to Repetitive Stresses. Metals. 2021; 11(8):1261. https://doi.org/10.3390/met11081261
Chicago/Turabian StyleWoo, Seongwoo, and Dennis L. O’Neal. 2021. "Reliability Design of Mechanical Systems Such as Compressor Subjected to Repetitive Stresses" Metals 11, no. 8: 1261. https://doi.org/10.3390/met11081261
APA StyleWoo, S., & O’Neal, D. L. (2021). Reliability Design of Mechanical Systems Such as Compressor Subjected to Repetitive Stresses. Metals, 11(8), 1261. https://doi.org/10.3390/met11081261