Abstract
Recent years witnessed progressive broadening of the practical use of 3D-printed aluminium alloy parts, in particular for specific aerospace applications where weight saving is of great importance. Selective laser melting (SLM) is an intrinsically multi-parametric fabrication technology that offers multiple means of controlling mechanical properties (elastic moduli, yield strength, and ductility) through the control over grains size, shape, and orientation. Targeted control over mechanical properties is achieved through the tuning of 3D-printing parameters and may even obviate the need of heat treatment or mechanical post-processing. Systematic studies of grain structure for different printing orientations with the help of EBSD techniques in combination with mechanical testing at different dimensional levels are the necessary first steps to implement this agenda. Samples of 3D-printable Al-Mg-Si RS-333 alloy were fabricated in three orientations with respect to the principal build direction and the fast laser beam scanning direction. Sample structure and proper-ties were investigated using a number of techniques, including EBSD, in situ SEM tensile testing, roughness measurements, and nanoindentation. The as-printed samples were found to display strong variation in Young’s modulus values from nanoindentation (from 43 to 66 GPa) and tensile tests (from 54 to 75 GPa), yield stress and ultimate tensile strength (100–195 and 130–220 MPa) in different printing orientations, and almost constant hardness of about 0.8 GPa. A further preliminary study was conducted to assess the effect of surface finishing on the mechanical performance. Surface polishing was seen to reduce Young’s modulus and yield strength but improves ductility, whereas the influence of sandblasting was found to be more controversial. The experimental results are discussed in connection with the grain morphology and orientation.
1. Introduction
SLM 3D-printing of metallic materials is a technological process that initially emerged in the early 2000s as a route for rapid prototyping. Currently, it has evolved into a mass-production method for the fabrication of highly demanding parts with complex shapes [1,2,3]. Three-dimensionally printable Ti, Ni, and Al alloys are progressively finding applications in the aerospace domain where weight saving issues are of great importance: gas turbine engine components [4,5], fuselage structural elements [6], etc. The 3DP Al alloy RS-333 has been used recently for the SLM fabrication of thermoregulatory casing of a gamma-ray detector mounted on a Yarilo satellite [6].
SLM 3D-printing is a flexibly controlled fabrication technique that is affected by the material composition and multiple process parameters (laser power density, scan speed, layer thickness, etc.) These disparate factors interact in a complex manner and lead to the emergence of various hierarchical microstructures with specific characteristics, e.g., arrangement and size of grains, grain boundaries, pores, and reinforcing phase particles. Numerous studies have been reported of the correlation between the fabrication parameters (laser wavelength and power, scanning rate and path width and overlap, growth direction with respect to the sample shape, design of supports, and many others), on the one hand, and internal structure and mechanical and functional properties for many metallic materials [7,8,9,10], specifically for Al alloys [11,12,13], on the other. Elongated columnar crystallites and equiaxed grains appear to be the pre-dominant structural elements in 3D-printed metals at the dimensional level of 10–300 μm [14]. The more detailed particulars of the grain patterns (grain size, grain aspect ratio, and their crystallographic orientations with respect to the outer surfaces of the component) are likely to be governed by local solidification conditions in the presence of directional heat flux and associated thermal gradients. It has also been noted that the mechanical properties such as elastic moduli and yield strength vary significantly depending on the relationship between the loading direction and the principal growth direction during printing, the fast scanning direction, etc.
We recently reported [13] a study of the mechanical performance of 3D-printed RS-333 Al-alloy parts and interpreted the variation of mechanical response in tension in terms of the different cooling conditions during printing (namely, the local time-temperature variation due to secondary re-heating of elementary volumes due to the deposition of subsequent layers above), which in turn affects the aging of the oversaturated solid solution obtained after printing. However, the grain pattern within the polycrystal aggregate was not studied in detail, although it was noted that the impact of this factor is likely to be significant.
In the present article, we report a systematic EBSD study of the grain structure in 3D-printed RS-333 Al–Mg–Si alloy samples produced using different printing orientation and the establishment of a correlation with the results of mechanical property characterization using in-SEM tensile mechanical testing and nanoindentation. The strong influence of the grain assembly orientation is demonstrated with respect to the load direction on the overall mechanical performance. Additionally, the effect of surface finish quality is also investigated. We also discuss the possibility of grain growth control through accurate tuning of the thermal gradients and associated heat flux. The purposeful tuning of SLM process parameters in the course of a single printing process offers hitherto untapped opportunities for the fabrication of structural components with grain structure and properties that vary in the 3D component volume by design to deliver optimal mechanical performance.
When seen within a broad context, the approach explored in the current article belongs to the broad paradigm of optimal design for additive manufacturing. The underlying hypothesis of this approach is that achieving peak performance of the product produced by 3D-printing requires taking into consideration all relevant aspects, from alloy composition to process parameters to printing sequence and orientation. Additionally, the internal states of deformation and stress need to be taken into account, since they affect the overall sample mechanical response.
2. Materials and Methods
2.1. Samples Preparation
RS-333 (Al-3Si-0.5Mg) powder alloy supplied by Valcom-PM Ltd. (Volgograd, Russia) was used to SLM print flat dog-bone samples having gauge zone with the nominal length × width × thickness dimensions as 10 × 4 × 1 mm3 under argon atmosphere using an EOS M290 SLM printer (EOS GmbH, Maisach, Germany) equipped with a 400 W Yb-fibre laser. The details of printing and post-printing heat treatment procedures and sample geometry are given in our previous report [13].
Three sets of three samples had ZX, XZ, and XY orientations with their main gauge axes in the direction corresponding to the fast (X) and slow (Y) laser scanning directions and to the growth axis (Z). In our notation, the first character corresponds to the printing direction aligned along a main gauge axis while the second is connected to the axis aligned with gauge width.
The printing supports used during printing were mechanically machined off to obtain samples of nominal dimensions. A set of standard ascending numbers of sandpaper and ultimately diamond paste were used for mechanical polishing of the selected samples.
The sand-blasting treatment was carried out using SiO2 with a mesh of +40/−80 microns. The average pressure of the air system was 7 bar, and the time for sandblasting was 15 s for each surface.
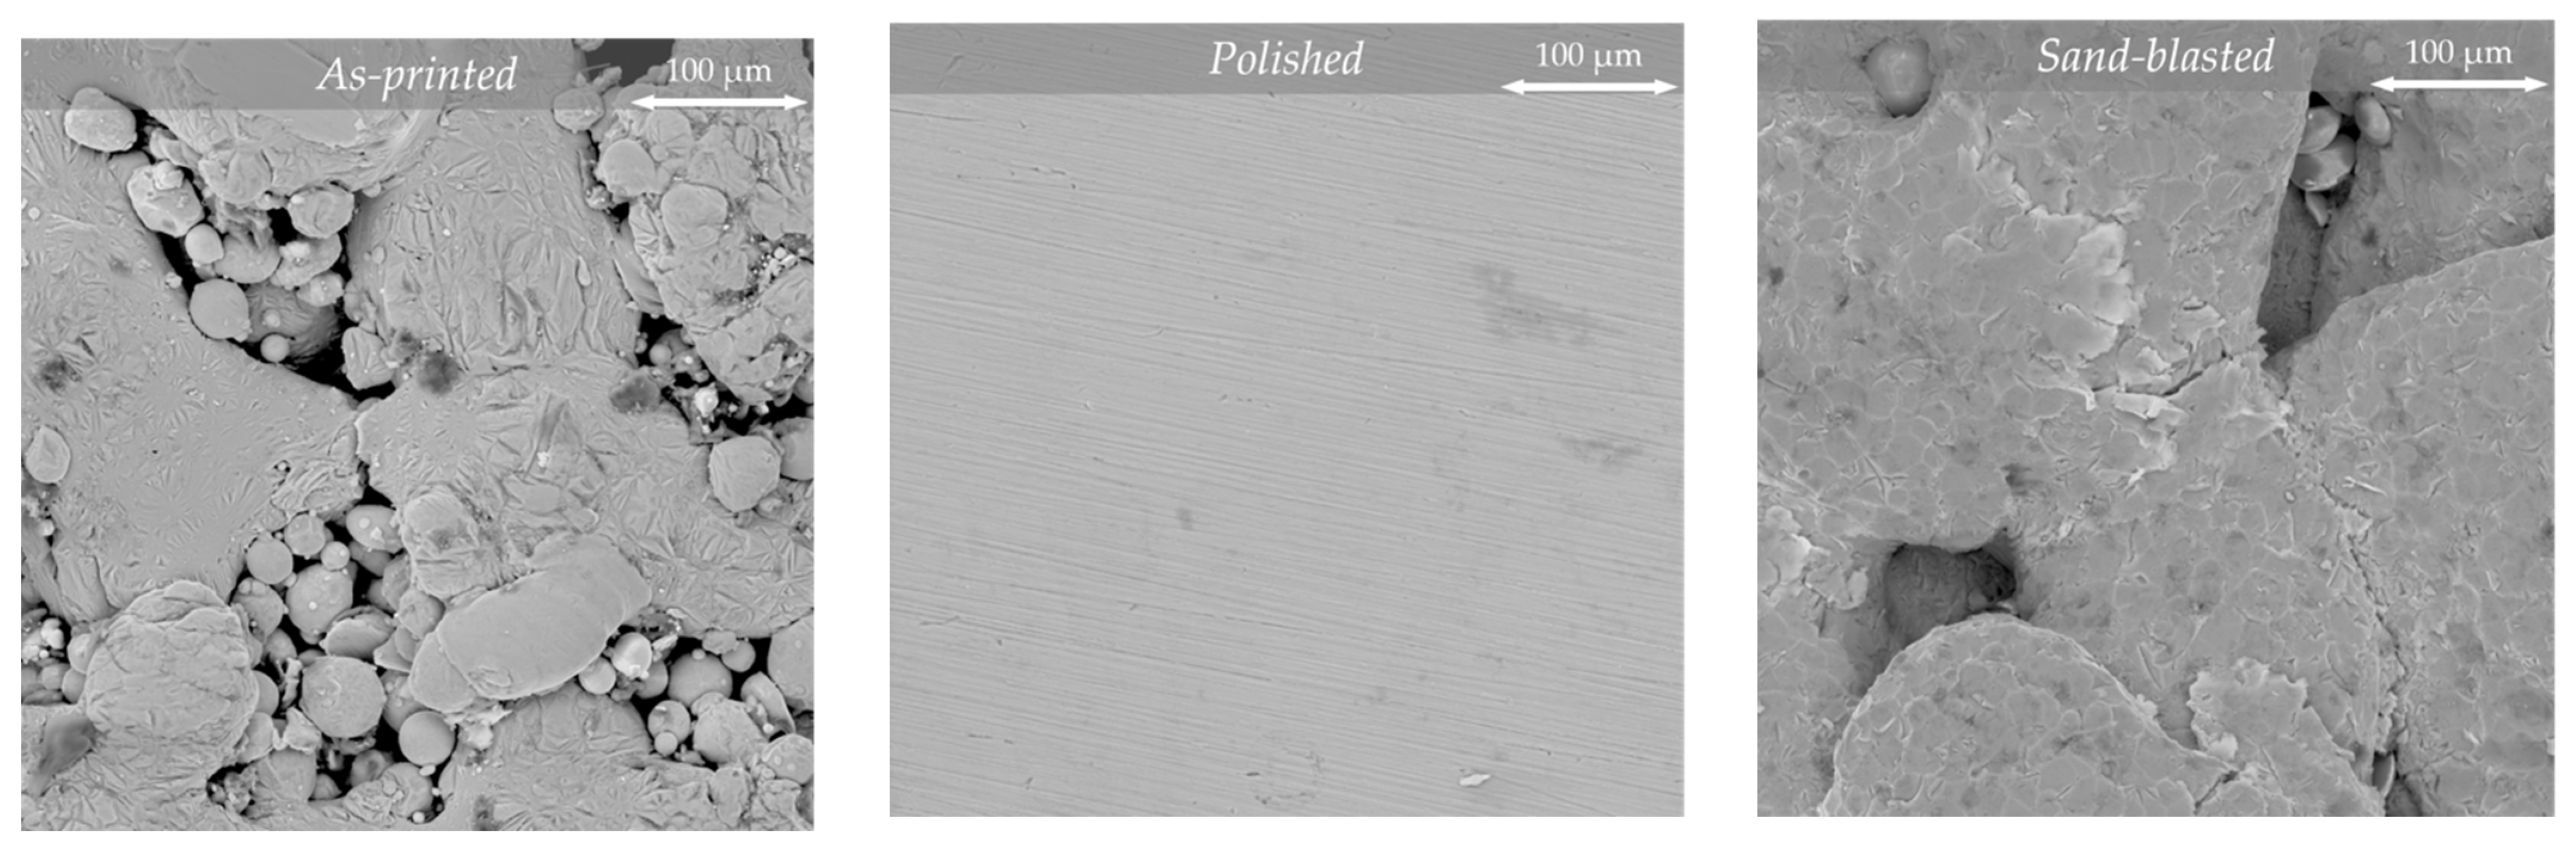
In Figure 1, the general appearance of as-printed, polished, and sand-blasted samples is illustrated. A substitutional difference of surface appearance is clearly seen and, surprisingly, some coarsening of surface clusters is present and smashed features appear after sand blasting. It is apparent from Figure 1 that sand basting is effective at cleaning the space between coarse (200–500 μm) metal agglomerates from fine, partially melted powder particles. These surface agglomerates form uneven rough structure with numerous discontinuities running along the surface plane that appear to be most detrimental for XZ orientation. In this orientation, grain boundaries of elongated crystallites are perpendicular to load direction and interact with the surface discontinuities to cause the observed embrittlement effect. Overall, sandblasting without further surface finishing was found to degrade both sample strength and elongation to failure [15].

Figure 1.
General appearance of as-printed, polished, and sand-blasted samples.
2.2. Electron Back Scatter Diffraction (EBSD)
Since EBSD and nanoindentation measurements are very dependent on the surface quality and the morphology, samples must be carefully prepared before investigation. Each sample was cut out, next embedded in epoxy resin, and polished using standard metallographic techniques. Polishing was performed using sandpaper in several steps (220, 500, 1000, 2000, and 4000 grit) and then using diamond suspensions (average particles diameter 1–3 µm) and colloidal silica. The final step of polishing was broad beam ion milling performed in a Technoorg Linda SEMPrep2 (Technoorg Linda Co. Ltd., Budapest, Hungary) using 8 kV for 15 min with the 4° stage tilt. After a final cleaning, the mounted sample was fixed in a metallographic mount holder to avoid image drift during the scanning process.
The surface quality was checked by optical profilometer of NanoScan4D system (FSBI TISNCM, Troitsk, Russia). The roughness was 346 nm, which is considered acceptable for future measurements. The general view of the prepared surface with corresponding roughness profile is shown in Figure 2.
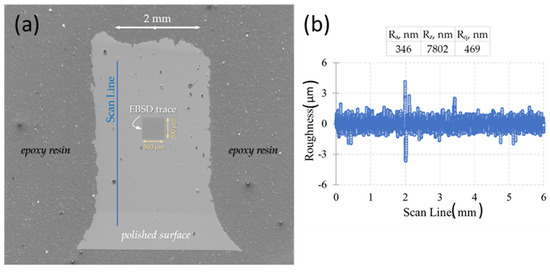
Figure 2.
General view of a polished surface for EBSD and nanoindentation measurements (a) and roughness estimation for the indicated scan line (b).
The texture was measured in a Scanning Electron Microscope (SEM) Tescan Vega3 (Tescan Orsay Holding, Brno, Czech Republic) using an Oxford Instruments NordlysNano EBSD detector (Oxford Instruments NanoAnalysis and Asylum Research, High Wycombe, UK). Measuring area was 500 µm2 with step size 1 µm, acceleration voltage 20 kV, and beam current 10 nA.
2.3. Nanoindentation
The nanoindentation test was performed for each orientation of polished specimens that were called the cross section (perpendicular to main gauge axis, width × thickness, 4 × 1 mm × mm), side (parallel to main gauge axis, length × thickness, 10 × 1 mm × mm), and surface sections (parallel to main gauge axis, length × width, 10 × 4 mm × mm). The grid was 10 × 5 indents with X-step 200 μm and Y-step 75 μm along the grain growth direction. The indentation parameters were the following: depth-control mode, penetration depth 1.5 μm, load time 10 s, hold time 60 s, and free unloading.
The post-processing technique was carried out according to the typical Oliver and Pharr methodology [16]. However, the achieved results showed high elastic modulus values (~100 GPa) and hardness (~2 GPa). It is well-known that Oliver and Pharr’s model does not consider the impact of “heaps” (surplus material after indentation) formed around the indent. Therefore, the E/H values for highly ductile materials may differ from those obtained with a tensile testing machine or a microindentation test. In this case, “highly ductile” roughly means a large E/H ratio (more than ~20) and refers to a small index of hardening.
In order to improve this model and to obtain reasonable values, there are at least two approaches. The first one [17] connects the discrepancy with the presence of plastic region on the unloading curve of aluminium. The authors corrected this phenomenon with the repeated loading and achieved an elastic modulus of ~70 GPa for the pure aluminium plate. In another article [18], the authors proposed calculating the work under the indentation curve and make corrections.
In this article, we chose the second approach based on the work-of-indentation correction. The reduced elastic modulus was calculated via the formula
where is elastic work;
is plastic work;
when and when ;
is coefficient taken from FEA analysis;
is only dependent on Poisson’s ratio;
is maximum load during test;
is stiffness; and
is reduced elastic modulus.
Since parameters , , , and can be taken from the experimental data (indentation curves), the reduced elastic modulus was determined. The material elastic modulus was recalculated according to the formula
where are elastic modulus and Poisson’s ratio of investigated material, respectively; are the indenter parameters (device passport data).
The relationship between hardness and reduced elastic modulus was expressed similarly to the formula below. It is based on numerical simulations under a perfectly rigid indenter.
The above formula is attractive since it allows for hardness calculations without determining the contact area, which often requires calibration of the indentation test to take into account the influence of specific tip shape.
2.4. Tensile Test
In-SEM mechanical testing is a growing experimental technique based on in situ and operando principles. A Deben Microtest 1-kN testing stage (Deben UK Ltd., Woolpit, UK) was accommodated by the chamber of a Tescan Vega 3 SEM and connected with power and information cable to a computer-controlled operation block using a plug inserted to a through-flange plug. This facilitates the operation of the testing stage that synchronises the mechanical loading (tension at permanent crosshead speed of 0.2 mm/min) with the acquisition of SEM images at the rate of 22 s per image in the secondary electron (SE) regime using 30 kV voltage and beam spot size of 400 nm [13].
Digital image correlation (DIC) analysis was applied to retrieve the data on true strains in the region of interest: ~80% of the gauge zone. The DIC algorithm searches for the corresponding pairs of pixel subsets (arrays containing digitalised intensity values) to find the best match in two digital images. When the centre positions of corresponding pixel subsets are identified, the displacement and strains (after the differentiation of displacements) can be calculated. The open-source Matlab-based software Ncorr v.1.2.2 [19] was utilized to analyse the datasets of acquired SEM images and to calculate average values of displacement and strain with subpixel resolution in the region of interest.
3. Results and Discussion
3.1. Grain Pattern Appearance in 3D-Printed RS-333 Alloy
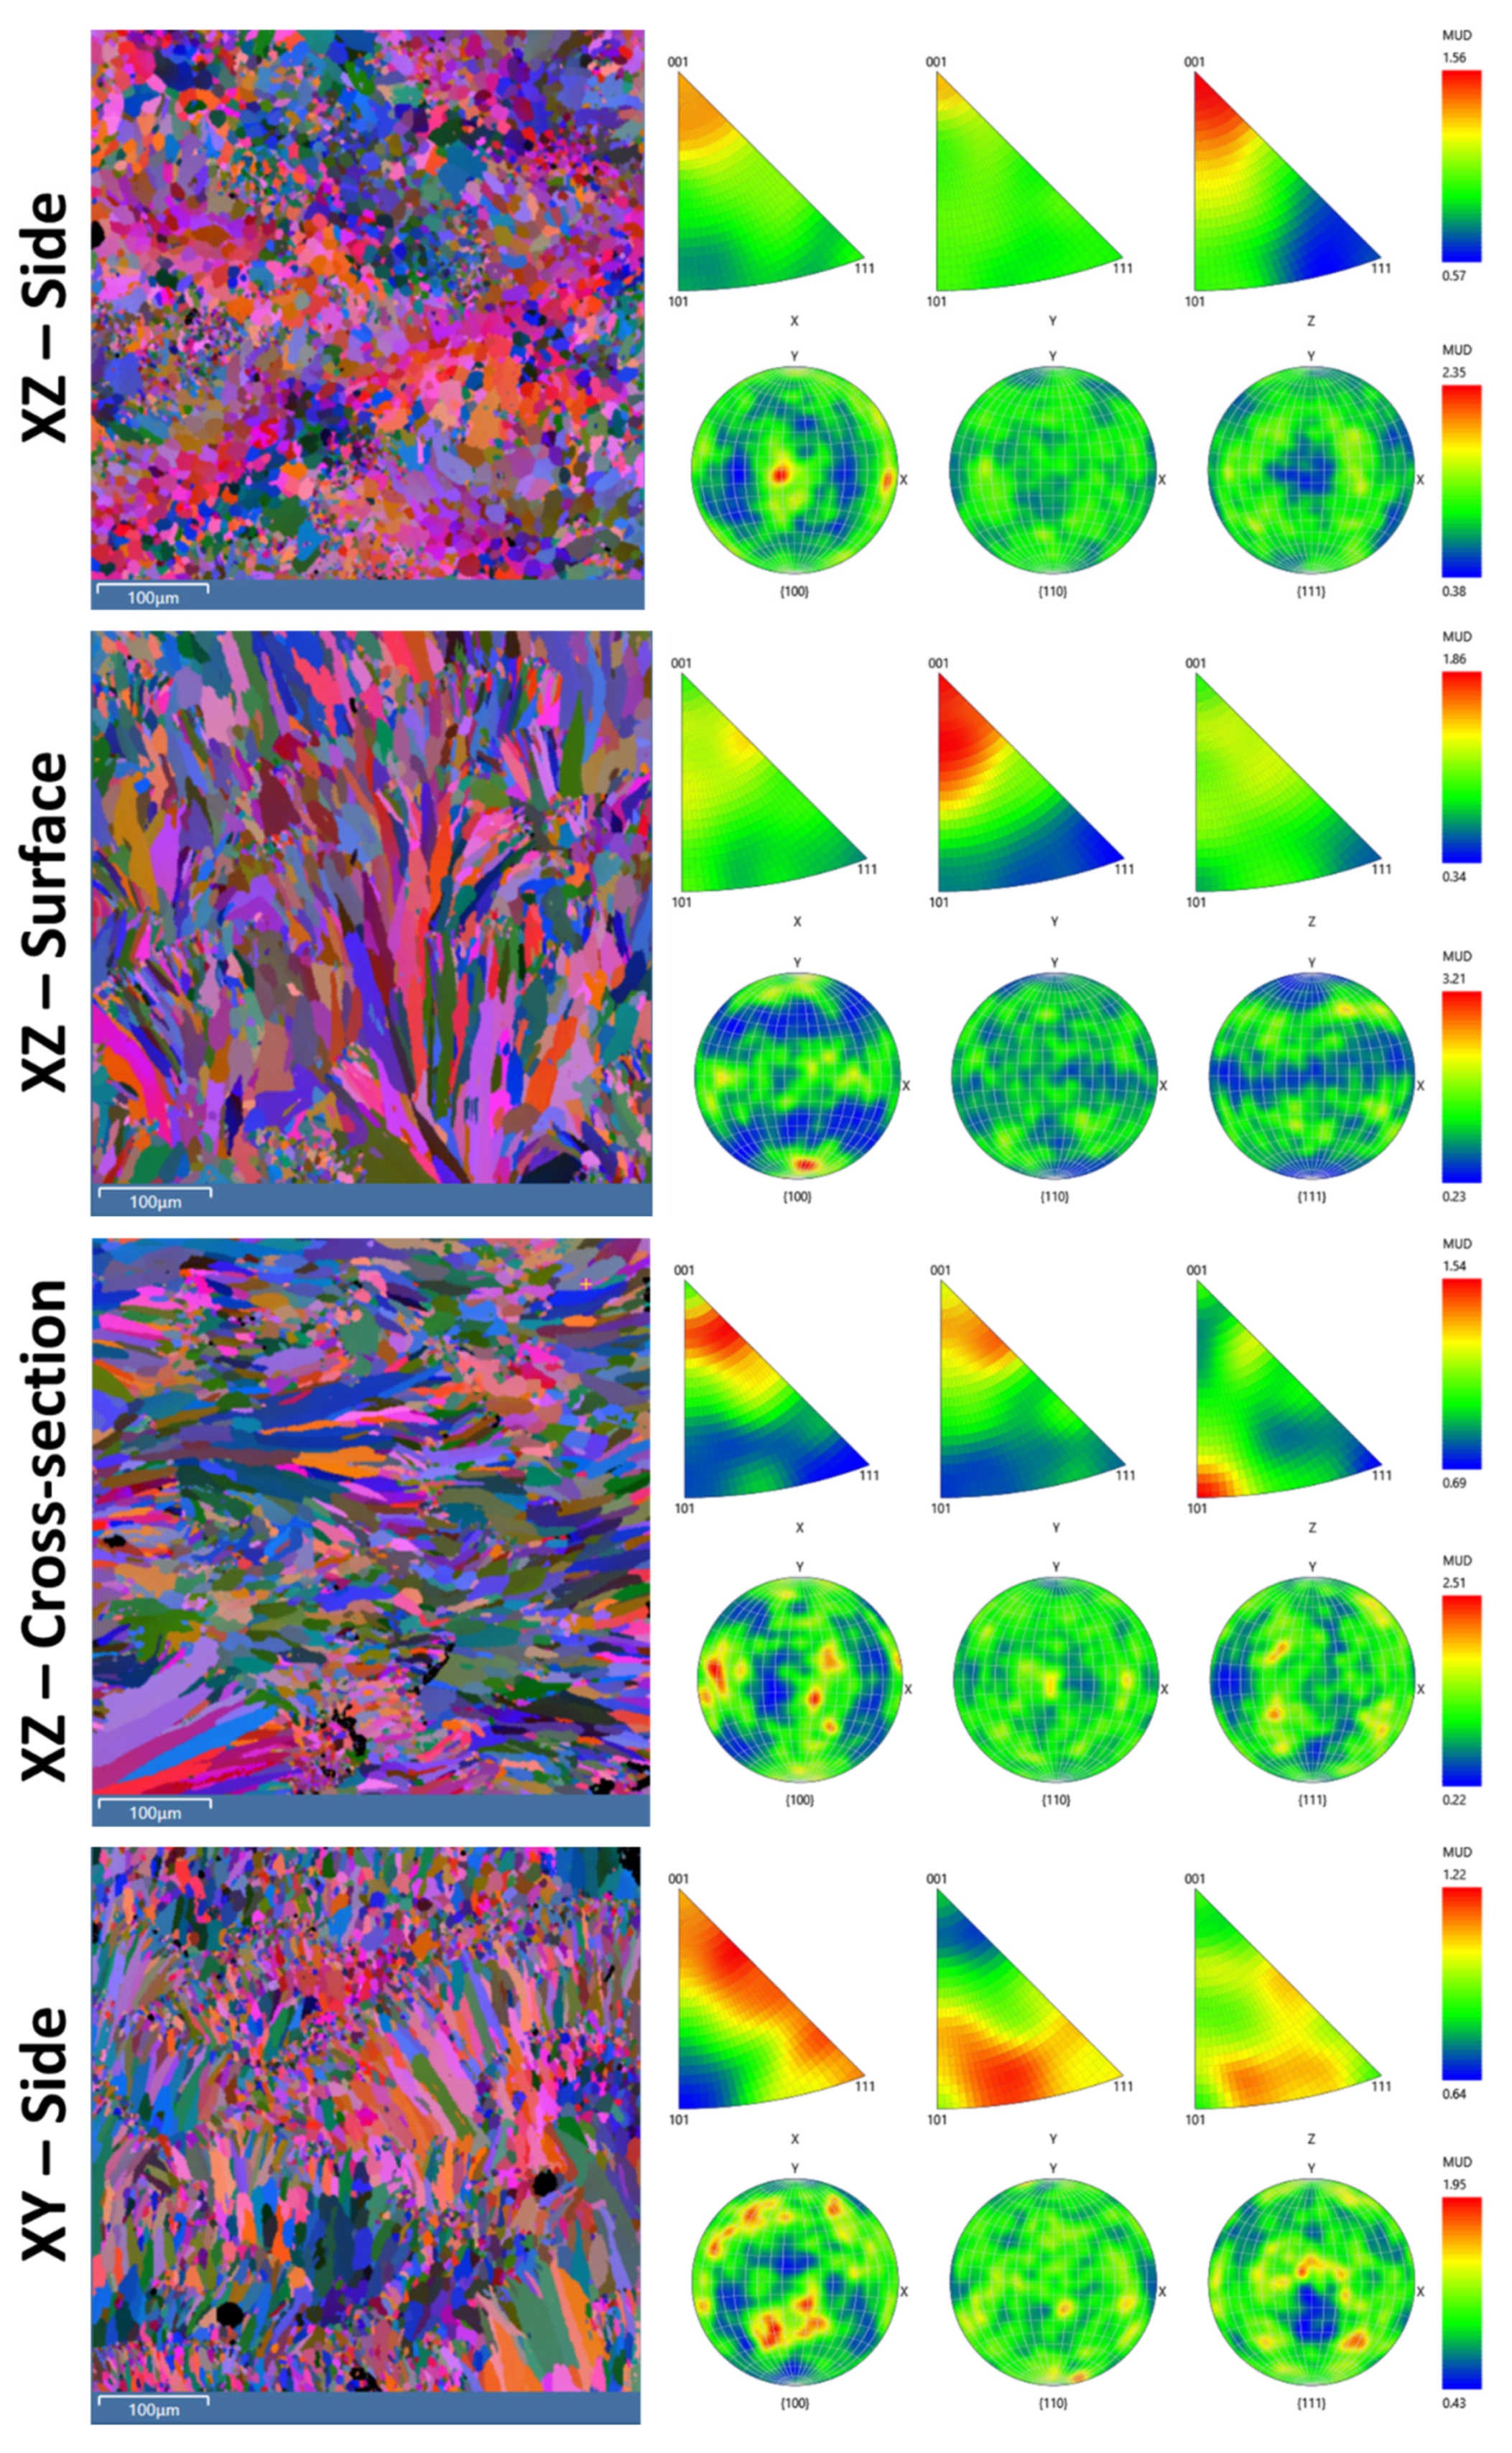
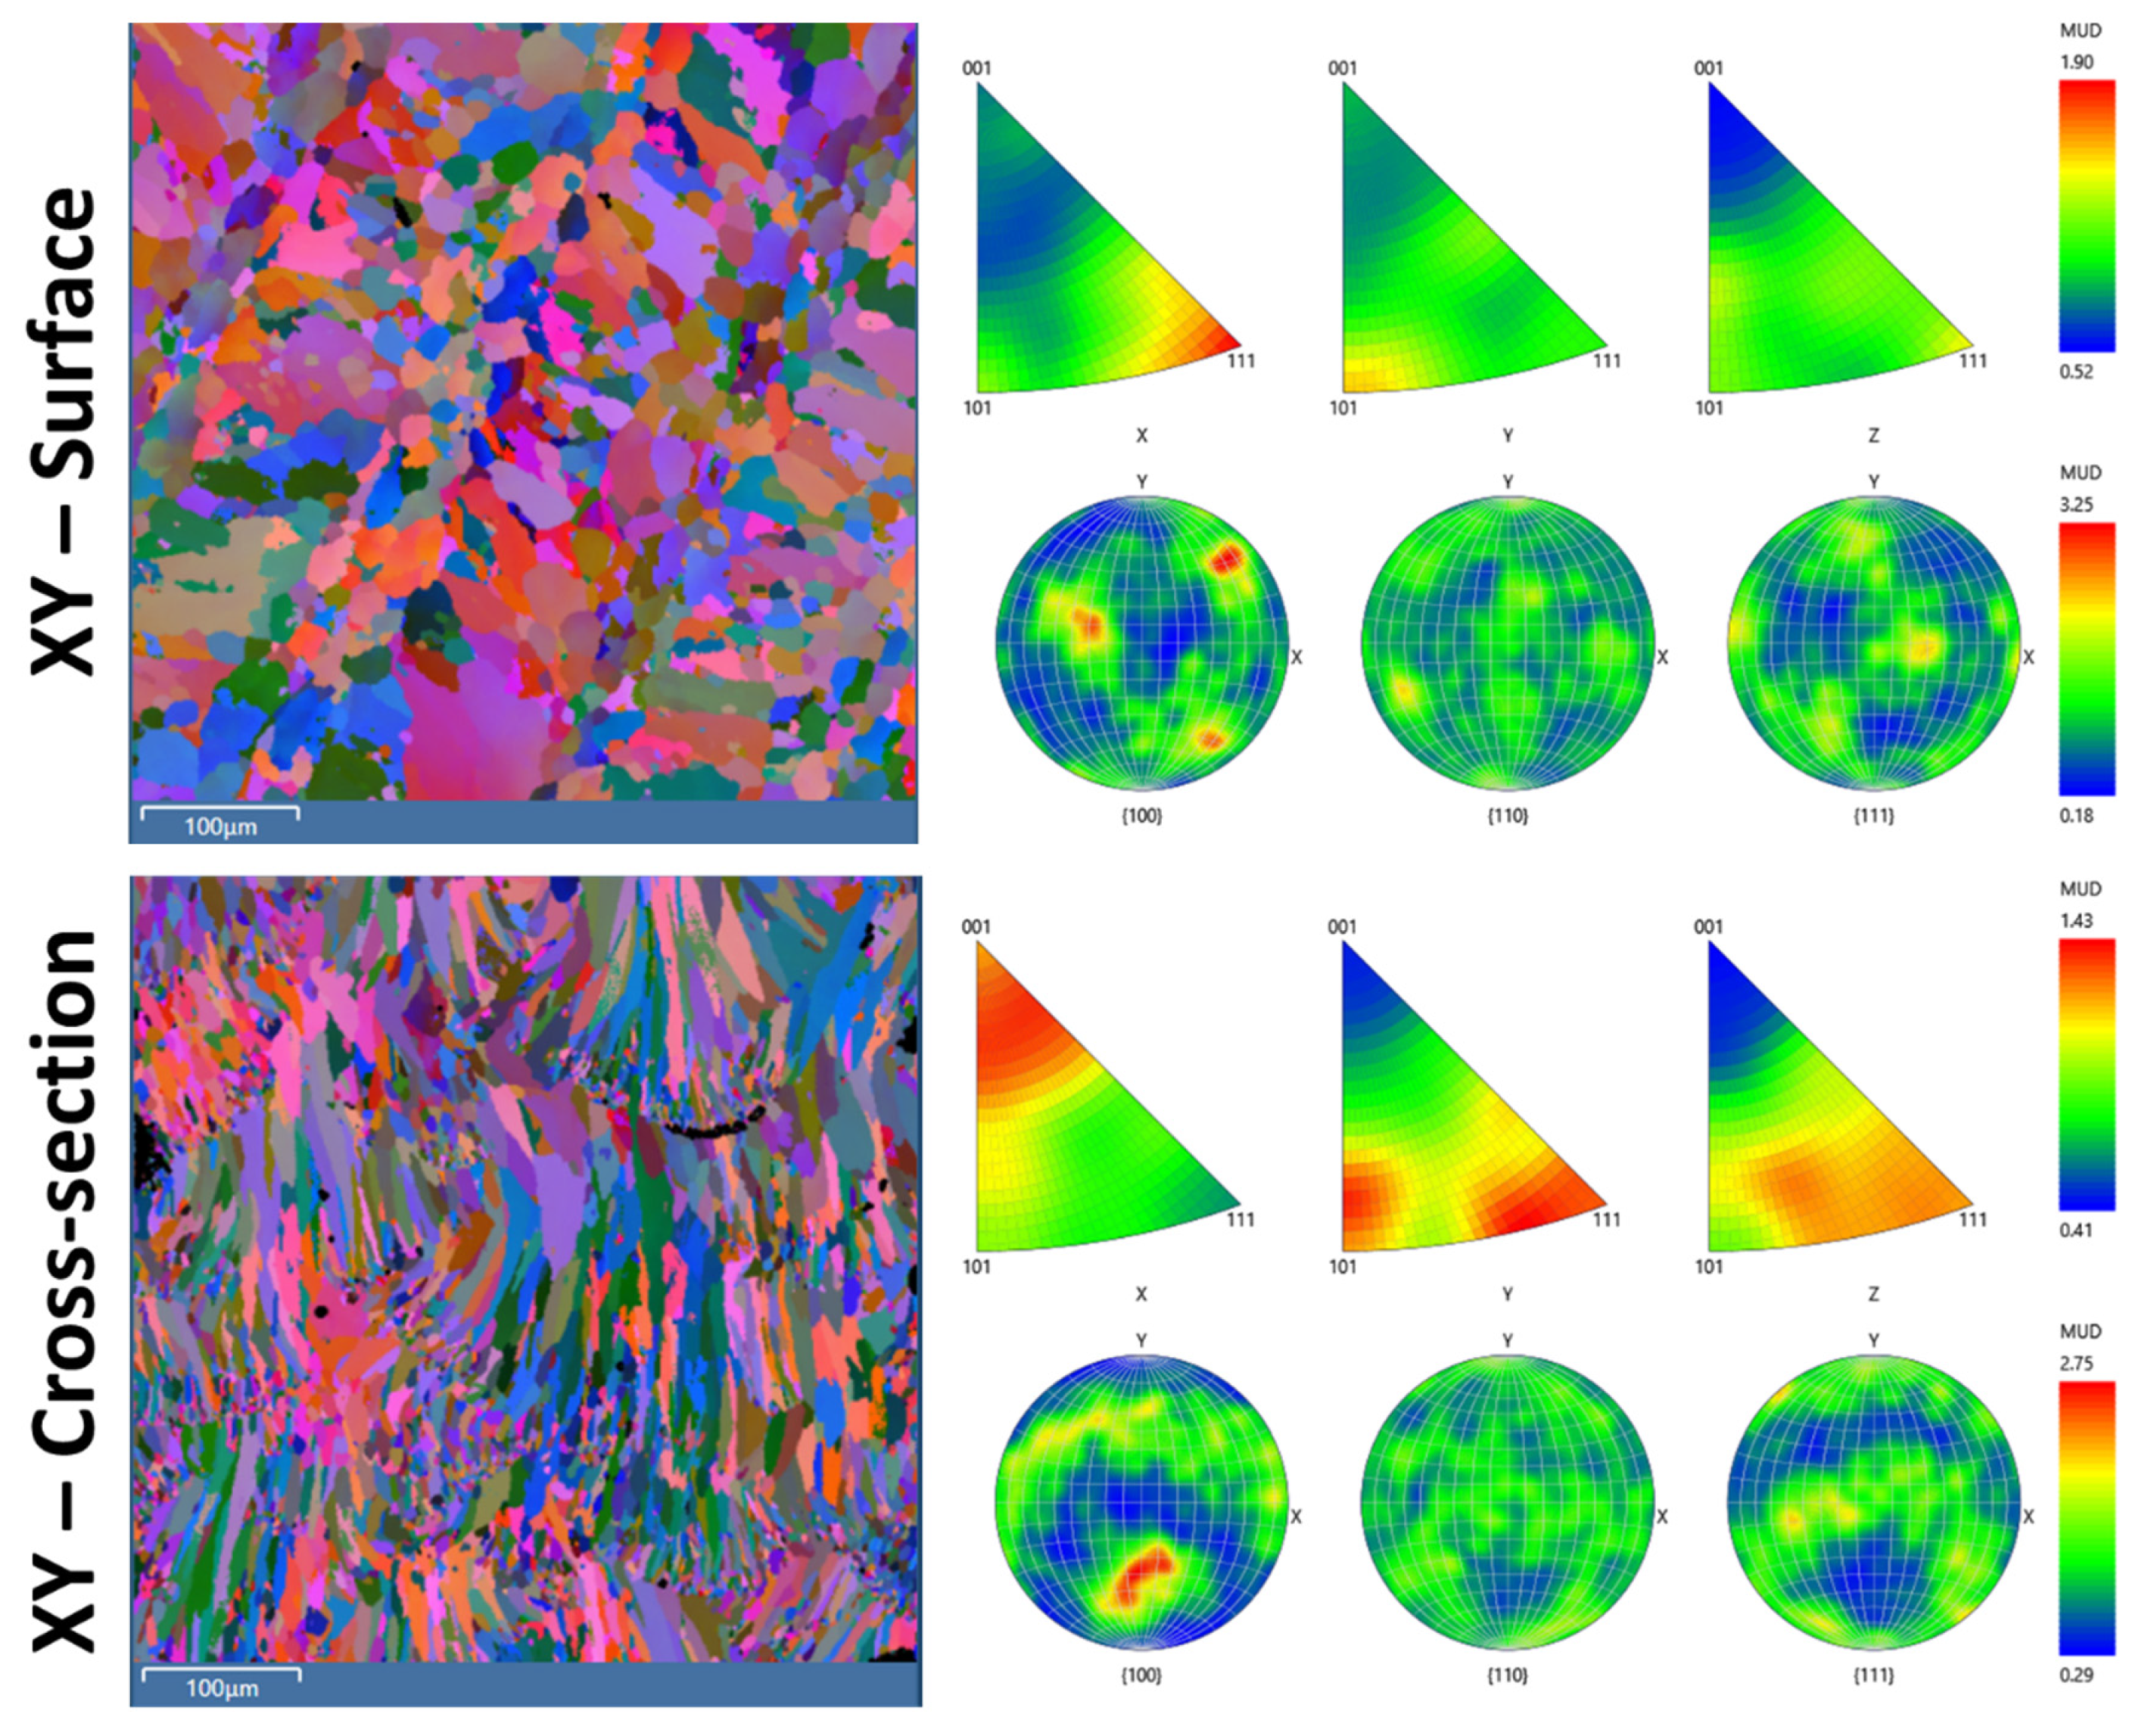
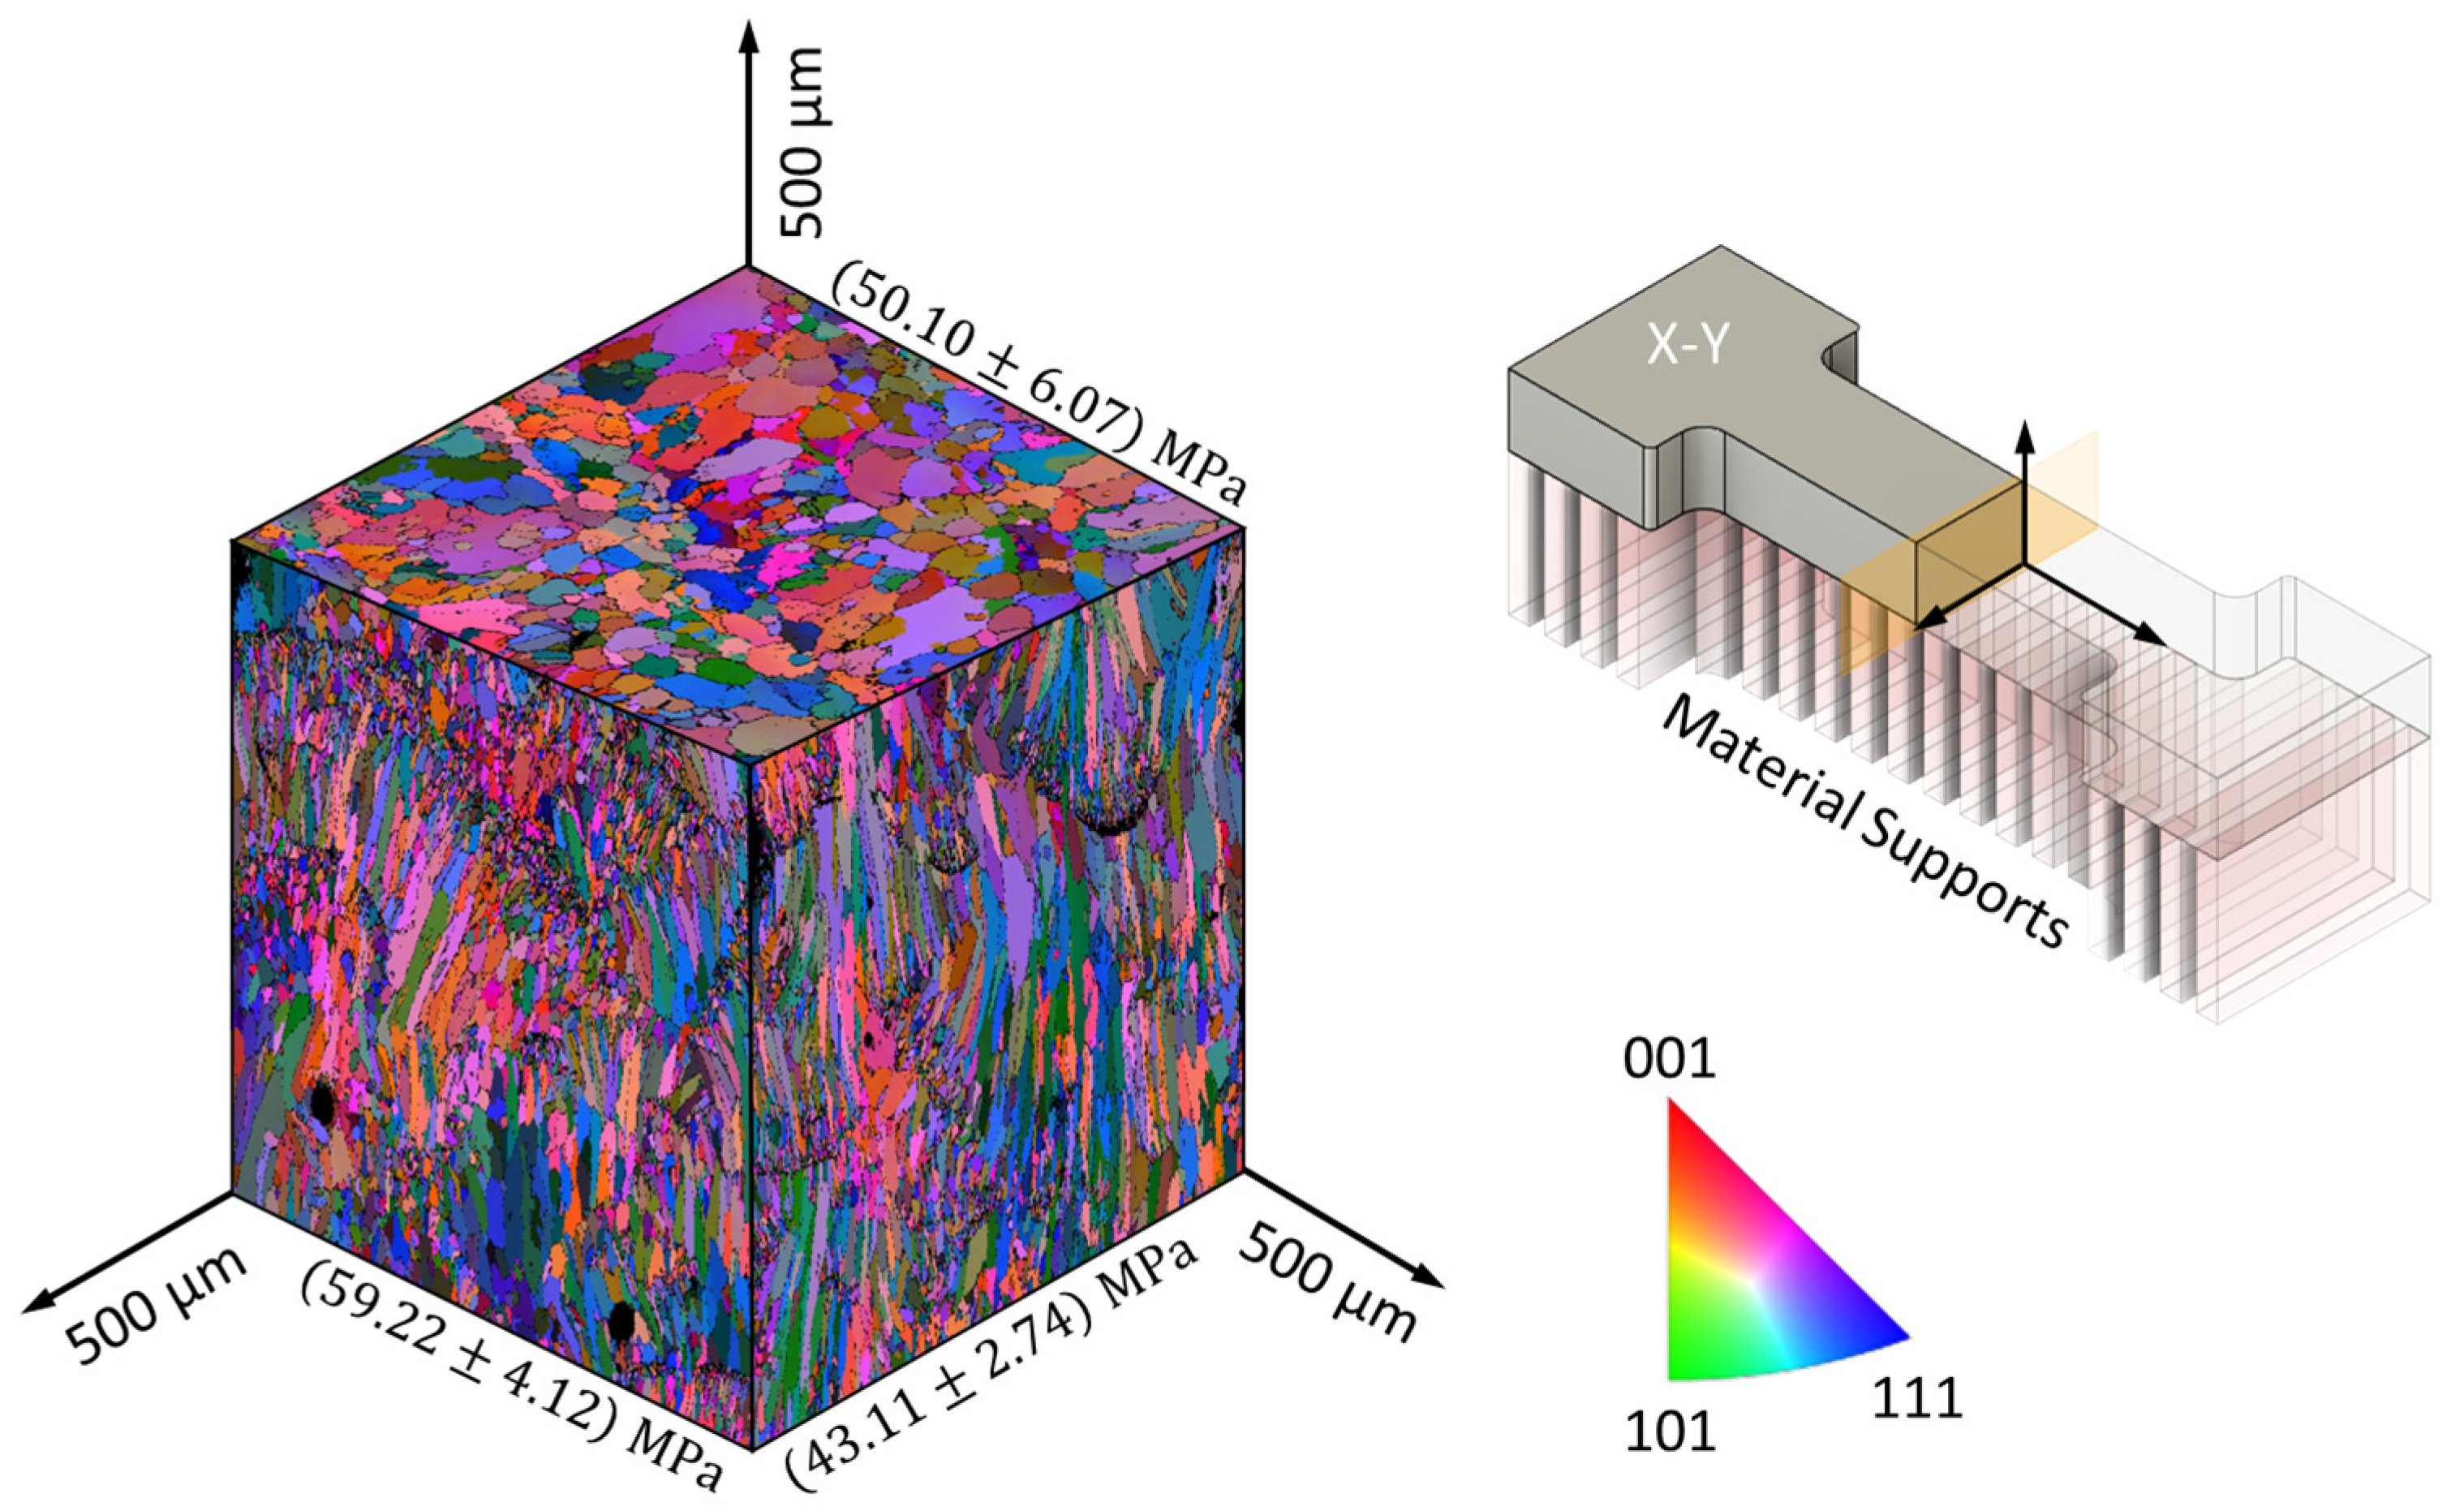
As represented in Figure 3, Figure 4 and Figure 5 and Appendix A EBSD microscopy qualitatively reveals the main motives of the grain pattern appearance in 3D-printed RS-333 alloy depending on the printing orientation. It seems that grains have almost random crystallographic orientation against principal axes of a sample (no or weak texture), but the sizes and aspects of grains are obviously correlated with printing the orientation—main axes of slim elongated columnar grains that are always aligned along the growth direction, and as a result, these grains appear equiaxial in the plane normal to the growth direction. In the planes parallel to the growth direction, elongated columnar grains are not single elements of grain pattern–round-like regions (spots) containing very small equiaxial grains and pores are likely evenly and randomly represented in these planes, being interwoven with columnar grains. These spots are also readily noticeable at the plane normal to the growth direction.
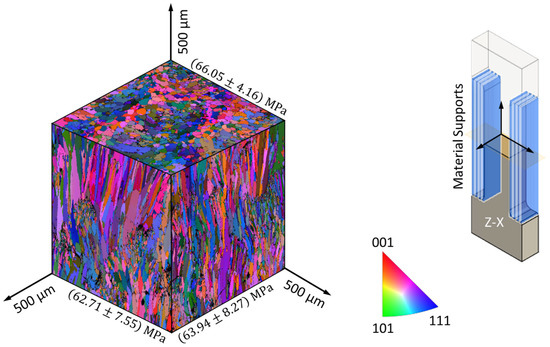
Figure 3.
Grain pattern appearance in 3D-printed RS-333 Al alloy—the ZX printing orientation. Youngs’ modulus values derived from nanoindentation measurements are shown at the respective planes.
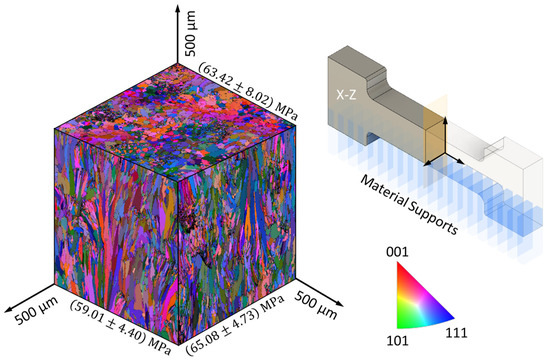
Figure 4.
Grain pattern appearance in 3D-printed RS-333 Al alloy—the XZ printing orientation. Youngs’ modulus values derived from nanoindentation measurements are shown at the respective planes.
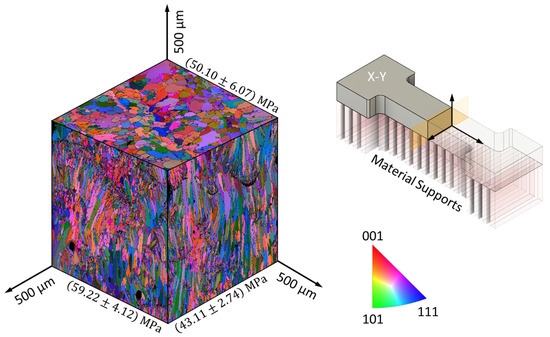
Figure 5.
Grain pattern appearance in 3D-printed RS-333 Al alloy—the XY printing orientation. Youngs’ modulus values derived from nanoindentation measurements are shown at the respective planes.
It is also worth noting that columnar grains may form almost parallel or divergent bouquet-like patterns in the planes parallel to the growth direction. These and other peculiarities of grain patterns (size, aspects, and crystallographic orientation statistics) should, however, be thoroughly quantitatively analysed at bigger subsets to validate the number of conceptual models that can be put forward to describe grain pattern formation, which will be addressed by the authors together with FEM modelling of heat fluxes in a separate paper.
One can also notice that the XY printing orientation returns somewhat different grain patterns than the ZX and XZ printing orientations: thinner and shorter columnar grains, larger number of spots in the planes parallel to growth direction, and coarser equiaxial grains in the plane perpendicular to growth direction. This is supposed to be directly related to specific remelting and solidification conditions: the longest exposure time and diffused heat flow from pin supports.
Average values of grain dimensions for different printing orientations are presented in Table 1. Even qualitative analysis of the grain patterns for different printing orientations gives opportunities to suggest that at least plasticity and fracture behaviour with tension are affected by the columnar grains’ orientation with respect to the loading direction. In the case of the ZX printing orientation of dog bone sample, the columnar grains are parallel to the tension axis. In contrast, for the XZ and XY printing orientation, the columnar grains are perpendicular to the tension axis, making them structurally similar.

Table 1.
Statistic information from the EBSD analysis about the length, width, and aspect ratio of grains for different specimen orientations.
Although a more focused analysis of grain size distributions is needed (as discussed, round spot regions form a specific grain assembly), even the consideration of average grain sizes can be useful.
Shear bands characteristic for ductile metals (and Al alloys) localize plastic flow in the directions, forming an angle of about 45° with the tension axis. Thus, we suggest that different orientations of the main axes of columnar grains with respect to the shear band plane may take place. Therefore, the yield strength that correlates (in accordance with the Petch–Hall law) with the mean crystallite size in the plane of shear band is expected to be strongly dependent on the orientation of columnar grains, i.e., printing orientation. For the simplicity, we estimate the average size of grain geometrical projection to the shear band plane by the formula
The values taken from Table 1 return the estimates for the average values of grain dimension projections to shear band plane (45°) as 17.3, 18.3, and 19.7 μm for ZX, XZ, and XY, respectively. This directly assumes that strength should scale down for ZX, XZ, and XY, respectively.
3.2. Nanoindentation of 3D-Printed RS-333 Alloy: Youngs’ Modulus and Hardness
Aluminium in contrast with some other FCC metals such as nickel is almost elastically isotropic. Therefore, the presence of texture in these 3D-printed Al alloy samples should not affect the overall elastic behaviour.
On the other hand, we have shown recently [13] that the apparent macroscopic modulus noticeably varies (when calculated from in-SEM tensile testing with strains measured using DIC of high-resolution images) for XY, XZ, and ZX printing orientations: 65.4, 70.0, and 77.8 GPa, respectively.
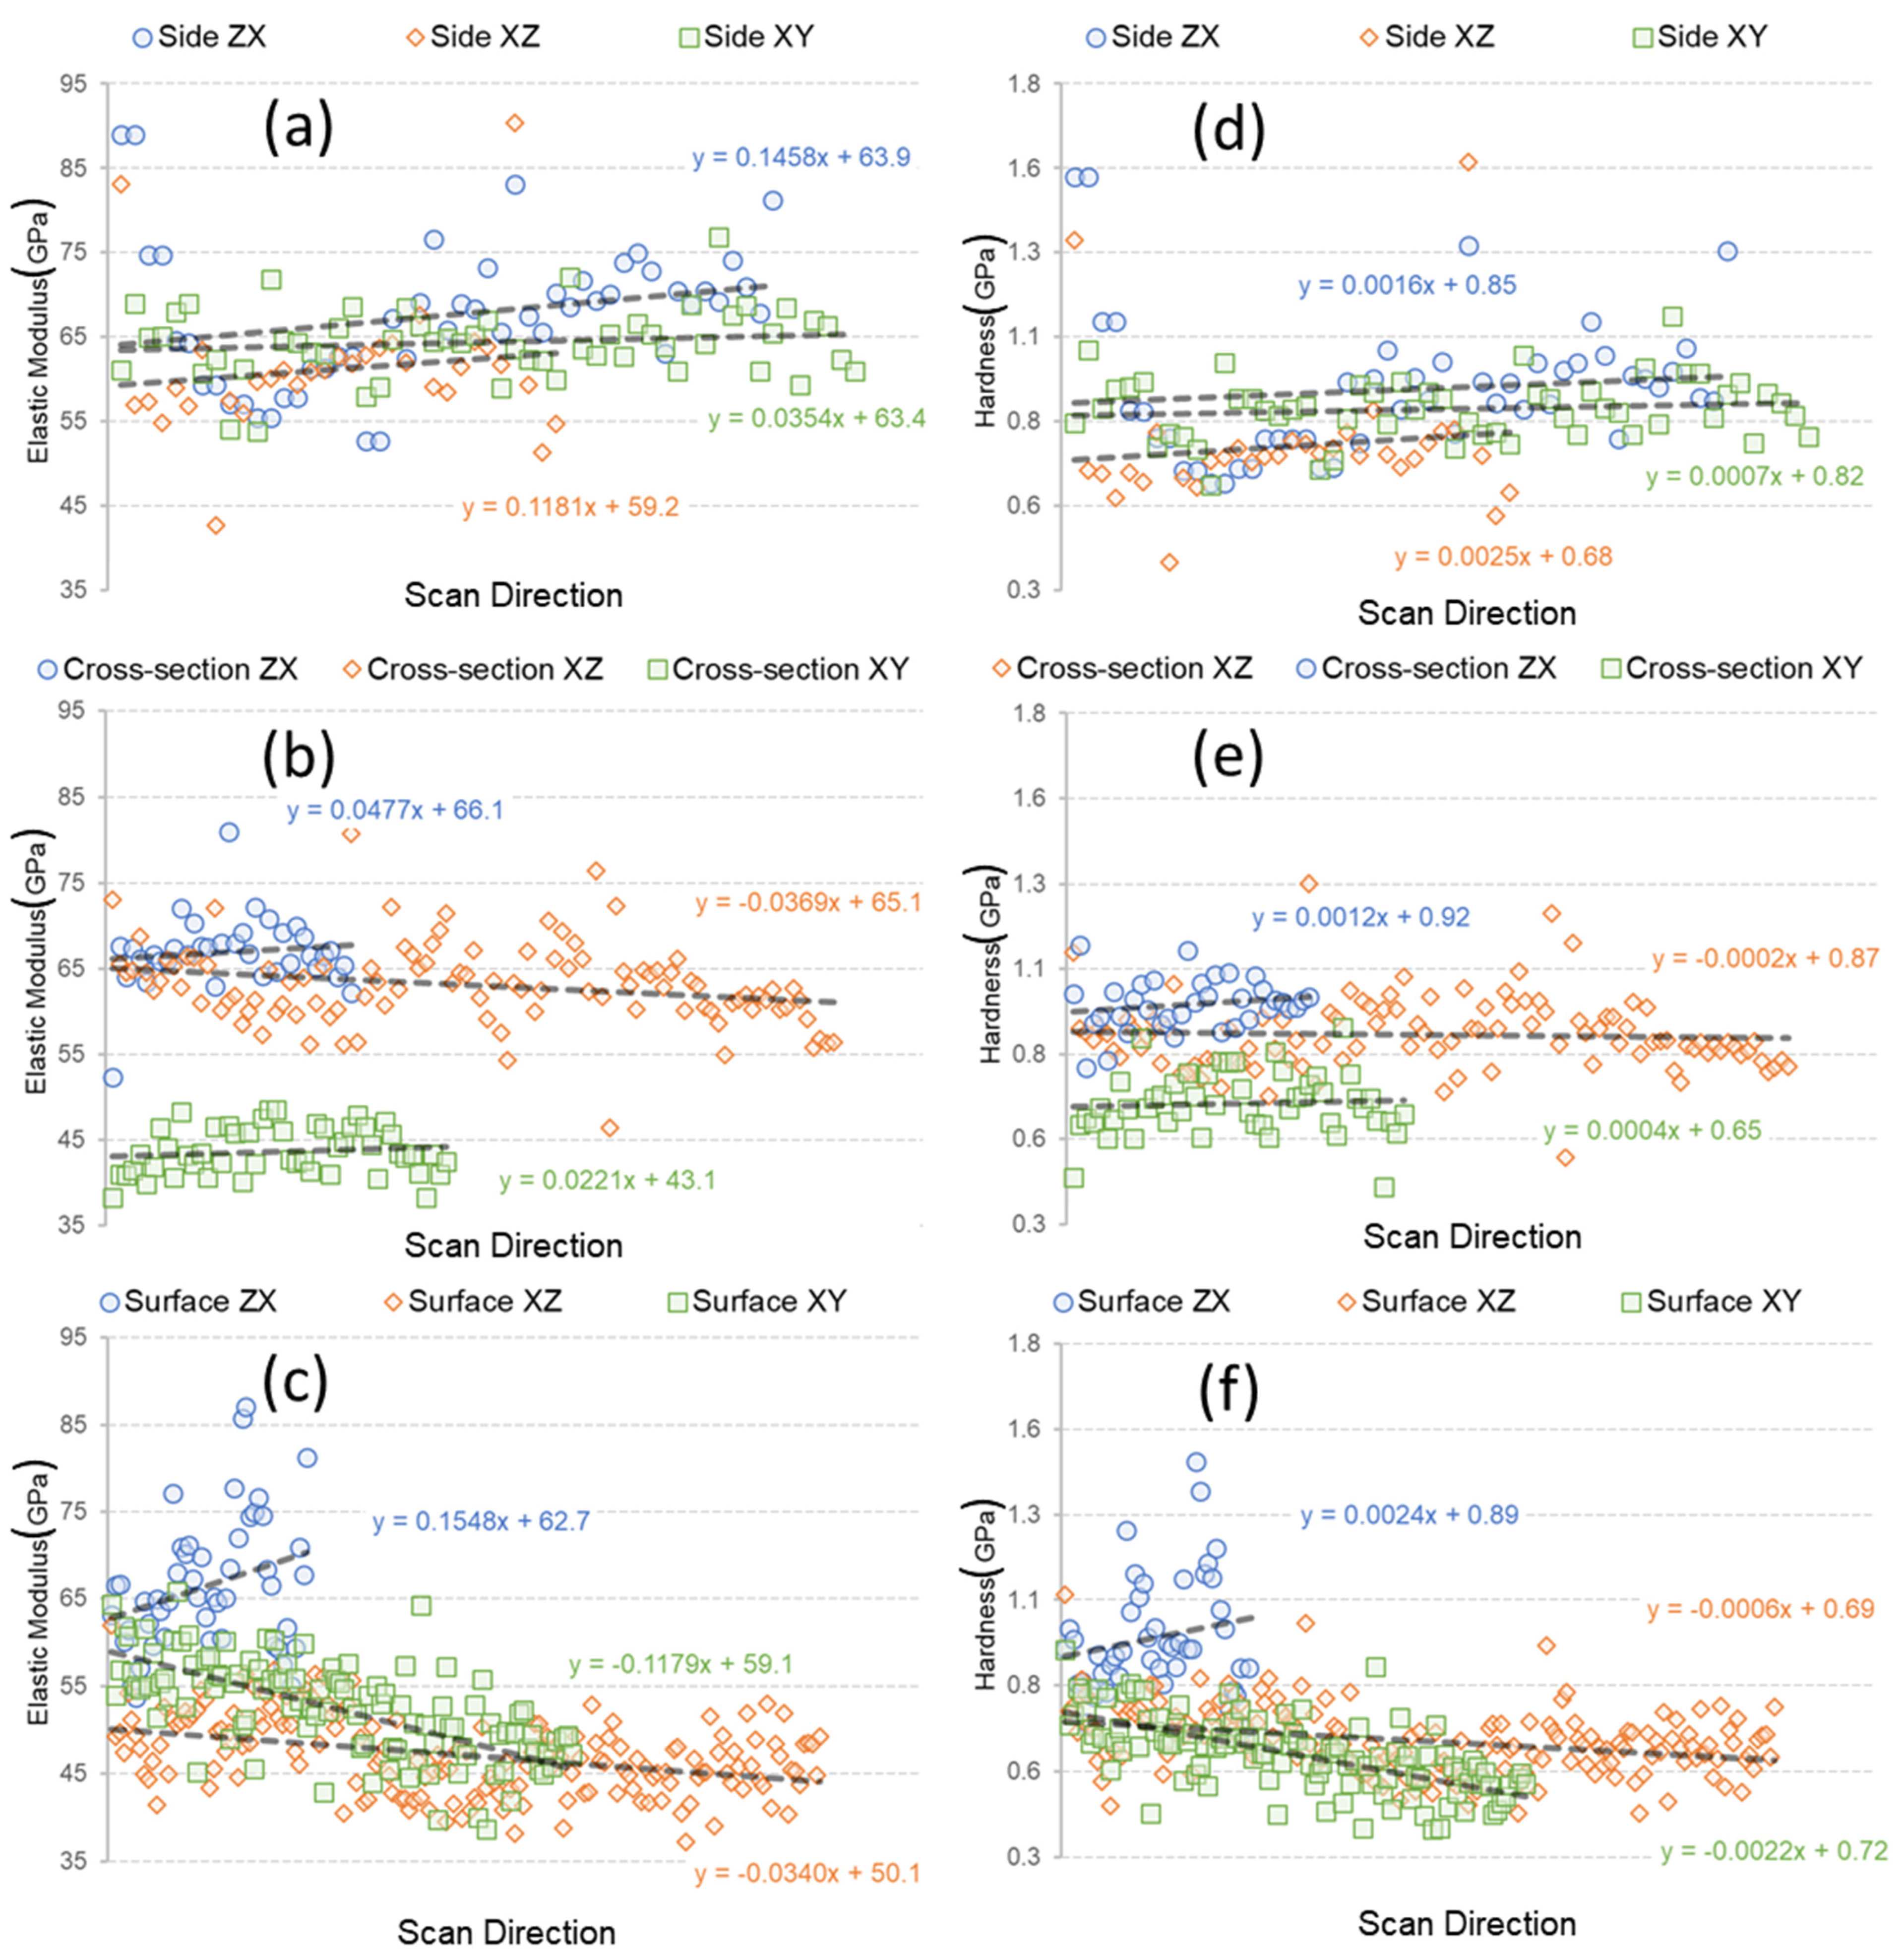
Nanoindentation Oliver–Pharr tests after proper correction [16,18] return reasonable values for the estimates of Young’s modulus, and the orientation dependence of average values is in good accordance with previous report [13]; namely for the XY, XZ, and ZX printing orientations, we detected 50.8, 62.5, and 64.2 GPa, respectively. The measured Young’s modulus and hardness parameters after the nanoindentation test are represented in Figure 6. The scan direction denotes the grains’ growth directions for the side and surface planes, where the grains are elongated. It is worth noting that the values of Young’s modulus measured in the plane perpendicular to the main axis of the dog-bone sample gauge (cross section), parallel to narrow (side), and wide (surface) faces of the gauge zone vary only slightly, showing almost no statistically significant distribution along the growth direction.
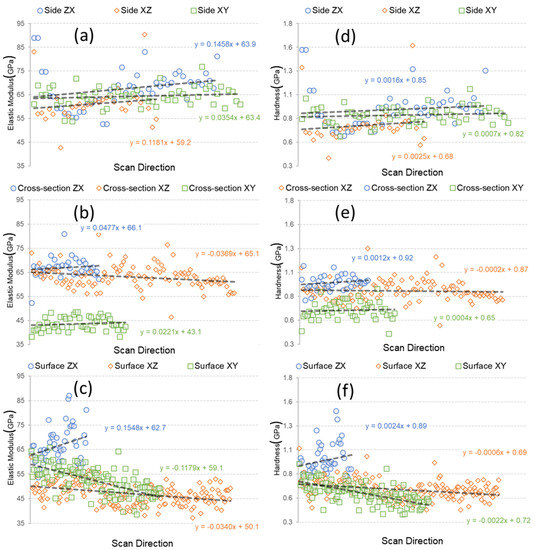
Figure 6.
Young’s modulus (a–c) and hardness (d–f) estimates (derived from Oliver–Pharr nanoindentation tests) in 3D-printed RS-333 Al alloy.
The dependence of the elastic moduli on printing orientation is discussed in the literature [20]. Since no crystallographic texture is detected in studied RS-333, one can suggest that chemical inhomogeneity, or preferential orientation of precipitates or porosity at the nanometer dimensional scale (unresolved in SEM with magnification applied) may cause experimentally observed orientational dependence of Young’s modulus, motivating further fundamental research in this field with relevant methods: high resolution TEM, atom probe tomography, etc.
In contrast to obvious orientation anisotropy of Young’s modulus, it seems that the hardness is almost constant (around 0.8 GPa) and isotropic and it has normal distribution with significance level 0.05 in all studied samples at many of studied planes (cross section for ZX and XZ, side for ZX, and surface for ZX).
Berkovich hardness values of about 0.7–0.8 GPa can be used for rough estimations of the yield strength [21], which is approximately 1/3 of the hardness value; this characteristic is expected to be as high as 250 MPa. This value seems to be a good reference for Al–Mg–Si alloys (the characteristic yield strengths of artificially aged 6061 and 6156 wrought alloys are at maximum 280 and 380 MPa, respectively) but not perfectly corresponds to 3D-printed RS-333 Al alloy. In Ref. [13], we recently showed that the yield strength at 0.2% of strain derived from tension stress–strain curve for 3D-printed RS-333 alloys varies for different printing orientations and reaches only 81 MPa, 132 MPa, and 150 MPa for the XY, XZ, and ZX samples, respectively. We suppose that the discrepancy between values of yield strength derived from tensile test and nanoindentation may be related to the strong influence of a thin superficial surface layer on the results of the measurements, and therefore, microhardness testing probing deeper regions of material is more suitable than nanoindentation for prompt and adequate characterization of mechanical response. On the other hand, the influence of porosity at nanometre dimensional scale may also contribute to the apparent deficiency of yield strength at tension, since in contrast to tension, compression modes of plastic deformation tend to densify porous materials pushing up measured values of strength characteristics.
3.3. Tensile Test of 3D-Printed RS-333 Alloy: The Influence of Surface Quality
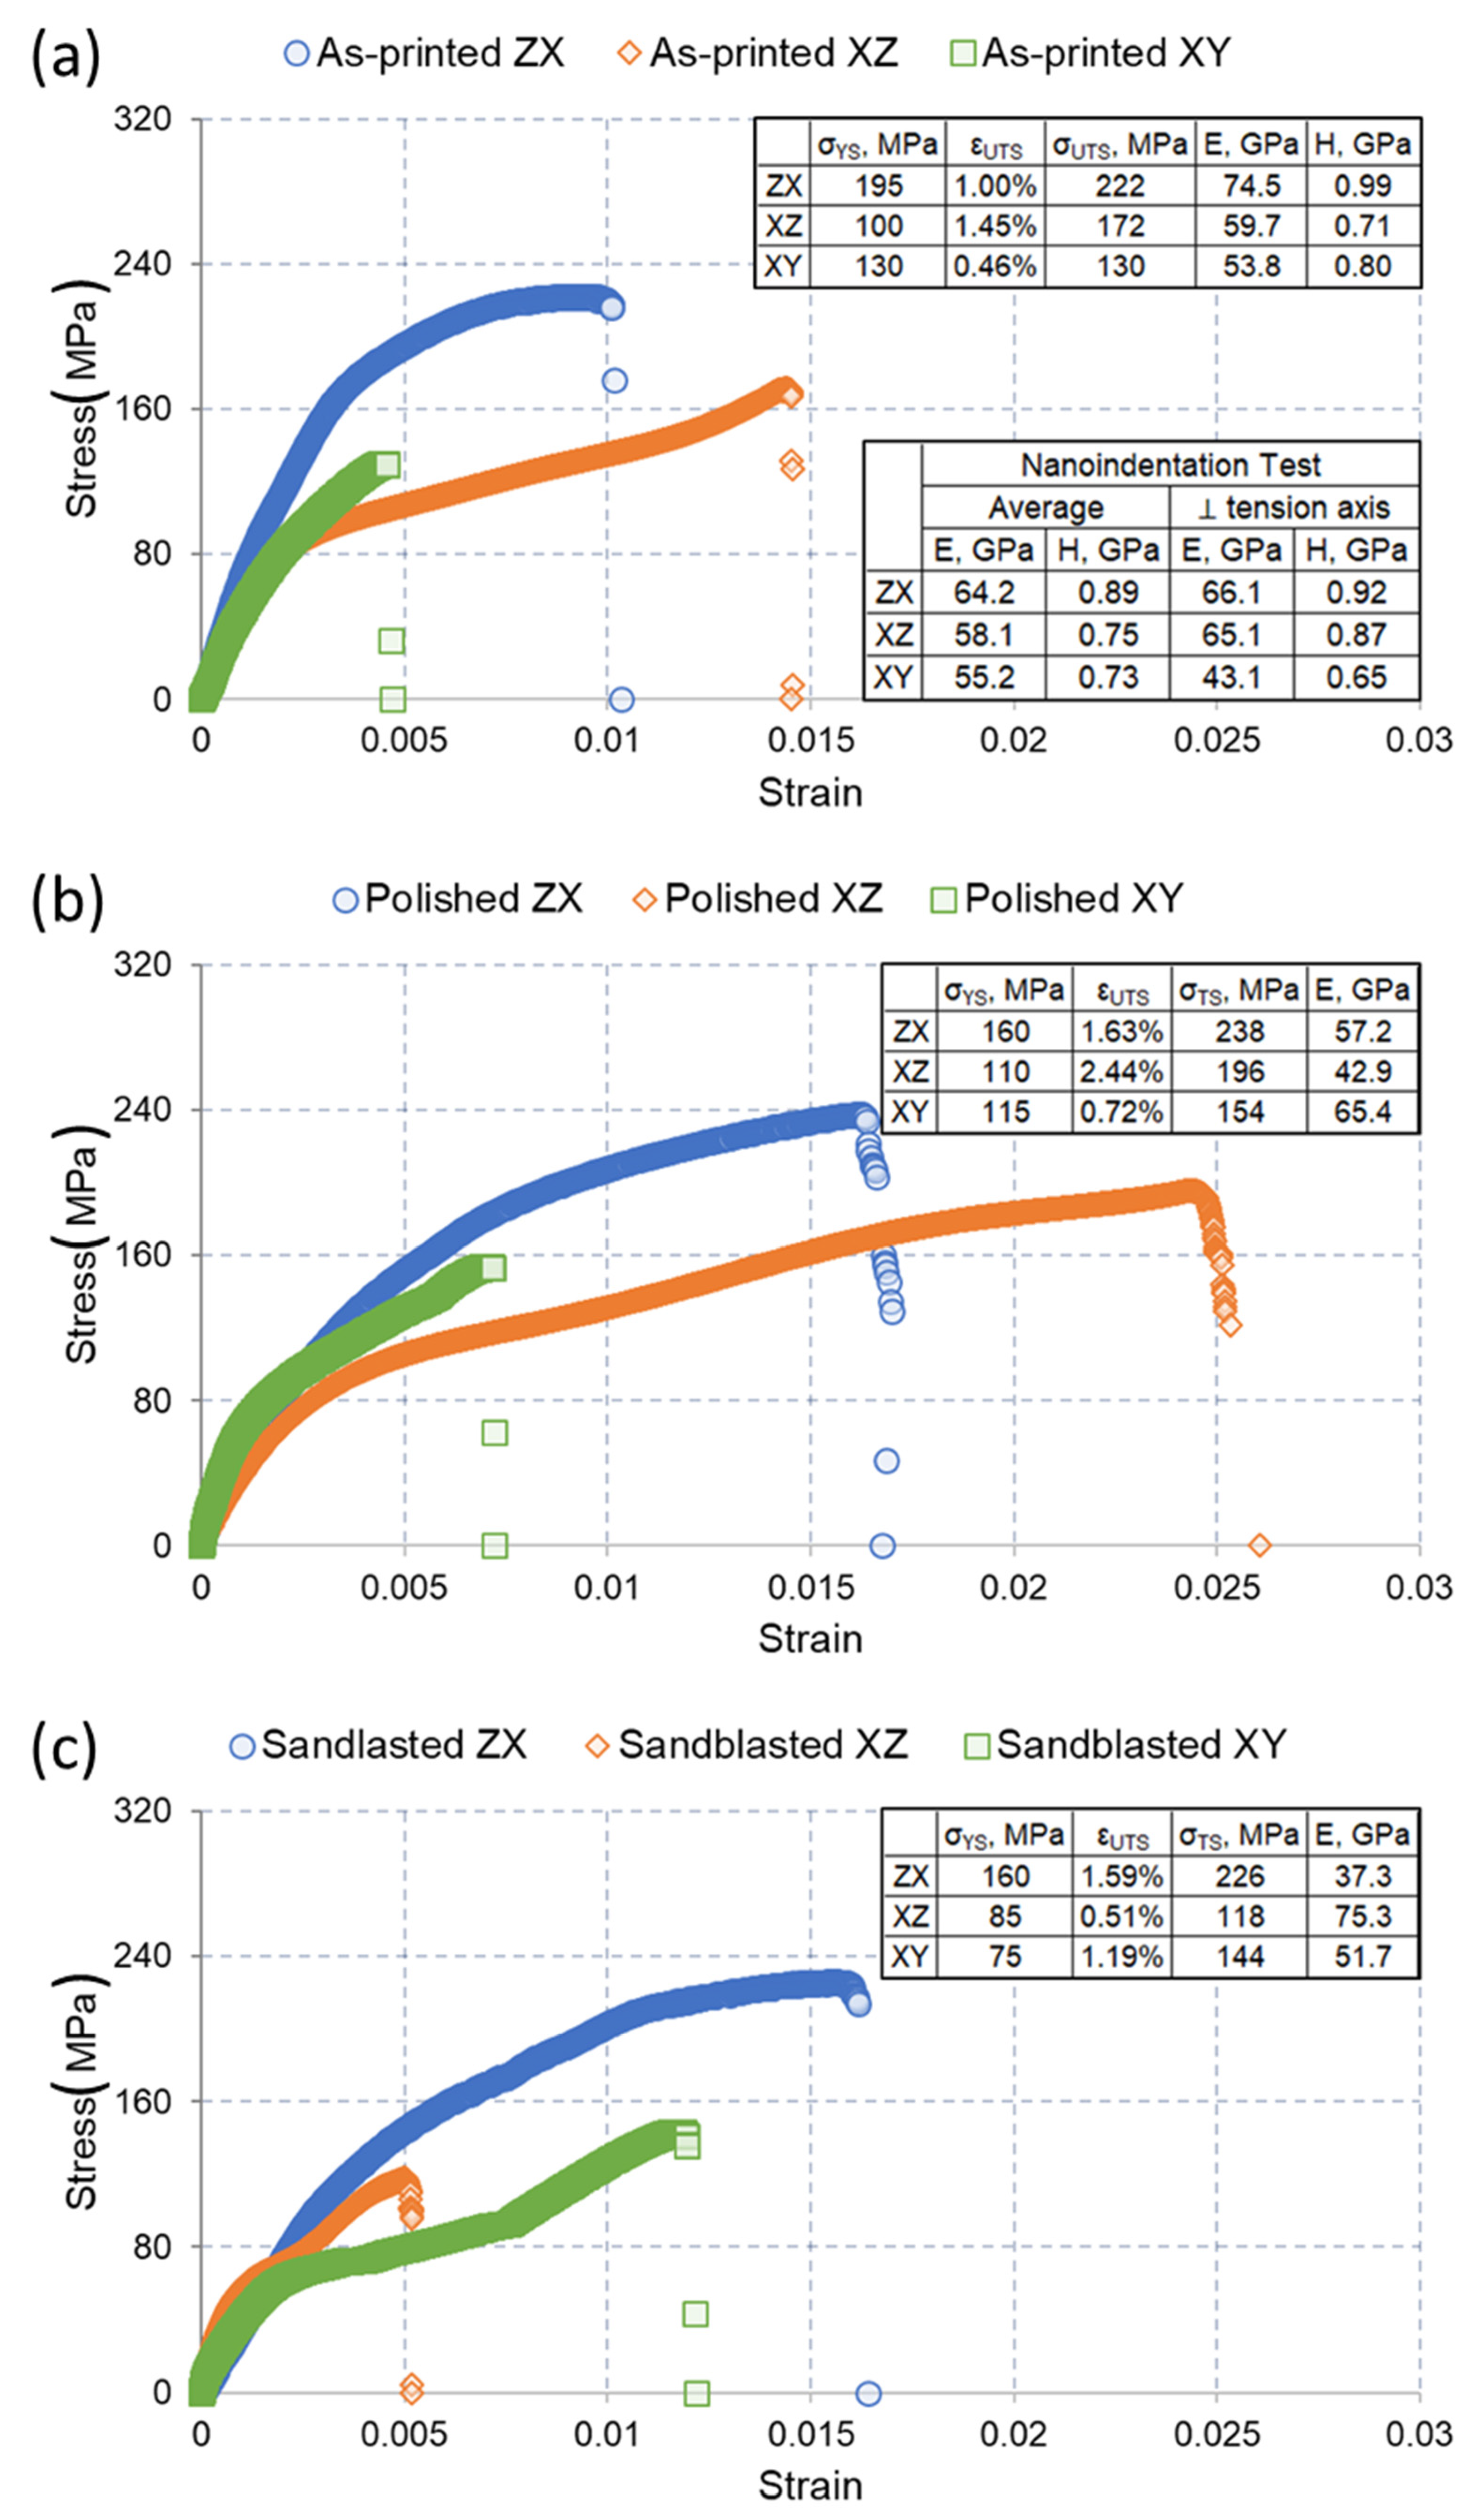
The stress–strain curves acquired in an SE microscope are depicted in Figure 7 for the samples as 3D-printed in different printing orientations (as-printed), further mechanically polished with a series of grinding papers and diamond paste, and separately, sand-blasted after 3D-printing. One can easily see that, for as-printed samples, ZX printing orientation arrives with favourable mechanical performance, i.e., a combination of the highest values of elastic modulus, ultimate tensile strength, and large elongation till rupture. The XZ orientation results in highest ductility, while the XY orientation appears to be the most brittle. Yield and tensile strength show practically the same dependence on printing orientations, which correlates with the results of nanoindentation testing.
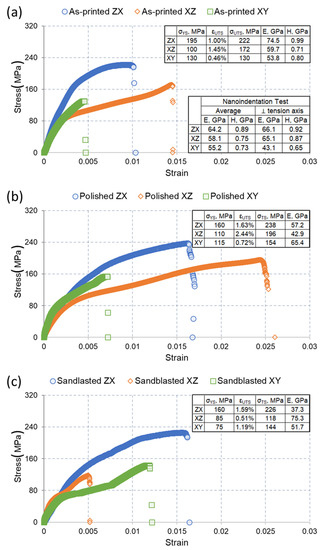
Figure 7.
Mechanical response (a–c) of 3D-printed RS-333 Al alloy under tension.
The same general mechanical response for all printing orientations studied is inherited after mechanical polishing, bringing tensile strength characteristics and ductility to somewhat higher values but reducing Young’s modulus and yield strength. This fact supports the observation that surface layers may significantly affect mechanical response, since thermal history, heat fluxes, and perhaps grain pattern are substantially different at the surface and in the core of 3D-printed samples. In Ref. [13], the residuals of supports, microcracks, and traces of unmolten powder were reported as typical surface features. The volume of surface layer is of especially great importance for thin samples studied. We conclude that the removal of defect-rich surface layers improves tensile strength and ductility. The presence of tensile residual stresses in the superficial layer would reduce apparent yield strength and, perhaps, elongation to rupture. Conversely, compressive residual stresses in the superficial layer increase the apparent yield strength and ductility. The factor of residual stresses should not be considered as the only or the dominant one. The superficial layer is, on the one hand, enriched with the defects (microcracks, topological discontinuities, and other imperfections), and, on the other hand, it tends to be quenched with a number of consequences, e.g., oversaturation of solid solutions, natural aging, and smaller grains. Thus, a slim 3D-printed article can be considered a hybrid material with stronger and more brittle shell. The elimination of this sort of shell makes the rest less strong and more ductile than the hybrid.
Sandblasting returns ambiguous results; it improves the ductility of XY samples but worsens the ductility of XZ and ZX samples. Elastic and strength characteristics change in controversial direction, suggesting that complex modification of superficial zone and residual stress re-distribution.
These results demonstrate that manipulations with 3D-printing orientation and relatively simple and commonly applied mechanical methods of surface treatment give wide range of opportunities for the fine tuning of mechanical response in structural elements of aerospace constructions to purposefully create high demanding parts by design.
The variation in the mechanical response of SLM 3D-printed articles at different printing orientations has been widely reported elsewhere [11,12]. Even for nominally identical printing parameters, the variation of local thermal history takes place due to the difference in the cooling conditions depending on the geometry of the printed part, the position of a given volume of interest inside the piece, the design and position of support, and many other aspects. Local time–temperature variation (primary heating and secondary re-heating events in the elementary volumes) governs a number of phenomena: (1) the completeness of homogenization in the liquid phase, (2) the distribution of elements between the liquid and solid phases and the associated (over)saturation of solid solutions, (3) the overcooling that promotes nucleation and grain growth conditions, (4) the shrinkage after solidification and pore formation, (5) the homogenization and solid solution decomposition (aging), and (6) residual stress formation and its spatial distribution.
Therefore, the complete interpretation of experimental observations of mechanical response becomes overwhelmingly complex and requires multi-instrumental experimental characterization across the hierarchy of dimensional scales and multi-physics modelling studies. An alternative approach involves laborious accumulation of experimental facts to build semi-empirical correlations through conceptual modelling, given the numerous parameters and aspects of the complex 3D-printing process. The grain pattern within the polycrystalline aggregate (governed by the thermal history during printing) is well known to have a strong effect on the yield strength and ductility, and on the elongation (ductility), fracture toughness, and fatigue resistance. In the authors’ opinion, the elastic and yield properties are also dependent on the structural inhomogeneities at the nanometre dimensional level. The inhomogeneity is, in turn, controlled by the thermal history. Recently, a novel approach to the analysis of non-isothermal processing history has been proposed to account for the rapid cooling characteristic of 3D-printing [22]. The authors intend to address these aspects in further reports.
Many practical issues, however, rest unanswered. As we demonstrated, the columnar grains tend to be strictly aligned in growth direction; however, lys français patterns often appear in some directions as well. The formation of these structures is to be thoroughly quantitatively studied and digitally modelled on a multi-physics platform that should create both fundamental theory of property moderation at SLM 3D-printing and a practical tool (plug-in to CAD software) for the optimization of CAM printing code.
4. Conclusions
Three-dimensionally printed Al alloys rapidly fill the portfolio of efficient material solutions in aerospace, giving a chance for inexpensive fabrication of weight-saving structural elements. The optimization of printing parameters allows us to create specific patterns of columnar grains rationally oriented against load directions and, through this, to reinforce the parts in simple and efficient way. EBSD microscopy in combination with in-SEM mechanical testing is very suitable tools for fundamental research in this field. As expected, a growing number of reports will appear in the near future to bridge gaps in the understanding of grain patter formation and interpretation of anisotropy of elastic moduli in theoretically isotropic metals.
Additional phenomenon that ought to be taken into account concerns the introduction and presence of residual stresses within 3D-printed parts. Residual stresses appear as a consequence of the high-temperature gradients and steep cooling rates during sample building that affects the alloy ultra-structure (precipitates) and hence flow stress. This, in turn, gives rise to non-uniform plastic deformation and locked-in (or frozen in) permanent inelastic strains, often referred to as eigenstrains that can be thought of as the underlying origin of residual stress and, conversely, distortion.
The case of aluminium alloys is of particular interest due to the near isotropy of their elastic properties that means that grain-level deformation-induced misfit strains arise only due to anisotropy of crystal plastic activity on the FCC {111} <110> slip systems.
Residual stresses are known to exist over a variety of characteristic lengths and are often classified into the Type I (macro-), Type II (micro-), and Type III (nano-) scales [23,24]. Macroscopic Type I stresses can be evaluated using a number of mechanical sectioning techniques, such as the contour method, slitting, blind hole drilling, etc. Meso- to micro-scale residual stresses of Type II are more difficult to quantify, although a range of methods have been developed based on laboratory X-ray and neutron diffraction that allow for distinguishing between groups of grains that differ in terms of crystal lattice orientation. Finally, Type III residual stresses exist at the intra-granular scale, so that probing them requires suitably refined methods, such as micro-focus Laue X-ray diffraction, electron diffraction (HR-EBSD), or Focused Ion Beam methods such as micro-ring-core FIB-DIC [23,24,25].
It is important to note that residual stresses may exert an influence on the overall de-formation behaviour of polycrystalline assemblies. Micro-scale residual stresses have been shown to obey a statistical distribution that is well approximated by the Gaussian law [23,26]. This observation implies that some material volumes may find themselves close to the yield condition, causing plastic deformation to occur even at the early stages of loading. This may be understood, e.g., through the use of Masing model [27] and lead to the modification of the apparent modulus upon loading.
The ultimate purpose of the analysis of the internal hierarchical residual stress state is to factor it into the prediction of material strength and failure, e.g., under the conditions of fatigue loading, as has been demonstrated for Ni-base superalloy samples produced by laser powder bed fusion (LPBF) [28]. The extension of this approach to different classes of metallic alloys remains an important theme of ongoing research.
Author Contributions
Conceptualization, A.I.S. and A.M.K.; methodology, Y.V.M. and P.A.S.; software, E.S.S.; validation, A.I.S., D.K.R. and A.M.K.; formal analysis, E.S.S.; investigation, P.A.S. and E.S.S.; resources, A.I.S.; data curation, P.A.S. and E.S.S.; writing—original draft preparation, A.I.S. and E.S.S.; writing—review and editing, P.A.S., D.K.R. and A.M.K.; visualization, E.S.S. and P.A.S.; supervision, A.I.S., D.K.R. and A.M.K. All authors have read and agreed to the published version of the manuscript.
Funding
This research was funded by the Russian Science Foundation, grant number 21-19-00791, https://rscf.ru/en/project/21-19-00791/.
Data Availability Statement
The data presented in this study are available from the corresponding author upon request.
Acknowledgments
This research was funded by the Russian Science Foundation, grant number 21-19-00791, https://rscf.ru/en/project/21-19-00791/, and the authors are grateful to the crew of Fablab of Skoltech for their delicate and accurate sample preparations.
Conflicts of Interest
The authors declare no conflict of interest.
Appendix A
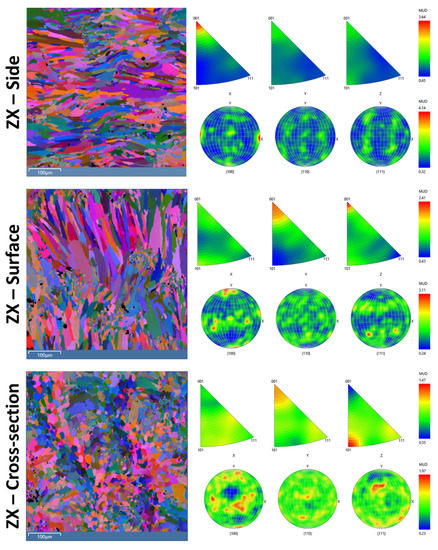

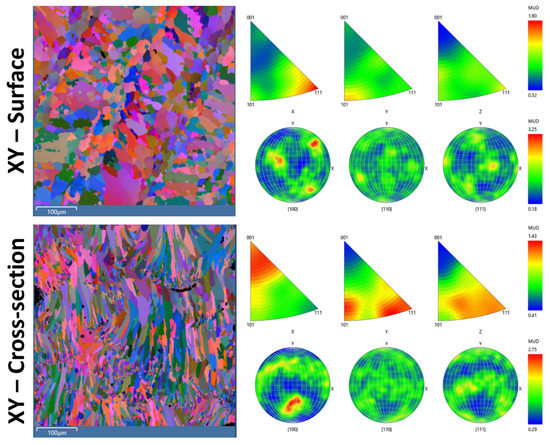
Figure A1.
Euler, inverse pole, and pole figures of the side, surface, and cross section for different specimen orientations.

References
- Munir, K.; Biesiekierski, A.; Wen, C.; Li, Y. Selective laser melting in biomedical manufacturing. In Metallic Biomaterials Processing and Medical Device Manufacturing; Woodhead Publishing: Oxford, UK, 2020; pp. 235–269. [Google Scholar] [CrossRef]
- Zhang, L.-C.; Wang, J.; Liu, Y.; Jia, Z.; Liang, S.-X. Additive Manufacturing of Titanium Alloys. Ref. Modul. Mater. Sci. Mater. Eng. 2020. [Google Scholar] [CrossRef]
- Song, X.; Zhai, W.; Huang, R.; Fu, J.; Fu, M.; Li, F. Metal-Based 3D-Printed Micro Parts & Structures. Ref. Modul. Mater. Sci. Mater. Eng. 2020. [Google Scholar] [CrossRef]
- New Nickel 3D Printing Powder Ideal for Gas Turbine Production. Available online: https://www.pesmedia.com/eos-nickel-additive-manufacturing-18022021/ (accessed on 6 June 2021).
- Multi-Metal 3D Printed Gas Turbine. Available online: https://www.materialstoday.com/additive-manufacturing/products/multimetal-3d-printed-gas-turbine/ (accessed on 6 June 2021).
- Satellite Detail Produced through 3D Printing by RUSAL Successfully Works in Space. Available online: https://www.spotlightmetal.com/satellite-detail-produced-through-3d-printing-by-rusal-successfully-works-in-space-a-998012/ (accessed on 6 June 2021).
- Nguyen, D.-S.; Park, H.-S.; Lee, C.-M. Applying Selective Laser Melting to Join Al and Fe: An Investigation of Dissimilar Materials. Appl. Sci. 2019, 9, 3031. [Google Scholar] [CrossRef] [Green Version]
- Xiong, W.; Hao, L.; Li, Y.; Tang, D.; Cui, Q.; Feng, Z.; Yan, C. Effect of selective laser melting parameters on morphology, microstructure, densification and mechanical properties of supersaturated silver alloy. Mater. Des. 2019, 170, 107697. [Google Scholar] [CrossRef]
- Kluczyński, J.; Śnieżek, L.; Grzelak, K.; Janiszewski, J.; Płatek, P.; Torzewski, J.; Szachogłuchowicz, I.; Gocman, K. Influence of Selective Laser Melting Technological Parameters on the Mechanical Properties of Additively Manufactured Elements Using 316L Austenitic Steel. Materials 2020, 13, 1449. [Google Scholar] [CrossRef] [Green Version]
- Pekok, M.A.; Setchi, R.; Ryan, M.; Han, Q.; Gu, D. Effect of process parameters on the microstructure and mechanical properties of AA2024 fabricated using selective laser melting. Int. J. Adv. Manuf. Technol. 2021, 112, 175–192. [Google Scholar] [CrossRef]
- Subbiah, R.; Bensingh, J.; Kader, A.; Nayak, S. Influence of printing parameters on structures, mechanical properties and surface characterization of aluminium alloy manufactured using selective laser melting. Int. J. Adv. Manuf. Technol. 2020, 106, 5137–5147. [Google Scholar] [CrossRef]
- Koutny, D.; Skulina, D.; Pantelejev, L.; Paloušek, D.; Lenczowski, B.; Palm, F.; Nick, A. Processing of Al-Sc aluminum alloy using SLM technology. Procedia CIRP 2018, 74, 44–48. [Google Scholar] [CrossRef]
- Statnik, E.S.; Nyaza, K.V.; Salimon, A.I.; Ryabov, D.; Korsunsky, A.M. In Situ SEM Study of the Micro-Mechanical Behaviour of 3D-Printed Aluminium Alloy. Technologies 2021, 9, 21. [Google Scholar] [CrossRef]
- Liu, X.; Zhao, C.; Zhou, X.; Shen, Z.; Liu, W. Microstructure of selective laser melted AlSi10Mg alloy. Mater. Des. 2019, 168, 107677. [Google Scholar] [CrossRef]
- Bouledroua, O.; Meliani, M.H.; Azari, Z.; Sorour, A.; Merah, N.; Pluvinage, G. Effect of Sandblasting on Tensile Properties, Hardness and Fracture Resistance of a Line Pipe Steel Used in Algeria for Oil Transport. J. Fail. Anal. Prev. 2017, 17, 890–904. [Google Scholar] [CrossRef]
- Oliver, W.C.; Pharr, G.M. An improved technique for determining hardness and elastic modulus using load and displacement sensing indentation experiments. J. Mater. Res. 1992, 7, 1564–1583. [Google Scholar] [CrossRef]
- Hay, J.C.; Bolshakov, A.; Pharr, G.M. A critical examination of the fundamental relations used in the analysis of nanoindentation data. J. Mater. Res. 1999, 14, 2296–2305. [Google Scholar] [CrossRef] [Green Version]
- Yetna N’Jocka, M.; Roudet, F.; Idriss, M.; Bartier, O.; Chicot, D. Work-of-indentation coupled to contact stiffness for calculating elastic modulus by instrumented indentation. Mech. Mater. 2016, 94, 170–179. [Google Scholar] [CrossRef]
- Blaber, J.; Adair, B.; Antoniou, A. Ncorr: Open-Source 2D Digital Image Correlation Matlab Software. Exp. Mech. 2015, 55, 1105–1122. [Google Scholar] [CrossRef]
- Ponnusamy, P.; Rahman Rashid, R.A.; Masood, S.H.; Ruan, D.; Palanisamy, S. Mechanical Properties of SLM-Printed Aluminium Alloys: A Review. Materials 2020, 13, 4301. [Google Scholar] [CrossRef] [PubMed]
- Tiryakioğlu, M.; Robinson, J.C.; Salazar-Guapuriche, M.A.; Zhao, Y.Y.; Eason, P.D. Hardness–strength relationships in the aluminum alloy 7010. Mater. Sci. Eng. A 2015, 631, 196–200. [Google Scholar] [CrossRef]
- Korsunsky, A.M. On the Hill and Kolmogorov statistics and the K-function representation of judiciously modified Avrami kinetics. arXiv 2021, arXiv:2103.11728. [Google Scholar]
- Salvati, E.; Korsunsky, A.M. An analysis of macro- and micro-scale residual stresses of Type I, II and III using FIBDIC micro-ring-core milling and crystal plasticity FE modelling. Int. J. Plast. 2017, 98, 123–138. [Google Scholar] [CrossRef]
- Everaerts, J.; Salvati, E.; Uzun, F.; Romano Brandt, L.; Zhang, H.J.; Korsunsky, A.M. Separating macro- (Type I) and micro- (Type II.III) residual stresses by ring-core FIB-DIC milling and eigenstrain modelling of a plastically bent titanium alloy bar. Acta Mater. 2018, 156, 43–51. [Google Scholar] [CrossRef]
- Salvati, E.; Romano Brandt, L.; Mughal, Z.; Sebastiani, M.; Korsunsky, A.M. Generalised residual stress depth profiling at the nanoscale using focused ion beam milling. J. Mech. Phys. Solids 2019, 125, 488–501. [Google Scholar] [CrossRef]
- Chen, J.W.; Korsunsky, A.M. Why is local stress statistics normal, and strain lognormal? Mater. Des. 2021, 198, 109319. [Google Scholar] [CrossRef]
- Korsunsky, A.M. A Teaching Essay on Residual Stresses and Eigenstrains; Butterworth-Heinemann: Oxford, UK, 2017; ISBN 9780128109908. [Google Scholar]
- Salvati, E.; Lunt, A.J.G.; Heason, C.P.; Baxter, G.J.; Korsunsky, A.M. An analysis of fatigue failure mechanisms in an additively manufactured and shot-peened IN718 nickel superalloy. Mater. Des. 2020, 191, 108605. [Google Scholar] [CrossRef]


Publisher’s Note: MDPI stays neutral with regard to jurisdictional claims in published maps and institutional affiliations. |
© 2021 by the authors. Licensee MDPI, Basel, Switzerland. This article is an open access article distributed under the terms and conditions of the Creative Commons Attribution (CC BY) license (https://creativecommons.org/licenses/by/4.0/).