Article

First-Principles Study on the Mechanism of Greenhouse Gas Generation in Aluminum Electrolysis

School of Metallurgy and Environment, Central South University, Changsha 410012, China
*
Authors to whom correspondence should be addressed.
Metals 2021, 11(7), 1118; https://doi.org/10.3390/met11071118
Submission received: 30 May 2021 / Revised: 2 July 2021 / Accepted: 3 July 2021 / Published: 13 July 2021

Abstract

:
Greenhouse gases emitted by the aluminum electrolysis industry have brought great challenges to environmental protection. To address this problem, understanding the micro-generation mechanism of greenhouse gases in the electrolysis process is of great significance to their source suppression. Based on the first principles calculation method, the formation paths of CO, CO2 and COF2 during normal electrolysis were obtained by studying the adsorption behavior of oxygen and fluorine complex anions (short for [O]2−, [F]) on the anode surface in cryolite alumina molten salt. The calculation results indicate that the O and F atoms prefer to adsorb at bridge site 1 of Model A, with the adsorption energies of −4.82 eV and −3.33 eV. In the [O]2− priority discharge stage, Path 3 is the most likely path for CO2 generation, while in the [O]2−, [F] co-discharge stage, Path 3 is the most likely path for COF2 generation. It is deduced that the thermal decomposition of COF2 at high temperature should account for the generation of CF4 with a low concentration of the so-called non-anode effect PFC (NAE-PFC). Experiments were also conducted to verify the calculation by disclosing the bonding information of C, O and F, which are in good accordance with the results calculated by the first principle.

1. Introduction

With the rapid development of aluminum electrolysis technology, environmental pressure is increasing [1,2,3,4]. In 2020, China’s electrolytic aluminum industry carbon emissions of 418 million tons accounted for 4.3% of China’s total carbon dioxide emissions. At the same time, the aluminum electrolysis industry is the world’s largest perfluorocarbons (-PFCs-) emission source, accounting for about 90% of the total PFCs emissions [5,6,7,8].CO2 and PFCs are greenhouse gases, which are the main causes of global warming. CF4 and C2F6 are high-greenhouse potential gases, and their greenhouse effect is 6500~10,000 times the CO2 equivalent [9,10,11,12]. In the face of the increasingly severe global warming trend caused by the greenhouse effect, China has promised to reach the peak of carbon emissions in 2030, achieve carbon neutralization in 2060 and further strengthen the control of non-carbon dioxide greenhouse gases [13,14,15].Therefore, it is of great significance to reduce greenhouse gas emissions in the electrolytic aluminum industry, not only in response to the theme of green and low-carbon development in China, but also in line with the concept of a “community of shared future for humankind”, which lays a solid foundation for the sustainable development of all humankind [16,17].
Greenhouse gases produced in aluminum electrolysis mainly come from a series of electrochemical reactions occurring at the anode/electrolyte interface (electrochemical carbon consumption accounts for about 80% of the total anode carbon consumption) [18,19,20,21].Since the industrial application of the Hall-Heroult method, many scholars have studied the electrochemical reaction process of carbon electrodes [22,23,24,25]. Ginsberg et al. [26] showed that the anode gas in the current density region above 0.05 A/cm2 was almost 100% pure CO2. Meanwhile the current density region below 0.05 A/cm2, more CO was produced. In addition to the composition of CO2 and CO during normal electrolysis, some other phenomena have also attracted the attention of scholars. Thonstad et al. [27,28] reported that there is a small amount of CF4 in the anode gas before the anode effect occurs. Researchers also observed this phenomenon in industrial electrolytic cells, and found that CF4 was produced when the local alumina concentration in the electrolytic cell was low, but C2F6 was not found [29,30]. This stage is obviously different from the anode effect stage, and it lasts for a long time, and the content of CF4 is low (0.4~2%). Dorreen et al. [31] detected COF2 gas before the anode effect occurred by a mass spectrometer, and they speculated that the CF4 at this stage was produced by the thermal decomposition of COF2. Jarek [32], Calandra [33] and Djoki et al. [34] studied the electrochemical behavior on a carbon anode by electrochemical methods and pointed out that an oxidation current peak in the potential scan map corresponded to the generation of COF2. However, direct evidence for the existence of COF2 was lacking. Whether COF2 will be generated is currently controversial in academic circles. Previous works generally used electrochemical methods to study carbon anode discharge mechanisms, while the electrochemical reaction at anode/electrolyte interface is actually on a microscopic scale and it is difficult to use conventional methods to study it, especially under high temperature and the strong corrosive molten salt system.
Based on the above-mentioned studies, to provide an insight into the mechanism of greenhouse gas generation on an atomic scale, here, we carried out a first-principles calculation to study the electrochemical reaction during normal electrolysis at the carbon anode/electrolyte interface, and to determine the priority discharge sites of the anions and the transformation of the anode structure after discharge. Moreover, a fluoride molten salt experiment was carried out to characterize the interface structure of the anode after electrolysis. By combining calculations with experiments, the formation mechanism of greenhouse gases during normal electrolysis is discussed, providing a theoretical basis for greenhouse gas reduction in the aluminum electrolysis industry.

2. Materials and Methods

2.1. First-Principles Calculation

2.1.1. Computational Hypothesis

There is a lack of theoretical methods to directly study the anode structure, ion movement and charge transfer process of the molten salt system under the effect of electrode polarization. In order to apply the existing quantum mechanical calculation methods to study the anode electrochemical reaction process, it is necessary to make approximate assumptions for the calculation:
  • The total energy change of O or F of the Al-F complex ion [F] and Al-O-F complex ion [O]2− in molten salt moving from the electrolyte to the anode surface for discharge, transferring charge and interacting with the anode is: ∆E = ∆Eef + ∆Eet + ∆Ebf, where ∆Eef is the work of the electric field to [O]2− and [F], ∆Eet is the energy change caused by the electron transfer of the electric field to [O]2 and [F] on the anode surface, and ∆Ebf is the energy change of Oanode and Fanode formed by the interaction of O and F atoms with the anode;
  • The surface potential of the anode on an atomic scale is equal. When [O]2− and [F] with the same number of charges move from the inside of the electrolyte to any position of the anode, the electric field does the same work;
  • The energy changes in O and F decomposed from [O]2− and [F] in the electrolyte moving to the anode surface and forming Oanode and Fanode are the same as those of [O]2− and [F] moving to the anode surface and forming Oanode and Fanode.
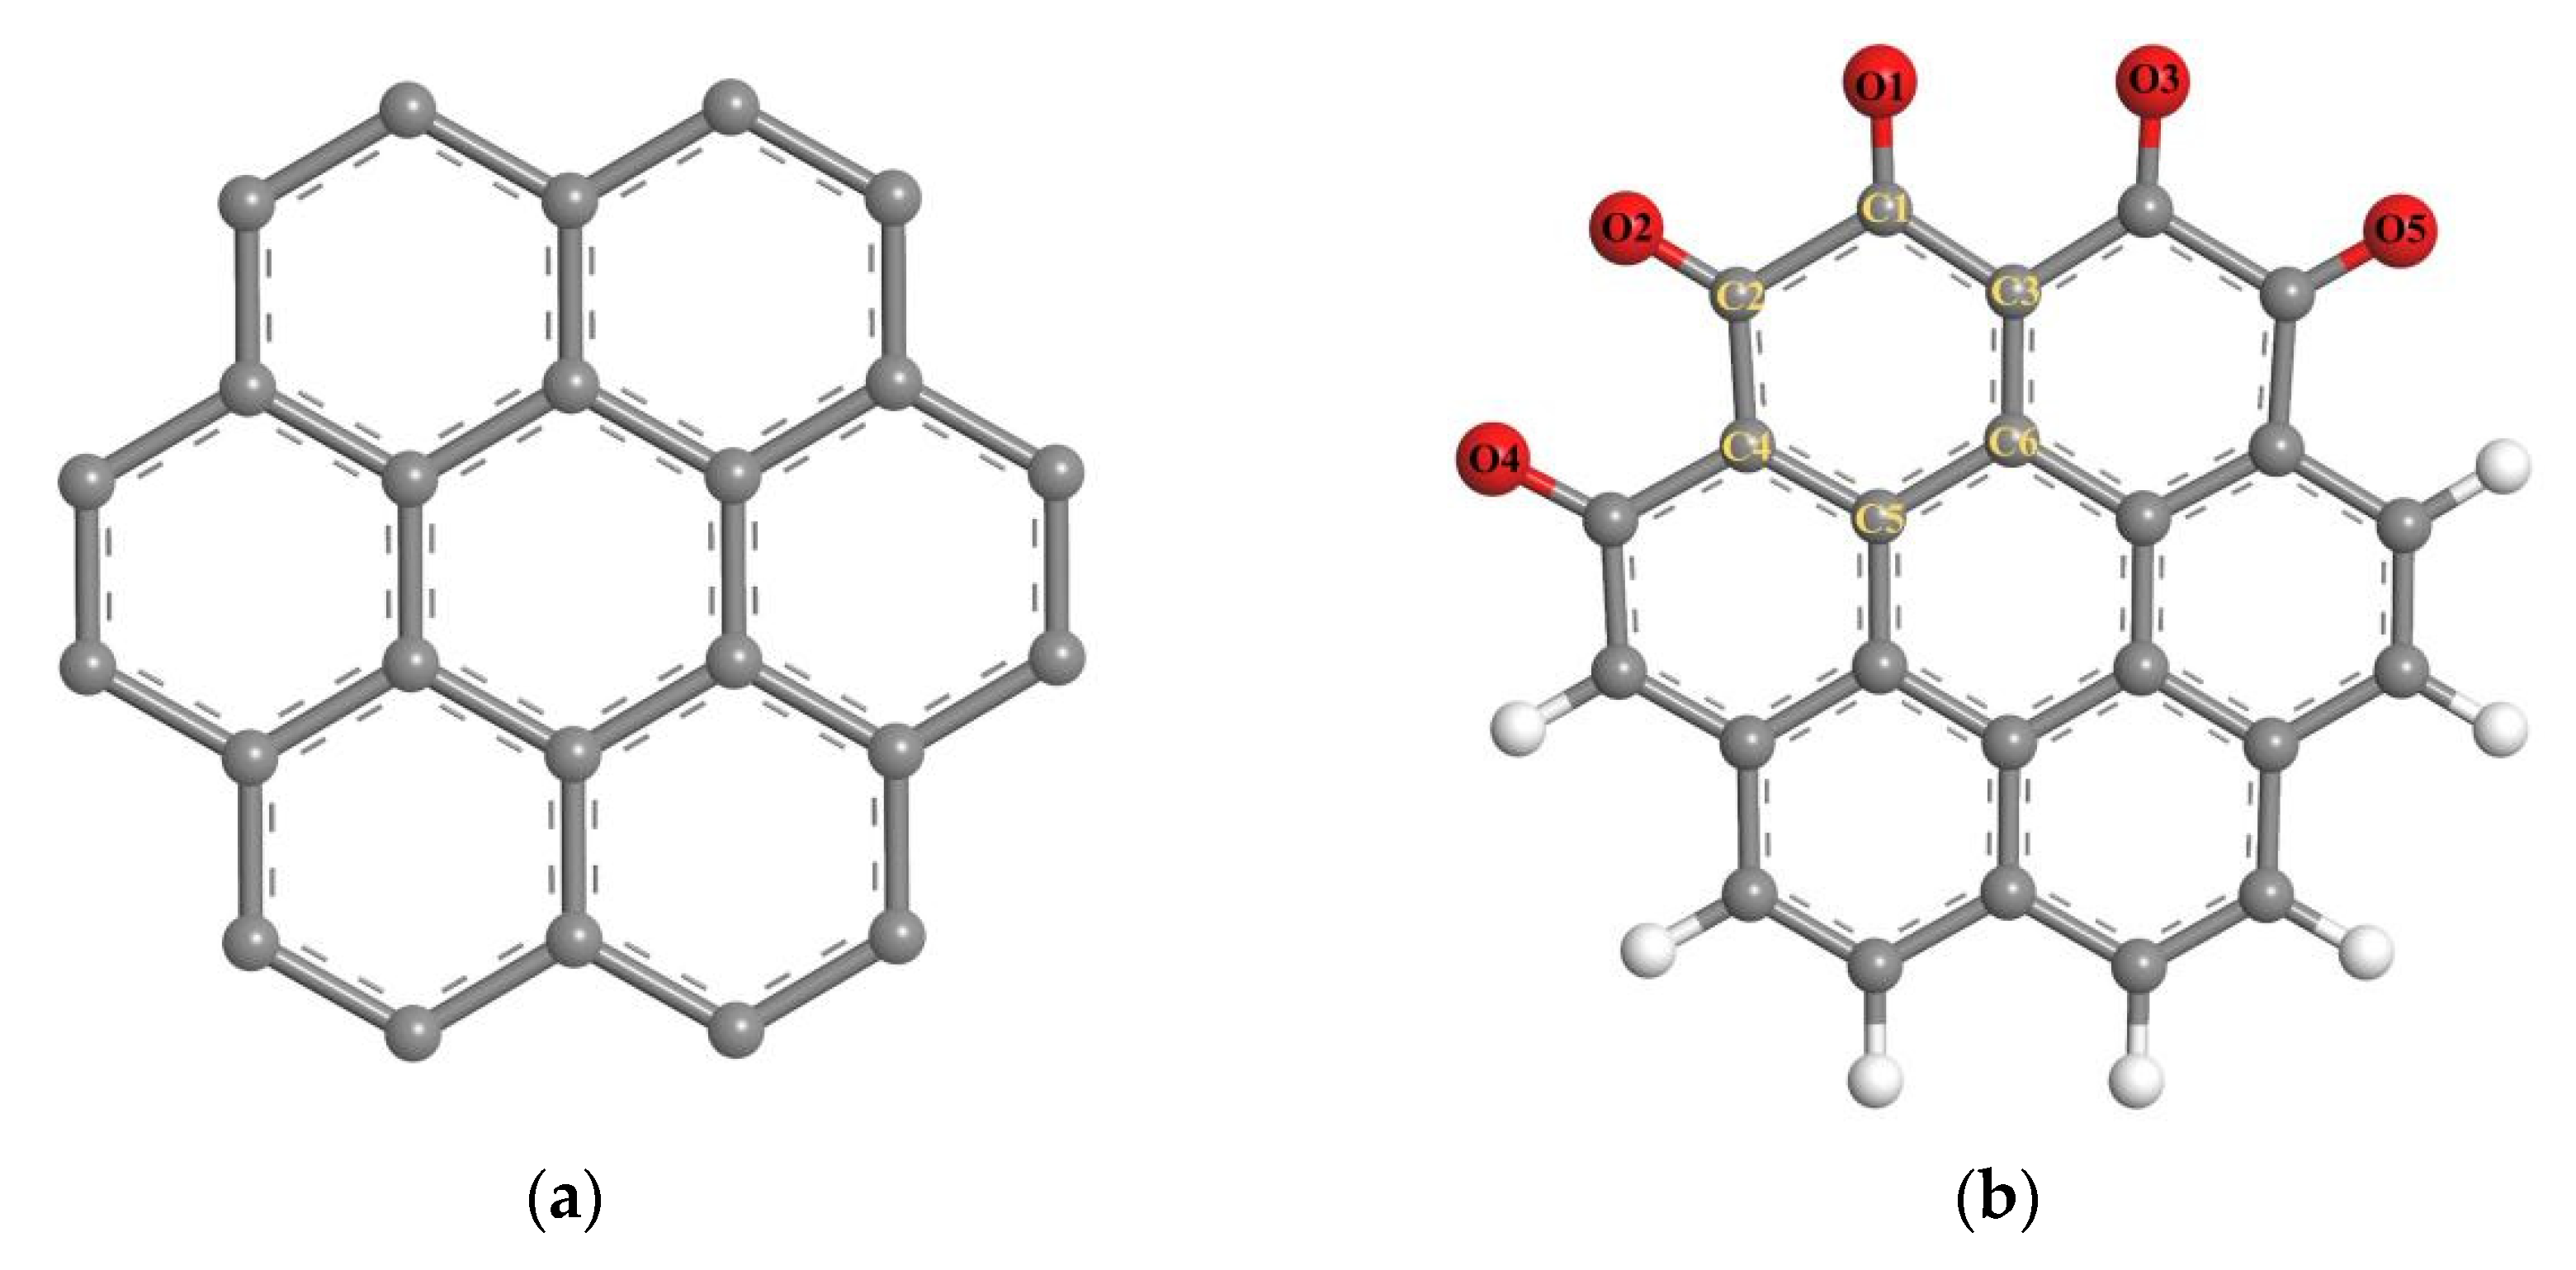
Through approximate assumptions, it can be considered that the total energy change ΔE in [O]2− and [F] transferred from the electrolyte to the anode surface and discharged to form Oanode and Fanode only depends on the value of ΔEbf. The discharge sequence of [O]2− and [F] at different sites on the anode surface depends on the relative energy of Oanode and Fanode formed at specific sites. Therefore, we used the adsorption energy at 0 K and Gibbs free energy at 1250 K to study the energy change in adsorbing.

2.1.2. Build Model

The prebaked anode for electrolytic aluminum is actually a micro-crystal of graphite with a layered structure, which is formed by the parallel accumulation of the basic structural unit carbon hexagonal network. Lei Y et al. [35] showed that the inter-layer spacing of graphite crystals is large and the inter-layer force is van der Waals force, which has little effect on the adsorption of atoms on the graphite surface. Under the condition of ensuring the reliability of calculation, this paper used the graphite fragment structure to replace the large-scale lamellar graphite structure of the anode (Figure 1a). During the discharge process of oxygen on the anode, oxygen ions first discharge on the edge and defect positions of the graphite lattice after crossing the electric double layer, and adsorb on the surface of the C atom to form a C=O group. The double bond adsorption of oxygen ions on the graphite crystal is the most stable. On the basis of previous studies, in our mode (Figure 1b), which is defined as Model A, the O atom was adsorbed on part of the edge of the graphite lattice to form -C=O, and the rest of the edge was bonded with H to form a saturated state. C and O atoms in Model A that may participate in the next step of the reaction were labeled for subsequent description.

2.1.3. Computing Method

The first-principles calculation in this paper was based on density functional theory (DFT), using Dmol3 in Material Studio 2017 software (Accelrys Inc., San Diego, CA, USA). According to the characteristics of the model and calculation efficiency, the GGA-PBE function and DNP basis set were selected for calculation, and the calculation accuracy was FINE. The self-consistent convergence conditions were as follows: the total energy converges to less than 1 × 10⁻⁵ Ha, the force on each atom is less than 0.002 Ha/Å and the convergence precision of displacement is 0.005 Å. The optimized C-C bond length is 0.142 nm, which is consistent with the standard bond length of the graphite structure. This shows that the parameter values selected above can achieve good calculation results.
In order to study the adsorption behavior of oxygen and fluorine on the anode surface, the adsorption energy was used to illustrate the bonding stability at different sites. The calculation formula of the adsorption energy (Eads) was defined as
Eads = Etot − Eatom − EModel A
where Etot is the total energy of Model A after oxygen/fluorine atom adsorption; Eatom is the energy of an oxygen/fluorine atom; EModel A is the energy of Model A; Eads > 0 means an endothermic reaction and Eads < 0 means an exothermic reaction. The larger the absolute value of Eads, the more stable the corresponding adsorption structure, and the greater the possibility of the formation of this structure.
In order to determine whether the reaction between oxygen/fluorine atoms and the surface of the anode can occur spontaneously, Gibbs free energy of the reaction was calculated to determine the direction of the reaction. The vibration analysis calculation in Dmol3 can estimate the thermodynamic properties of the reaction. In this paper, the influence of the reaction temperature was considered, and the correction thermodynamic parameters at the electrolytic temperature of 1250 K were taken. The Gibbs energy barrier calculation formula is as follows:
∆G = Gproduct − Greactant
where Gproduct is the Gibbs free energy of the product, namely, the sum of electron energy, zero-point vibration energy and corrected Gibbs free energy; Greactant is the Gibbs free energy of the reactants; and ∆G > 0 means the reaction does not occur spontaneously, while ∆G < 0 means the reaction can occur spontaneously at the specific temperature. The greater the absolute value of ∆G, the greater the tendency of the reaction. According to thermodynamic theory, the rate of elementary reaction at a given temperature depends on the Gibbs energy barrier at that temperature. By comparing the Gibbs energy barrier, the reaction rates of the elementary elements can be qualitatively determined, in order to determine the relative rates between different reaction paths and the speed control steps.

2.2. High Temperature Molten Salt Experiment

A high-purity artificial graphite crucible (Hunan Huatuo Carbon Co. Ltd., Yiyang, Hunan, China, commercial product) was used as a reaction cell, and the reaction electrode was composed of a high-purity artificial graphite rod (d = 5 mm) and a pyrolytic boron nitridtube (BN). The bottom end of the exposed electrode was dipped into the molten salt as the electroactive surface, and the crucible consisted of 0.05 wt% Al2O3, 54.53 wt% NaF and 45.42 wt% AlF3, which represents a cryolite–alumina molten salt with a cryolite ratio of 2.4 (the molar ratio of NaF/AlF3), among which cryolite was synthetic cryolite and alumina was an analytically pure experimental reagent. Before the experiment, the required reagent was placed in a drying oven to dry for 24 h. After preparation, the crucible with the electrolyte was put into the a self-made well furnace, and equipped with CW-3100 temperature controller for heating. The MPS705 DC steady current and voltage supply (0~60 V/0~20 A) is selected to control the constant voltage input. The experimental temperature of electrolysis was 1273 K, the control current density was 1.0 A/cm2 and the electrolysis lasted for 1.5 h. The anode was removed from the electrolyte before electricity black-out to minimize the adhesion of the electrolyte to the surface of the anode. The surface of the electrolyzed graphite anode was cut after air cooling. The sample surface was analyzed by scanning electron microscopy (SEM) and X-ray photoelectron spectroscopy (XPS), respectively, in order to obtain the surface morphology of the graphite electrode and the chemical valence states of each element.

3. Results and Discussion

During the electrolysis process, [O]2− and [F] are always involved in the anode reaction, whether it is to generate carbon oxides or fluorocarbon compounds, but the discharge priorities of the two are different. Since the discharge potential of oxygen is lower than that of fluorine, [O]2− will preferentially cross the double electric layer of the electrode and then discharge and adsorb on the surface of the carbon anode. The carbon anode will be gradually oxidized and generate CO and CO2. This stage is called the [O]2− preferential discharge stage, and the reaction diagram is shown in Figure 2a. When the concentration of Al2O3 near the anode decreases gradually, the number of fluorine ions in the complex ions increases relatively, leading to the possibility of [F] discharge. When [F] discharges, the anode has been consumed due to the previously released CxO, meaning the reaction interface is not smooth and the electrode surface is covered with CxO compounds. In this case, [F] may continue to discharge on CxO to generate fluorocarbons. This stage is called the [O]2−, [F] co-discharge stage, and the reaction diagram is shown in Figure 2b.

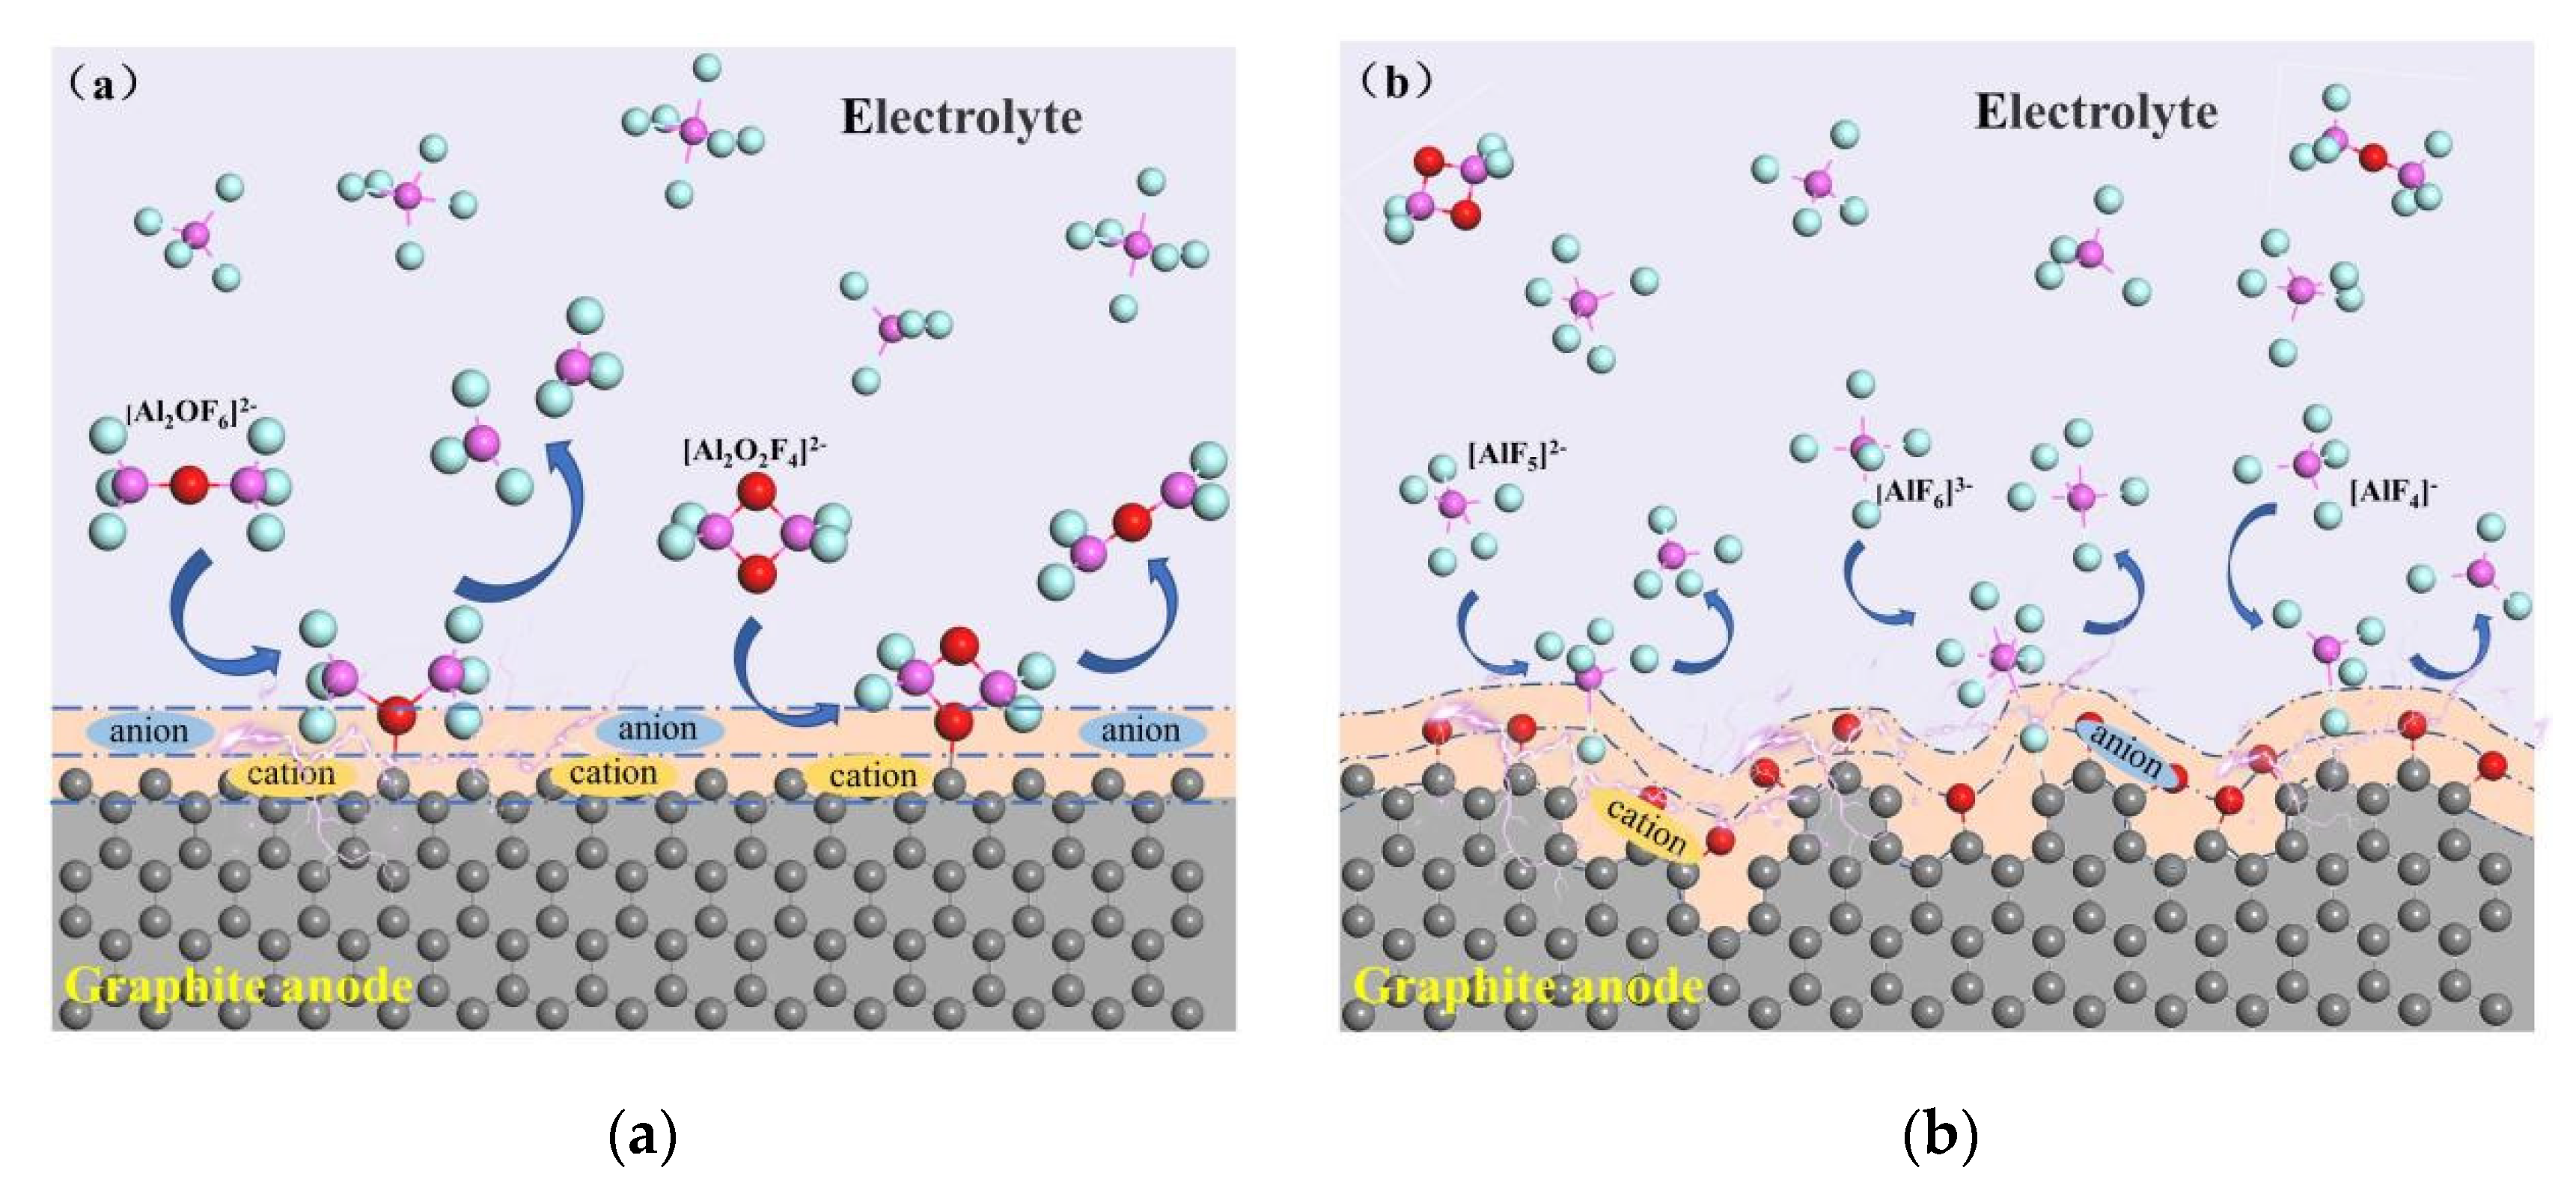
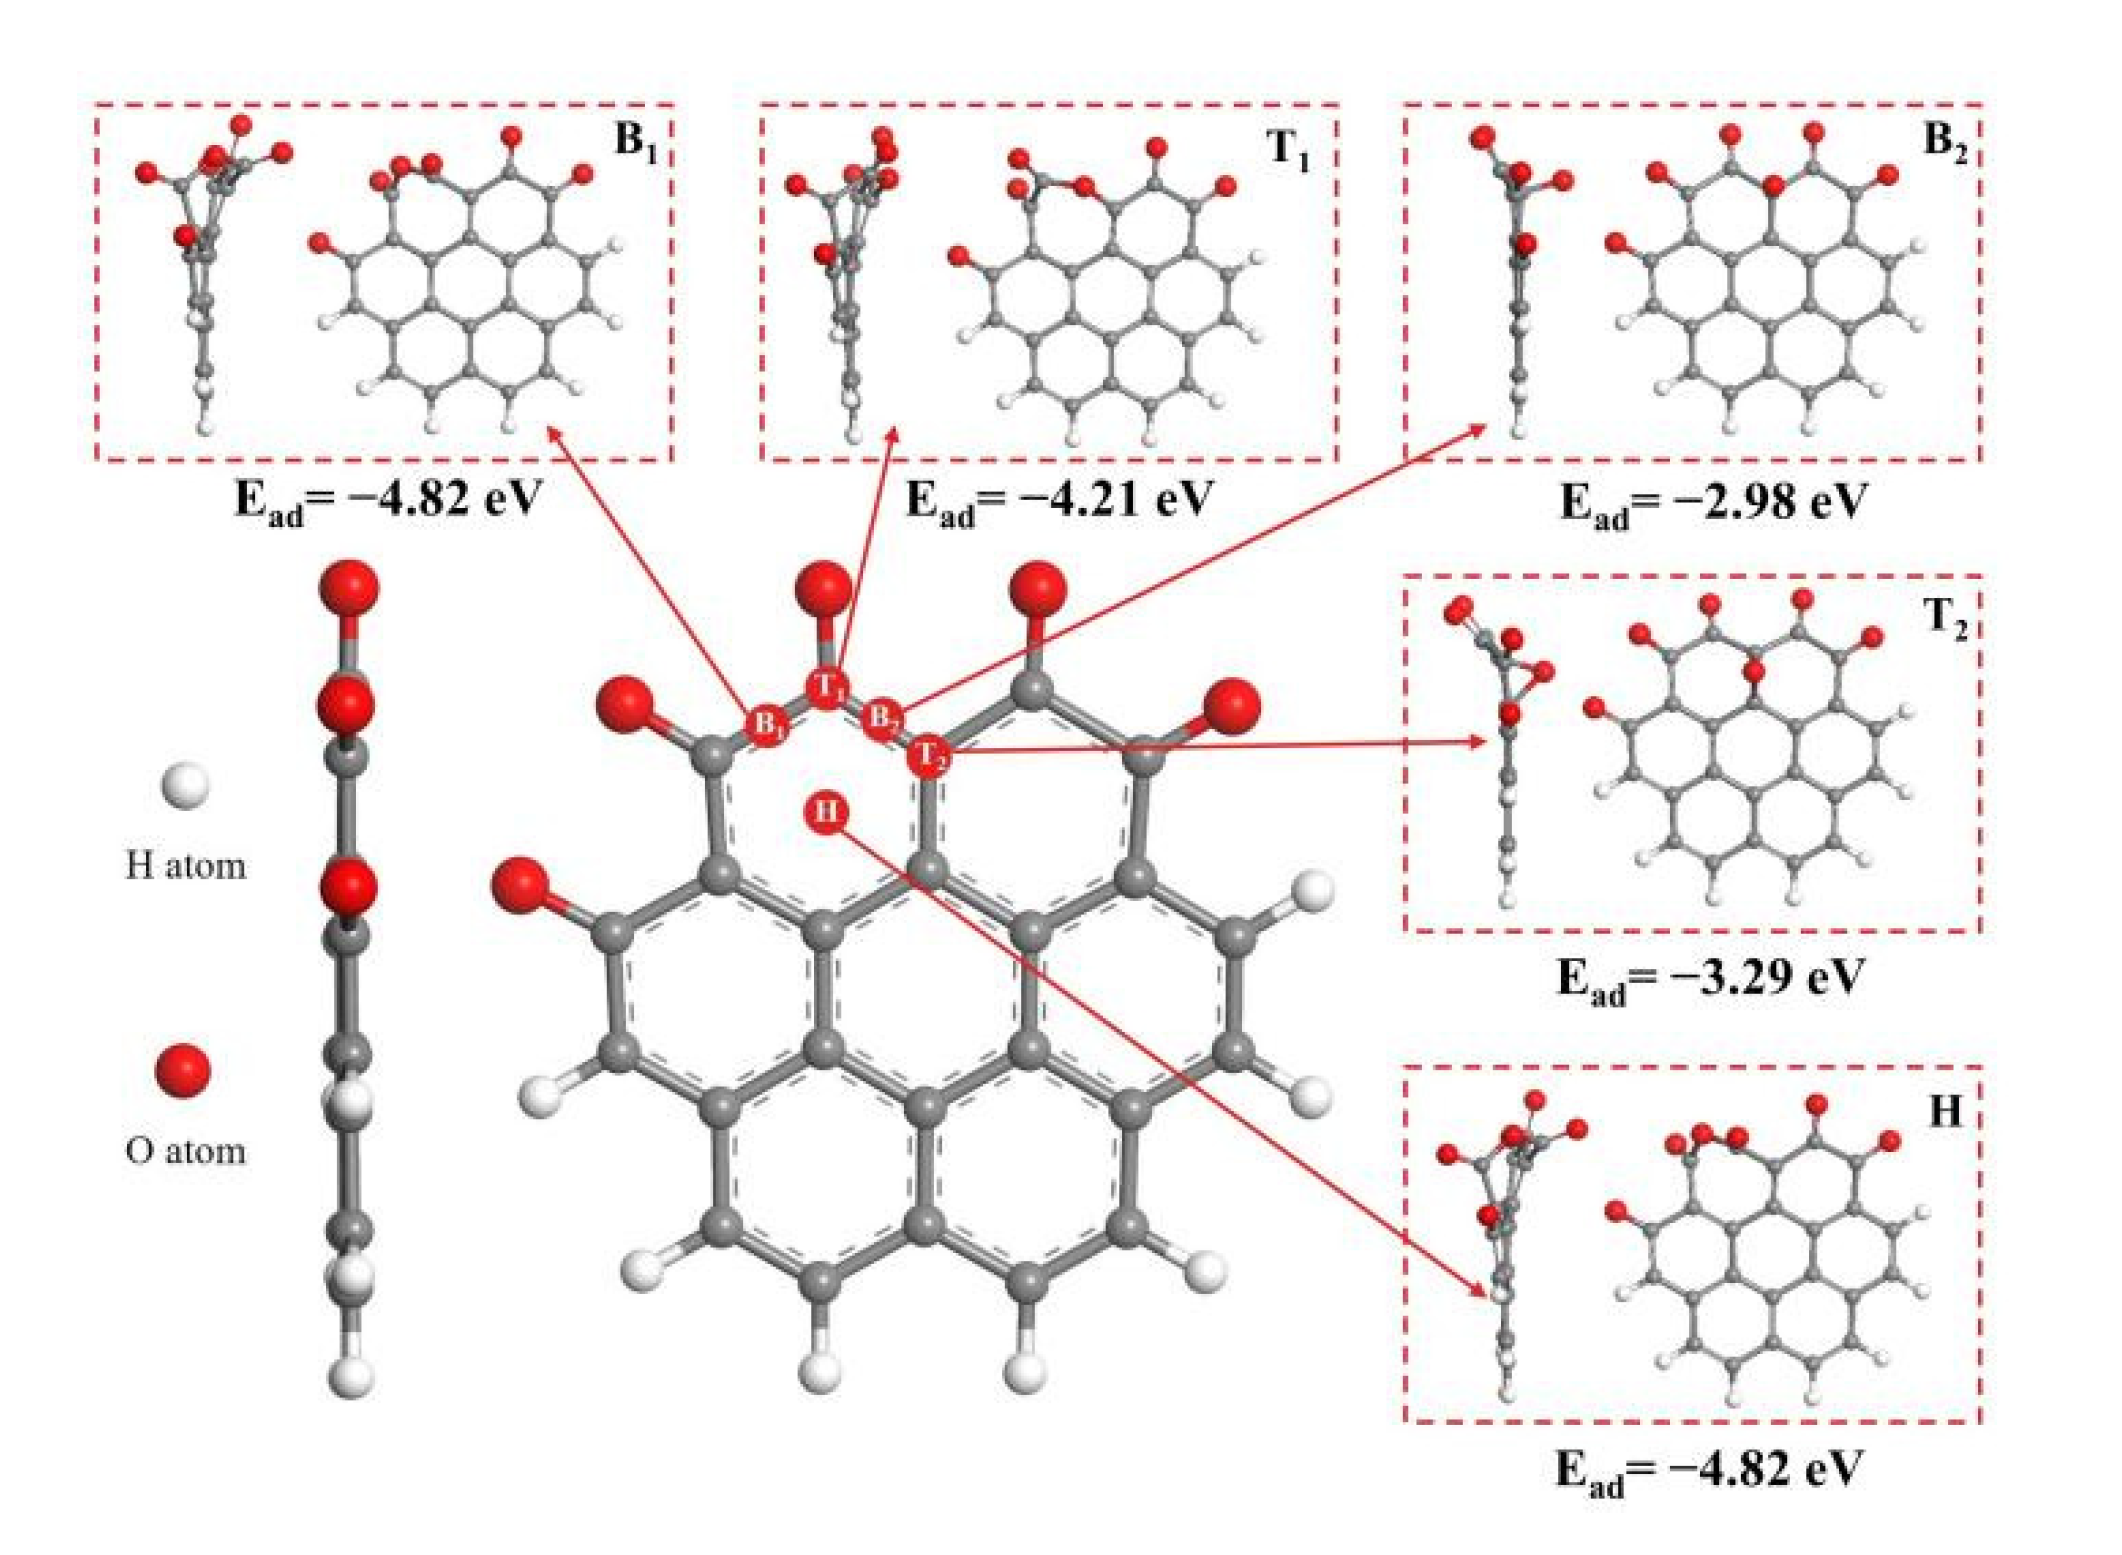
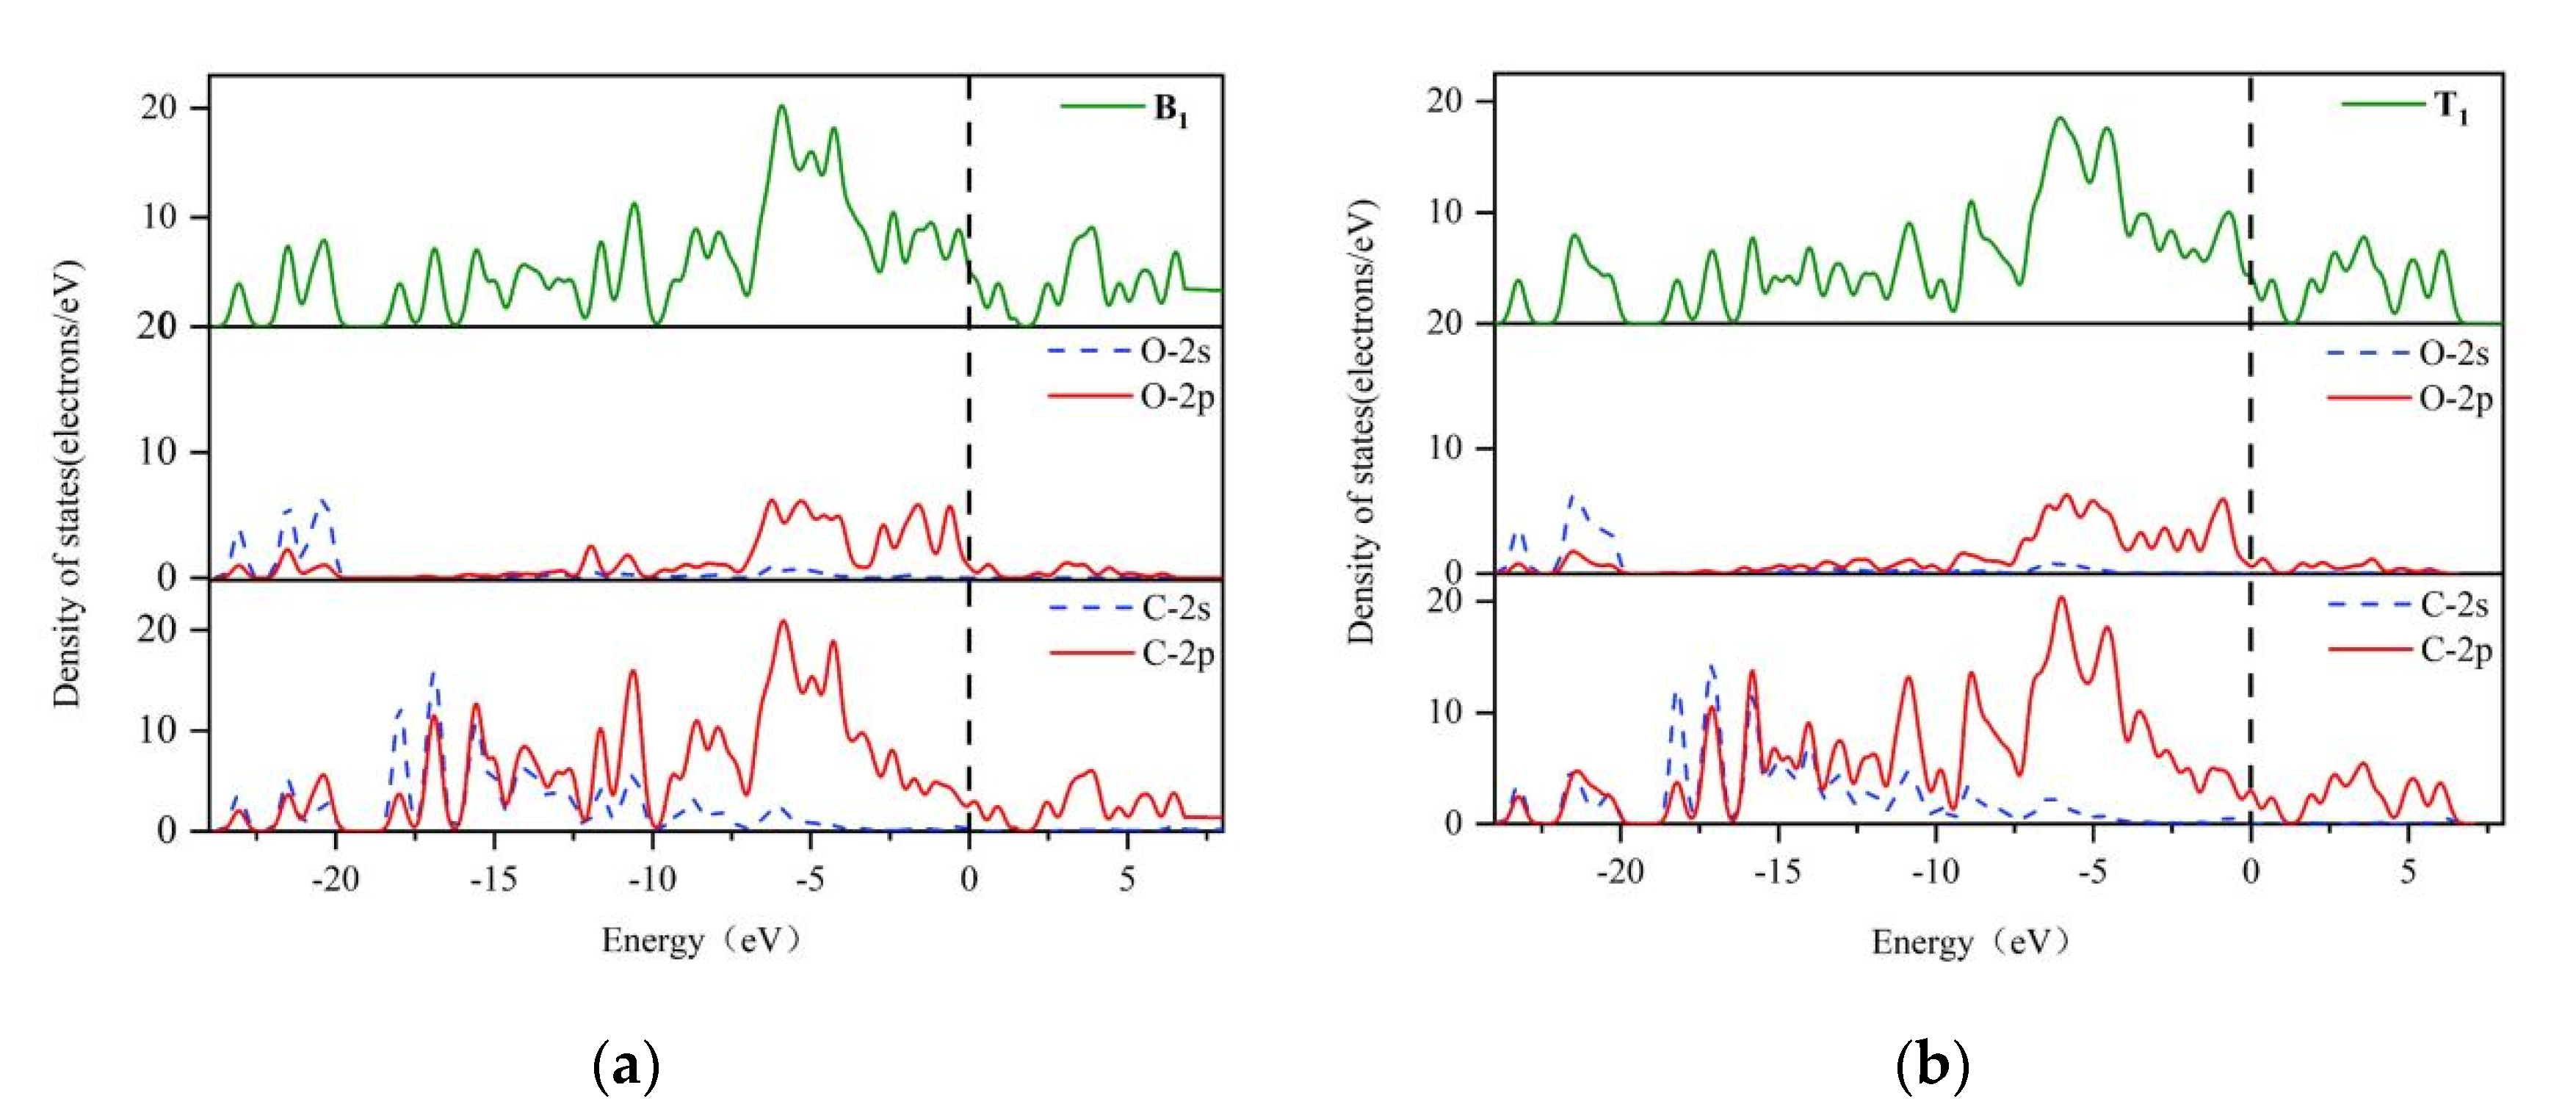
3.1. Reaction at [O]2− Preferential Discharge Stage
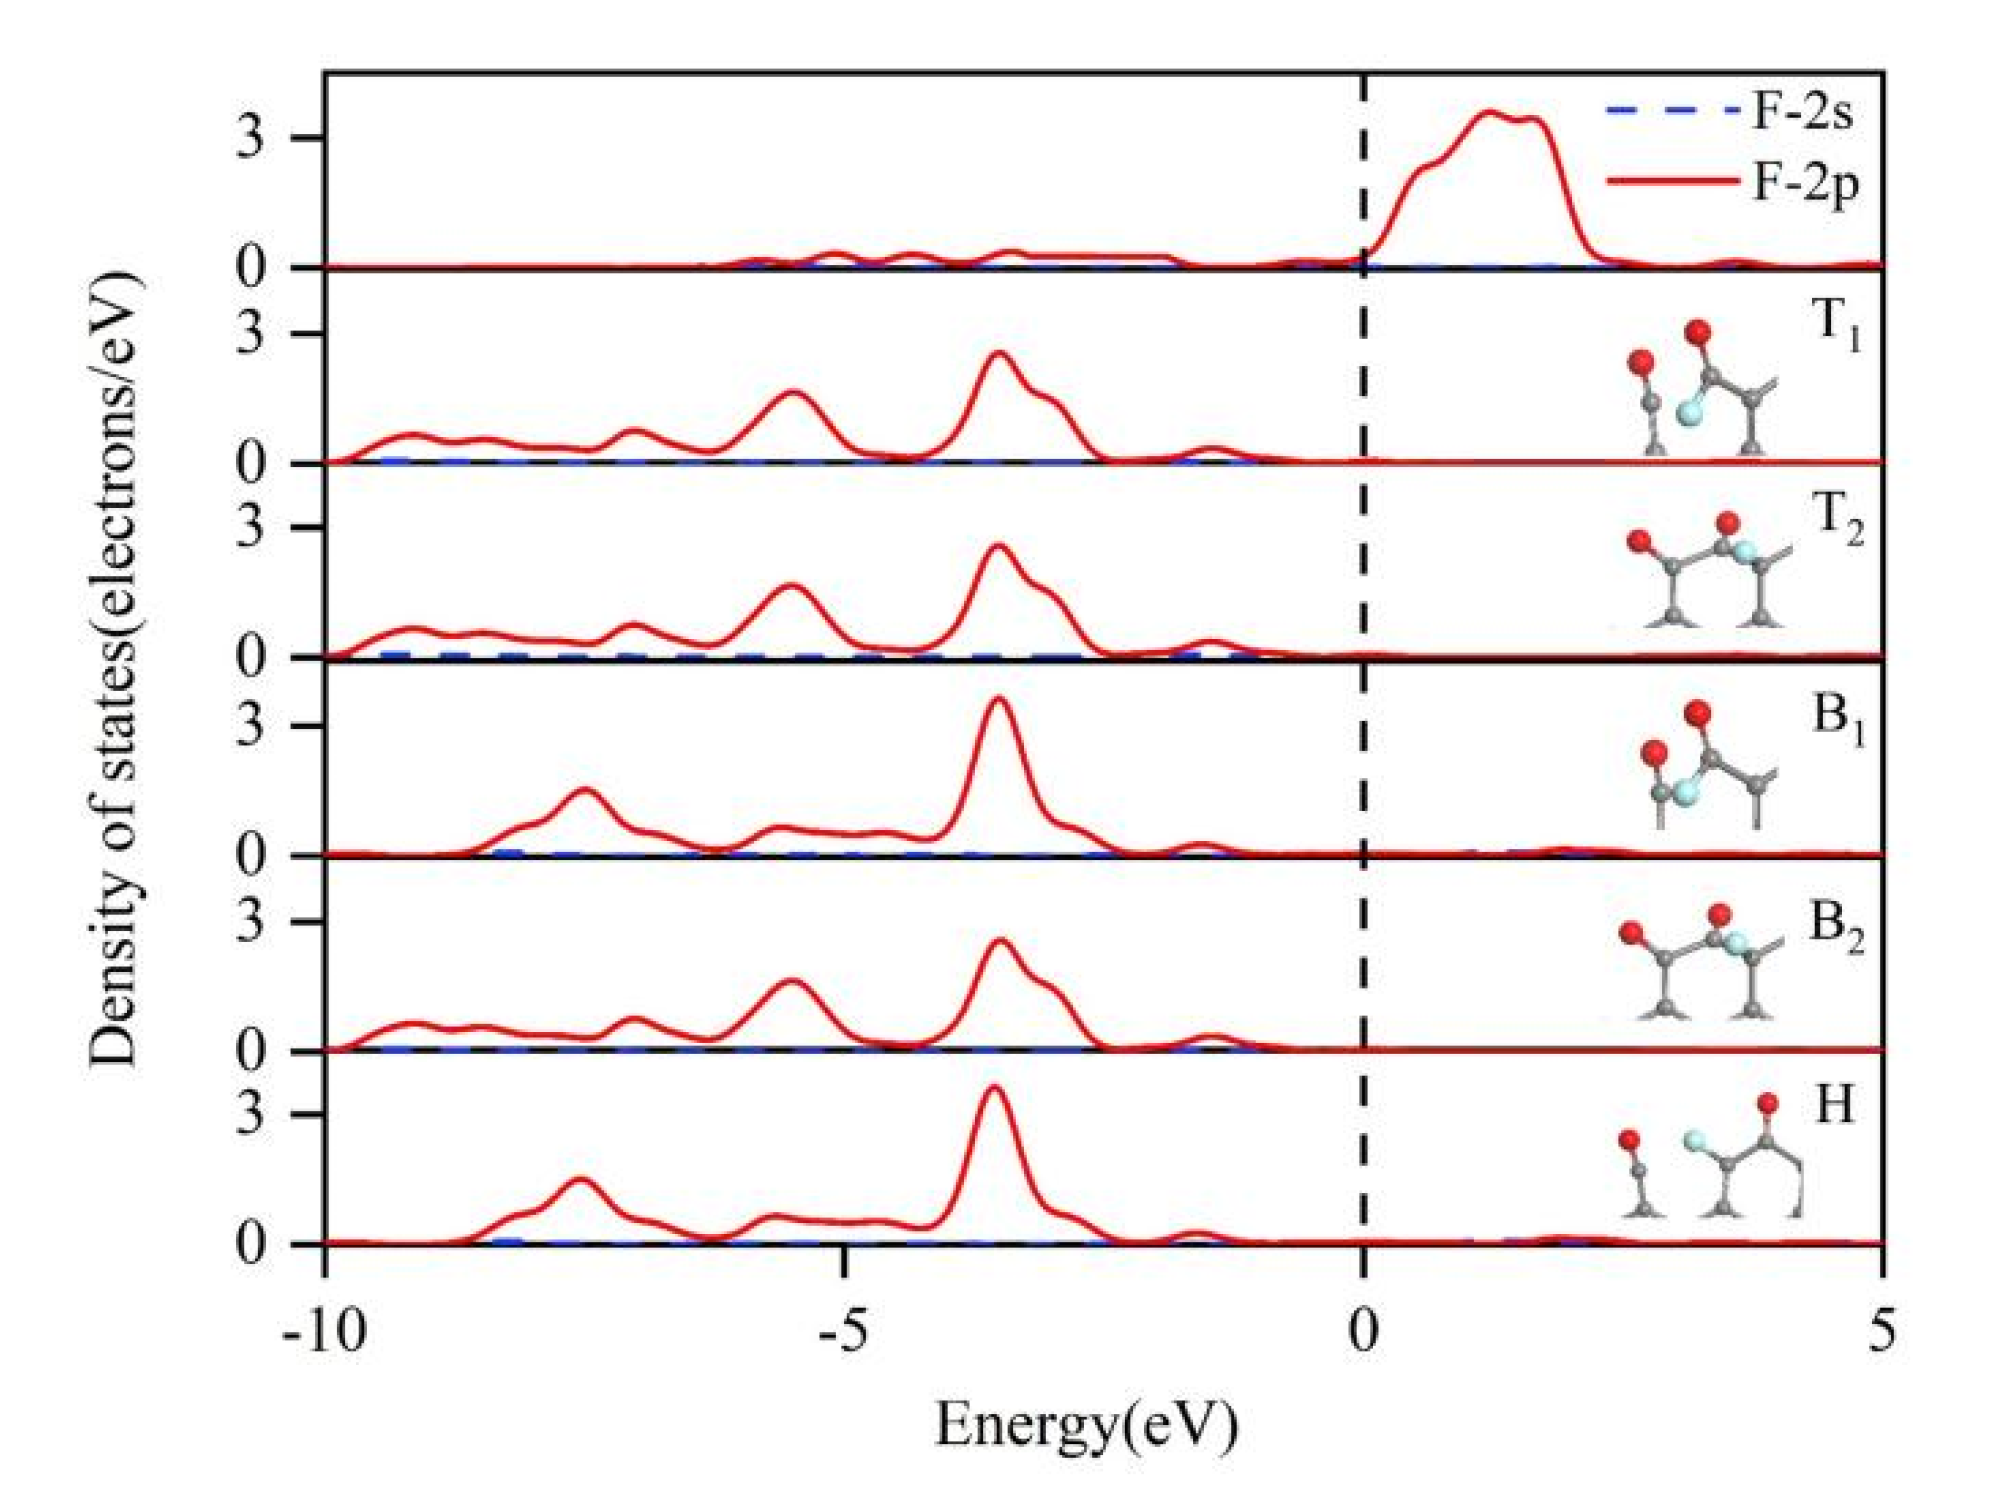
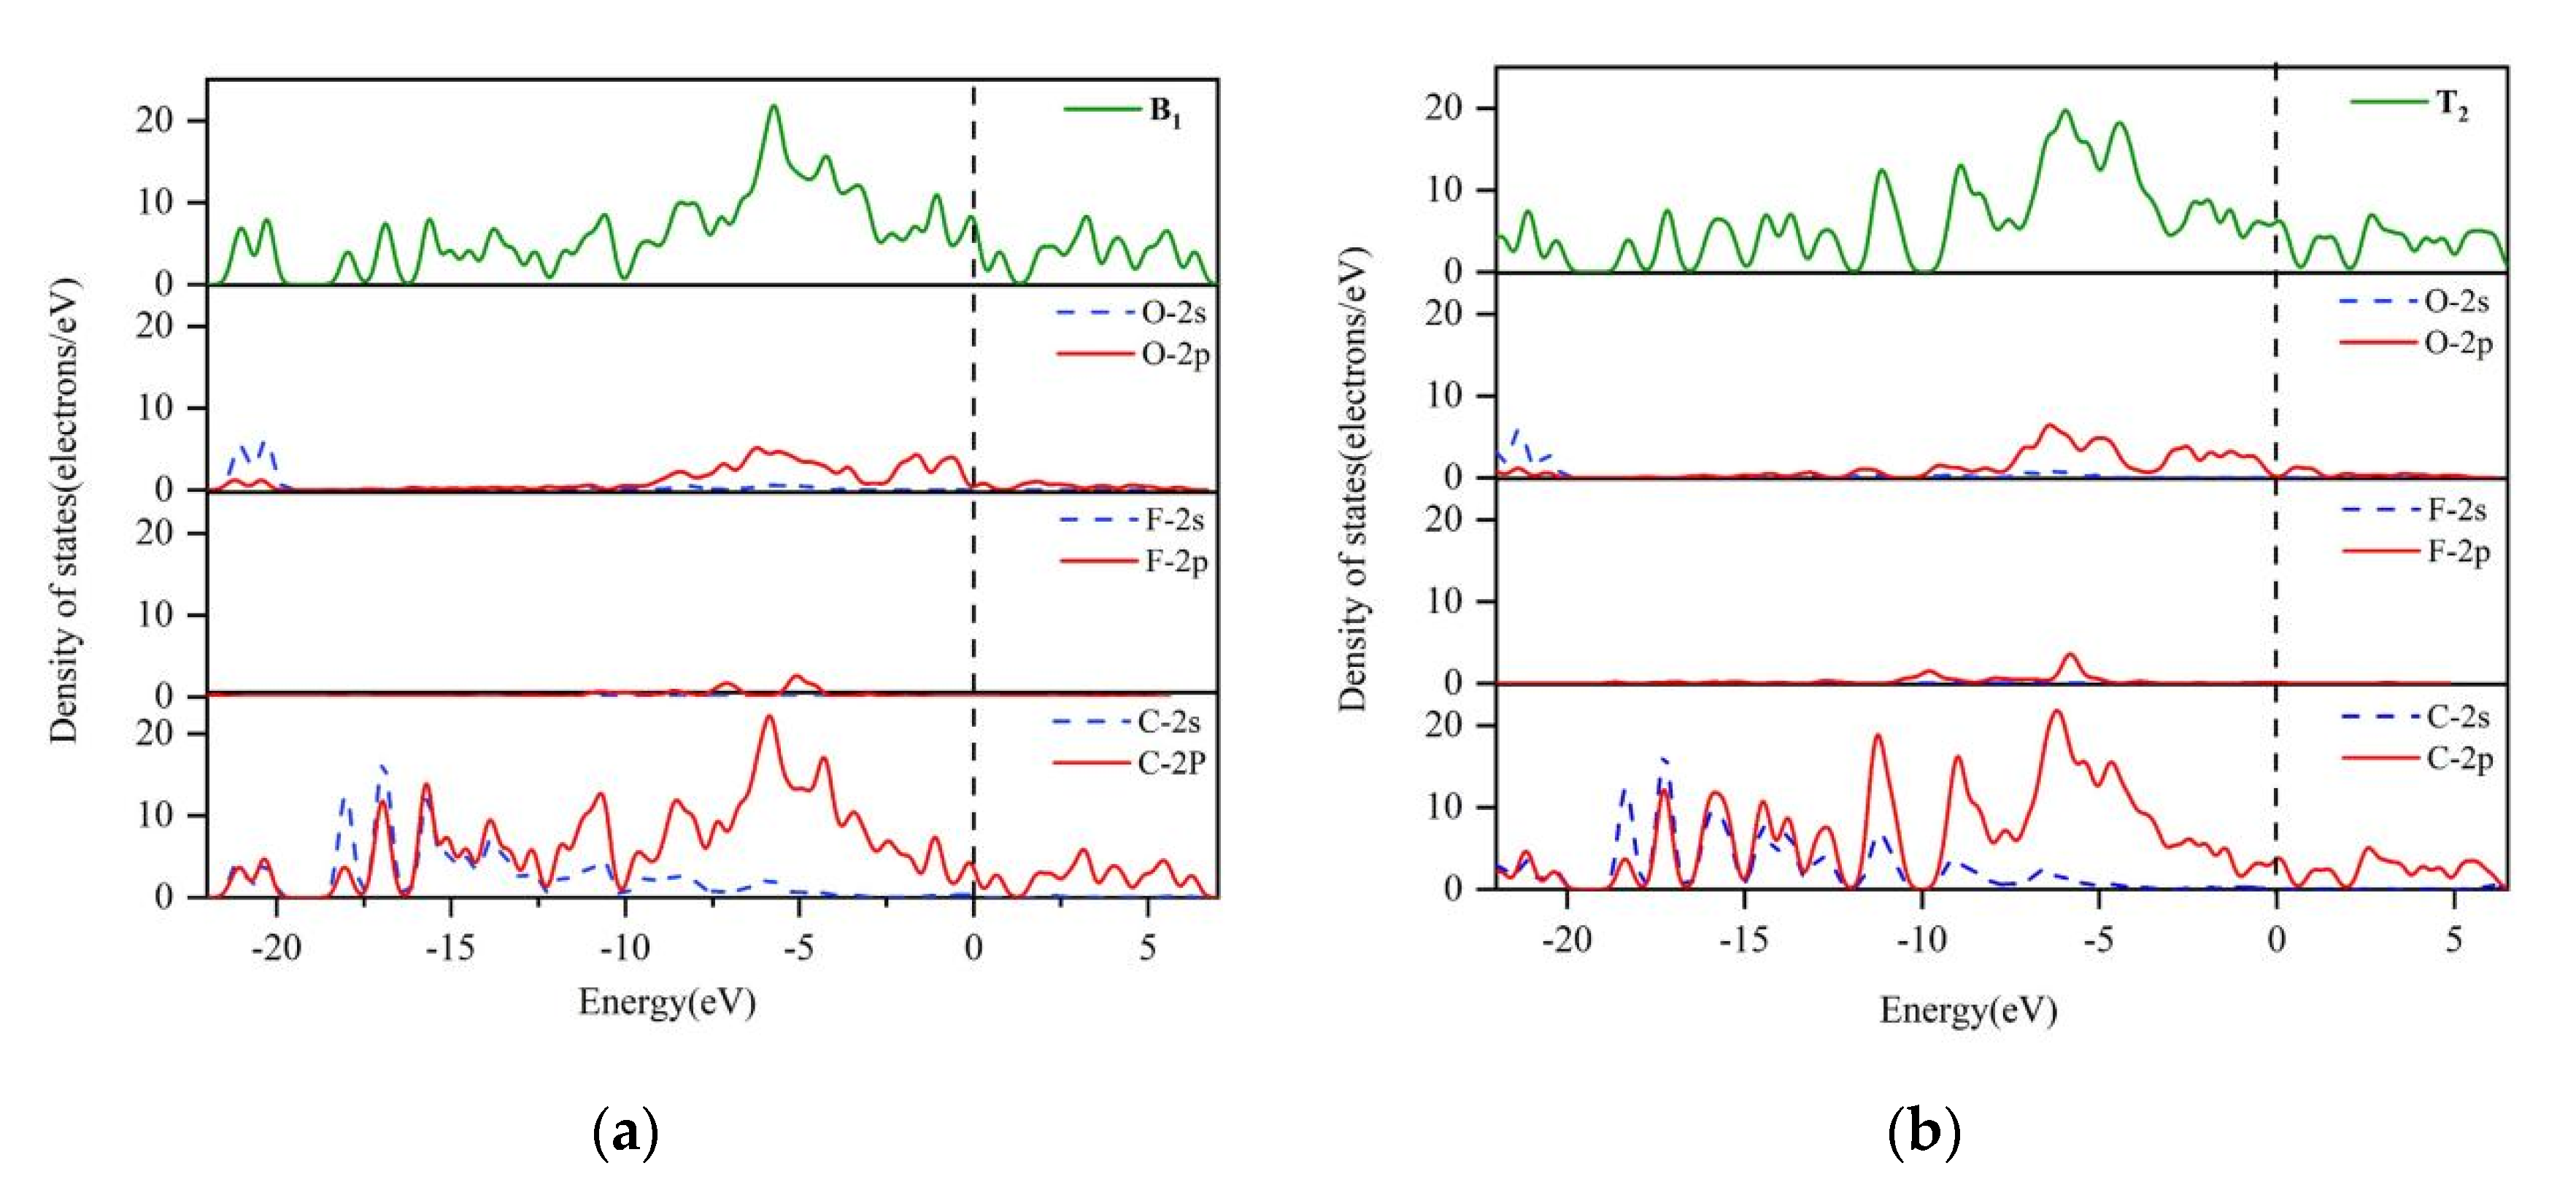
There are three high symmetric adsorption sites on graphite, the top site, the bridge site and the hollow site, which are directly above the positions of carbon atoms, carbon-carbon bonds and hexagonal carbon rings, respectively. The possible adsorption sites on Model A are divided into five sites: two top sites of T1 and T2, two bridge sites of B1 and B2, and a hollow site of H, as shown in Figure 3. When the O atom is adsorbed on the anode surface, the adsorption energies of T1, T2, B1, B2 and H are −4.21 eV, −3.28 eV, −4.82 eV, −2.97 eV and −4.82 eV, respectively. The calculation results of the adsorption energies of B1 and H are similar, and the configuration formed after adsorption is the same. This indicates that no matter whether the O atom is in the hollow site or the B1 site, C1-C2 in the original O1=C1-C2=O2 structure will break and form a new O1=C1-O-C2=O2 structure. When the O atom is at the T1 site, the C1-C3 bond in the original O1=C1-C3-C6 structure will break and a new O1=C1-O-C3-C6 structure will be formed. When the O atom is at the B2 site, it may attach to a C atom in the middle of the original carbon ring to form a -C3-O single bond. When the O atom is at the site of T2, it may attach to the two C atoms in the middle of the original carbon ring, forming a C3-O-C6 bond. Based on the adsorb energy, the adsorption preference of the O atom at different sites is B1 = H > T1 > T2 > B2.
The preferential adsorption sites of the O atom were analyzed from the perspective of electronic structure. The density of states of the O atom adsorbed at different sites on the surface of Model A and the projected density of states of the O atom before adsorption were calculated, as shown in Figure 4. Both 2s and 2p orbitals of oxygen shift toward lower energy levels after adsorption, which reduces the energy of the O atom, so the O atom after adsorption is more stable. By integrating the density of states curves of O atoms after adsorption on different sites and setting the upper limit at Fermi level (shown by the dashed vertically line in the figure), it is found that the integral value is the largest when the O atom is adsorbed at B1 and H sites. This indicates that the number of electrons with energy lower than the Fermi level is largest when the O atom adsorbs at the B1 and H sites, meaning these two structures are the most stable. While the energy of the O atom adsorption at B2 does not change much compared with that before adsorption, indicating that the configuration after adsorption is not stable. The results of the density of states are in accordance with the adsorption energy calculation.
To disclose the bonding structure between the adsorbed O atom and the C atom of the anode surface, the density of states of the system was analyzed. Figure 5a,b, respectively, show the total density of states of the system and the projected density of states of oxygen and carbon atoms when oxygen is adsorbed at the surface sites B1 and T1. It can be seen from Figure 5a that the peak near −24~−20 eV mainly come from the hybridization of O 2s and C 2p orbits, and the contribution from −19~−7 eV is almost all from C 2p orbits. The peak near −7~0 eV is mainly the hybridization of O 2p and C 2p orbitals. O 2p and C 2p orbits between −7 eV and the Fermi level resonance to form six peaks, and the peak of the total state density here is approximately equal to the sum of the peak of O 2p and C 2p, indicating that the energy level has ionic bond characteristics. In this region, orbits O 2p and C 2p show severe splitting, which aggravates orbital hybridization and thus is favorable for bonding. Therefore, the main bonding behavior between oxygen and carbon comes from the hybridization of O 2p and C 2p orbitals. The same bonding behavior is observed when oxygen is adsorbed at the surface at T1, as shown in Figure 5b.
After confirming the preferential discharge sites of the O atom on the anode surface, the transformation of anode structure when the O atom continues to adsorb was then studied. The initial configuration of the second step of the reaction was taken as the position after adsorption on B1 and T1. The next possible oxygen adsorption sites were studied by the C-O bonding energy. Through calculation, there are 6 most likely paths of adsorption, as shown in Figure 6a. The first three paths start from the adsorption site B1, and the last three paths start from adsorption position T1. All six paths end up producing CO2, and Paths 2 and 5 also produce CO. This indicates that the O atom bonds with the C atom on the anode surface and destroys the stability of the benzene ring of the graphite sheet layer on the anode surface, resulting in the removal of carbon oxygen compounds from the anode surface and the formation of final products CO and CO2. The reaction path generated by CO can be described as the following three steps, where QCO is the heat transferred through the Joule heat of the polarization and resistance surface layer:
Step1: [O]2− − 2e + xC = CxO
Step2: CxO = CO(ads) + (x − 1) C
Step3: CO(ads) + QCO = CO (g)
The CO2 generation process can be described as the following four steps according to the reaction path, where QCO2 is the heat transferred through anode polarization:
Step1: [O]2− − 2e + xC = CxO
Step2: CxO + [O]2− − 2e = CxO·O
Step3: CxO·O = CO2(ads) + (x − 1) C
Step4: CO2(ads) + QCO2 = CO2 (g)
The complex ions transfer charge and leave O in the anode interface to interact with the surface C (bonding) in the molten salt, and this C-O interaction will destroy the stable structure of the carbon anode and promote the formation of CO and CO2.
The changes in the Gibbs free energy and adsorption energy of different configurations in six possible paths were calculated, as shown in Figure 6a,b. This shows that at 1250 K, Gibbs free energy of the six paths shows a decreasing trend, indicating that the reaction of CO and CO2 generation is spontaneous. Reaction step 4 in Path 4, 5, and 6 corresponds to the structure of l, o, q. Compared with step 3, the energy has increased, but they further decreased in step 5 to generate the final product. Through the structure of l, o, q, it can be seen that the broken C-C bonds lead to the destruction of benzene ring structure. Through the structure of T1, k and n, it can be seen that O atoms are inserted between C-C bonds to form C-O-C bonds, while the ring structure is not destroyed, indicating that the process of the CxO bond breaking to form CO(ads) and CO2(ads) is the most difficult stage of the whole chemical reaction compared with the process of forming CxO by O adsorption. Therefore, the CxO = CO(ads) + (x − 1) C and CxO·O = CO2(ads) + (x − 1) C are the rate-controlling steps of the reaction. This is consistent with the previous conclusion obtained by the potential scanning method, which verifies the reliability of the calculation.
Compared to the initial configuration, j has the lowest energy, which means this configuration is the most stable, and Path 3 is the most likely path for CO2 formation. From the perspective of thermodynamics, the occurrent possibility of the six paths are: Path 3 < Path 1 < Path 6 < Path 2 (to generate CO) < Path 5 (to generate CO) < Path 4. CO2 has a lower reaction energy barrier than CO, meaning it is easier to generate CO2 than CO. During aluminum electrolysis, the voltage (balance voltage + anode over-voltage) after anodic polarization is about 1.6~1.65 V [36]. Such a high electrode potential, both from the thermodynamic and electrochemical points of view, is beneficial to the generation of CO2. The calculation results verify previous experimental research and industrial measurement at the microcosmic level.
To better describe the structural change, the adsorption energy of each structure was analyzed, as shown in Figure 6c. Structure changes in Path 3 were analyzed as a typical example. Step 1: the O atom firstly breaks the original “C1-C2” bond to form a “C1-O-C2” bond and obtain structure B1 with an adsorption energy of −4.82 eV. Step 2: the O atom breaks the “C3-C7” bond and forms the structure e with “C3-O-C7” bond, and the adsorption energy is −4.34 eV. Step 3: the O atom breaks "C2-C4" bond and forms “C2-O-C4” bond, leading to structure H with a adsorption energy of −4.67 eV. Step 4: the O atom breaks “C4-C5” bond and forms “C4-O-C5” bond, resulting in structure I with a adsorption energy of −2.99 eV. Step 5: the O atom destroys the carbon ring, and the C1 and C2 bond connects O atoms to form CO2, forming structure j with an adsorption energy of −8.48 eV. Other reaction Paths are similar to Path 3. In conclusion, the O atoms firstly discharge on the edges after crossing the double layer, and then adsorb on the surface of C atoms to form a C=O double bond. When the surface C atoms are all bonded with O, O atoms will be adsorbed again to break the original C-C bond and form a C-O-C structure, resulting in CxO structure. O atoms continue to adsorb and discharge on the anode surface, and the CxO structure changes into the CxO·O structure. At this stage, the continuous bonding of O atoms and C atoms destroys the stability of the carbon ring in the graphite sheet layer, leading to the cracking of the carbon ring. Finally, carbon oxygen compounds leave from the anode surface in the forms of CO2 and CO.

3.2. Reaction at [O]2−, [F] Co-Discharge Stage

After reaching the [F] discharge voltage, [F] will discharge on the CxO surface, which leads to competitive adsorption between O and F. To compare with the [O]2− preferential discharge stage, the same initial configuration was used, and the five types of the most likely adsorption sites were also identical, as shown in Figure 7. When F is adsorbed on the surface of Model A, the adsorption energies of T1, T2, B1, B2 and H are −3.33 eV, −2.64 eV, −3.33 eV, −2.63 eV and −2.35 eV, respectively. The calculated results of adsorption energies of B1 and T1, and B2 and T2 are similar, and the configuration formed after adsorption is the same. When F atoms are adsorbed at the B1 and T1 positions, C1-C2 bonds in the original structure will be broken and the carbon ring structure will be destroyed. When adsorbed on B2 and T2, the structure of the carbon ring was not destroyed, and the F atom was adsorbed on C3. At the H adsorption site, the structure of the carbon ring is destroyed and CO is released. According to the size of the adsorption energy, the adsorption probability of F at different sites is B1 = T1 > B2 = T2 > H.
The preferential adsorption sites of fluorine were analyzed from the perspective of the electronic structure. The density of states of fluorine atoms adsorbed on different positions of the anode surface and the projected density of states of fluorine atoms before adsorption were calculated, as shown in Figure 8. It can be seen that the F 2s and F 2p orbitals shift to the left after adsorption, and the energy of fluorine atom decreases, which indicates that the F atom is more stable than the isolated F atom when F is adsorbed on the surface of CxO. However, compared with the adsorption of O on the graphite surface, the energy of the F atom at the Fermi level is very low, and the energy change after adsorption is not large, indicating that the stability of these structures is close and the stability of C-F bonding is far less than that of C-O bonding.
To further study the bonding characteristics of O, F and C atoms during O and F competitive adsorption, the density of states of the system was analyzed. According to the size of the adsorption possibility, the density of states of oxygen adsorbed on the surface at B1 (the same position as T1) and T2 (the same position as B2) was mainly analyzed. Figure 8 show the total density of states and the projected density of states of F, O and C atoms when fluorine was adsorbed on the surface at B1 and T2, respectively.
Figure 9a shows that the peaks near −24~−20 eV are mainly the hybridization of O 2s and C 2p orbitals, and almost all of them come from the contribution of C 2p orbitals in the range of −19~−10 eV. The peak near −10~0 eV is mainly the hybridization of C 2p and O 2p orbitals. In this region, the orbitals O 2p and C 2p show serious splitting, which intensifies the orbital hybridization, and thus is beneficial to bonding. The s and p orbitals of F atoms have little contribution in the bonding process. One reason is that the number of O atoms bonding with C is far more than that of F atoms at this time. The other is the C-F bond has small adsorption energy and poor stability. Oxygen also has the same bonding characteristics when adsorbed on the T2 site, as shown in Figure 9b.
Through adsorption energy and density of state calculation analysis, it is known that the preferential discharge sites of the F atom on the carbon anode are B1 (the same as T1) and T2 (the same as B2). The transition of the anode structure was then analyzed when fluorine atom continues to adsorb. The sites after adsorption at B1 and T2 were taken as the initial configuration of the second step of the reaction, and fluorine continued to be adsorbed around the C atoms. The possible sites of the next fluorocarbon adsorption were calculated. The adsorption probability was judged according to the adsorption energy of the C-F bond in each step of the reaction. It can be seen from the calculation that there are five most possible Paths for F adsorption, as shown in Figure 10a. The first two paths are from the adsorption at B1 sites, and the last three paths are from the adsorption at T2. Among them, four paths eventually generate COF2, and the other path generates CO. The adsorption and discharge of the F atom on CxO will destroy the stability of the benzene ring, meaning that the fluorocarbon can be removed from the anode surface and the final product COF2 is formed. The formation process of COF2 can be described as the following three steps according to the reaction path:
Step1: [F] − e + CxO = FCxO
Step2: [F] + FCxO = F2CxO
Step3: F2CxO = COF2(surface) + (x − 1) C
The formation process of CO at this stage can be described as:
Step1: [F] − e + CxO = FCxO
Step2: [F] + FCxO = F2CxO
Step3: F2CxO = F2Cx-1 + CO
The Al-O-F complex ions in molten salts transfer charges, leaving F atoms at the anode reaction interface and interacting with surface C. The C−F interaction will destroy the CxO structure formed on the anode and promote the formation of COF2 and CO.
Figure 10b shows the Gibbs free energy changes of different configurations in five probable paths. At 1250 K, the Gibbs free energy of the five paths generally decreases, indicating that COF2 and CO are possible to be generated. Path 1 and Path 2 with the B1 configuration as the initial structure were analyzed. In Path 1, the process from the B1 to the A structure and from B to C structure were accompanied with energy rising, which needs huge additional energy. The Gibbs free energy of the D structure, which forms the final product of COF2, is also higher than the Gibbs free energy of the B1 structure. The reaction may happen but the possibility is low. Path 2 is in the same situation. Paths 3, 4 and 5 show the initial configuration of T2. In Path 3, the energy decreases from T2 to J and then increases to K, and finally the energy decreases significantly to obtain the L structure, which shows the lowest Gibbs free energy in the five paths. Therefore, it is the most possible path to generate COF2. In Path 3, energy rises in the process from M to N structure and from O to P structure. The Gibbs free energy of the P structure that finally produces the COF2 is higher than that of the T2 structure, meaning it is difficult for the reaction to occur. In Path 5, the energy change from the M to the Q structure is the largest among the five paths, and thus it is difficult to generate CO. In summary, Path 3 is the most likely path to generate COF2.
According to the adsorption energy changes of the different configurations in the five possible paths, as shown in Figure 10c, the bonding information during structure evolution was specifically analyzed. The representative Paths 1 and 3 were selected for analysis. In path 1, the first F atom is adsorbed on C1 to form the B1 structure with an adsorption energy of −3.33 eV. Meanwhile, the bonding of C1-F causes the fracture of C1-C2 bond, and the original carbon ring structure is destroyed. Then, the F atom is adsorbed at C3, forming structure A with an adsorption energy of −2.84 eV. After that, the F atom is adsorbed on the unsaturated C2 atom to form structure B with an adsorption energy of −3.41 eV. Next, the F atom continues to adsorb on the C1 atom, forming the -C4-O-C1- structure (C structure) with the participation of the O atom, and the adsorption energy is −3.78 eV. Finally, the F atom adsorbs on C4, resulting in the breakage of the -C4-O bond in the -C4-O-C1- structure, forming the COF2 product. The adsorption energy of structure D is −3.22 eV. In Path 3, the first F atom is adsorbed on C3 to form the T2 structure with an adsorption energy of −2.64 eV. Then, the F atom is adsorbed at C1, resulting in the fracture of C1-C2, forming structure J with an adsorption energy of −3.96 eV. Next, the F atom continues to adsorb on the C1 atom. Meanwhile, C1 and C2, which were originally broken bonds, form a -C2-O-C1- structure (K structure) with the participation of the O atom, and the adsorption energy of the K structure is −3.19 eV. Then, the F atom adsorbs on C2, and the C2-O bond in -C2-O-C1- breaks. The C1 atom is then bonded with an O atom and two fluorine atoms to form the COF2 product. The adsorption energy of structure L is −3.86 eV. It can be deduced that the absolute value of the bonding energy in Path 3 is large and the probability of bonding is high, which further confirms that Path 3 is the most likely path to generate COF2.
Previous observations of non-anode effect PFC (NAE-PFC) showed that a low concentration of CF4 would be generated. Based on first-principles calculations, it can be seen that COF2 may be generated during the competitive discharge stage of oxygen and fluoride ions. COF2 is an unstable intermediate that will decompose to produce CF4 and CO2 at high temperature. Therefore, it is speculated that the low concentration of CF4 at this stage is generated by the decomposition of COF2.

3.3. Molten Salt Experiment Results

Scanning electron microscopy (SEM) images of the graphite anode surface before and after electrolysis are shown in Figure 11a,b. Compared with the anode surface before and after electrolysis, it can be seen that the original anode surface has relatively complete graphite sheet layers. The graphite anode after electrolysis still has an obvious graphite lamellar structure, but there will be more “gaps” and “breakages” on the edge of the graphite. The damaged structures at the edge of the carbon layer should be related to the electrochemical carbon consumption under electrolysis.
The XPS wide-range spectrum of the graphite anode after electrolysis is shown in Figure 12a. There are a C 1s peak, an O 1s peak, a F 1s peak, a Na 1s peak and a Al 2p peak. Among them, Al and Na come from electrolytes, which have nothing to do with the chemical reaction on the anode. The elements C, O and F were further analyzed. The C1s high-resolution spectrum contains six components (Figure 12b). The strongest peak C1 at 284.89 is the graphite sp2 carbon. Peak C2 at 284.94 eV is the non-functional sp3 carbon in the graphite aromatic ring. The adsorption energy of C3 peak is 286.44 eV, which may correspond to a -CHx-OH or -C-O-C- structure [37,38,39].C4 with an adsorption energy of 287.04 eV corresponds to -C=O structure [40]. C1s with an adsorption energy higher than 288 eV is fluoridated to form a C5 semi-ionic C-F bond and a C5 ion C-F bond [41]. C6 with the lowest content has an adsorption energy of 294.39 eV, which represents the π-π* excited satellite peak structure. It can be seen from Figure 12c that the O 1s high-resolution spectrum contains five components, among which C1 and C2 with an adsorption energy of 530.14 and 530.44 eV correspond to a -OH structure, and C3 and C4 with adsorption energy of 531.14 and 531.94 eV indicate a -C=O structure. C5 with an adsorption energy of 533.02 eV is a C-O-C- bridge structure. For the F 1s high-resolution spectrum, there are four components, all of which are F-C bonds. F1 with an adsorption energy of 687.44 eV is a semi-ionic F-C bond. F2 and F3 with adsorption energies of 687.79 and 687.94 eV represent covalent F-C bonds. The adsorption energy of F4 is 689.79 eV, which may be a -CF2 structure. Compared with the F-C bond, the -CF2 structure is negligible. The bonding analysis on the surface of the graphite anode after electrolysis shows that there are a C=O double bond, a C-O-C bridge structure and a C-F bond at the anode interface after electrolysis. This is consistent with the first-principles calculation results, which proves that different C-O bonds and C-F bonds are formed during the discharge of O and F.

4. Conclusions

During the normal aluminum electrolytic stage, the microscopic reaction mechanism of carbon anodes can be divided into the [O]2− preferential discharge stage and the [O]2−, [F] co-discharge stage. The first-principles calculation and high -temperature molten salt experiment indicate the following:
1.
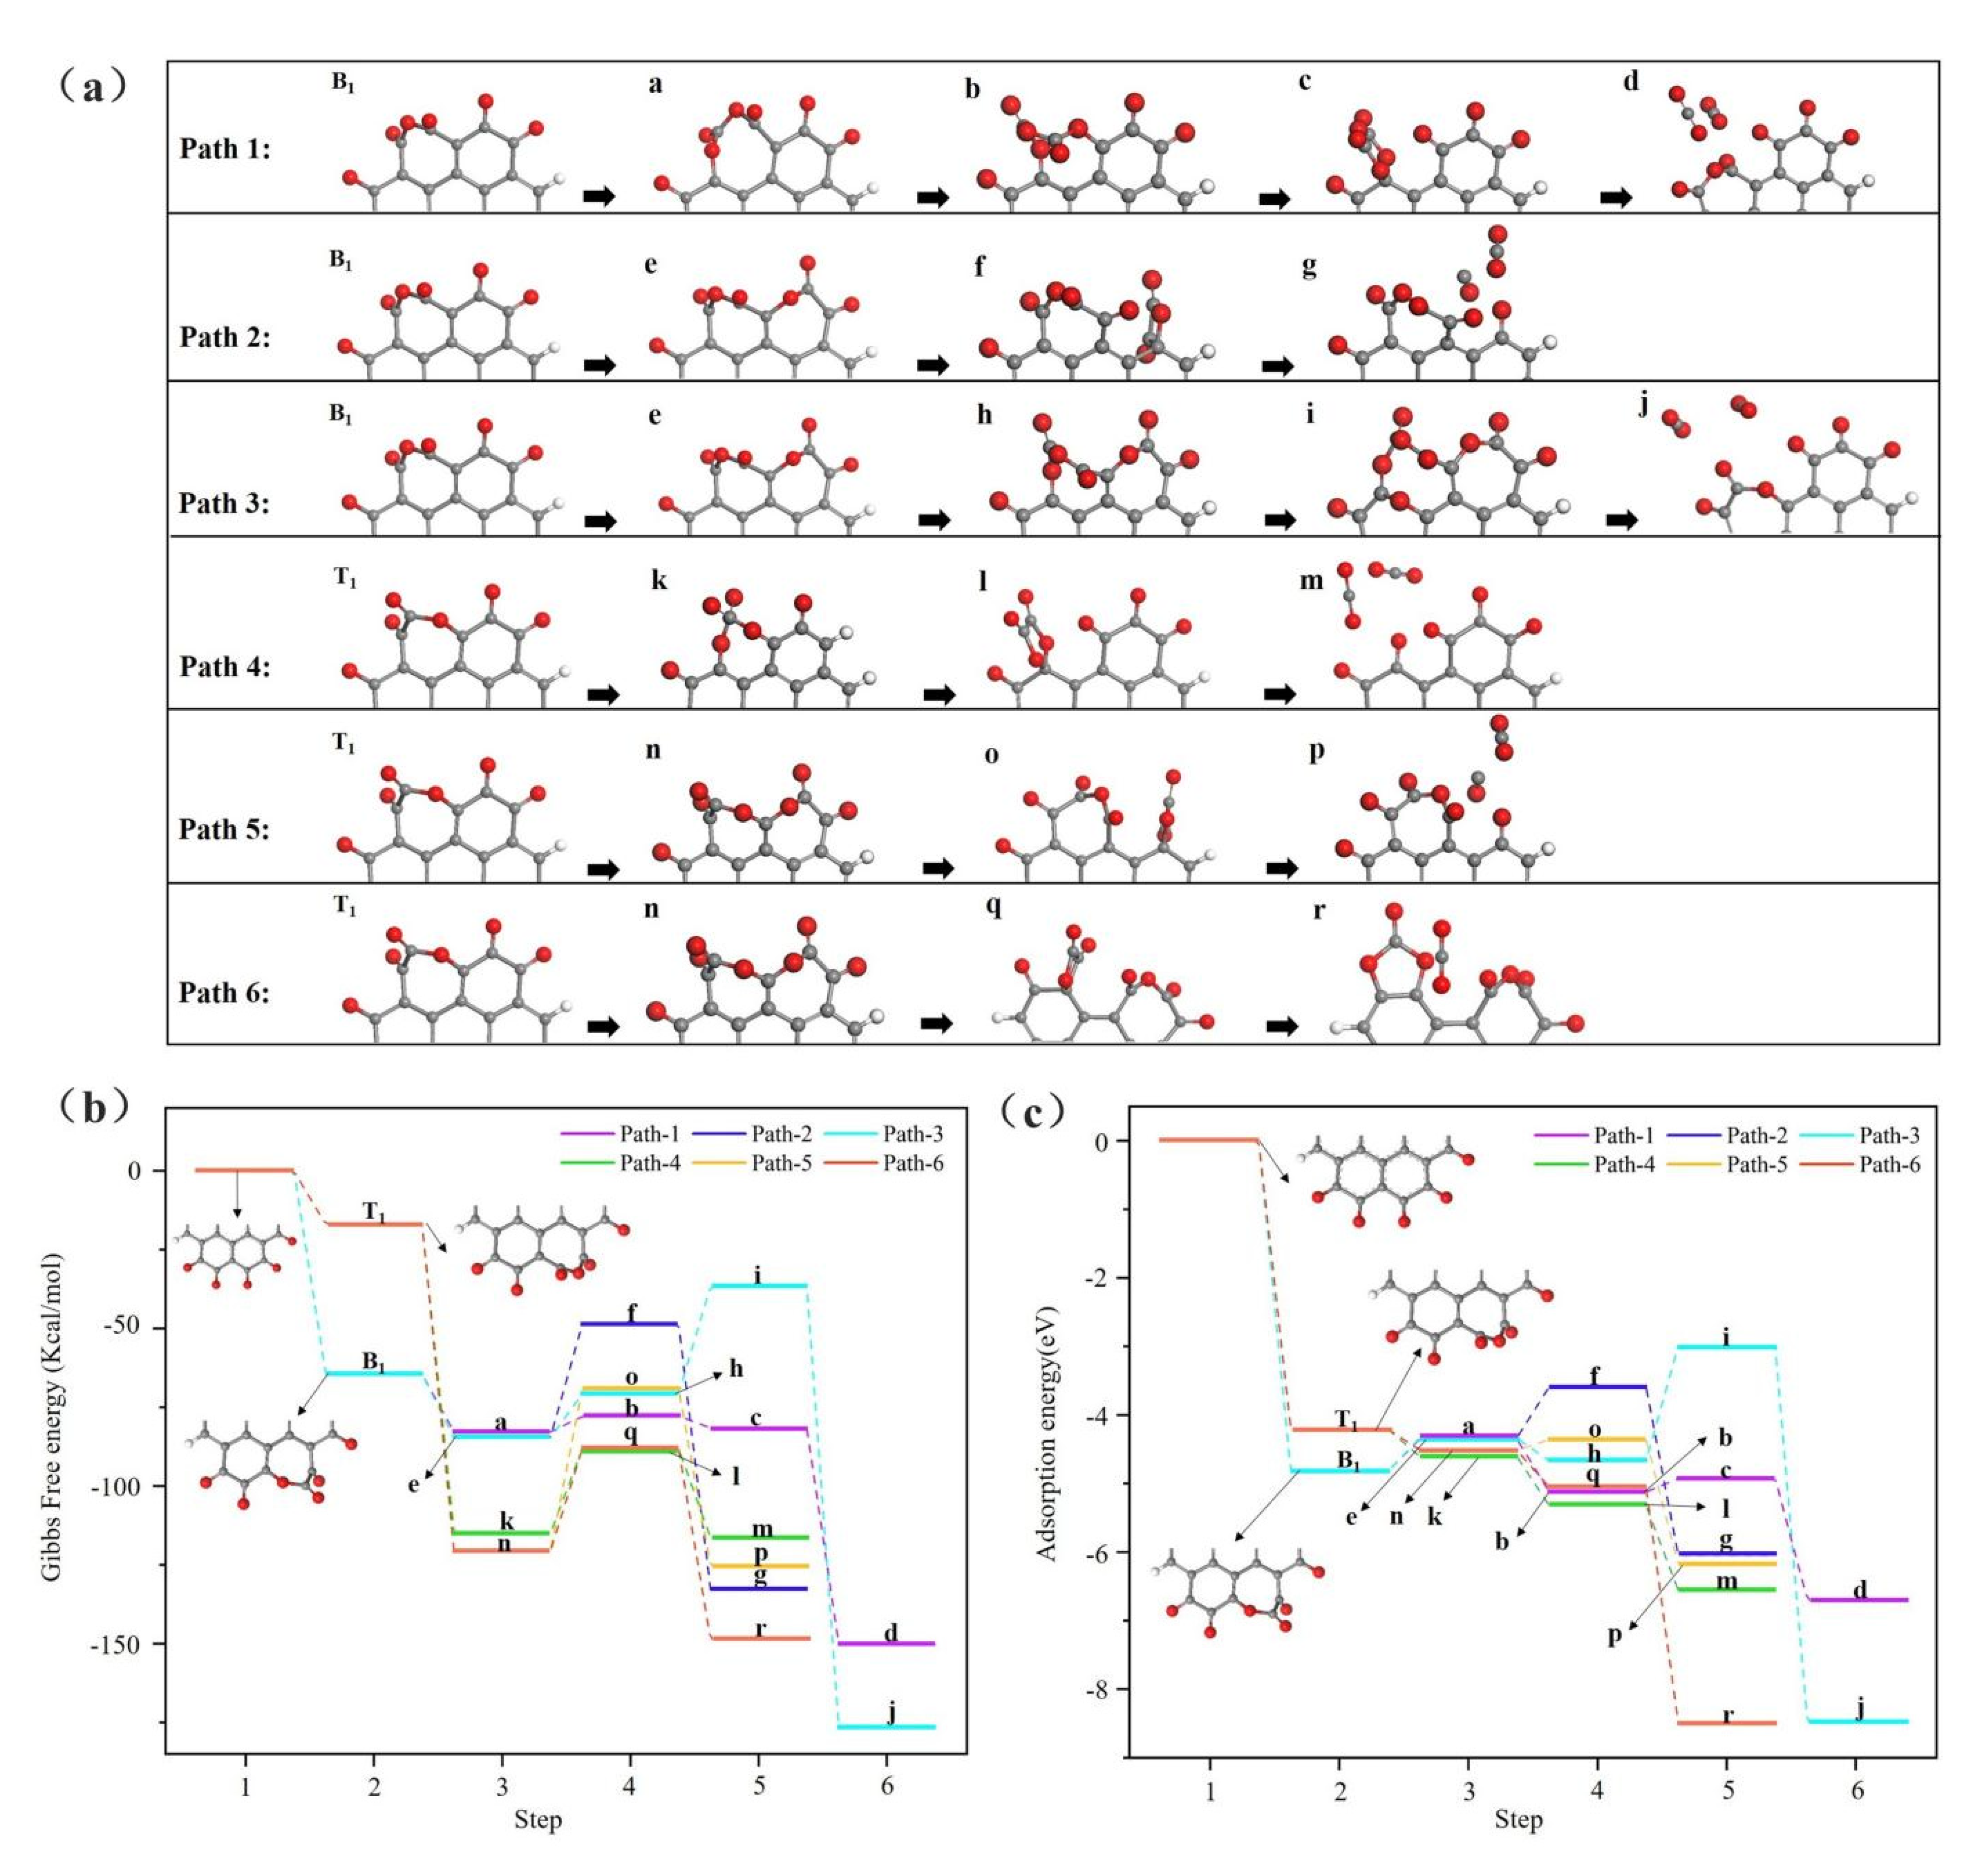
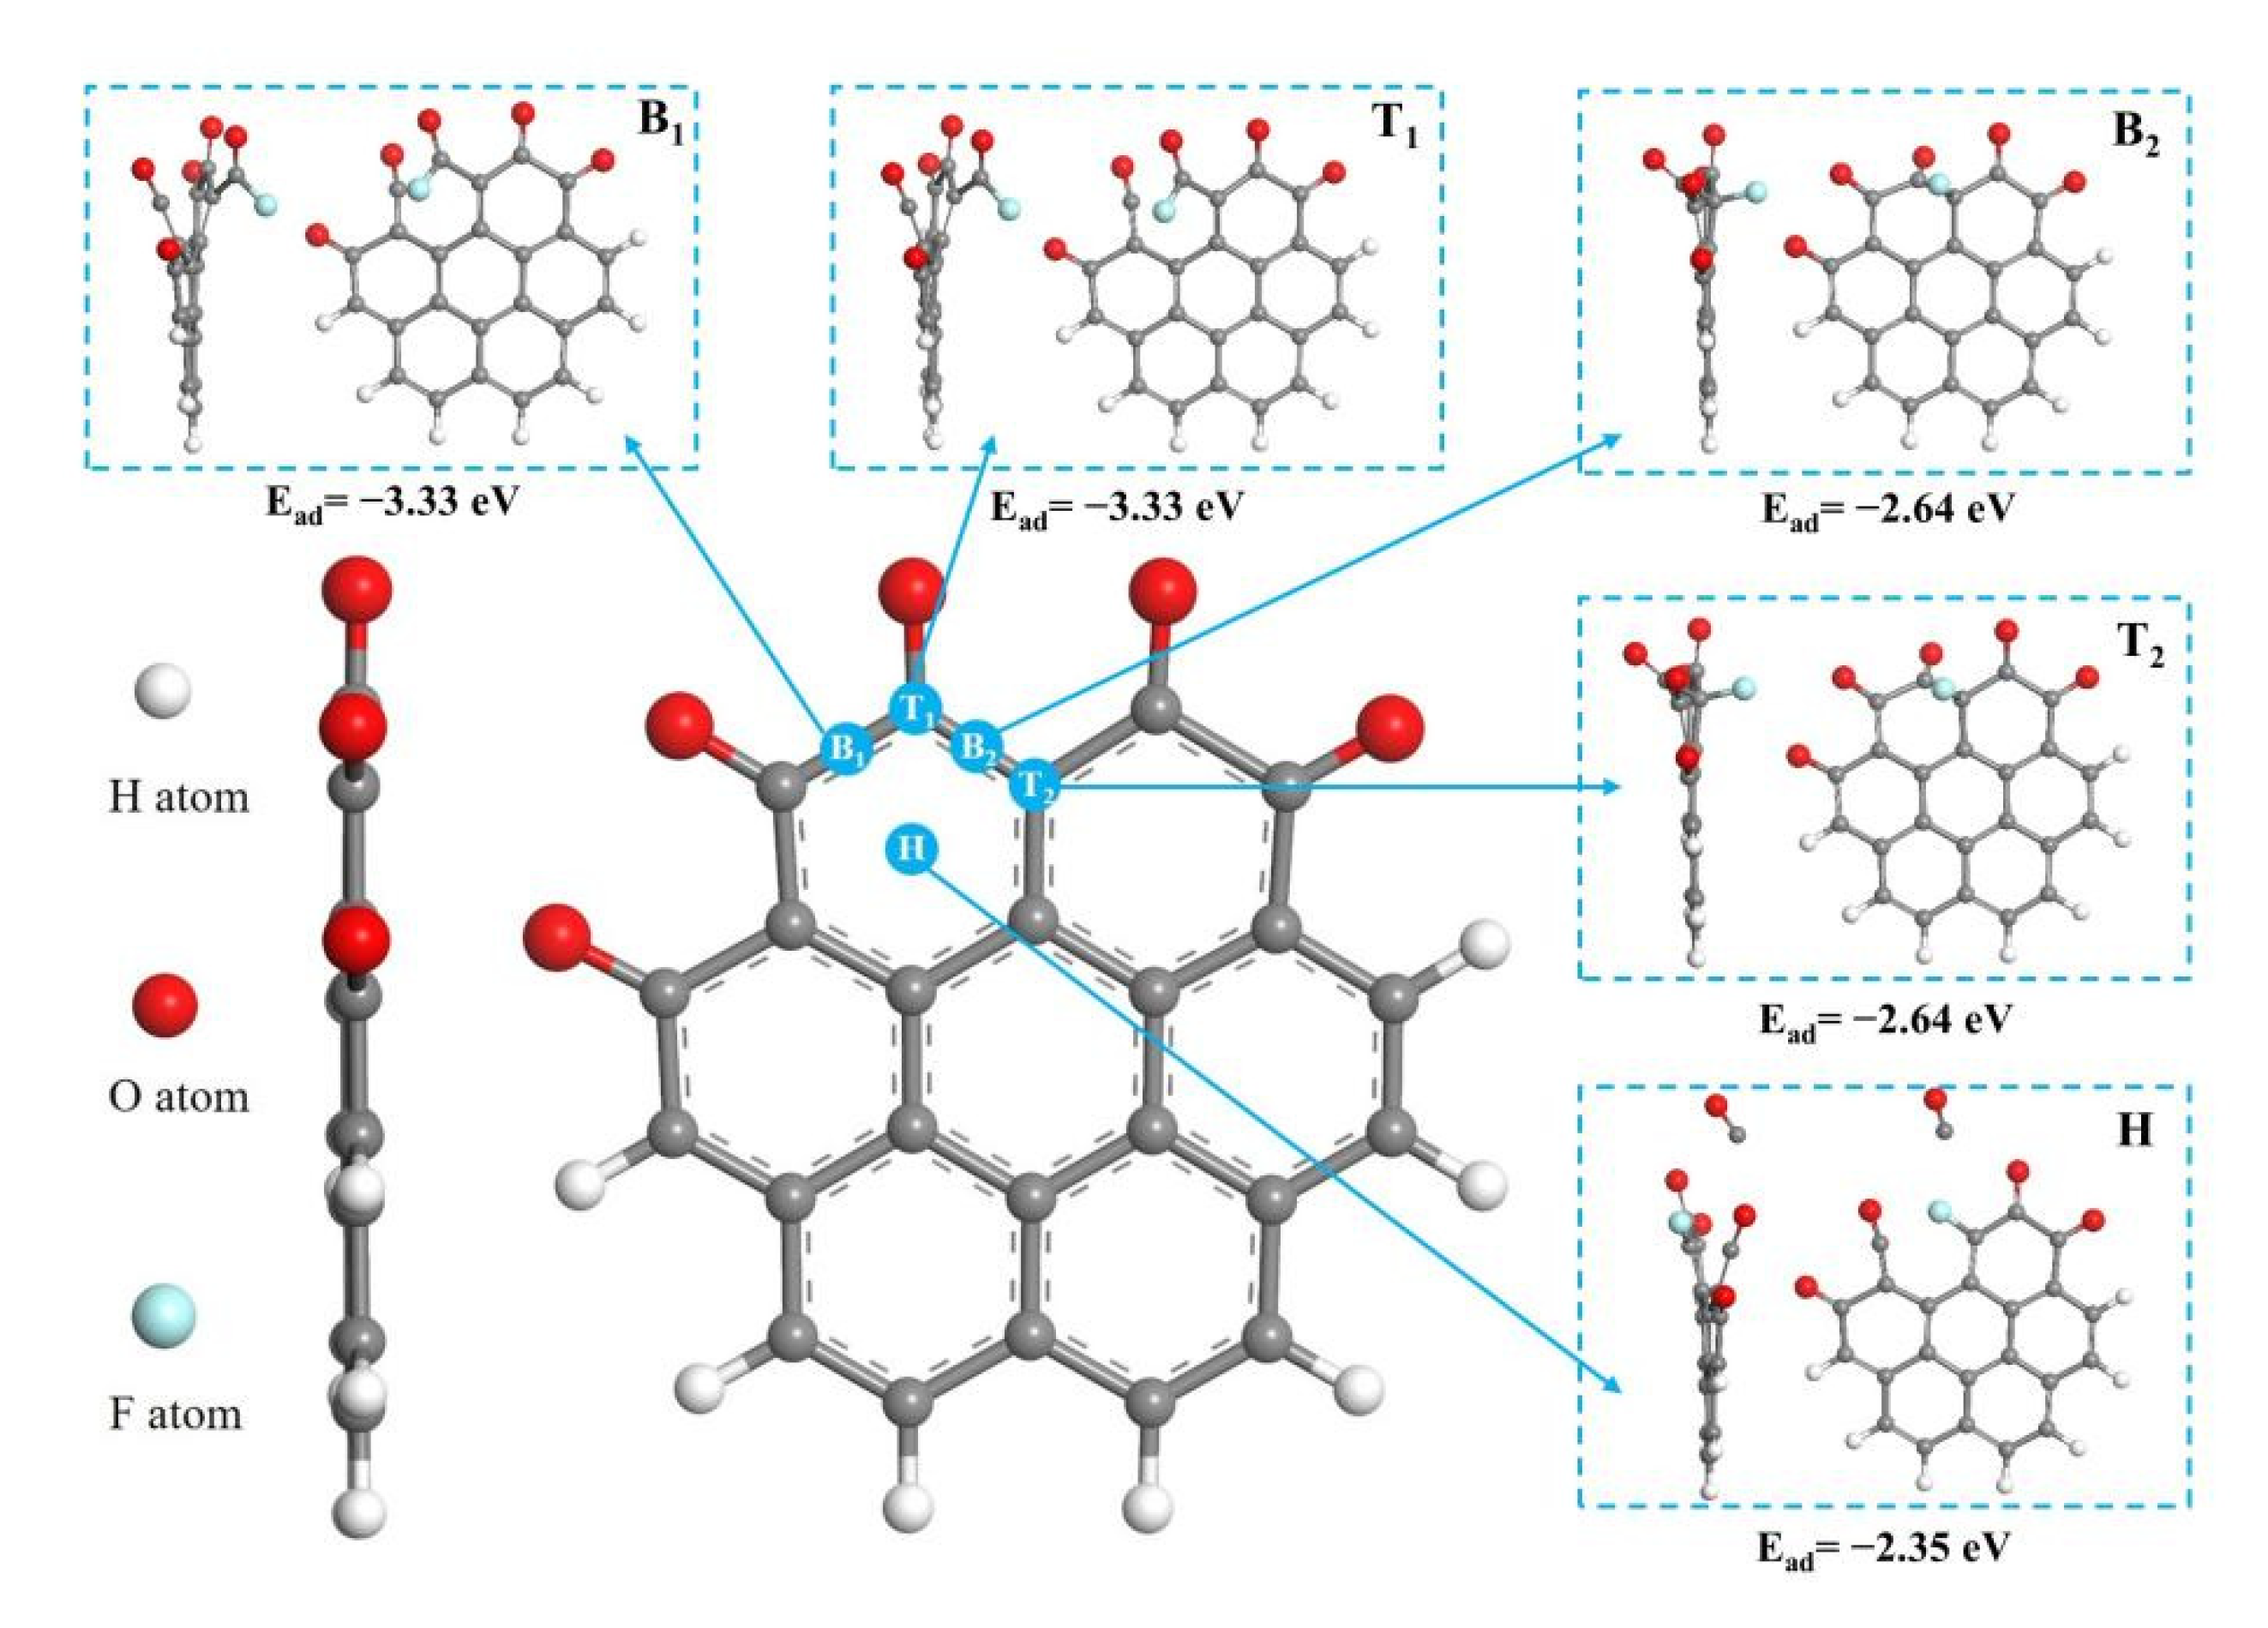
In the [O]2− preferential discharge stage, the priority of oxygen discharge sites on the anode surface is B1 = H > T1 > T2 > B2. Starting from the B1 and T1 structures, six possible paths for C-O compound generation were calculated, among which Path 3 is the most likely path for CO2 generation;
2.
In the [O]2−, [F] co-discharge stage, the priority of fluorine ion discharge sites is B1 = T1 > B2 = T2 > H. Starting from the B1 and T2 structures, five paths that possible to generate C-O compounds were calculated, among which the Path 3 is the most likely path for COF2 generation;
3.
The COF2 is an unstable intermediate, which decomposes into CF4 and CO2 under high temperature. This explains why non-anode effect PFC (NAE-PFC) generates a low concentration of CF4;
4.
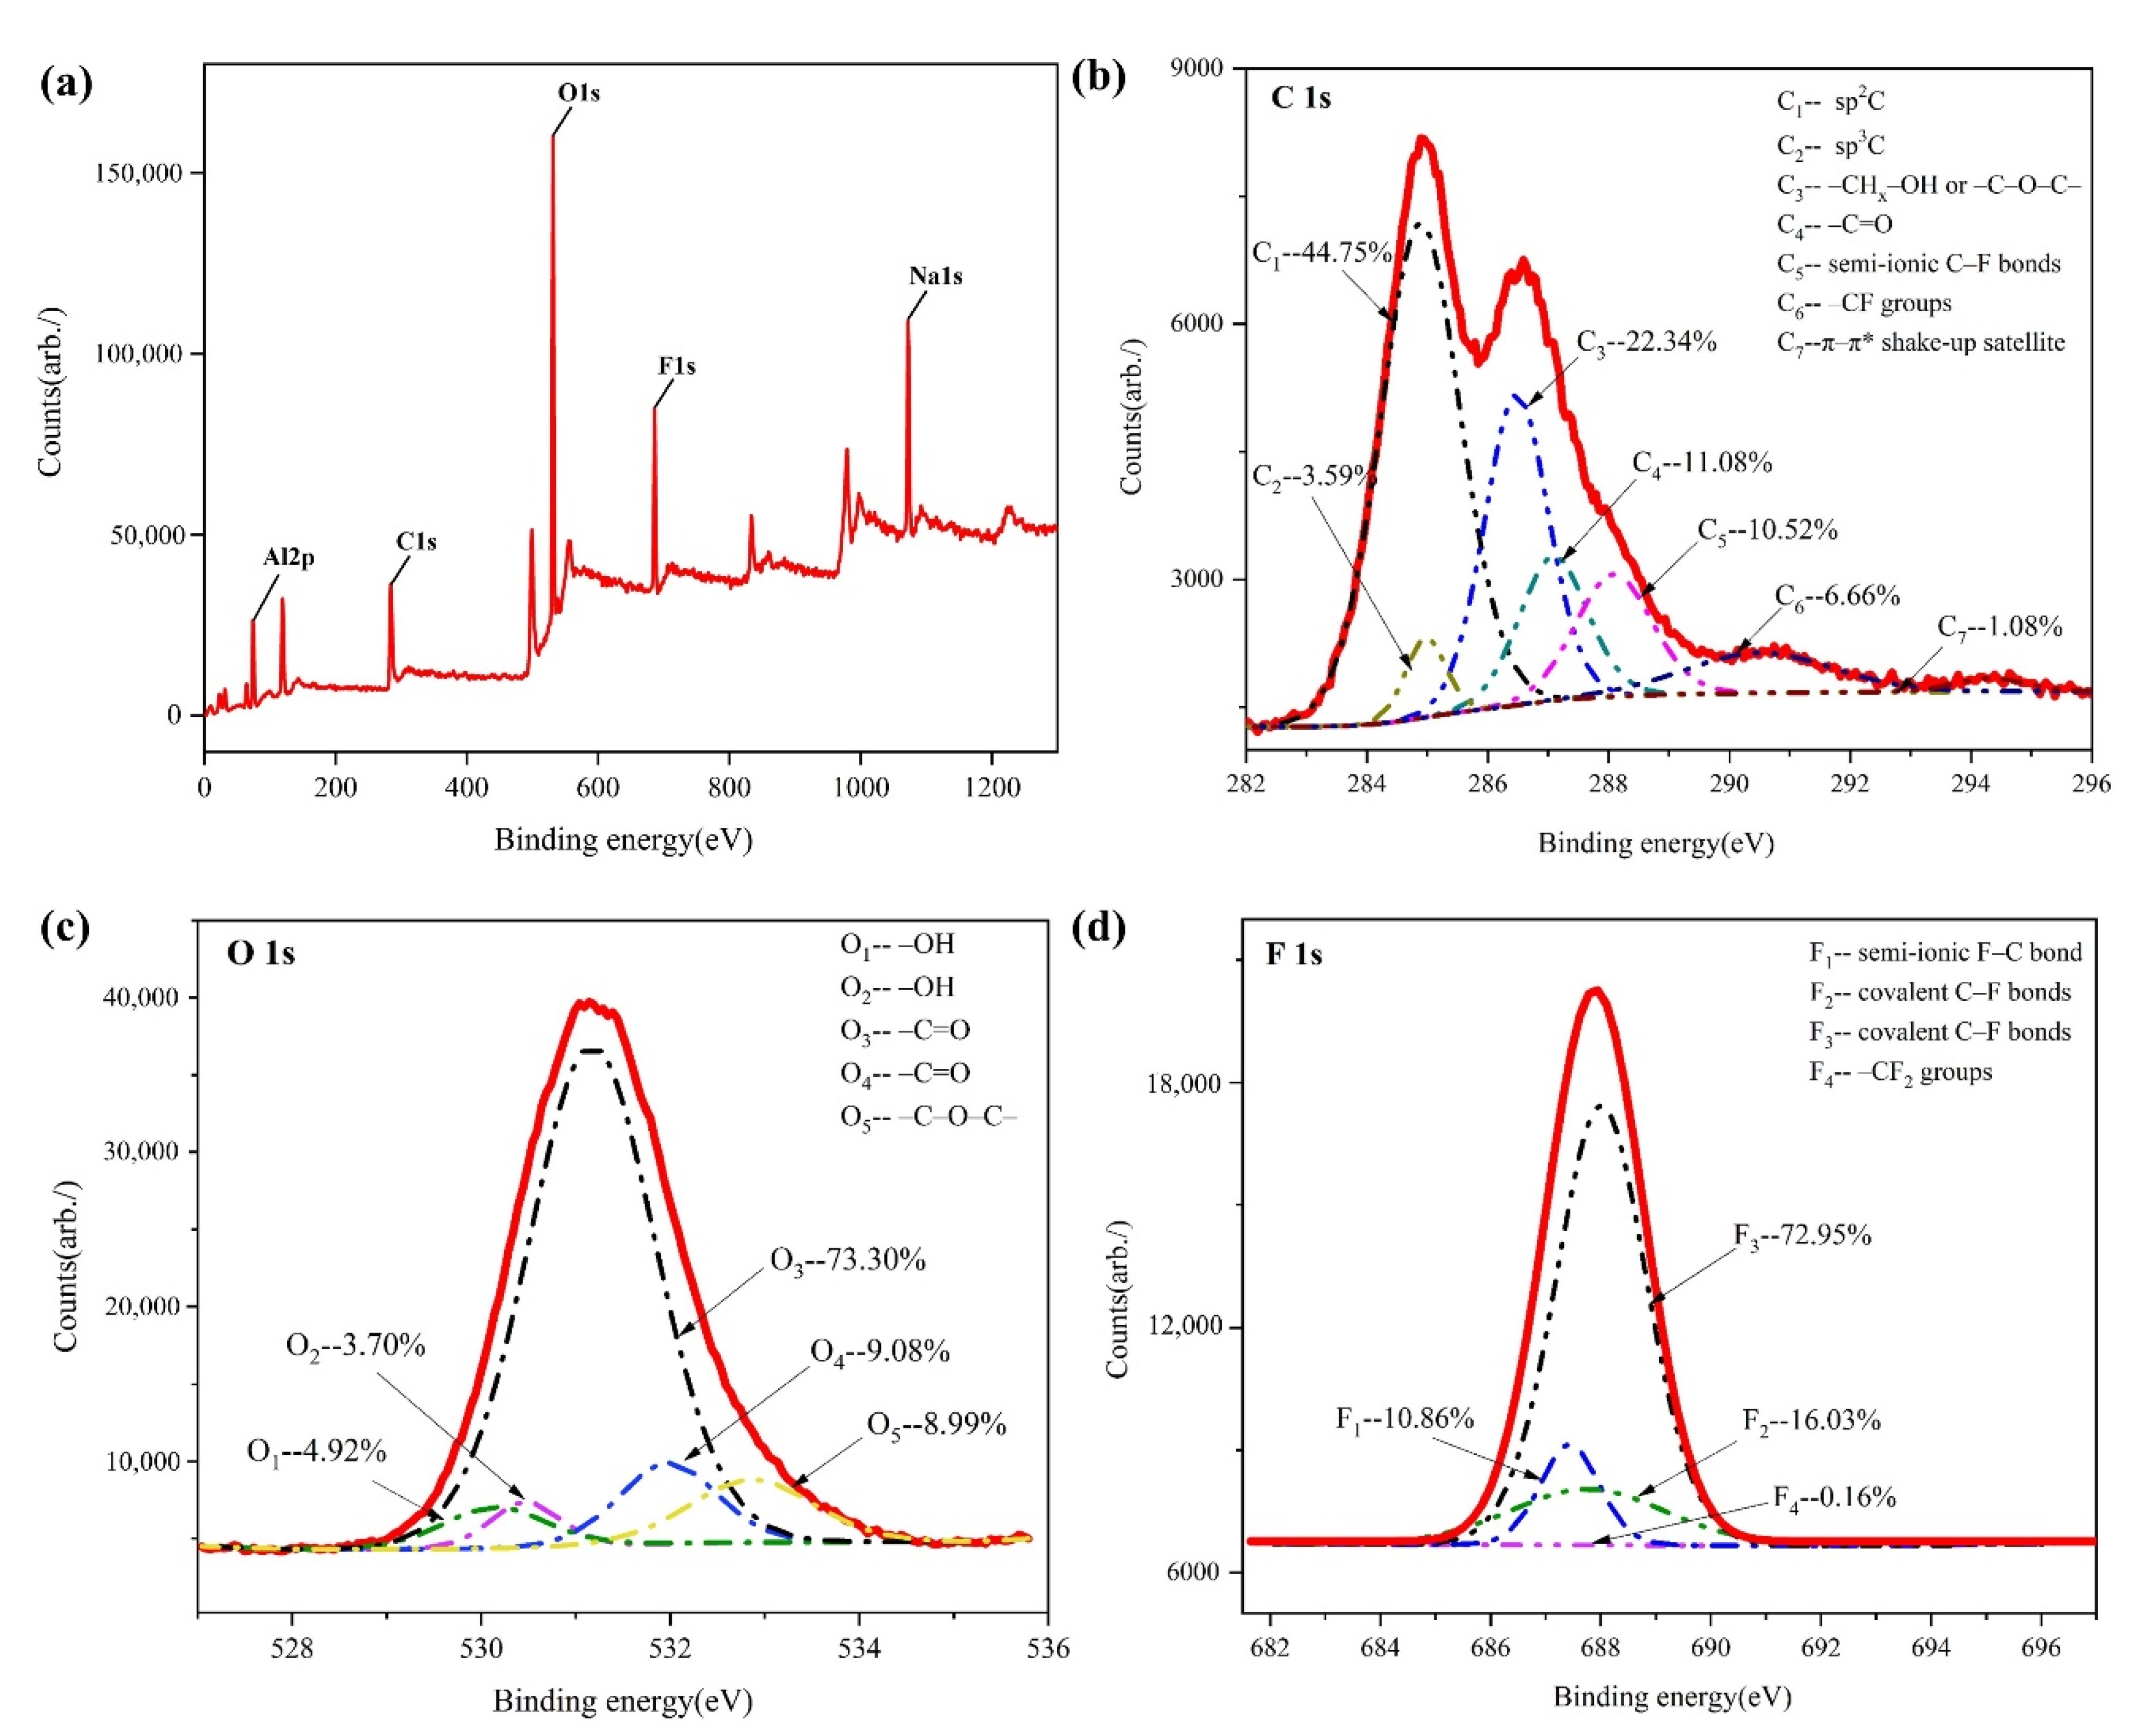
Experiments proved the existence of -C=O doubles, a -C-O-C- bridge-type structure and -C-F keys on the surface of the anode after electrolysis, indicating that different C-O bonds and C-F bonds are formed during the discharge of O and F. This is consistent with the first-principles calculation.

Author Contributions

Conceptualization, writing—original draft preparation, writing—review, software and editing, methodology, K.S.; supervision, J.L. (Jie Li) and H.Z.; investigation, T.L. and J.L. (Jiaqi Li). All authors have read and agreed to the published version of the manuscript.

Funding

This research was funded by National Natural Science Foundation of China (Grant No.51974373, 51874365), the Major Scientific and Technological Innovation Projects of Shandong Province (Grant No.2019JZZY020123) and the Fundamental Research Funds for the Central Universities of Central South University(Grant No.2019zzts242).

Data Availability Statement

Data are contained within the article.

Conflicts of Interest

The authors declare no conflict of interest.

References

  1. Saevarsdottir, G.; Kvande, H.; Welch, B.J. Aluminum Production in the Times of Climate Change: The Global Challenge to Reduce the Carbon Footprint and Prevent Carbon Leakage. JOM 2019, 72, 296–308. [Google Scholar] [CrossRef]
  2. Haraldsson, J.; Johansson, M.T. Effects on primary energy use, greenhouse gas emissions and related costs from improving energy end-use efficiency in the electrolysis in primary aluminium production. Energ. Effic. 2020, 13, 1299–1314. [Google Scholar] [CrossRef]
  3. Yang, Y.; Guo, Y.; Zhu, W.; Huang, J. Environmental impact assessment of China’s primary aluminum based on life cycle assessment. T. Nonferr. Metal. Soc. 2019, 29, 1784–1792. [Google Scholar] [CrossRef]
  4. Gao, F.; Nie, Z.R.; Wang, Z.H.; Hongmei, L.I.; Gong, X.Z.; Zuo, T.Y. Greenhouse gas emissions and reduction potential of primary aluminum production in China. Sci. China Life Sci. 2009, 52, 2161–2166. [Google Scholar] [CrossRef]
  5. Tabereaux, A.T. Anode effects, PFCs, global warming, and the aluminum industry. JOM 1994, 46, 30–34. [Google Scholar] [CrossRef]
  6. Mikhaylov, A.; Moiseev, N.; Aleshin, K.; Burkhardt, T. Global climate change and greenhouse effect. Entrep. Sustain. Issues 2020, 7, 2897–2913. [Google Scholar] [CrossRef]
  7. Kjos, O.S.; Solheim, A.; Aarhaug, T.; Osen, K.S.; Martinez, A.M.; Sommerseth, C.; Gudbrandsen, H.; Store, A.; Gaertner, H. PFC Evolution Characteristics during Aluminium and Rare Earth Electrolysis. In Proceedings of the TMS Light Metals, Phoenix, AZ, USA, 11–15 March 2018; pp. 1449–1455. [Google Scholar]
  8. Tsai, W.-T.; Chen, H.P.; Hsien, W.Y. A review of uses, environmental hazards and recovery/recycle technologies of perfluorocarbons (PFCs) emissions from the semiconductor manufacturing processes. J. Loss. Prevent. Proc. 2002, 15, 65–75. [Google Scholar] [CrossRef]
  9. Li, W.X.; Zhao, Q.Y.; Yang, J.H.; Qiu, S.L.; Chen, X.P.; Marks, J.; Bayliss, C. On Continuous PFC Emission Unrelated to Anode Effects. In Proceedings of the TMS Light Metals, San Antonio, TX, USA, 3–7 March 2013; pp. 1037–1045. [Google Scholar]
  10. Stanic, N.; Bø, E.T.; Sandnes, E. CO and CO2 Anode Gas Concentration at Lower Current Densities in Cryolite Melt. Metals 2020, 10, 1694. [Google Scholar] [CrossRef]
  11. Harnisch, J.; Borchers, R.; Fabian, P.; Maiss, M. Tropospheric trends for CF4 and C2F6 since 1982 derived from SF6 dated stratospheric air. Geophys. Res. Lett. 1996, 23, 1099–1102. [Google Scholar] [CrossRef]
  12. Vogel, H.; Flerus, B.; Stoffner, F.; Friedrich, B. Reducing Greenhouse Gas Emission from the Neodymium Oxide Electrolysis. Part I: Analysis of the Anodic Gas Formation. J. Sustain. Metall. 2016, 3, 99–107. [Google Scholar] [CrossRef]
  13. Heggelund, G.M. China’s climate and energy policy: At a turning point? Int. Environ. Agreem-P. 2021, 21, 9–23. [Google Scholar] [CrossRef]
  14. Lin, J.Y.; Murshed, M.; Chen, F.Z.; Shahbaz, M.; Kirikkaleli, D.; Khan, Z. An empirical analysis of the household consumption-induced carbon emissions in China. Sustain. Prod. Consump. 2021, 26, 943–957. [Google Scholar]
  15. Li, S.; Zhang, T.; Niu, L.; Yue, Q. Analysis of the development scenarios and greenhouse gas (GHG) emissions in China’s aluminum industry till 2030. J. Clean. Prod. 2021, 290, 125859. [Google Scholar] [CrossRef]
  16. Dong, L.; Miao, G.; Wen, W. China’s Carbon Neutrality Policy: Objectives, Impacts and Paths. East. Asian Policy 2021, 13, 5–18. [Google Scholar] [CrossRef]
  17. Chi, Y.; Liu, Z.; Wang, X.; Zhang, Y.; Wei, F. Provincial CO2 Emission Measurement and Analysis of the Construction Industry under China’s Carbon Neutrality Target. Sustainability 2021, 13, 1876. [Google Scholar] [CrossRef]
  18. Kuang, Z.; Thonstad, J.; Sørlie, M. Effects of additives on the electrolytic consumption of carbon anodes in aluminium electrolysis. Carbon 1995, 33, 1479–1484. [Google Scholar] [CrossRef]
  19. Dorreen, M.M.R.; Hyland, M.M.; Welch, B.J. Current Efficiency Studies in a Laboratory Aluminium Cell Using the Oxygen Balance Method. In Proceedings of the TMS Light Metals, San Antonio, TX, USA, 3–7 March 2013; pp. 204–210. [Google Scholar]
  20. Liu, D.; Li, X.; Bai, Y. An attack-finding algorithm for security protocols. J. Comput. Sci. Tech. 2002, 17, 450–463. [Google Scholar] [CrossRef]
  21. Huglen, R.; Kvande, H. Global Considerations of Aluminium Electrolysis on Energy and the Environment. In Proceedings of the TMS Light Metals, Phoenix, AZ, USA, 11–15 March 2018; pp. 948–955. [Google Scholar]
  22. Wang, G.; Sun, X.; Zhao, W.; Yang, D. Electrochemical Behaviour of Carbon Anodes in Na3AlF6-K3AlF6-Based Low-Melting Electrolytes for Aluminium Electrolysis. In Proceedings of the TMS Light Metals, Nashville, TN, USA, 14–18 February 2016; pp. 671–674. [Google Scholar]
  23. Åsheim, H.; Aarhaug, T.A.; Sandnes, E.; Kjos, O.S.; Solheim, A.; Kolås, S.; Haarberg, G.M. Anode Effect Initiation during Aluminium Electrolysis in a Two-Compartment Laboratory Cell. In Proceedings of the TMS Light Metals, Phoenix, TN, USA, 14–18 February 2016; pp. 551–556. [Google Scholar]
  24. Yang, Y.; Gao, B.; Wang, Z.; Shi, Z.; Hu, X. Study on the Inter-electrode Process of Aluminum Electrolysis. Metall. Mater. Trans. B 2015, 47, 621–629. [Google Scholar] [CrossRef]
  25. Xiao, J.; Li, J.; Ye, S.-l.; Lai, Y.-q.; Liu, Y.-x. Laboratory study of property-modified prebaked carbon anode and application in large aluminum electrolysis cells. J. Cent. South Univ. T. 2005, 12, 68–71. [Google Scholar]
  26. Wrigge, F.W.; Ginsberg, H. Zur Kenntnis der Vorgange beim Ausruhren technischen Tonerdehydrates. Z. Anorg. Allg. Chem. 1951, 264, 285–297. [Google Scholar] [CrossRef]
  27. Thonstad, J.; Nordmo, F.; Rødseth, J.K. On the anode effect in cryolite-alumina melts—II the initiation of the anode effect. Electrochim. Acta. 1974, 19, 761–769. [Google Scholar] [CrossRef]
  28. Nordmo, F.; Thonstad, J. On the anode effect in cryolite-alumina melts—IV. Gas composition and faradaic efficiency. Electrochim. Acta. 1985, 30, 741–745. [Google Scholar] [CrossRef]
  29. Dion, L.; Kiss, L.I.; Poncsák, S.; Lagacé, C.-L. Prediction of Low-Voltage Tetrafluoromethane Emissions Based on the Operating Conditions of an Aluminium Electrolysis Cell. JOM 2016, 68, 2472–2482. [Google Scholar] [CrossRef] [Green Version]
  30. Hyland, M. Non Anode Effect PFCS: Measurement Considerations and Potential Impacts. In Proceedings of the TMS Light Metals, Orlando, FL, USA, 15–19 March 2015; pp. 551–555. [Google Scholar]
  31. Dorreen, M.M.R.; Chin, D.L.; Lee, J.K.C.; Hyland, M.M.; Welch, B.J. Sulfur and Fluorine Containing Anode Gases Produced during Normal Electrolysis and Approaching an Anode Effect. In Proceedings of the TMS Light Metals, San Antonio, TX, USA, 3–7 March 2013; pp. 918–923. [Google Scholar]
  32. Jarek, S.; Thonstad, J. Fast voltammetry study of anodic reactions in graphite in cryolite-alumina melts. Electrochim. Acta. 1987, 32, 743–747. [Google Scholar] [CrossRef]
  33. Calandra, A.J.; Castellano, C.E.; Ferro, C.M. The electrochemical behaviour of different graphite/cryolite alumina melt interfaces under potentiodynamic perturbations. Electrochim. Acta. 1979, 24, 425–437. [Google Scholar] [CrossRef]
  34. Djokić, S.S.; Conway, B.E.; Belliveau, T.F. Specificity of anodic processes in cyclic voltammetry to the type of carbon used in electrolysis of cryolite-alumina melts. J. Appl. Electrochem. 1994, 24, 827–834. [Google Scholar] [CrossRef]
  35. Lei, Y.; Shevlin, S.A.; Zhu, W.; Guo, Z.X. Hydrogen-induced magnetization and tunable hydrogen storage in graphitic structures. Phys. Rev. B 2008, 77, 761–768. [Google Scholar] [CrossRef]
  36. Zhang, Y.; Zhang, Y.; Yu, G.; Hou, G.; Qiu, S. Study on the identification of PFC emission from aluminum reduction cells. Light Metals 2017, 11, 11–39. [Google Scholar]
  37. Bou, M.; Martin, J.M.; Le Mogne, T.; Vovelle, L. Chemistry of the interface between aluminium and polyethyleneterephthalate by XPS. Appl. Surf. Sci. 1991, 47, 149–161. [Google Scholar] [CrossRef]
  38. Weng, L.T.; Poleunis, C.; Bertrand, P.; Carlier, V.; Sclavons, M.; Franquinet, P.; Legras, R. Sizing removal and functionalization of the carbon fiber surface studied by combined TOF SIMS and XPS. J. Adhes. Sci. Technol. 1995, 9, 859–871. [Google Scholar] [CrossRef]
  39. Endo, K.; Inoue, C.; Kobayashi, N.; Aida, M. Spectra analysis of the XPS core and valence energy levels of polymers by an ab initio mo method using simple model molecules. J. Phys. Chem. Solids 1994, 55, 471–478. [Google Scholar] [CrossRef]
  40. López, G.P.; Castner, D.G.; Ratner, B.D. XPS O 1s binding energies for polymers containing hydroxyl, ether, ketone and ester groups. Surf. Interface Anal. 1991, 17, 267–272. [Google Scholar] [CrossRef]
  41. Groult, H.; Lantelme, F.; Crassous, I.; Labrugere, C.; Tressaud, A.; Belhomme, C.; Colisson, A.; Morel, B. Characteristics of the Fluorocarbon Surface Film Generated on Carbon Anode during F2 Evolution in Molten KF-2HF. J. Electrochem. Soc. 2007, 154, 553–562. [Google Scholar] [CrossRef]
Figure 1. (a) Typical micro-structure in anode; (b) calculation Model A.
Metals 11 01118 g001
Figure 2. Schematic diagram of electrochemical reaction at the interface of carbon anode: (a) [O]2− preferential discharge stage (when the concentration of alumina in molten salt is high, [O]2− discharges preferentially on the anode surface); (b) [O]2−, [F] co-discharge stage (Concentration of alumina in molten salt decreases, but the cell voltage does not increase significantly, reaching the anode effect. O and F ions discharge together on the anode surface).
Metals 11 01118 g002
Figure 3. Adsorption energy and structure change of O atom adsorbed on Model A.
Metals 11 01118 g003
Figure 4. Density of states of O atom adsorbed at different sites on the surface of Model A.
Metals 11 01118 g004
Figure 5. Total density of states and the projected density of states of oxygen and carbon atoms: (a) adsorb at B1 site; (b) adsorb at T1 site.
Metals 11 01118 g005
Figure 6. (a) Six possible paths for oxygen adsorption on anode surface; (b) Gibbs free energy of six possible paths; (c) adsorption energy of six possible paths. The letters in the steps of (b) and (c) correspond to the letters in (a), representing different adsorption structures.
Metals 11 01118 g006
Figure 7. Adsorption energy and structure change of F atom adsorbed on Model A.
Metals 11 01118 g007
Figure 8. Density of states of F atom adsorbed at different sites on the surface of Model A.
Metals 11 01118 g008
Figure 9. Total density of states and the projected density of states of O, C and F atoms: (a) adsorbed at B1 site; (b) adsorbed at T2 site.
Metals 11 01118 g009
Figure 10. (a) Five possible paths for F atom adsorption on anode surface; (b) Gibbs free energy of five possible paths; (c) adsorption energy of five possible paths. The letters in the steps of (b) and (c) correspond to the letters in (a), representing different adsorption structures.
Metals 11 01118 g010
Figure 11. SEM images: (a) fresh anode surface; (b) anode surface after normal electrolysis.
Metals 11 01118 g011
Figure 12. XPS spectra of graphite anode after electrolysis: (a) total spectra; (b) high-resolution C1s peak and its fitting results; (c) high-resolution O1s peak and its fitting results; (d) high-resolution F1s peak and its fitting results.
Metals 11 01118 g012
Publisher’s Note: MDPI stays neutral with regard to jurisdictional claims in published maps and institutional affiliations.

