Article

Simulation of Primary Particle Development and Their Impact on Microstructural Evolution of Sc-Modified Aluminum Alloys during Additive Manufacturing

by
Mohammad Sadegh Mohebbi
* and
Vasily Ploshikhin
Bremer Center for Computational Materials Science, Faculty of Physics and Electrical Engineering, University of Bremen, 28359 Bremen, Germany
*
Author to whom correspondence should be addressed.
Metals 2021, 11(7), 1056; https://doi.org/10.3390/met11071056
Submission received: 31 May 2021 / Revised: 23 June 2021 / Accepted: 27 June 2021 / Published: 30 June 2021
(This article belongs to the Special Issue Simulation of Microstructure Evolution in Additive Manufacturing)

Abstract

:
The microstructures of additively manufactured Sc- and Zr-modified aluminum alloys are significantly influenced by the nucleation role of solid intermetallic particles in undercooled liquid. To replicate such effects, a precipitation model relying on L12-Al3Sc particles is developed. An initiation criterion is proposed based on the precipitation kinetics of primary particles to address solute trapping under high solidification rates. Avrami’s equation is then used to estimate the progress of precipitation. The model is integrated into a cellular automata (CA) analysis to simulate the resulting solidified microstructure, in that the precipitation model is performed implicitly within the CA cells. It is shown that, in accordance with the experimental findings, the proposed simulation approach can predict the distinct fine- (FG) and coarse-grained (CG) zones at the fusion boundary and the meltpool core, respectively. The model can also deliver the reported enhancement of the FG zone under lower scanning speed and higher platform temperatures. These findings are explained in terms of particle number densities at different meltpool regions. Moreover, a semi-2D simulation with a very small cell size is suggested to address the extremely fine grain structure within the FG zone.

1. Introduction

Additive manufacturing (AM) of different aluminum alloys typically leads to a microstructure dominated by nucleation close to the fusion boundary [1,2,3]. It is believed that this type of nucleation is caused by solid particles that act as inoculants for α-Al. The type of particles and their origin depend on the type and composition of the alloy. AlSiMg alloys, for example, are either hypo- or near-eutectic alloys, meaning that α-Al is the first solid phase to develop from the liquid during solidification. Therefore, the solid particles responsible for the fusion boundary nucleation in these alloys are explained through the inhomogeneous liquid between the so-called branching and dissolution temperatures. In other words, the solid particles survive within the fusion boundary zone where the temperature is below the particle dissolution temperature [4,5]. The same reason is behind the inhomogeneous as-cast microstructures of Al alloys containing high Mg and transitional metals where the primary intermetallic compounds are conventionally treated by homogenization and subsequent deformation processes [6]. Other techniques, such as irradiation with electromagnetic pulses, are also proposed for the refinement of as-cast microstructures in these conventional alloys [7].
In the development of novel aluminum alloys for AM, it is of interest to modify traditional alloys with components such as Sc and Zr [3,8,9]. The nature of solid particles in the melt of Sc- and Zr-modified alloys is different from that of AlSiMg alloys. In fact, under normal solidification conditions, the primary intermetallic phases such as Al3Sc, Al3Zr, and Al3 (ScxZr1-x) can develop either by eutectic or peritectic reaction before the solidification of α-Al. Such particles act as heterogeneous nucleation sites for α-Al [10,11]. The eutectic composition in the Al–Sc binary system is approximately 0.6 wt %. However, the Sc content of eutectic drops with the addition of Mg and Zr, such that even 0.25 wt % Sc along with 0.25 wt % Zr may be considered as a hyper-eutectic alloy [10]. Depending on the cooling rate under non-equilibrium solidification, some Sc content can be trapped in the solid solution. Consequently, in addition to the primary Sc particles, the secondary precipitates can develop in the supersaturated α-Al by the intrinsic heat treatment, which is the reheating by the neighboring and upper-layer hatches [11].
The crystal structure of the L12-Al3Sc intermetallic phase is described as ordered face-centered cubic (FCC) with a lattice parameter very close to that of α-Al [10,12]. Therefore, it is an ideal substrate for the nucleation of aluminum. Based on the inoculating effect of such particles, a very remarkable fusion boundary nucleation occurs in the Sc-modified alloys. The experimental findings reveal two significantly distinct zones with extremely fine and coarse grains along the fusion boundary and in the middle of the hatches, respectively [2,13]. A similar feature is reported in Zr-modified alloys [3,14]. Researchers have explained this mostly through the formation of the primary particles under low solidification rates at the fusion boundary, and solute trapping under high solidification rates in the meltpool center (e.g., [11,14]). It has also been demonstrated that increased energy density and platform temperature promote the creation of the fine-grained zone [13,15].
All of the findings discussed above emphasize the role of the intermetallic particles in the resulting solidified microstructure of Sc- and Zr-modified alloys. Despite the presented interpretations of the experimental evidence in the literature, consistent and plausible theories and models are still lacking. In a previous study, the authors developed a particle-based nucleation model for AlSi10Mg and integrated it into the cellular automata (CA) simulation of solidification [16]. As outlined above, the nature of particle formation is different in Sc- and Zr-modified Al alloys. Therefore, this research aims to develop a physics-based model for the evolution of the related particles and their effects on the solidified microstructure during the laser powder bed fusion (LPBF) process. First, the development of the L12 phase is modeled based on the thermodynamics and kinetics of precipitation. The developed model is then incorporated into the CA simulation of solidification. Finally, in line with the experimental results in the literature, the integrated CA analysis is evaluated under various laser scanning conditions.

2. Material and Models

In this work, an Sc- and Zr-modified 5xxx alloy is analyzed. The alloy is commercially known as Scalmalloy® with the nominal composition (wt %) of Al-4.6Mg-0.66Sc-0.42Zr-0.49Mn. Melting and solidification of this alloy during a single track of laser scanning in various conditions are investigated. As stated in the Introduction, the Sc particles are crucial in the nucleation of α-Al and the solidified microstructure. The current model is thus primarily concerned with the evolution of these particles during heating and cooling. Under the rapid and non-equilibrium conditions of additive manufacturing, both thermodynamic and kinetic aspects should be included in the model.

2.1. Evolution of L12 Phase

In the present study, the thermodynamics of particles are addressed using the material simulation software JMatPro® (Version 9.0, Sente Software Ltd., Guildford, UK), so that the evolution of different phases during heating and cooling of the alloy is calculated versus temperature. As can be seen in Figure 1a, about 0.017–0.18 wt % Al3Sc-L12 phase exists in the solid before melting. The precise value, in fact, relies on the previous thermal experience. Nonetheless, it is assumed that solid-state precipitation by the intrinsic heat treatment can result in a roughly identical initial L12 content despite possible solute trapping during the previous solidification. Therefore, a uniform initial distribution of Sc particles is considered in the present model. Sc exists in phase DO23, too. However, only L12 phase is taken into account due to its good lattice match with α-Al [10]. In contrast, the tetragonal crystal structure of DO23 shows a relatively poor matching with α-Al [17]. According to Figure 1a, L12 phase begins to dissolve at about 880 K until complete dissolution above 980 K. Likewise, α-Al melts from 860–910 K.
Comparing Figure 1a,b, one can see that the temperature range of the primary L12 phase formation is almost the same during solidification. The primary L12 particles can form below 990 K. Liquidus of α-Al is similarly about 910 K. The end of solidification for this phase is treated in JMatPro according to Scheil’s equation. This is not included in the current model. As addressed further below, the solidification of α-Al is examined using the common CA analysis based on the local undercooling and the growth kinetics model.
To account for the precipitation kinetics of primary Sc particles, a time–temperature–transformation (TTT) model is employed. The model is developed based on a criterion for the initiation of precipitation (nucleation), and a subsequent model for the evolution of particle fraction and number density. The initiation criterion demands a required time before precipitation. This temperature-dependent characteristic time is commonly referred to in the literature as the nucleation incubation time and taken as a phase selection criterion [18,19,20]. The incubation time ( τ 0 ) can be expressed as (e.g., [19]):
τ 0 = 7.2 R g f ( θ ) 1 cos θ · a 4 d a 2 x eff · T r D u Δ S m Δ T r 2
where R g is the gas constant, θ is the wetting angle, f ( θ ) = 0.25 ( 2 + cos θ ) ( 1 cos θ ) 2 , a is the atomic jump distance, d a is the average diameter of the particle phase, x eff is the effective alloy concentration that equals the ratio of the mole fraction of Sc in liquid to that of the particle, T r = T / T l , p , T l , p is the liquidus temperature of the precipitating phase, Δ T r = 1 T r , D u is diffusivity in the undercooled melt, and Δ S m is the molar entropy of fusion. As outlined by Shao and Tsakiropoulos [20], significant errors could be introduced in the case of using an Arrhenius expression for D u with the normal values of activation energy and pre-exponential factor of the liquid diffusion coefficient. The use of the Stokes–Einstein equation is proposed to estimate D u from its relationship with viscosity ( η ) [21]:
D u = k B T 6   d a , l   η
in which k B is Boltzmann’s constant and d a , l is the average distance between liquid atoms ( d a ). The viscosity of the undercooled melt can be approximated by:
η = 10 3.3 exp ( 3.34 T l / ( T T g ) )
where T l is the melting point and T g is the ideal glass transition temperature approximated by T g = T l / 3 .
As shown in Figure 2, the characteristic incubation time of phase L12 is derived as a function of temperature using the abovementioned model with the applied parameters listed in Table 1. The primary L12 particles are thought to nucleate heterogeneously on the oxides and impurities present in the liquid [22,23]. In terms of lattice matching with the inoculant, this is not an ideal nucleation condition. Therefore, a moderate wetting angle of θ = 60° within the range suggested for heterogeneous nucleation is assumed [24]. For a better insight into the different solidification conditions, the incubation time of α-Al is also depicted in Figure 2, so that a phase selection criterion can be deduced from the cooling condition in accordance with the two competing phases, i.e., L12 and α-Al. Note that in this case a wetting angle of θ = 40° is applied according to the low lattice mismatch between α-Al and L12, x eff = 0.96 and Δ S m = 13.3 J/mol.K [20]. It can be seen that at low cooling rates, the primary L12 phase can precipitate before the formation of α-Al. These primary particles can act as nucleation sites for the subsequent solidification of α-Al. On the other hand, at high cooling rates, the required incubation time for the L12 phase will not be met, resulting in solute trapping. In this case, no primary particle can contribute to the nucleation of α-Al. It is necessary to note that only primary phases are addressed here. Even in the case of the solute trapping situation, the L12 particles that were originally present in the solid and survived in the liquid may contribute to the nucleation of α-Al.
The precipitation of the primary particles proceeds after the initiation criterion is met. The second part of the TTT model is, therefore, needed to address the progress of the mass fraction and number density of the particles according to the experienced thermal field. This is carried out in the present model through the so-called Avrami equation based on the diffusional nature of the primary particle nucleation and growth [25,26,27]. The Avrami equation is expressed here in terms of the relative fraction of particles ( f r , p ) as:
f r , p = 1 exp ( k a t r n ) ,   t   >   τ 0
where f r , p = f p / f p , , f p is the current fraction of particles at the relative time t r = t τ 0 , t is the current time, f p , is the thermodynamically achievable fraction of particles after a long period, k a is the rate constant, and n is the Avrami exponent. The development rate of f r , p at a given temperature depends on the particle nucleation and growth rates. Therefore, k a is a function of temperature and can be related to nucleation and growth rates. The nucleation rate is known to be inversely proportional to the incubation time τ 0 [24]. Concerning the growth rate, the normal velocity of the solid/liquid interface is proportional to the undercooling ( Δ T p = T l , p T ). Assuming a 3D growth of particles, k a is thus expressed as:
k a ( T ) = C a Δ T p 3 τ 0 ( T )
in which C a is the proportional constant. The Avrami equation was originally proposed for phase transformation at a constant temperature. However, it has been generalized to non-isothermal transformation based on the rule of additivity (e.g., [28,29,30]). The approach proposed by Vazquez et al. [28] is employed in the present work:
d f r , p d t r = n k a ( 1 f r , p ) I n 1
I = 0 t r k a ( T ( t ) ) d t
Equation (6) determines the variation of particle fractions at a given time. Therefore, the integrated amount of particle fractions at each point of the material is a function of the temperature history. It is necessary to note that in this work, f p represents the mass fraction of particles, which is not far from the volume fraction due to the comparable densities of the L12 phase and α-Al. Along with the evolution of f r , p , the development of the particle number density ( N p ) can be calculated based on the rate of particle nucleation, being inversely proportional to the incubation time τ 0 . Calculations will be carried out in the framework of a CA analysis to update the state of each cell at each timestep.

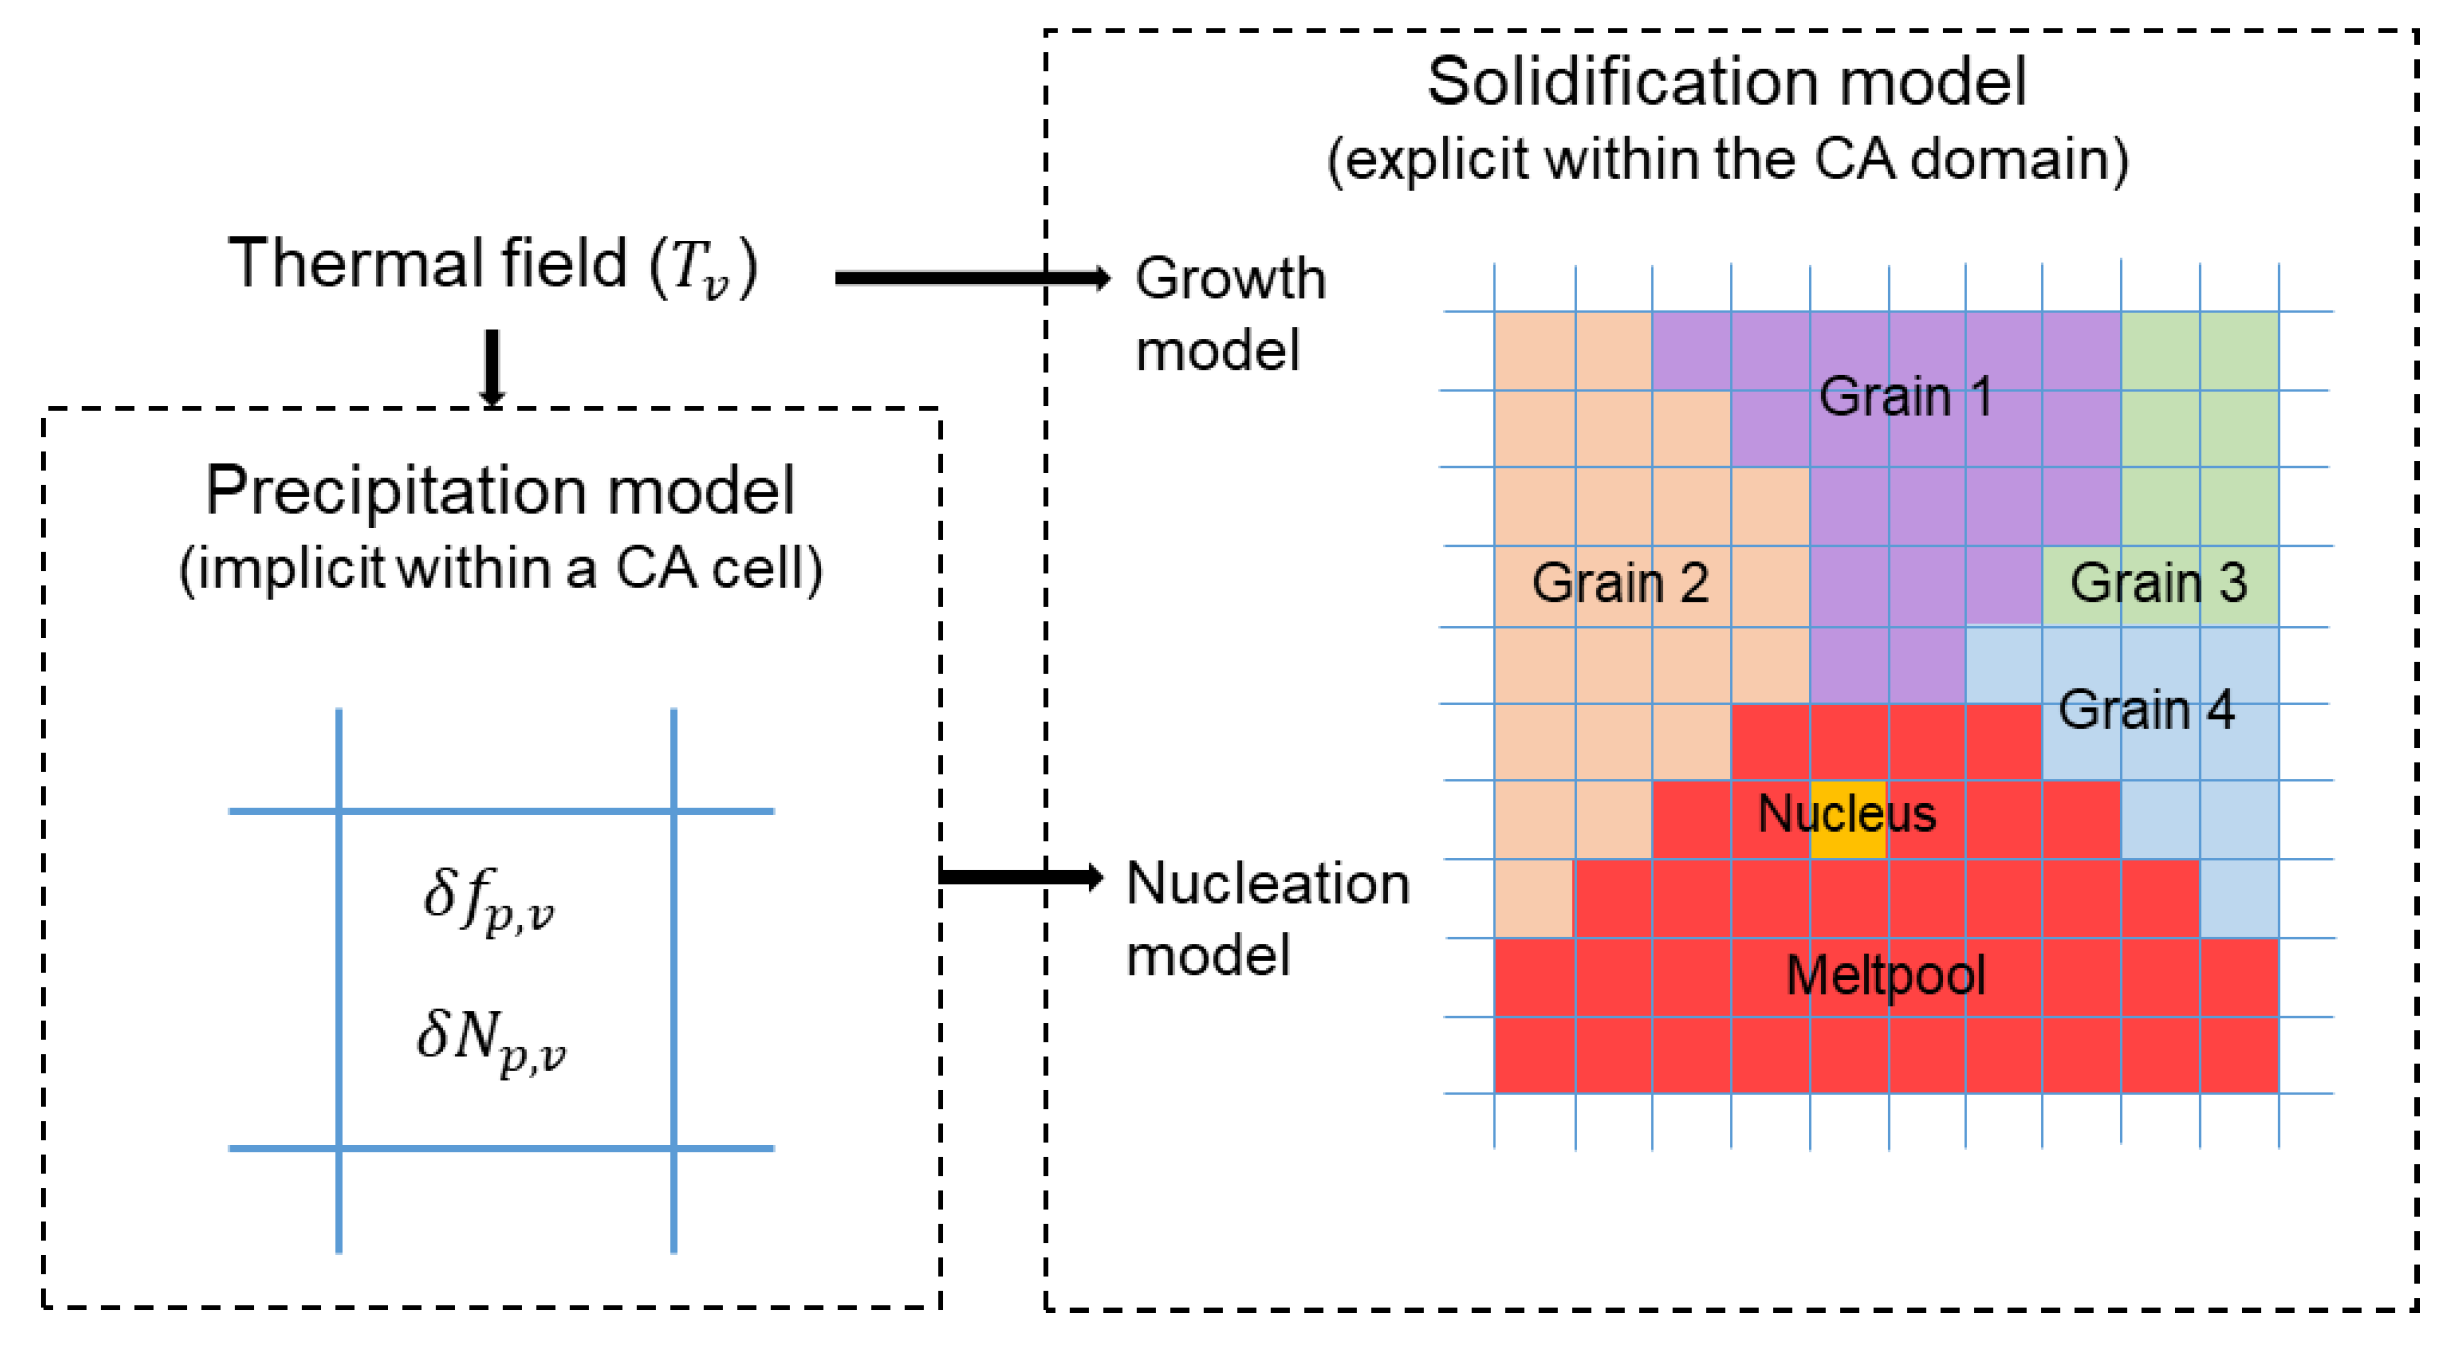
2.2. Integration of Precipitate and Microstructure Evolution into the CA Analysis

This section explains the methodology proposed to incorporate the evolution of L12 phase into the development of an AM solidified microstructure. This is carried out in the framework of a CA model. To address the very fine grain size within the FG zone, a very small CA cell size ( Δ x ) is required. However, a 3D model with submicron Δ x has an unaffordable computing cost. Therefore, two different CA models are developed (Figure 3). The domain for the 3D analysis is of the size 500 µm × 300 µm × 190 µm (SD × TD × BD; SD, TD, and BD represent the scan, transverse, and built directions, respectively) discretized in cells of the size Δ x = 1 µm. The semi-2D domain is 5 µm × 300 µm × 175 µm (SD × TD × BD) with a cell size of Δ x = 0.25 µm. Both domains are initialized by a non-textured grain structure with an average grain size of 10 µm. As shown in Figure 3, a steady-state thermal field moves across both domains. The thermal field is generated by a forward-time centered-space finite difference (FD) analysis [31]. The FD domain is 900 µm × 500 µm × 275 µm discretized in cells of size 5 µm. The heat source is modeled by a volumetric Gaussian distribution of heat flux within a beam radius of 100 µm with a total input power of 100 W. Two different scanning speeds of 500 and 1000 mm/s and platform temperatures of 298 and 473 K are considered to evaluate their impacts on the resultant microstructures. For further information on the FD analysis, the reader is referred to the authors’ earlier publication [16]. The thermophysical properties of the alloy are derived as functions of temperature using JMatPro® (Figure 4). To account for the Marangoni effect, the thermal conductivity of the liquid is enhanced by a factor of 2.5 [32]. The contributing latent heat of phase transformations is also integrated into the heat capacity. As shown in Figure 4, the overall value of latent heat is 378 kJ/mol.
The FD analyses are carried out prior to the CA simulations. Therefore, a one-way coupling approach is employed. An example of the calculated thermal field with a scanning speed of 1000 mm/s and a platform temperature of 298 K is illustrated in Figure 5. The distributions of temperature, cooling rate, and thermal gradient in two sections are shown as well.
The present CA analysis is based on the methodology developed by Rappaz and Gandin [33,34]. New features are included to assess the evolution of precipitates and their contribution to α-Al nucleation. Therefore, each cell is given two sets of attributes. The first set is to address the common solidification event. The grain index, the nucleation index, the crystallographic orientation, and the state (solid, liquid, interface) are collected in this set. The other set is to address the evolution of L12 particles. Attention should be paid to the different scales of the two concepts. Commonly, the CA simulation of solidification is performed explicitly. Namely, each cell at each timestep belongs to a certain grain. In the case of precipitates, however, the size of particles is too small to be considered explicitly. Instead, the relevant attributes, such as the fraction ( f p , v ) and number density ( N p , v ) of particles, should be assigned a floating-point number within each cell. This is schematically demonstrated in Figure 6. Therefore, the precipitation model becomes an issue of precipitation level in every CA cell.
Concerning the evolution of precipitates during heating and cooling (Section 2.1), a CA cell can pass through different zones distinguished in Figure 7. These zones create a significant discontinuity in particle distribution within the meltpool trace. The temperature within Zone I is above T l , p . Consequently, all initial precipitates are dissolved in this zone. The cells in this zone will subsequently pass through Zone III, where the temperature is lower than T l , p , allowing the primary particles to form, provided that the precipitation kinetics described in Section 2.1 are met. On the other hand, the temperature in Zone II never gets higher than T l , p . Therefore, a portion of the precipitates that were initially present in the solid remains. The solid is supposed to have a uniform starting particle fraction ( f p 0 ) with a number density of N p 0 . Referring to Figure 1a, one can calculate the number of remaining particles ( f p , v ) during heating according to the temperature that a cell has experienced. Likewise, N p , v is supposed to vary during heating proportional to f p , v / f p , 0 . The evolution of precipitates during cooling in both Zones II and III is addressed below.
The model presented in Section 2.1 is employed to update the fraction and number density of L12 particles during cooling. In this regard, the model must be subjected to the spatial and time discretizations of CA analysis. Precipitation is expected to initiate after the period of τ 0 , which is a temperature-dependent parameter (Figure 2). For a given CA cell that experiences an arbitrary temperature history at various timesteps, this is tracked by a normalized particle formation time, τ v , which varies with each timestep ( δ t ) as:
δ τ v = δ t τ 0 ( T )
An example of the stepwise variation of τ v is shown in Figure 2. Particles start to develop when τ v = 1 is reached. Note that Zone II is exempt from this criterion since the particles are already present. Therefore, τ v is initialized to unity at the beginning of the CA simulation and is reset to zero when a cell enters Zone I. Precipitation in the cells with τ v 1 follows the Avrami model (Equations (4)–(7)), with the particle fraction ( f p , v ) and number density ( N p , v ) being updated at each timestep. Equation (7) is revised to compute the variation of integral I within a CA cell ( δ I v ):
δ I v = k a ( T ) δ t
where k a ( T ) is determined from the current cell temperature using Equation (5). Having I v and k a , one can estimate the variation of from the CA version of Equation (6):
δ f p , v = n k a ( f , p f p , v ) I v n 1 δ t
The developed number density is directly related to the nucleation rate of the particles, which is inversely proportional to the nucleation incubation time ( τ 0 ). Therefore, the following equation is proposed to update N p , v at each timestep:
δ N p , v = C n τ 0 δ f p , v
where C n is the proportional constant for the particle nucleation rate.
The developed precipitation model, as integrated into the CA analysis of solidification, provides a foundation for the physics-based nucleation of α-Al. The heterogeneous nucleation of α-Al on the L12 particles is thus related to the particle number density of a cell within the undercooled liquid:
P n , v = P n p N p , v
where P n , v is the nucleation probability of the CA cell and P n p is the probability of a particle to accommodate α-Al nucleation.
The CA simulation of solidification in terms of grain competition and growth follows the same rules as described in detail in [16]. The moving thermal field is read at each timestep to update the temperature of the scanned cells. The state of a cell is modified to a liquid when it reaches a temperature above the melting point of α-Al ( T l , p ). All the neighboring solid cells are then transformed into interface cells that are subject to the growth rule. A growth center associated with an octahedral dendrite envelope with the main diagonals corresponding to <001> (easy-growth direction for FCC metals [24]) is called at the center of each interface cell. The same growth rate (v) proposed for AlSi10Mg based on the Kurz–Giovanola–Trivedi (KGT) model [35] is employed to calculate the local growth rate of α-Al as a function of the local undercooling ( Δ T α = T l , α T ) [16]:
v = 7.3 × 10 8 Δ T α 3.34   m / s
The CA timestep δ t is adapted such that the maximum growth of an envelope is less than a quarter of the cell size Δ x [36]:
δ t = 0.25 Δ x v m a x
in which v m a x is the greatest growth rate of all cells in the domain. Liquid cells captured by a growing octahedron are transformed into interface cells, which inherit the grain index and orientation. When all nearby liquid cells have been caught, the state of an interface cell is changed to solid. Meanwhile, every liquid cell that meets the nucleation condition of Equation (12) turns into a growing interface cell with a random crystallographic orientation.
The abovementioned simulation approach including the FD analysis with a cell size of 5 µm followed by the CA calculations with either 3D (∆x = 1 µm) or semi-2D (∆x = 0.25 µm) domains takes approximately 3 h on a workstation with an Intel Xeon CPU E5-1620 @ 3.50 GHz (4 cores) and 16 GB of memory. Note that such simulations need around 3 GB of memory, whereas a similar 3D domain with submicron cell size of ∆x = 0.25 µm requires more than 150 GB of memory, which is unaffordable using the current workstation.

2.3. Adaptation and Calibration of Parameters

Several parameters were introduced in the precipitation model. The ones involved in the initiation criterion, as addressed in Table 1, are attributed to the material. f p , can be determined as a function of temperature according to Figure 1b. It is estimated with a constant value of f p , 0 = 0.017 below 880 K and linear interpolation between 880 and 1000 K. The initial particle number density N p 0 can consequently be adjusted according to the average initial particle size d p 0 . Assuming a cubic shape for L12 particles, d p 0 is defined as:
d p 0 f p , 0 N p , 0 3
In the present work, the initial number density is set to 1020 m−3 associated with d p 0   = 55 nm. Kürnsteiner et al. [11] reported a number density of 0.5–3 × 10²¹ m−3 in a similar alloy following intrinsic heat treatment during directed energy deposition, which is close to the value considered in this study. Moreover, the particle size in the as-built samples is experimentally observed to be mainly in the range of 30–100 nm [37]. Regarding P n p , it is believed that only a small percentage of the particles (<3%) effectively act as nuclei during solidification [10]. Therefore, P n p is set to 0.02.
A broad variety of Avrami exponent n of 0.5–4 can be found in the literature. The value of this parameter is attributed to the conditions of the phase transformation, the dimensionality of the growth, the phenomenon that controls the growth, the possibility of recalescence, etc. [38,39,40]. A value of n = 2 is adopted here based on the diffusion-controlled growth of the particles.
There are still two constants, C a and C n , to be adapted. These parameters, together, control the kinetics of precipitation and the resulting solidified grain size. It is, therefore, suggested to calibrate them according to the experimental findings in terms of solute trapping and grain size in Zone III. Here, in combination with the other adapted parameters, C a and C n are set to 2 × 10⁻⁷ K−3s−1 and 1017 m−3s, respectively.

3. Results and Discussion

Simulation results for a scanning speed of 1000 mm/s and a platform temperature of 298 K are shown in Figure 8. Distributions of the normalized particle formation time ( τ v ), the particle number density ( N p , v ), and the grain structure are depicted in two sections around the meltpool. The locus associated with τ v = 1 and the meltpool boundary are drawn in the micrographs to give a better insight into the particle evolution and the potential effect on the resultant microstructure. As expected, correlating Figure 8a,b, as well as d and e, shows that no primary particles form until τ v = 1, which is attributed to the initiation criterion described in Section 2.1 and Figure 2. Thereafter, primary L12 particles could form. However, for this scanning condition, the τ v = 1 locus lays behind the meltpool boundary. This means that a complete solute trapping occurs and no primary particles develop in Zone III under this scanning situation. The grain growth, thus, prevails over nucleation in this region. As a result, a coarse-grained (CG) zone is formed by solidification in this region (Figure 8c,f). In contrast, the very large number of particles remaining in Zone II inside the meltpool border (Figure 8b,e) contribute to nucleation, leading to a fine-grained (FG) zone with numerous new equiaxed grains (Figure 8c,f).
Both distributions of τ v and N p , v display a sharp and discontinuous transition between the two areas associated with Zones II and III, which is attributed to the remaining particles in Zone II. This explains the observed distinct bimodal grain structure in Figure 8c,f, which is in good agreement with the reported experimental results. For example, Spierings et al. [37] observed that the transition from a fine- to coarse-grained zone occurs in a very distinct position in the meltpool. Their results also demonstrated a discrete concentration of particles in the two zones.
Figure 9 presents the results for a scanning speed of 500 mm/s. The platform temperature is similar to the previous case in Figure 8, i.e., 298 K. It can be seen that an entirely different scenario occurs under this condition. That is, the τ v   = 1 locus lays in the meltpool area. This means that the primary L12 particles can form in the undercooled liquid ahead of the solidification front. However, since the interval between the beginning of precipitation ( τ v   = 1) and the solidification front is quite short, only a small number of particles are expected to form. This is confirmed in Figure 9b,e. A portion of the primary L12 particles will contribute to α-Al nucleation, leading to new equiaxed grains within the associated region in Figure 8c,f. Therefore, the resulting microstructure is quite different from that of Figure 8, namely, zones II and III both solidify in equiaxed grains. Furthermore, since nucleation prevails over epitaxial growth, the solidification front moves to lower undercoolings, implying a less elongated meltpool as compared to the previous case in Figure 8. It is worth noting that the evolving grain structures of the two zones remain still remarkably different, so that the extremely high density of the particles in Zone II leads to very fine grains, whereas the equiaxed grains within the solidified Zone III are significantly coarser.
For the next evaluation, the scanning speed is similar to the previous case (500 mm/s), but the platform temperature is raised to 473 K. The results are demonstrated in Figure 10. It is evident that the initiation of primary particle precipitation corresponding to τ v   = 1 is deeper in the meltpool. Therefore, a greater number of particles than that of the previous case can form ahead of the solidification front. As a result, nucleation in Zone III is more intense, and significantly finer grains are created. The contrast between the solidified grain structures of Zones II and III is less pronounced, suggesting a more uniform equiaxed grain structure under this scanning condition.
The presented results in Figure 8, Figure 9 and Figure 10 are supported by the experimental findings in the literature addressing more equiaxed grains at higher energy density and platform temperature [13,15]. Figure 11 presents the electron backscatter diffraction (EBSD) micrographs obtained by Yang et al. [13] under two different scanning speeds and platform temperatures. The same type of Sc- and Zr-modified Al alloy with a composition fairly similar to Scalmalloy were used in this study (Al-3.8Mg-1.08Sc-0.23Zr (wt %)). The results qualitatively confirm the current findings. That is, the fraction of equiaxed grains is increased by decreasing the scanning speed and increasing the platform temperature. The microstructure is almost fully covered by equiaxed grains driven by particle-based nucleation at low scanning speed and high platform temperature (Figure 11c).
SD sections of microstructures obtained from 3D and semi-2D simulations are compared in Figure 12. In addition, Figure 12g,h show the microstructures obtained without the proposed nucleation approach to highlight the influence of modification by Sc and Zr, so that the grain structure is governed by the epitaxial growth on the partially melted peripheral grains. The most significant difference between 3D and semi-2D simulations can be seen in Figure 12a,b, where due to the lack of nucleation in Zone III, columnar grains are expected to grow epitaxially from Zone II. The semi-2D simulation results in a very clear columnar grain structure within this zone (Figure 12a). In the microstructure generated by the 3D simulation, however, the associated grains are less elongated. A similar contrast can be seen in Figure 12g,h. This is because, in the 3D simulation, the columnar grains are connected to the grains that nucleate in a section behind the micrograph section, and, as shown in Figure 8c,f, grow perpendicular to the meltpool boundary. Such rotated columnar grains cannot be created in semi-2D simulation. The same difference between 2D and 3D simulations is reported by Gandin et al. [34] for microstructural simulation of precision casting. Except for this difference, the two approaches reveal identical microstructural features in Figure 12. Moreover, the stated difference is likely to be less noticeable in multi-layer simulations since a large portion of the columnar grains will be remelted and replaced by the upper hatches. Therefore, the semi-2D simulation can be suggested as an alternative to analyzing the solidification microstructure of Sr- and Zr-modified Al alloys, in particular when much smaller cell sizes are required to track submicron-scale evolutions. For example, the submicron grains observed in the FG zone are too small to be simulated in a CA domain with micrometer cell size. That is why most of the cells within the FG zone of the current 3D simulation host a new grain. This is well recognized in the high magnification micrograph of Figure 13b as compared to that of Figure 13a. It is evident that the semi-2D simulation with a cell size of 250 nm can, in detail, deliver the extremely fine grains of the FG zone. This area comprises grains with sizes ranging from 0.5 to 2 µm, which is consistent with the experimental measurements by Spierings et al. [15,37] on the same alloy processed through LPBF (0.6–1.1 µm).

4. Conclusions

A model is developed to track the evolution of particles during additive manufacturing of Sc-modified aluminum alloys and their effects on the resulting grain structure. The model is coupled with a CA analysis of solidification, in that the precipitation model is used to account for particle-based nucleation of α-Al. The following conclusions can be drawn:
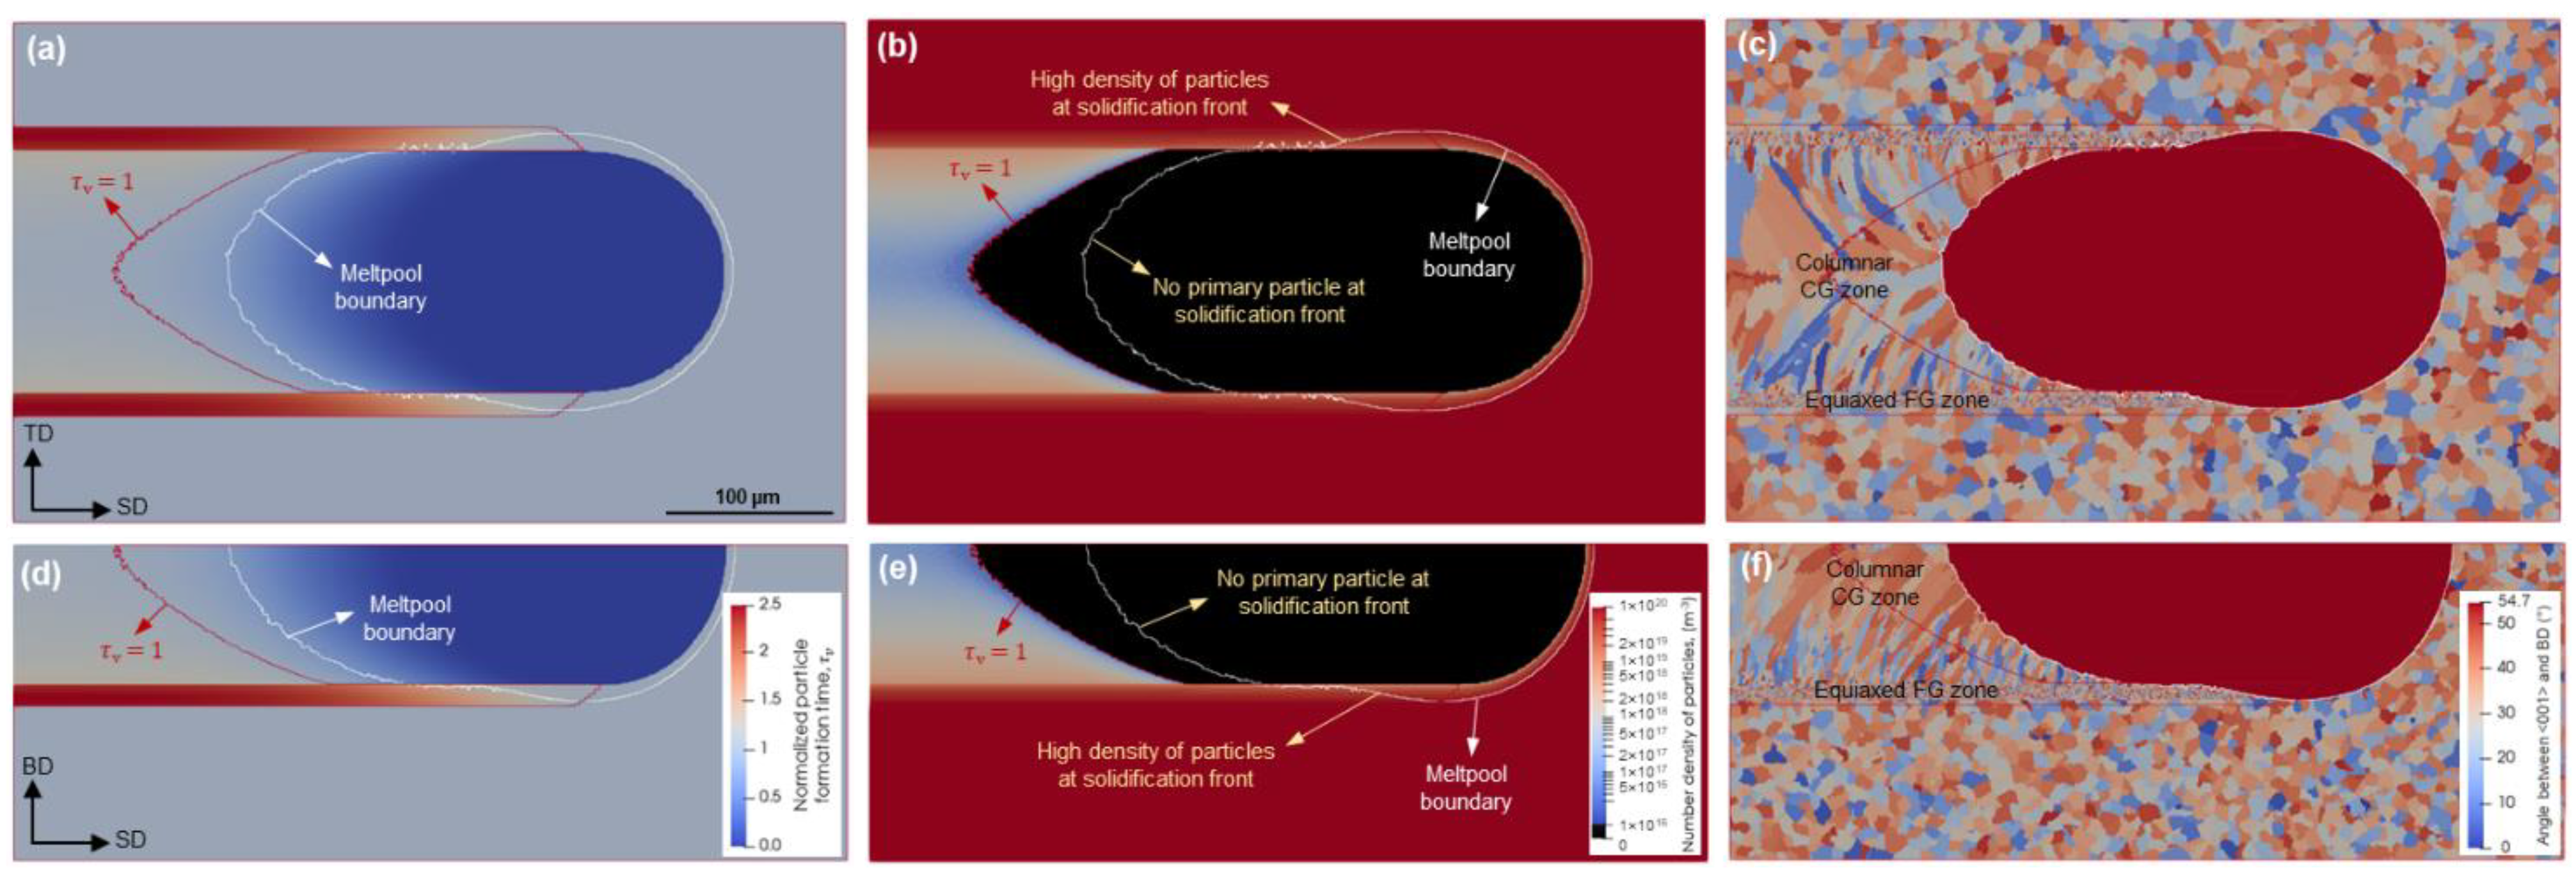
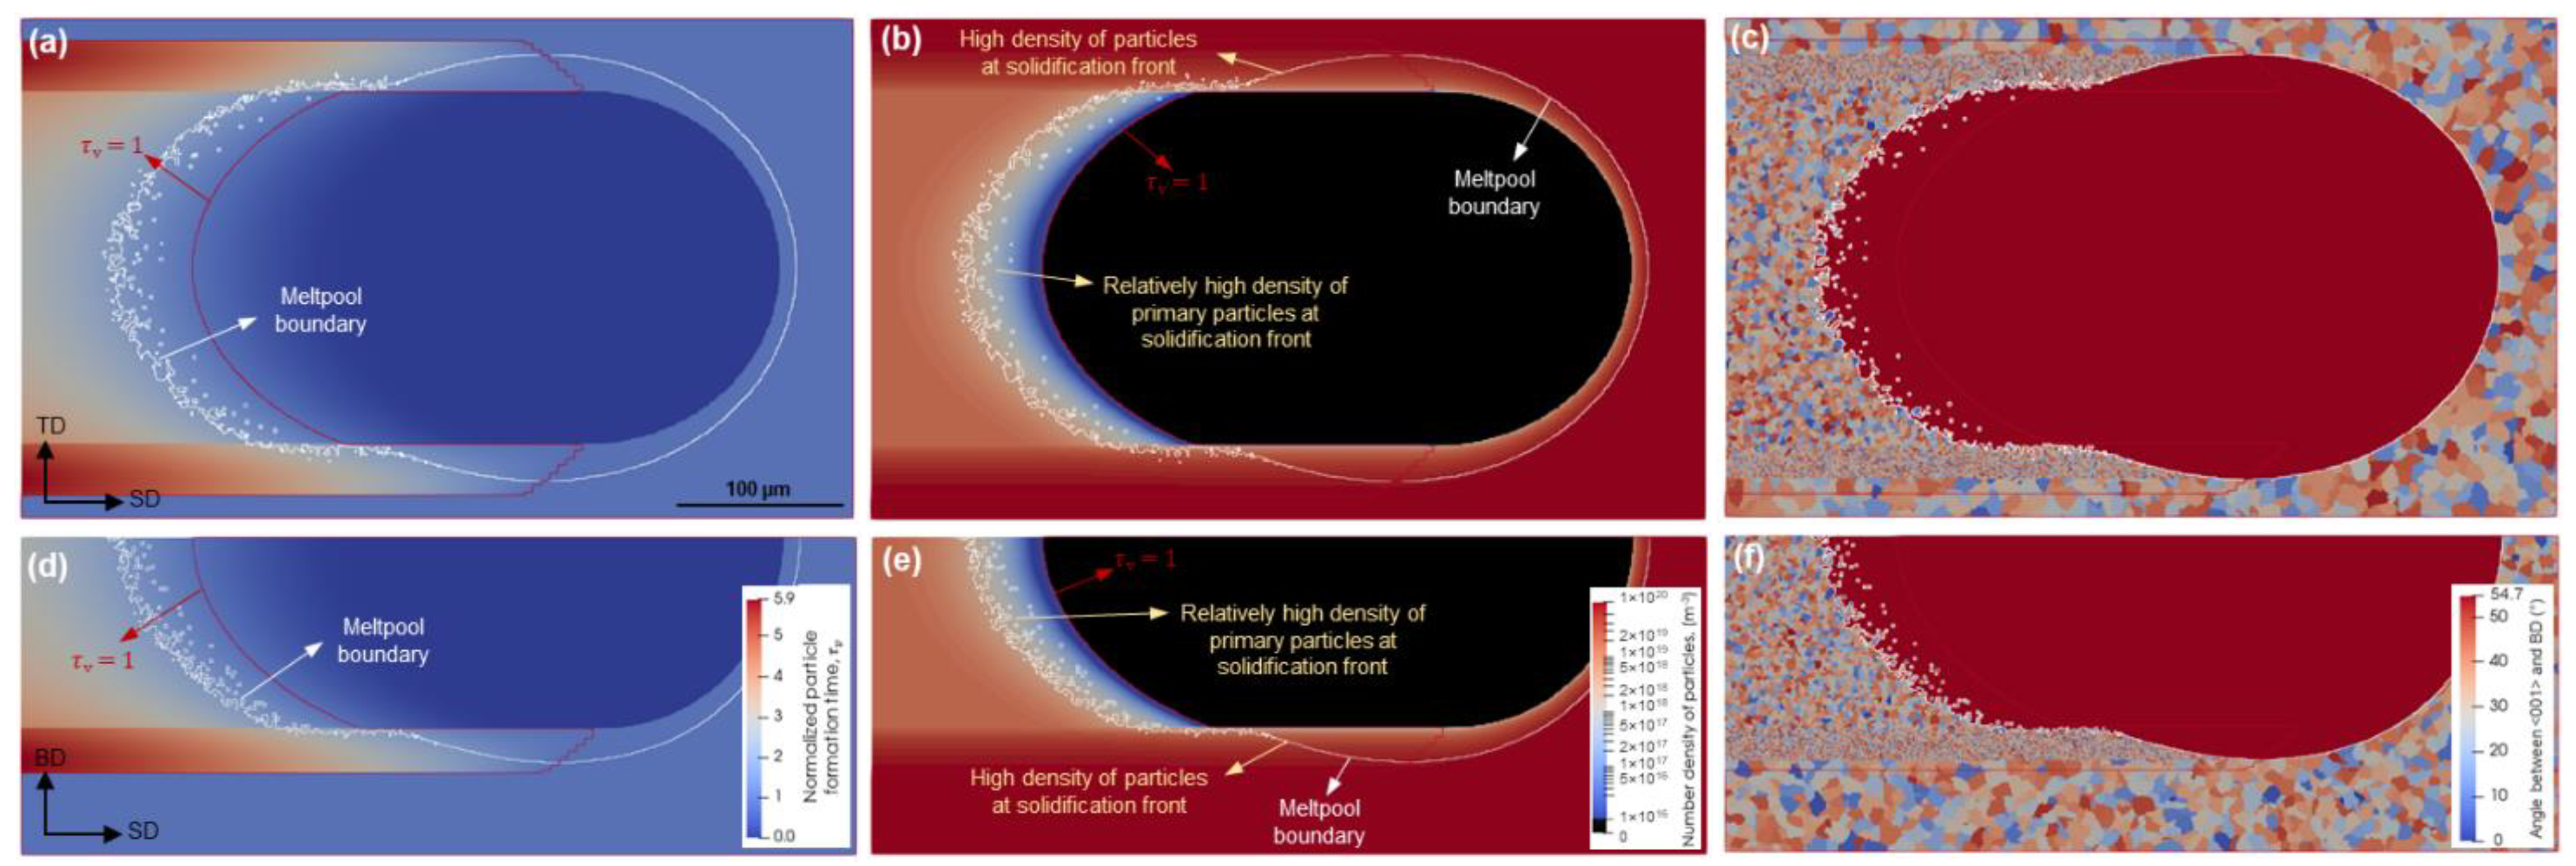
  • The suggested criterion based on the incubation time of precipitation allows the model to predict solute trapping and the ensuing absence of primary particles at high cooling rates. Accordingly, the experimentally observed FG and CG zones can be reproduced at the fusion boundary and meltpool center, respectively.
  • Aside from the lack of primary particles due to the solute trapping under rapid solidification at the middle of the meltpool, the initially available particles which partially survive in the fusion boundary region below T l , p contribute significantly to the fusion boundary nucleation. Therefore, a sharp transition from the FG to CG zone occurs.
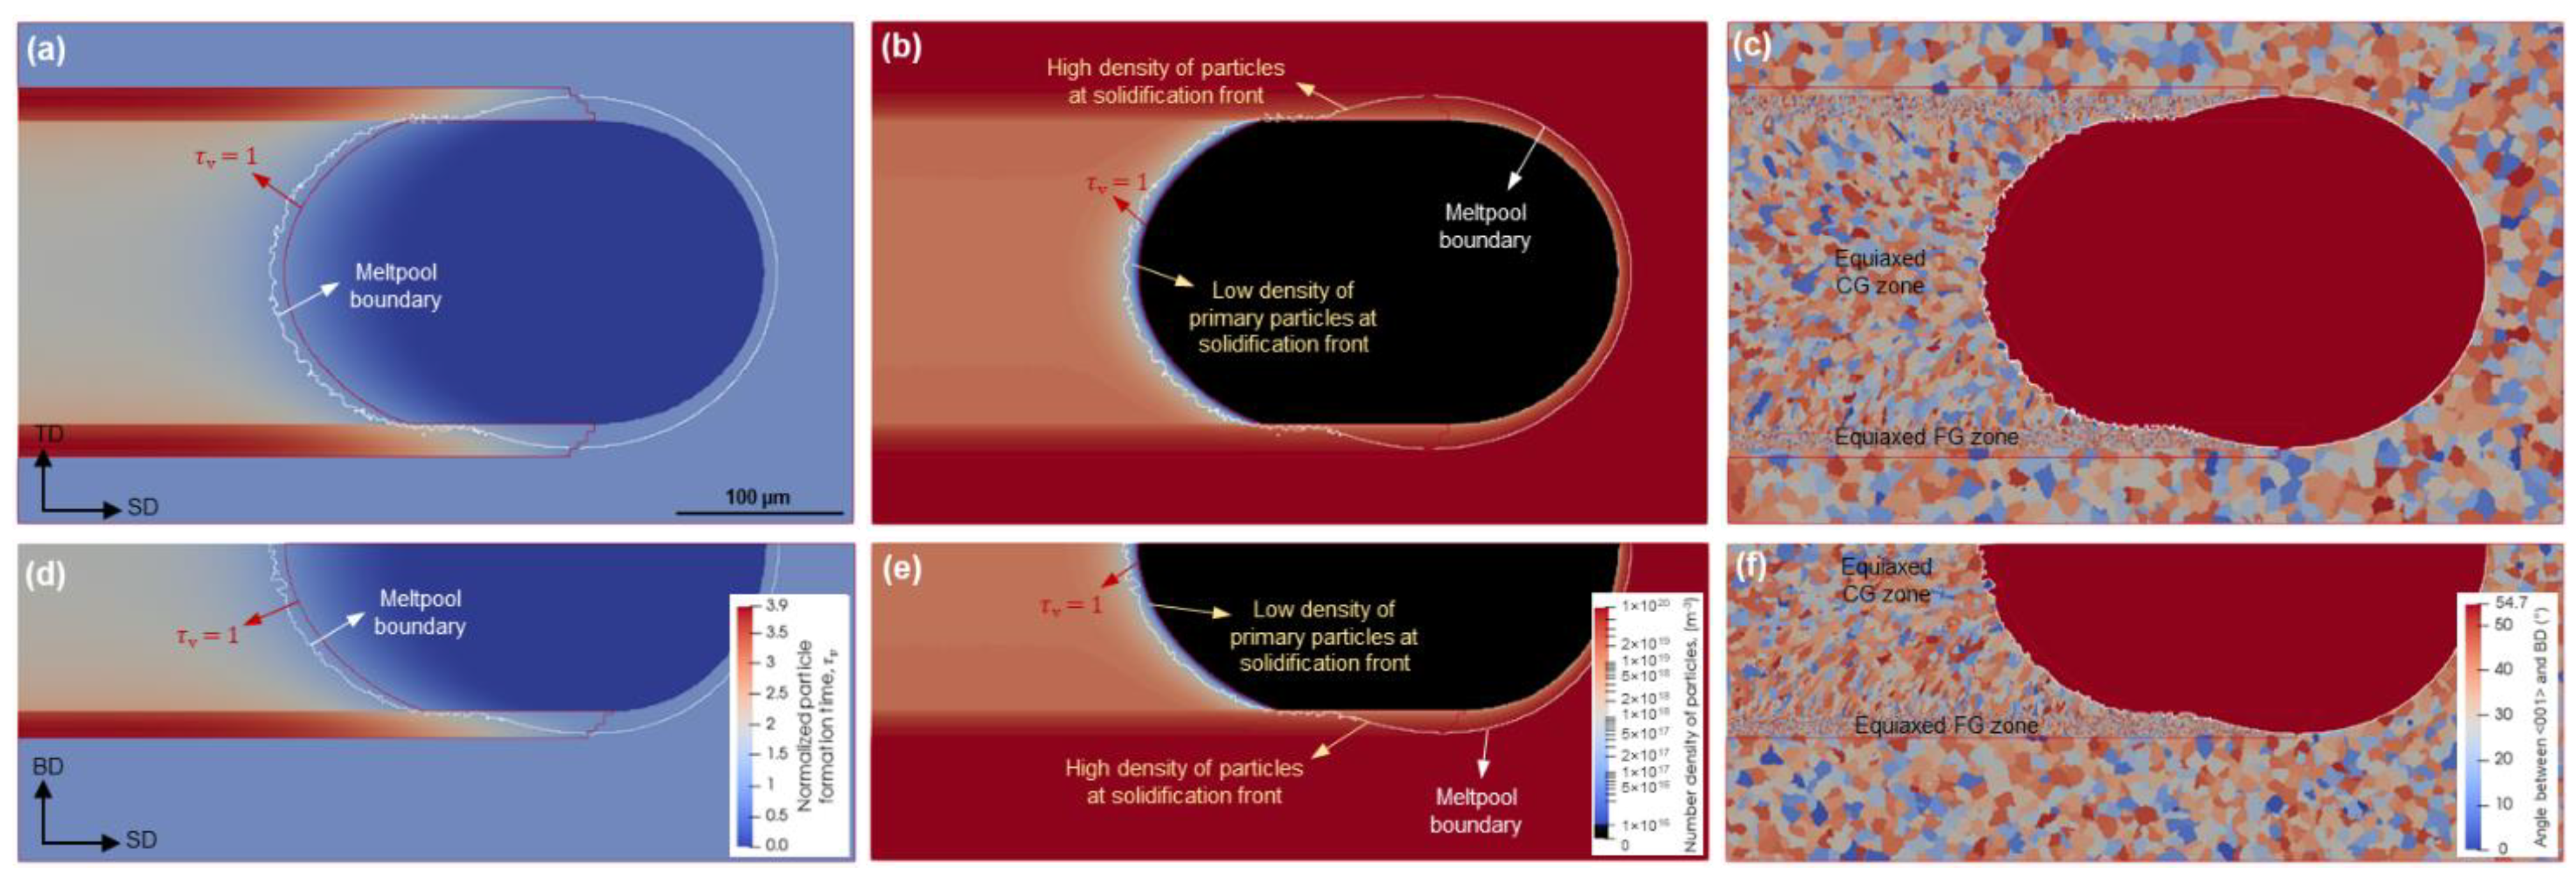
  • Reduced scan speed and increased platform temperature result in the τ v   = 1 locus being shifted into the meltpool, which allows the formation of primary L12 particles ahead of the solidification front. New equiaxed grains can consequently develop in the CG zone through the nucleation of α-Al on the L12 particles.
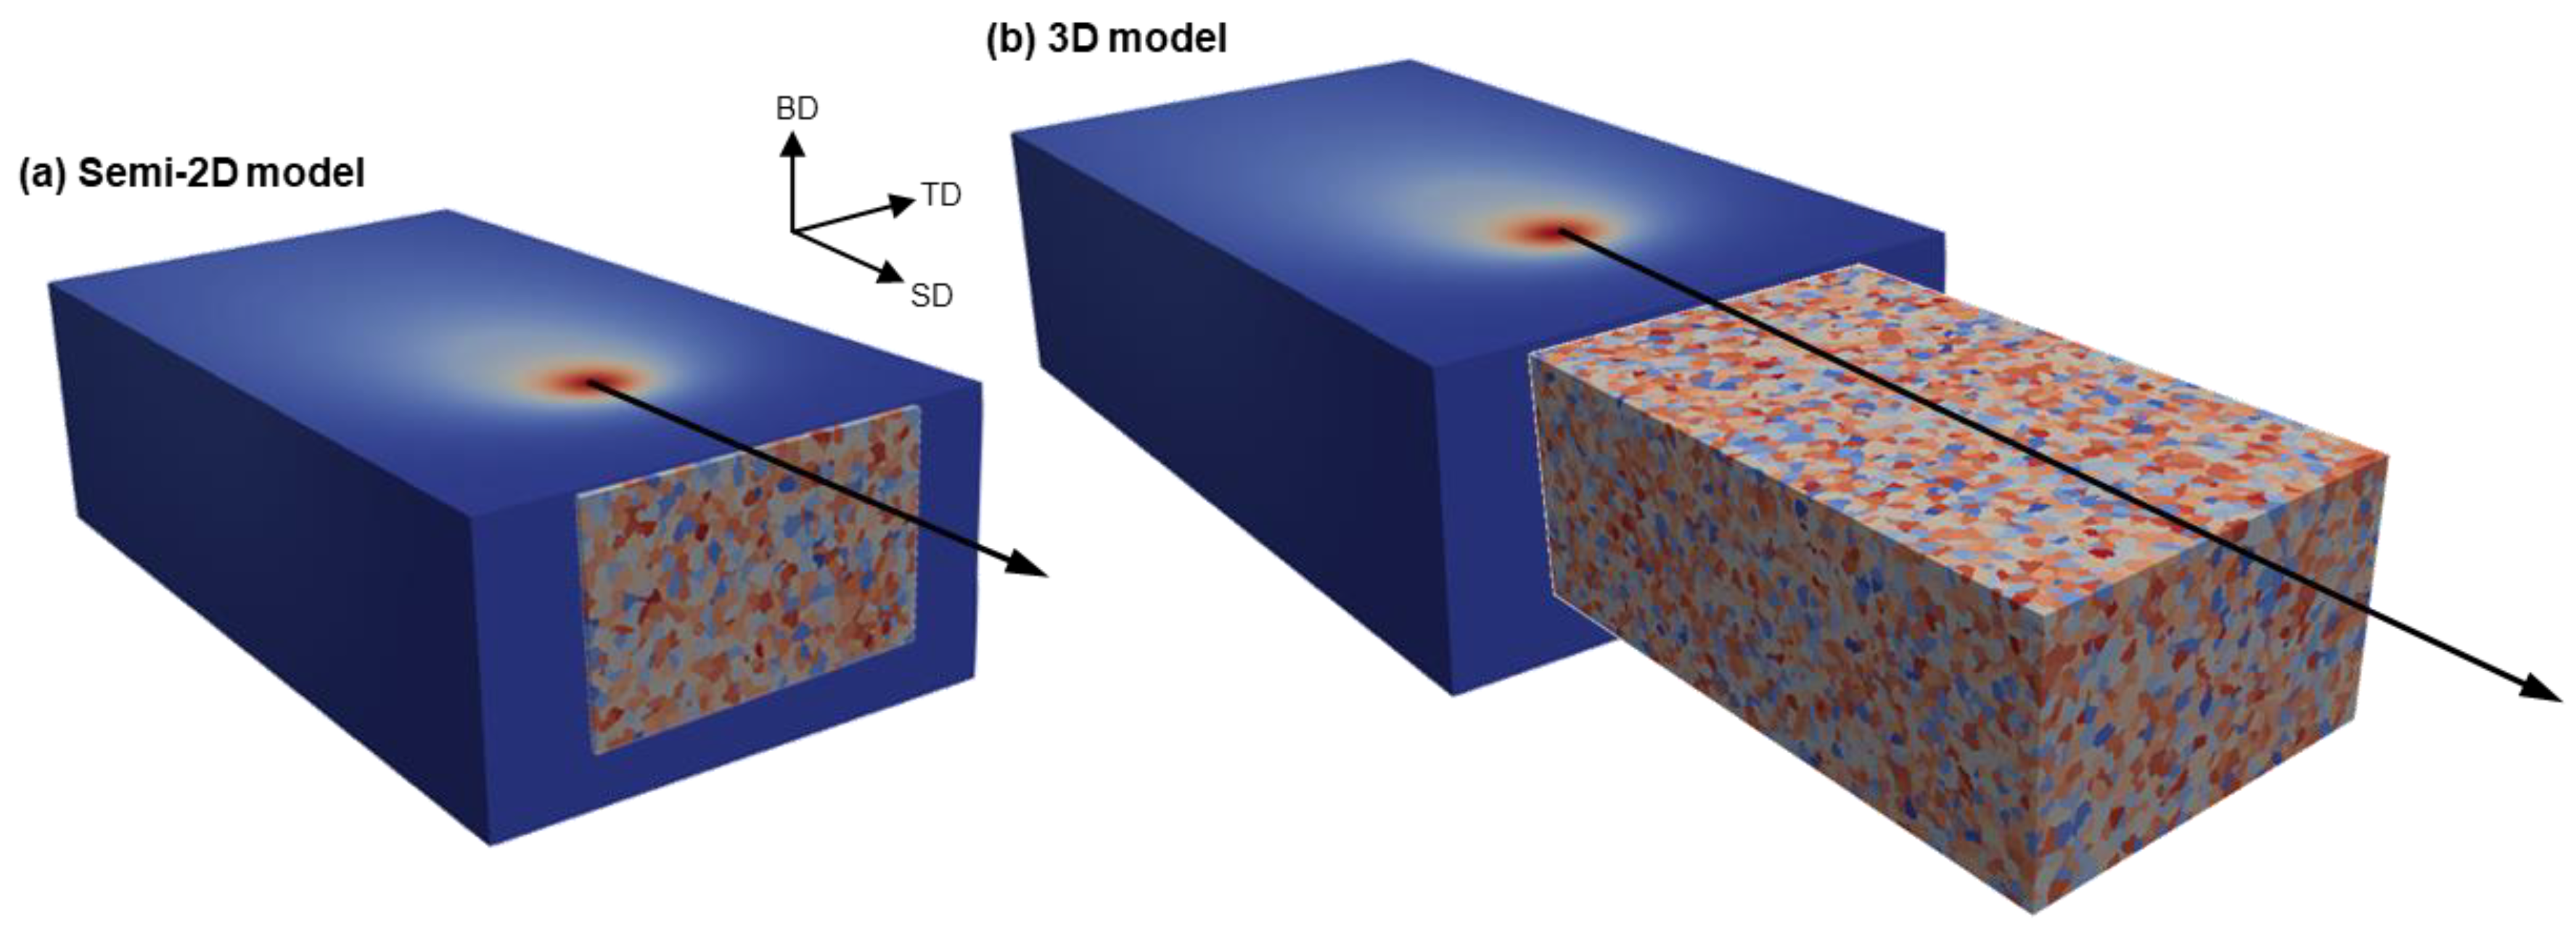
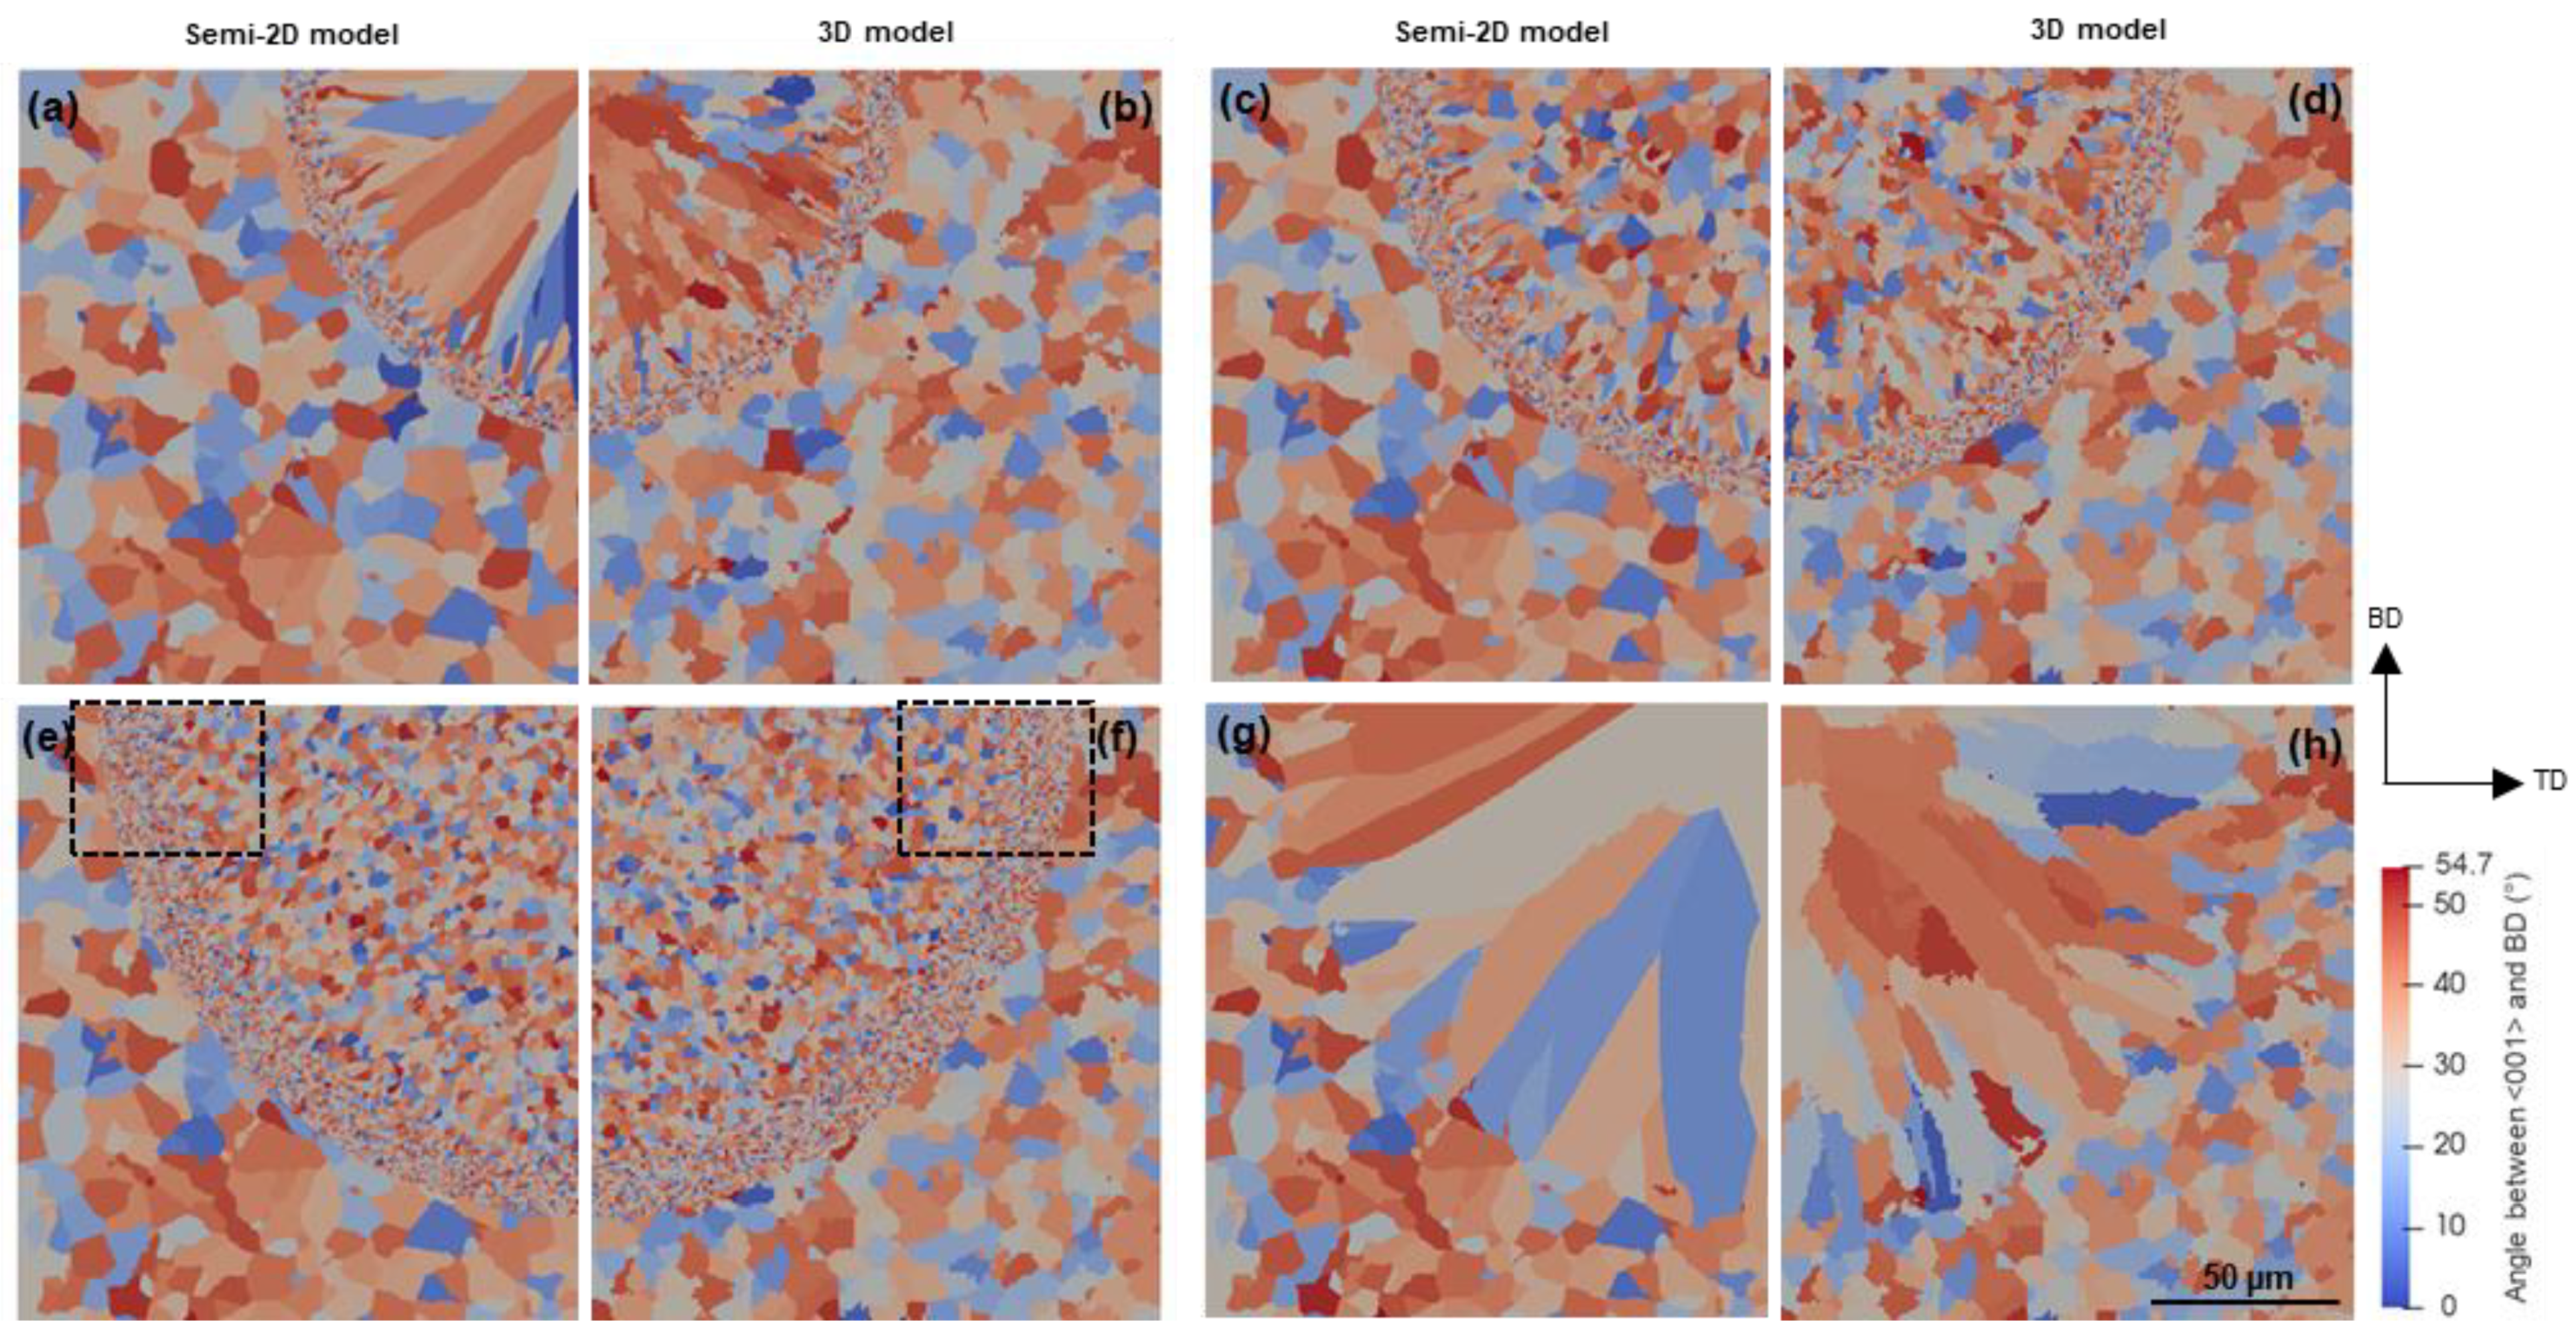
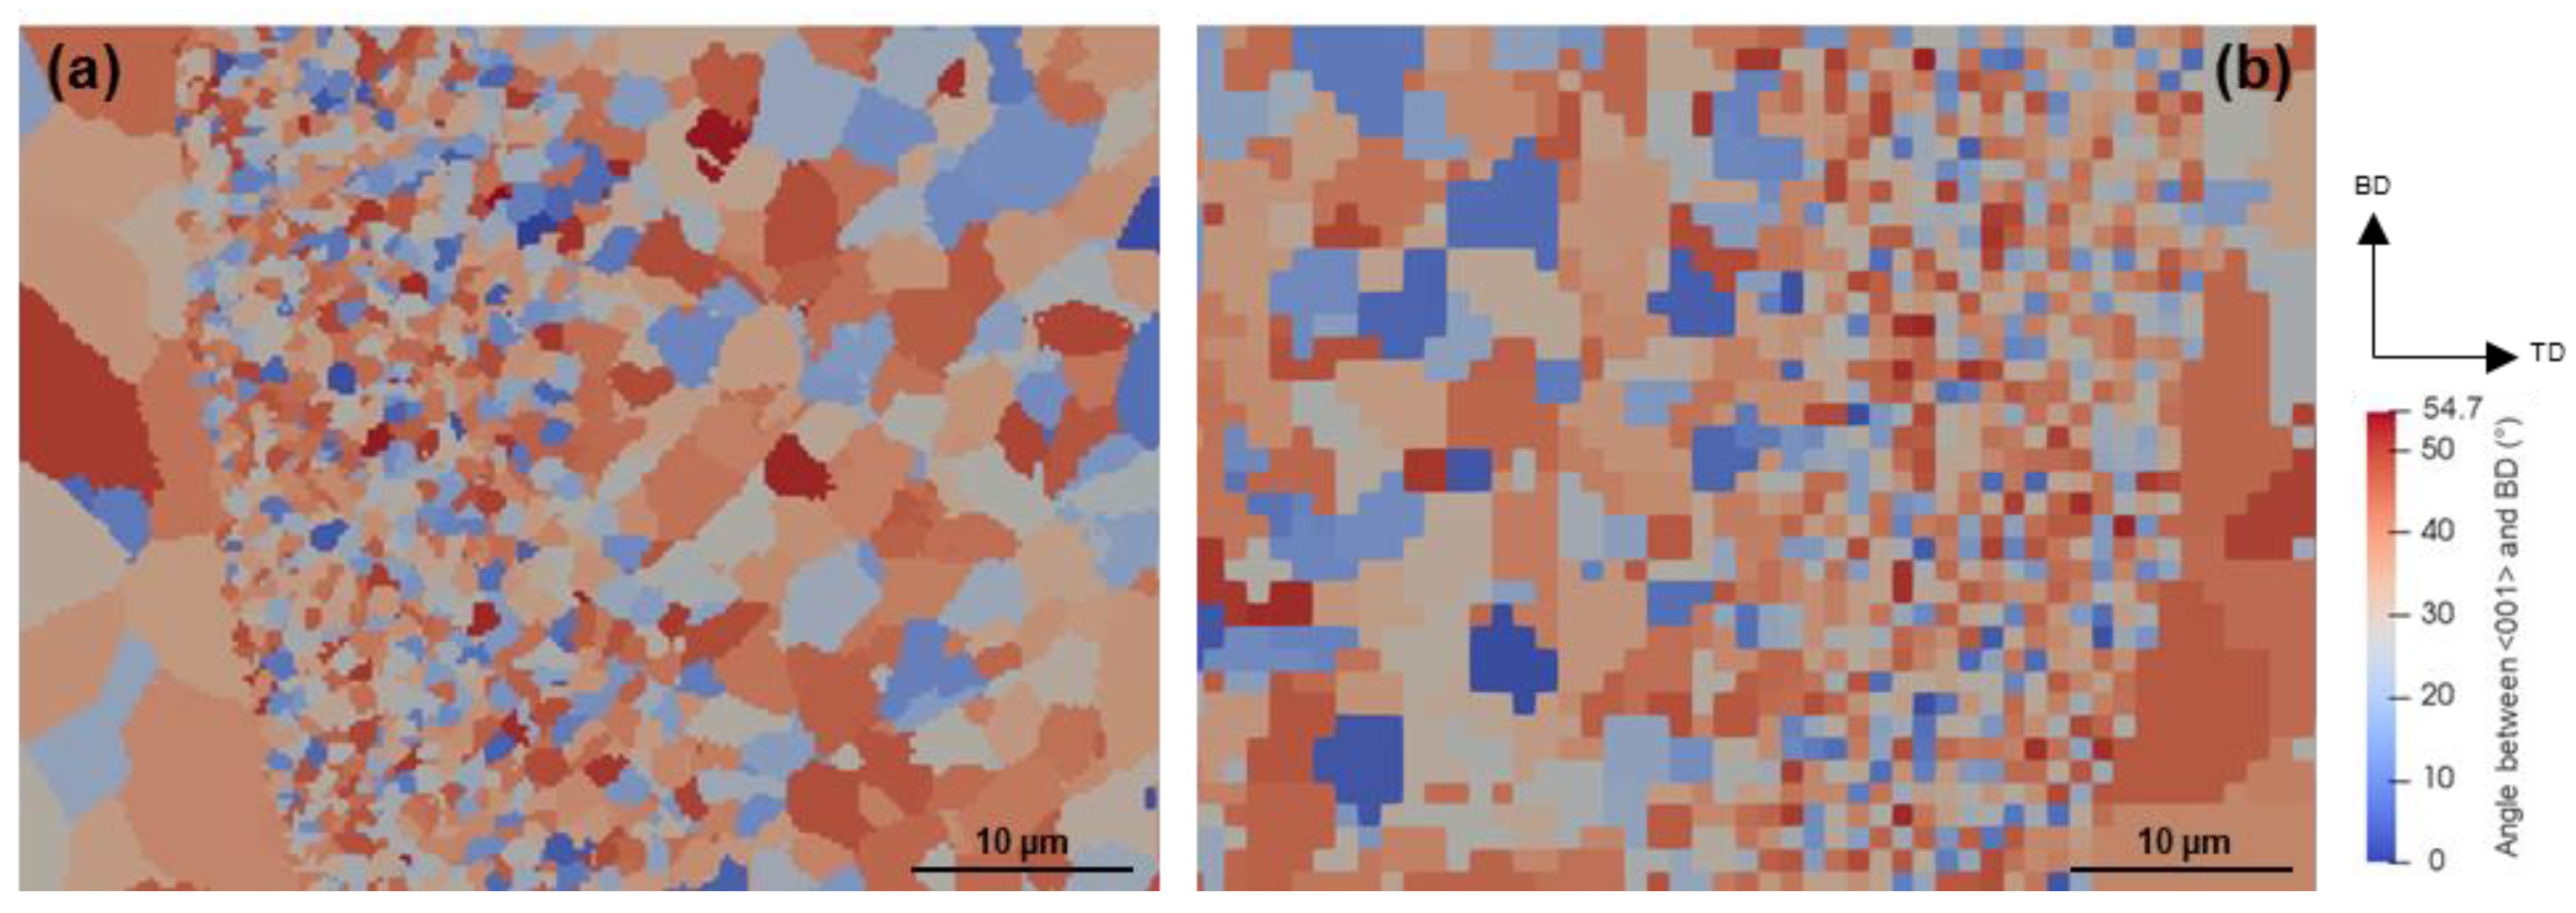
  • The extremely fine submicron grains in the FG zone can be simulated through the semi-2D CA simulation with nano-scale cell size. Except for the shape of the columnar grains under complete solute trapping conditions in the meltpool center, the semi-2D simulation findings are generally in good agreement with the 3D analysis.

Author Contributions

M.S.M.: conceptualization, methodology, software, validation, formal analysis, investigation, data curation, writing—original draft preparation, writing—review and editing, visualization. V.P.: conceptualization, methodology, validation, resources, supervision, project administration. Both authors have read and agreed to the published version of the manuscript.

Funding

This research was funded by the German Research Foundation (Deutsche Forschungsgemeinschaft), grant number PL 584/4-1, project number 388878396.

Institutional Review Board Statement

Not applicable.

Informed Consent Statement

Not applicable.

Data Availability Statement

Not applicable.

Conflicts of Interest

The authors declare no conflict of interest.

References

  1. Liu, X.; Zhao, C.; Zhou, X.; Shen, Z.; Liu, W. Microstructure of selective laser melted AlSi10Mg alloy. Mater. Des. 2019, 168, 107677. [Google Scholar] [CrossRef]
  2. Spierings, A.B.; Dawson, K.; Voegtlin, M.; Palm, F.; Uggowitzer, P.J. Microstructure and mechanical properties of as-processed scandium-modified aluminium using selective laser melting. Cirp Ann. 2016, 65, 213–216. [Google Scholar] [CrossRef]
  3. Croteau, J.R.; Griffiths, S.; Rossell, M.D.; Leinenbach, C.; Kenel, C.; Jansen, V.; Seidman, D.N.; Dunand, D.C.; Vo, N.Q. Microstructure and mechanical properties of Al-Mg-Zr alloys processed by selective laser melting. Acta Mater. 2018, 153, 35–44. [Google Scholar] [CrossRef]
  4. Zhang, J.; Song, B.; Wei, Q.; Bourell, D.; Shi, Y. A review of selective laser melting of aluminum alloys: Processing, microstructure, property and developing trends. J. Mater. Sci. Technol. 2019, 35, 270–284. [Google Scholar] [CrossRef]
  5. Li, X.P.; Wang, X.J.; Saunders, M.; Suvorova, A.; Zhang, L.C.; Liu, Y.J.; Fang, M.H.; Huang, Z.H.; Sercombe, T.B. A selective laser melting and solution heat treatment refined Al–12Si alloy with a controllable ultrafine eutectic microstructure and 25% tensile ductility. Acta Mater. 2015, 95, 74–82. [Google Scholar] [CrossRef]
  6. Aryshenskii, E.; Hirsch, J.; Konovalov, S. Investigation of the Intermetallic Compounds Fragmentation Impact on the Formation of Texture during the as Cast Structure Thermomechanical Treatment of Aluminum Alloys. Metals 2021, 11, 507. [Google Scholar] [CrossRef]
  7. Deev, V.; Ri, E.; Prusov, E.; Ermakov, M.; Slavinskaya, N. Structure formation of cast Al-Mg-Si alloys during the melts irradiation with nanosecond electromagnetic pulses. In IOP Conference Series: Materials Science and Engineering; IOP Publishing Ltd.: Bristol, UK, 2020; Volume 1001, p. 012054. [Google Scholar] [CrossRef]
  8. Aversa, A.; Marchese, G.; Saboori, A.; Bassini, E.; Manfredi, D.; Biamino, S.; Ugues, D.; Fino, P.; Lombardi, M. New Aluminum Alloys Specifically Designed for Laser Powder Bed Fusion: A Review. Materials 2019, 12, 1007. [Google Scholar] [CrossRef] [PubMed] [Green Version]
  9. Spierings, A.B.; Dawson, K.; Kern, K.; Palm, F.; Wegener, K. SLM-processed Sc- and Zr- modified Al-Mg alloy: Mechanical properties and microstructural effects of heat treatment. Mater. Sci. Eng. A 2017, 701, 264–273. [Google Scholar] [CrossRef]
  10. Røyset, J.; Ryum, N. Scandium in aluminium alloys. Int. Mater. Rev. 2005, 50, 19–44. [Google Scholar] [CrossRef]
  11. Kürnsteiner, P.; Bajaj, P.; Gupta, A.; Wilms, M.B.; Weisheit, A.; Li, X.; Leinenbach, C.; Gault, B.; Jägle, E.A.; Raabe, D. Control of thermally stable core-shell nano-precipitates in additively manufactured Al-Sc-Zr alloys. Addit. Manuf. 2020, 32, 100910. [Google Scholar] [CrossRef]
  12. Knipling, K.E.; Dunand, D.C.; Seidman, D.N. Criteria for developing castable, creep-resistant aluminum-based alloys—A review. Z. Met. 2006, 97, 246–265. [Google Scholar] [CrossRef] [Green Version]
  13. Yang, K.V.; Shi, Y.; Palm, F.; Wu, X.; Rometsch, P. Columnar to equiaxed transition in Al-Mg(-Sc)-Zr alloys produced by selective laser melting. Scr. Mater. 2018, 145, 113–117. [Google Scholar] [CrossRef]
  14. Griffiths, S.; Rossell, M.D.; Croteau, J.; Vo, N.Q.; Dunand, D.C.; Leinenbach, C. Effect of laser rescanning on the grain microstructure of a selective laser melted Al-Mg-Zr alloy. Mater. Charact. 2018, 143, 34–42. [Google Scholar] [CrossRef]
  15. Spierings, A.B.; Dawson, K.; Uggowitzer, P.J.; Wegener, K. Influence of SLM scan-speed on microstructure, precipitation of Al3Sc particles and mechanical properties in Sc- and Zr-modified Al-Mg alloys. Mater. Des. 2018, 140, 134–143. [Google Scholar] [CrossRef]
  16. Mohebbi, M.S.; Ploshikhin, V. Implementation of nucleation in cellular automaton simulation of microstructural evolution during additive manufacturing of Al alloys. Addit. Manuf. 2020, 36, 101726. [Google Scholar] [CrossRef]
  17. Norman, A.F.; Prangnell, P.B.; McEwen, R.S. The solidification behaviour of dilute aluminium–scandium alloys. Acta Mater. 1998, 46, 5715–5732. [Google Scholar] [CrossRef]
  18. Saunders, N.; Tsakiropoulos, P. Preferential nucleation in undercooled liquid aluminium alloys. Mater. Sci. Technol. 1988, 4, 157–160. [Google Scholar] [CrossRef]
  19. Shao, G.; Tsakiropoulos, P.; Miodownik, A.P. Role of nucleation in phase competition in binary Ti-Al alloys. Mater. Sci. Technol. 1997, 13, 797–805. [Google Scholar] [CrossRef]
  20. Shao, G.; Tsakiropoulos, P. Prediction of phase selection in rapid solidification using time dependent nucleation theory. Acta Metall. Mater. 1994, 42, 2937–2942. [Google Scholar] [CrossRef]
  21. Cahill, J.A.; Grosse, A.V. Viscosity and Self-Diffusion of Liquid Thallium from Its Melting Point to About 1300°K. J. Phys. Chem. 1965, 69, 518–521. [Google Scholar] [CrossRef]
  22. Hyde, K.B.; Norman, A.F.; Prangnell, P.B. The effect of cooling rate on the morphology of primary Al3Sc intermetallic particles in Al-Sc alloys. Acta Mater. 2001, 49, 1327–1337. [Google Scholar] [CrossRef]
  23. Li, J.H.; Oberdorfer, B.; Wurster, S.; Schumacher, P. Impurity effects on the nucleation and growth of primary Al3(Sc,Zr) phase in Al alloys. J. Mater. Sci. 2014, 49, 5961–5977. [Google Scholar] [CrossRef]
  24. Kurz, W.; Fisher, D.J. Fundamentals of Solidification; Trans Tech Publications Ltd.: Stafa-Zurich, Switzerland, 1998; ISBN 978-3-0357-3239-9. [Google Scholar]
  25. Avrami, M. Kinetics of Phase Change. I General Theory. J. Chem. Phys. 1939, 7, 1103–1112. [Google Scholar] [CrossRef]
  26. Avrami, M. Kinetics of Phase Change. II Transformation-Time Relations for Random Distribution of Nuclei. J. Chem. Phys. 1940, 8, 212–224. [Google Scholar] [CrossRef]
  27. Avrami, M. Granulation, Phase Change, and Microstructure Kinetics of Phase Change. III. J. Chem. Phys. 1941, 9, 177–184. [Google Scholar] [CrossRef]
  28. Vázquez, J.; López-Alemany, P.L.; Villares, P.; Jiménez-Garay, R. Generalization of the Avrami equation for the analysis of non-isothermal transformation kinetics. Application to the crystallization of the Cu0.20As0.30Se0.50 alloy. J. Phys. Chem. Solids 2000, 61, 493–500. [Google Scholar] [CrossRef]
  29. Li, H.; Gai, K.; He, L.; Zhang, C.; Cui, H.; Li, M. Non-isothermal phase-transformation kinetics model for evaluating the austenization of 55CrMo steel based on Johnson-Mehl-Avrami equation. Mater. Des. 2016, 92, 731–741. [Google Scholar] [CrossRef]
  30. Cahn, J.W. Transformation kinetics during continuous cooling. Acta Metall. 1956, 4, 572–575. [Google Scholar] [CrossRef]
  31. Recktenwald, G.W. Finite-Difference Approximations to the Heat Equation. Mech. Eng. 2004, 10, 1–27. [Google Scholar]
  32. Lampa, C.; Kaplan, A.F.H.; Powell, J.; Magnusson, C. An analytical thermodynamic model of laser welding. J. Phys. D Appl. Phys. 1997, 30, 1293. [Google Scholar] [CrossRef]
  33. Rappaz, M.; Gandin, C.-A. Probabilistic modelling of microstructure formation in solidification processes. Acta Metall. Mater. 1993, 41, 345–360. [Google Scholar] [CrossRef]
  34. Gandin, C.-A.; Rappaz, M.; Tintillier, R. Three-dimensional probabilistic simulation of solidification grain structures: Application to superalloy precision castings. Metall. Trans. A 1993, 24, 467–479. [Google Scholar] [CrossRef]
  35. Kurz, W.; Giovanola, B.; Trivedi, R. Theory of microstructural development during rapid solidification. Acta Metall. 1986, 34, 823–830. [Google Scholar] [CrossRef]
  36. Zinovieva, O.; Zinoviev, A.; Ploshikhin, V.; Romanova, V.; Balokhonov, R. Strategy of computational predictions for mechanical behaviour of additively manufactured materials. Mater. Sci. Technol. 2018, 34, 1591–1605. [Google Scholar] [CrossRef]
  37. Spierings, A.B.; Dawson, K.; Heeling, T.; Uggowitzer, P.J.; Schäublin, R.; Palm, F.; Wegener, K. Microstructural features of Sc- and Zr-modified Al-Mg alloys processed by selective laser melting. Mater. Des. 2017, 115, 52–63. [Google Scholar] [CrossRef]
  38. Khanna, Y.P.; Taylor, T.J. Comments and recommendations on the use of the Avrami equation for physico-chemical kinetics. Polym. Eng. Sci. 1988, 28, 1042–1045. [Google Scholar] [CrossRef]
  39. Grong, Ø.; Dahle, A.K.; OnsØien, M.I.; Arnberg, L. Analytical modelling of equiaxed solidification. Acta Mater. 1998, 46, 5045–5052. [Google Scholar] [CrossRef]
  40. Shabestari, S.G.; Keshavarz, M.; Hejazi, M.M. Effect of strontium on the kinetics of formation and segregation of intermetallic compounds in A380 aluminum alloy. J. Alloys Compd. 2009, 477, 892–899. [Google Scholar] [CrossRef]
Figure 1. Fraction of various phases versus temperature during (a) heating and (b) cooling.
Metals 11 01056 g001
Figure 2. Calculated curves of characteristic incubation time ( τ 0 ) of competing phases. Two distinguished cooling conditions corresponding to the formation of primary L12 and solute trapping are superimposed. An example of the evolution of the normalized particle formation time in a CA cell ( τ v ) is depicted as well (see Section 2.2).
Metals 11 01056 g002
Figure 3. The computational domains for (a) semi-2D and (b) 3D analyses.
Metals 11 01056 g003
Figure 4. Thermo-physical properties of the considered alloy.
Metals 11 01056 g004
Figure 5. FD thermal field calculated under scanning speed of 1000 mm/s; distributions of temperature (a,d,g), cooling rate (b,e,h), and thermal gradient (c,f,i) in the top surface (ac), the longitudinal cross-section (df) and the path (gi). The path is defined in the view of the top surface (ac). Isotherms from 500 to 1200 K with 100 K interval are plotted in (a,d).
Metals 11 01056 g005
Figure 6. Schematic demonstration of the methodology for integrating the precipitation and solidification models into the CA analysis.
Metals 11 01056 g006
Figure 7. Schematic demonstration of different zones involved with particle evolution during heating and cooling by laser scanning: (a) top view, (b) TD cross-section, and (c) SD cross-section.
Metals 11 01056 g007
Figure 8. CA simulations of particle and microstructure evolution at a scanning speed of 1000 mm/s and a platform temperature of 298 K; distributions of normalized particle formation time τ v (a,d), particle number density (b,e), and resulting grain structure (c,f) on the top surface (ac) and the longitudinal cross-section (df).
Metals 11 01056 g008
Figure 9. CA simulations of particle and microstructure evolution at a scanning speed of 500 mm/s and a platform temperature of 298 K; distributions of normalized particle formation time τ v (a,d), particle number density (b,e), and resulting grain structure (c,f) on the top surface (ac) and the longitudinal cross-section (df).
Metals 11 01056 g009
Figure 10. CA simulations of particle and microstructure evolution at a scanning speed of 500 mm/s and a platform temperature of 473 K; distributions of normalized particle formation time τ v (a,d), particle number density (b,e), and resulting grain structure (c,f) on the top surface (ac) and the longitudinal cross-section (df).
Metals 11 01056 g010
Figure 11. EBSD microstructures for an Al–Mg–Sc–Zr alloy manufactured under (a,d) scanning speed of 1600 mm/s and platform temperature of 308 K, (b,e) scanning speed of 800 mm/s and platform temperature of 308 K, and (c,f) scanning speed of 800 mm/s and platform temperature of 473 K. (df) High magnification of the areas highlighted in (ac). Reprinted with permission from ref. [13], copyright 2021 Elsevier.
Metals 11 01056 g011
Figure 12. SD sections of CA microstructures obtained by semi-2D simulation with a cell size of 250 nm (a,c,e,g) and 3D simulation with a cell size of 1 µm (b,d,f,h) at (a,b) scanning speed of 1000 mm/s and platform temperature of 298 K, (c,d) scanning speed of 500 mm/s and platform temperature of 298 K, and (e,f) scanning speed of 500 mm/s and platform temperature of 473 K. Microstructures (g,h) obtained under the same scanning conditions of (e,f) without the particle-based nucleation. Figure 13 shows a higher magnification of the areas marked by frames in (e,f).
Metals 11 01056 g012
Figure 13. Detailed microstructures of the highlighted areas in Figure 12; (a) semi-2D simulation with a cell size of 250 nm and (b) 3D simulation with a cell size of 1 µm.
Metals 11 01056 g013
Table 1. Parameters used in the TTT model for the initiation criterion of L12 precipitation.
ParametersValue
θ (°)60
a (m)5 × 10⁻¹⁰
d a (m)2.54 × 10⁻¹⁰
x eff 0.016
T l , p (K)1000
Δ S m (J/mol.K)19
k B (J/k)1.38065 × 10−23
Publisher’s Note: MDPI stays neutral with regard to jurisdictional claims in published maps and institutional affiliations.

