Article

Improving the Corrosion Behavior of Biodegradable AM60 Alloy through Plasma Electrolytic Oxidation

by
Abdulrahman I. Alateyah
1,
Talal A. Aljohani
2,*,
Majed O. Alawad
2,
Sally Elkatatny
3 and
Waleed H. El-Garaihy
1,3
1
Department of Mechanical Engineering, College of Engineering, Qassim University, Unaizah 56452, Saudi Arabia
2
Materials Science Research Institute, King Abdulaziz City for Science and Technology (KACST), Riyadh 11442, Saudi Arabia
3
Mechanical Engineering Department, Faculty of Engineering, Suez Canal University, Ismailia 41522, Egypt
*
Author to whom correspondence should be addressed.
Metals 2021, 11(6), 953; https://doi.org/10.3390/met11060953
Submission received: 25 May 2021 / Revised: 6 June 2021 / Accepted: 8 June 2021 / Published: 11 June 2021
(This article belongs to the Special Issue Surface Engineering of Metals and Alloys)

Abstract

:
Magnesium (Mg) alloys have unique properties. However, their applications are limited in working environments due to their poor corrosion resistance. Plasma electrolytic oxidation (PEO) is one of the most environmentally friendly and cost-effective ways that has been promoted to treat Mg alloys. In this study, we investigated the effect of electrical parameters on the microstructure, as well as the mechanical and corrosion resistance of AM60 alloy coated with PEO. The electrical parameters studied were current mode (unipolar and bipolar), frequency and duty ratio. The microstructure evolution of the coated AM60 substrates was studied using X-ray diffraction and scanning electron microscopy. Subsequently, the mechanical properties were determined using compression tests and microhardness measurements. The potentiodynamic polarization curves indicated that the PEO-coated samples experienced a significant decrease of 99.9% in the corrosion rate compared to the base metal. The electrochemical impedance spectroscopy findings showed that PEO coating increased the corrosion resistance of the AM60 magnesium alloy by 1071870% compared to the base metal. On the other hand, the PEO coated samples showed superior adhesion to the substrate. Moreover, the PEO coating led to an improvement in the hardness value by 114% compared to base metal, coupled with insignificant change in the compressive properties.

1. Introduction

Magnesium (Mg) alloys are considered to be ultralight alloys because of their strength-to-weight ratios that far exceed those of steel and aluminum—for instance, their densities can be two-thirds that of aluminum and one-quarter that of steel [1,2,3]. On the other hand, Mg alloys have specific stiffness, high specific strength, resistance to heat changes, and good recyclability [4,5,6]. These unique properties make Mg alloys desirable for different applications within transportation industries, mainly in aerospace and automotive [7,8,9]. Moreover, Mg alloys are a vital solution, not only in reducing the weight of transportation but also in reducing the carbon dioxide emission and fuel cost because 5–10% fuel can be saved by reducing 10% of the car weight [10].
Among the Mg alloys, the most commonly used in transportation industries are Mg- Al alloys. Mg-Al alloys can be classified into two major classes: AMxx and AZxx series. AM series alloys have a certain amount of Al besides manganese (Mn), while AZ contains Al and zinc [7]. AM series alloys are the most frequently used in industry applications such as in the production of automotive parts [11,12,13] owing to its unique properties, such as sufficient ductility, high energy absorption, low density, and reasonable strength [14,15]. However, Mg alloys have limited applications in working environments due to their poor corrosion resistance because of the lack of a protective passive oxide film on Mg alloys [1,16,17]. Therefore, the corrosion behavior of Mg alloys is under excessive scrutiny with the aim of improving them.
There are numerous effective techniques to enhance the corrosion resistance of Mg and its alloys. Different surface treatments are used, such as anodization treatment, electroless coating and phosphate conversion coating. Among the various surface treatments, anodization is the most effective protective surface treatment [16,18,19]. Plasma electrolytic oxidation (PEO) is one of anodizing technologies that has been promoted to treat non-ferrous alloys, specially Al and Mg alloys [20,21]. PEO is one of the most environmentally friendly and cost-effective ways [22]. The PEO method is used to form a hard, thick and adherent ceramic that improves hardness and surface performance in terms of adhesion, corrosion resistance and wear protection [23,24,25,26]. Nevertheless, the PEO coating quality is not good enough for several industrial applications that require homogeneous layers with excellent mechanical properties and corrosion resistance because a moderately thick, porous outer layer is formed during the PEO process [27]. Therefore, focusing on reducing and limiting the growth of this layer becomes a vital key to enhancing the performance of the PEO process. The formed film depends on the application of post-treatments and PEO conditions [28], specifically the electrolyte composition [29,30,31,32,33] and the electrical parameters [34,35,36,37,38].
Regarding the electrical parameters, it has been reported that the current mode, current density, applied voltage, duty cycle and pulse frequency have a significant influence on the characteristics of microdischarges (e.g., plasma temperature and ignition voltage) [39], which drastically affected the coating morphology in [19]. In this context, different current modes were applied in the PEO treatment including, unipolar, bipolar DC and AC current modes [40,41]. Gnedenkov et al. [42] studied the effect of the current mode on the properties of PEO coatings formed on Mg-Mn alloy. It was observed that the growth rate of coatings created under bipolar conditions was higher than that of coatings formed under unipolar mode and showed enhanced corrosion and mechanical properties. Gao et al. [43] also investigated the impact of the pulsed unipolar and bipolar current modes formed on cp-Mg. They found that metal surface passivation depends on the negative pulse, since the growth rates were lower because of passivation hinderance under additional energetic negative pulses. In addition, the defects in the formed coatings using unipolar conditions were less than those formed under bipolar conditions, which resulted in coatings with better corrosion resistance [44]. Liu et al. [45] reported that current densities and high voltages increase the Mg oxidation rate because of the higher energy input promoting higher growth rates and, consequently, coating thickness. The experimental findings concluded that the coating thickness of AM50 alloy increased up to 20 µm when increasing the voltage. Accordingly, the corrosion resistance of both the inner dense layer and outer porous layer increased significantly when the applied voltage exceeded 360 V [45]. However, the current modes (AC and bipolar) caused more homogeneous coatings and were denser compared to those generated using DC and unipolar modes, because the former allows for control of the discharge lifetime. Nevertheless, Rapheal et al. [46] reported that coatings formed at AM50 under higher current densities exhibited lower corrosion resistance because of increasing porosity in the outer porous layer, as well as a defective barrier layer. Furthermore, increasing the duty cycle resulted in lower ignition voltage, the intensity and density of microdischarges, and a greater energy intensity [35,47] that caused a lower thickness and a higher coating porosity [19,44]. Beatriz Mingo et al. revealed that increasing the pulsed unipolar current frequency of AM50 alloy resulted in an enhanced corrosion resistance accompanied by coating morphology refinement [48].
It is well known that the PEO current mode and density have a significant effect on the growth rate, the structure of the PEO coatings and the corrosion resistance of the coated alloys. In the present work, a detailed study of the effects of electrical parameters on the PEO process, coating morphology, phase composition and corrosion behavior of PEO coatings is presented. To that end, the microstructural characteristics, corrosion behavior and mechanical properties of the coated surface produced by the PEO process on AM60 alloy were investigated and correlated with the PEO electrical parameters. Electrochemical measurements such as open circuit potential, potentiodynamic polarization, cyclic potentiodynamic polarization and electrochemical impedance spectroscopy tests are used herein.

2. Materials and Methods

In this study, AM60 alloy was used with a chemical composition of 5.8 wt.% Al, 0.5 wt.% Mn, 0.2 wt.% Zn and 0.1 wt.% Si (balance Mg) (China Jingan Chemicals & Alloy Limited, Shanghai, China). Rectangular samples with dimensions 110 mm × 45 mm × 10 mm were directly subjected to the PEO process without any pre-heat treatment. A simplified diagram of the PEO process is illustrated in Figure 1. The AM60 sample was used as an anode. However, the cathode was a polyvinyl chloride container (PVC) lined up with a sheet of stainless-steel. The PEO was performed in an alkaline solution of 3 g/L of potassium hydroxide (KOH) and 2 g/L sodium silicate (Na2SiO3). The system was connected to a cooling system to keep the temperature around 25 °C. Air agitation was used to keep the solution mixing.
To study the effect of the process polarity on the structure and thickness of the coating, different frequencies and duty cycles were applied on unipolar (UP) and bipolar (BP) methods for different duty cycles. The experiment duration was 300 s. The sample designation included 2 alphabets referring to the polarity and 2 numbers referring to the duty cycle, as shown in Table 1. The duty cycle was calculated based on Equation (1):
duty   cycle = t on t on + t off
where ton, toff and (ton + toff) are on time, off time and the whole time, respectively.
A Bio-Logic SP-200 potentiostat (Lambda System Kreft Barszczewski Sp.J., Warszawa, Poland) and a flat corrosion cell with three electrodes were used to perform the electrochemical corrosion tests. A platinum counter and saturated calomel reference electrodes were used. To ensure a steady-state condition, a polarization technique with a 0.166 mVs−1 potential scan rate was applied. A linear polarization scan was employed in a short potential range of ±25 mV. The EIS tests were conducted at the open-circuit potential (Ecorr) by using a sinusoidal voltage within ±10 mV and within a frequency range of 10 mHz to 100 kHz. The electrochemical measurements were utilized at 298 K in aerated 0.5 M sodium chloride (NaCl). A JSM-IT300 InTouchScope™ scanning electron microscope (SEM) (Joel Ltd., Tokyo, Japan) combined with an X-MaxN Oxford energy-dispersive X-ray spectroscopy (EDS) (Joel Ltd., Tokyo, Japan) analyzer was used to explore the surface morphology of the corroded specimens. To investigate the structure crystallinity, X-ray diffraction (XRD) (Joel Ltd., Tokyo, Japan) measurements were carried out using an JEOL JDX-8030 X-ray diffractometer utilizing Cu-Kα radiation, operating at 40 kV and 30 mA, at a scan rate of 2 deg/min.
Vickers microhardness was used to evaluate the hardness values of the BM and AM60 coated samples with a load of 25 g and a dwell time of 15 s using a digital microhardness tester QV1000 (Qualitest, Nisku, AB, Canada), equipped with iVision_V.1.0.0 Hv software (Clemex Technologies Inc., Longueuil, QC, Canada). The results collected and displayed are the average of at least 5 indentations. Compression properties were evaluated using a 100 kN universal testing machine (Instron 4210, Norwood, MA, USA) at room temperature at a constant strain rate of 10−3 s−1. Rectangular samples with dimensions of 25 mm × 25 mm × 12.5 mm were used. Two compression samples were tested per condition.

3. Results and Discussion

3.1. Phase Composition and Microstructure Morphology of the Samples

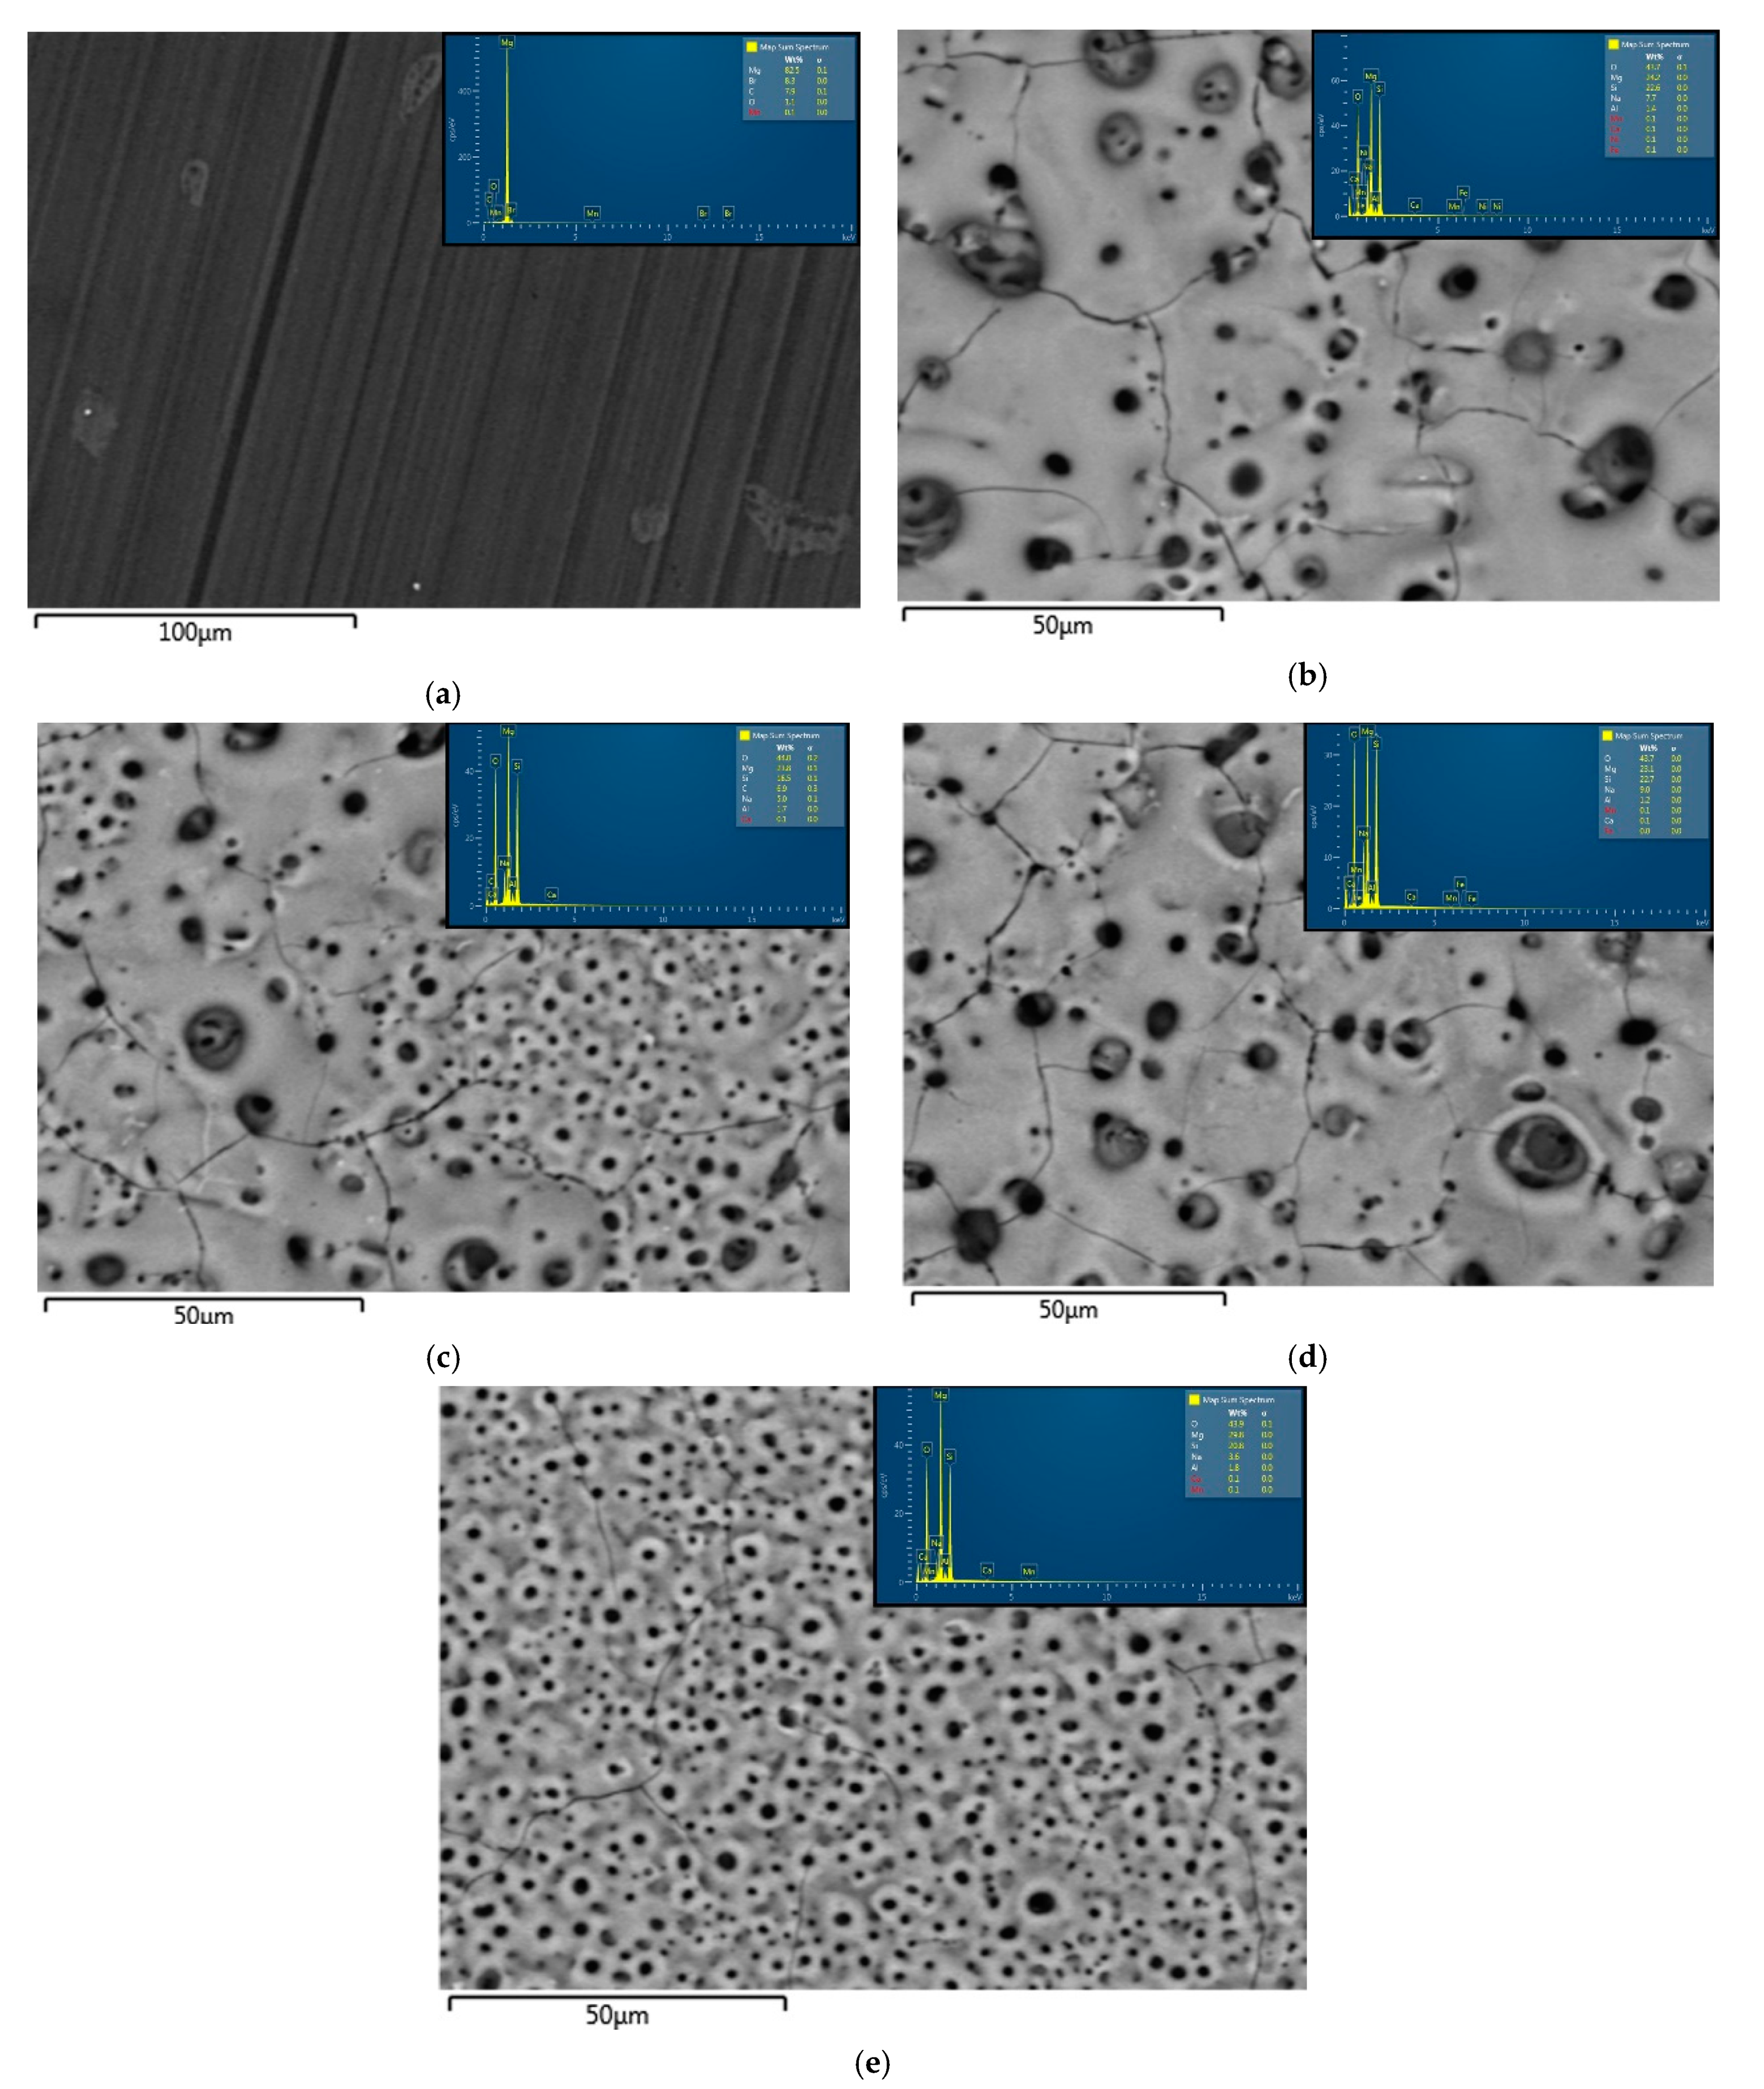
Figure 2 shows SEM micrographs for the base metal (BM) and coated samples of AM60 alloy. As shown in Figure 2, all the coated samples revealed micropores surrounded by solidified material. The entry of the pores from the surface appeared rounded and sloped inward. Similar findings were reported by Rapheal et al. [46]. The majority of the pores that were produced by applying different current modes, duty cycle and frequency were irregular in shape, size and density. Using a unipolar current mode (Figure 2b) resulted in relatively large holes with high porous density. However, using a bipolar current mode (BP30) reduced the pore size and density compared to the unipolar mode, as shown in Figure 2c. In other words, the pore characteristics were dependent on the final voltage because the higher final voltage induced a larger spark on the coated surface. Consequently, the final voltage played a significant role in the surface morphology of PEO coated surfaces.
Increasing the duty cycle from 30% to 50% caused a notable reduction in the pore density. BP50 displayed a larger pore size compared to BP30 as shown in Figure 2d compared to Figure 2c. However, the surface of the BP66 sample contained moderately small pores in comparison to the coatings produced by of the lower frequency (BP50, BP30), as revealed in Figure 2e compared to Figure 2c,d, respectively. That is to say, coating at a higher frequency and duty cycle resulted in uniformly distributed smaller pores and a much higher pore density. The large numbers of micropores formed could be due to the magnesium having a low Pilling–Bedworth ratio [49], oxygen gas trapping and growth and/or electrolyte vapors [28].
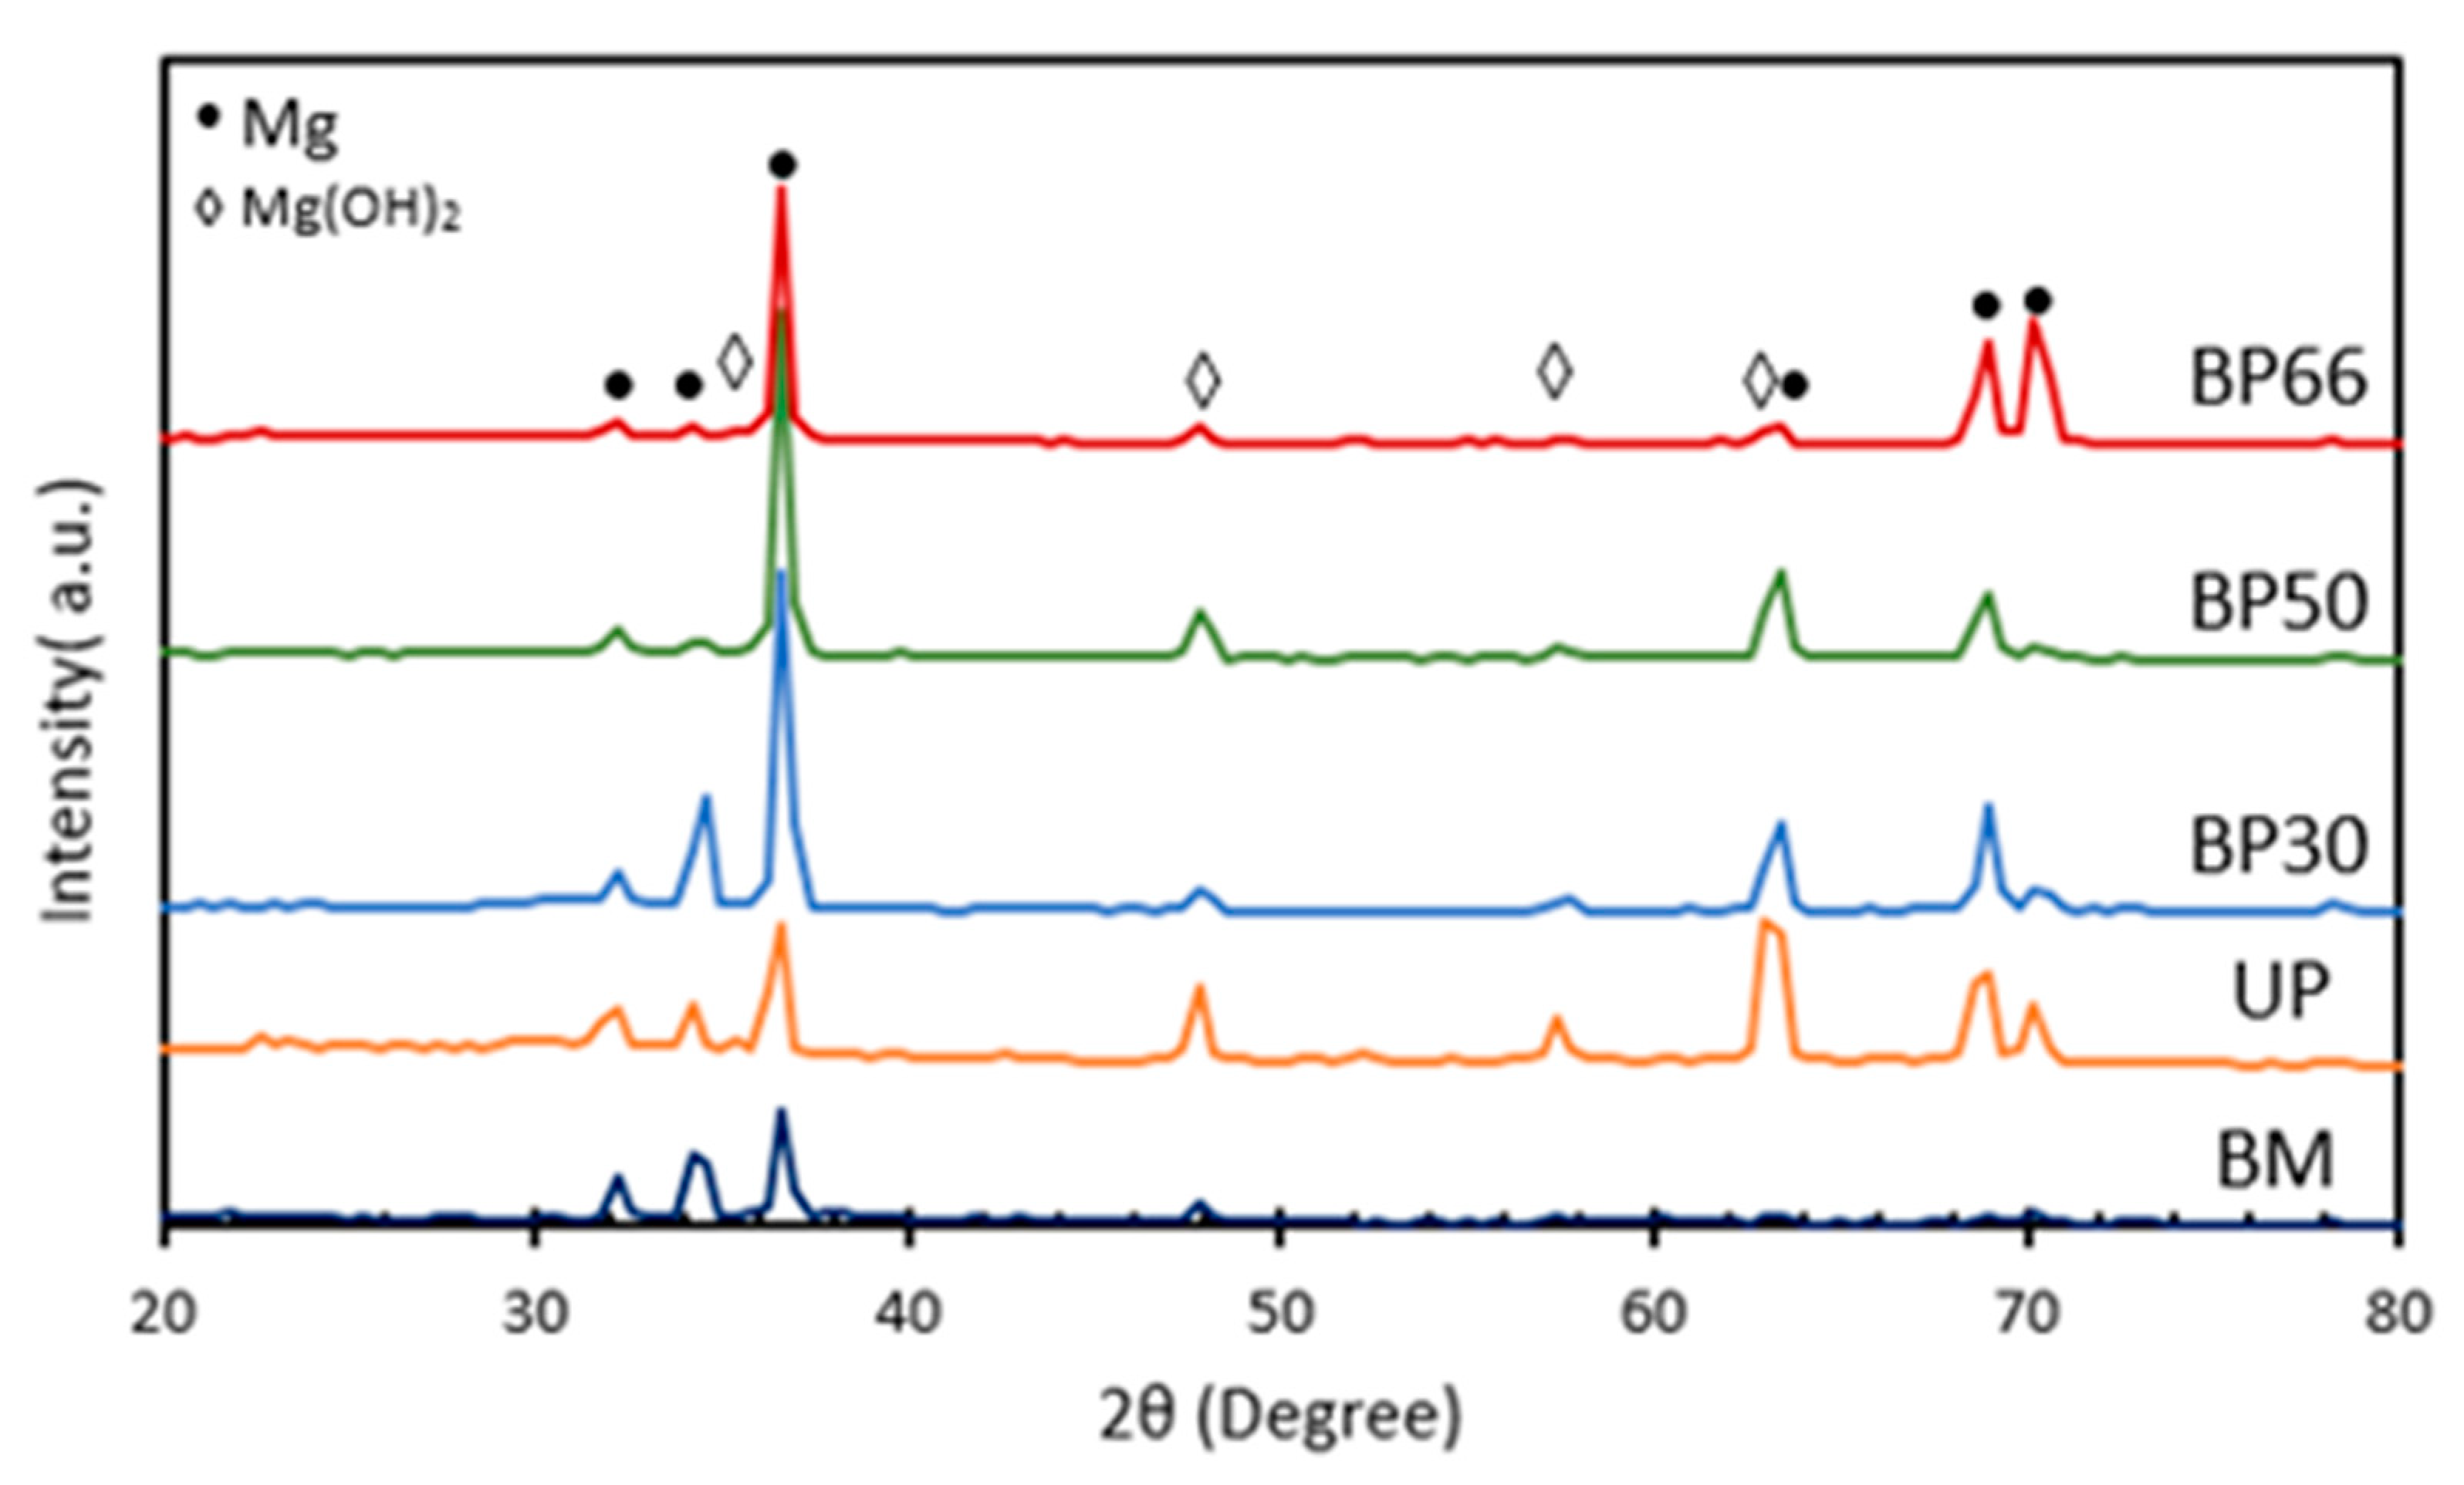
Elemental mapping was performed to determine the distribution of Mg, O, Si and Al on the coated samples. The EDS elemental mapping analyses of the coated samples are shown in Figure 3 and summarized in Table 2. The XRD patterns of the PEO-coated AM60 samples under different conditions are depicted in Figure 4. The PEO coatings formed on the studied AM60 substrate mostly consisted of MgO with small amounts of AlMn, Mg2SiO4 and Mg17Al12, which is in agreement with the EDS results. The MgO was formed via AM60-BM during the PEO treatment because of intensive discharges and higher temperature that occurred during the treatment. That is to say, MgO was formed via the substrate oxidation during PEO, whereas the Mg2SiO4 phase was formed in the coating structure from the co-deposition of the alkaline electrolyte components. The same result was reported by Sarbishei et al. [50].
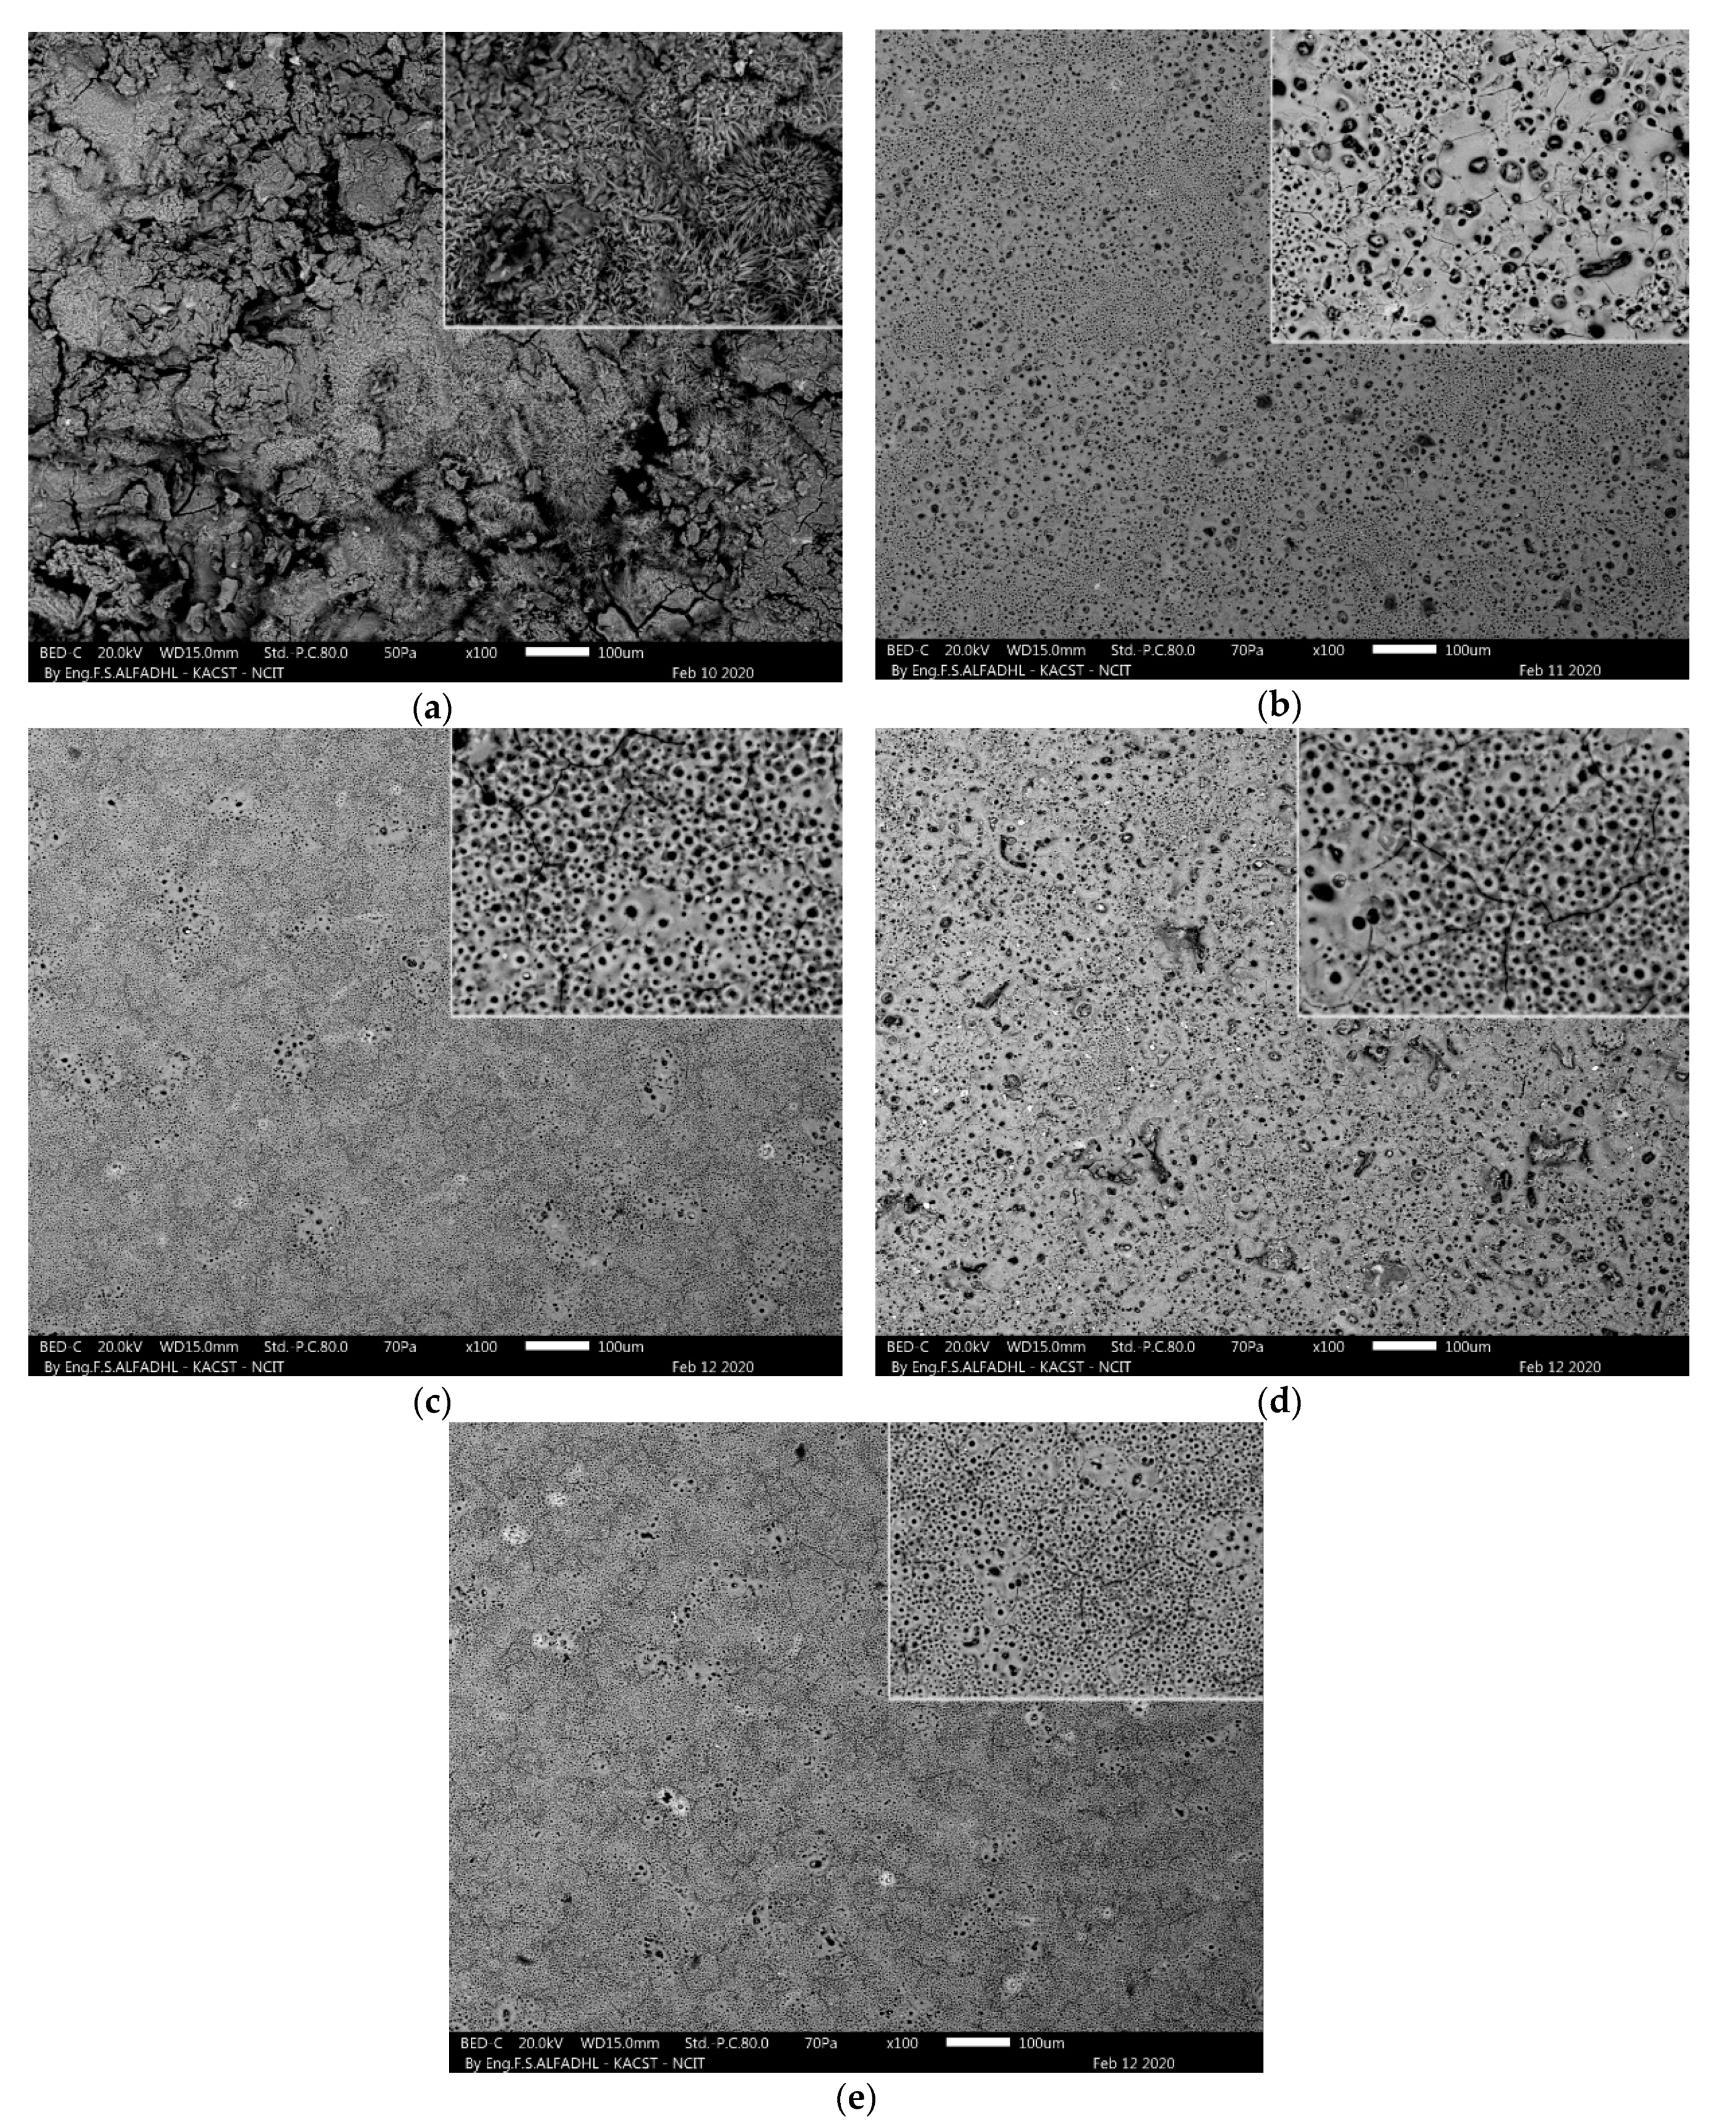
Figure 5 shows the SEM micrographs for the BM and coated samples of AM60 alloy after corrosion. The AM60-BM showed the worst protection, as shown in Figure 5a, as it contained an enormous number of pits and cracks. Meanwhile, the limited numbers of corrosion pits and cracks on the coated sample suggest that it had good corrosion resistance. The corrosion resistance of the PEO coating is strictly associated with its porosity density. Deep-penetrating pores are shortcuts for a corrosive solution to penetrate into the metal substrate and thus degrade the anticorrosion performance [51]. Consequently, BP66 had the best protection condition because it contained the smallest pores in comparison to the coatings produced by a lower frequency (BP50, BP30), as mentioned previously and shown in Figure 2.
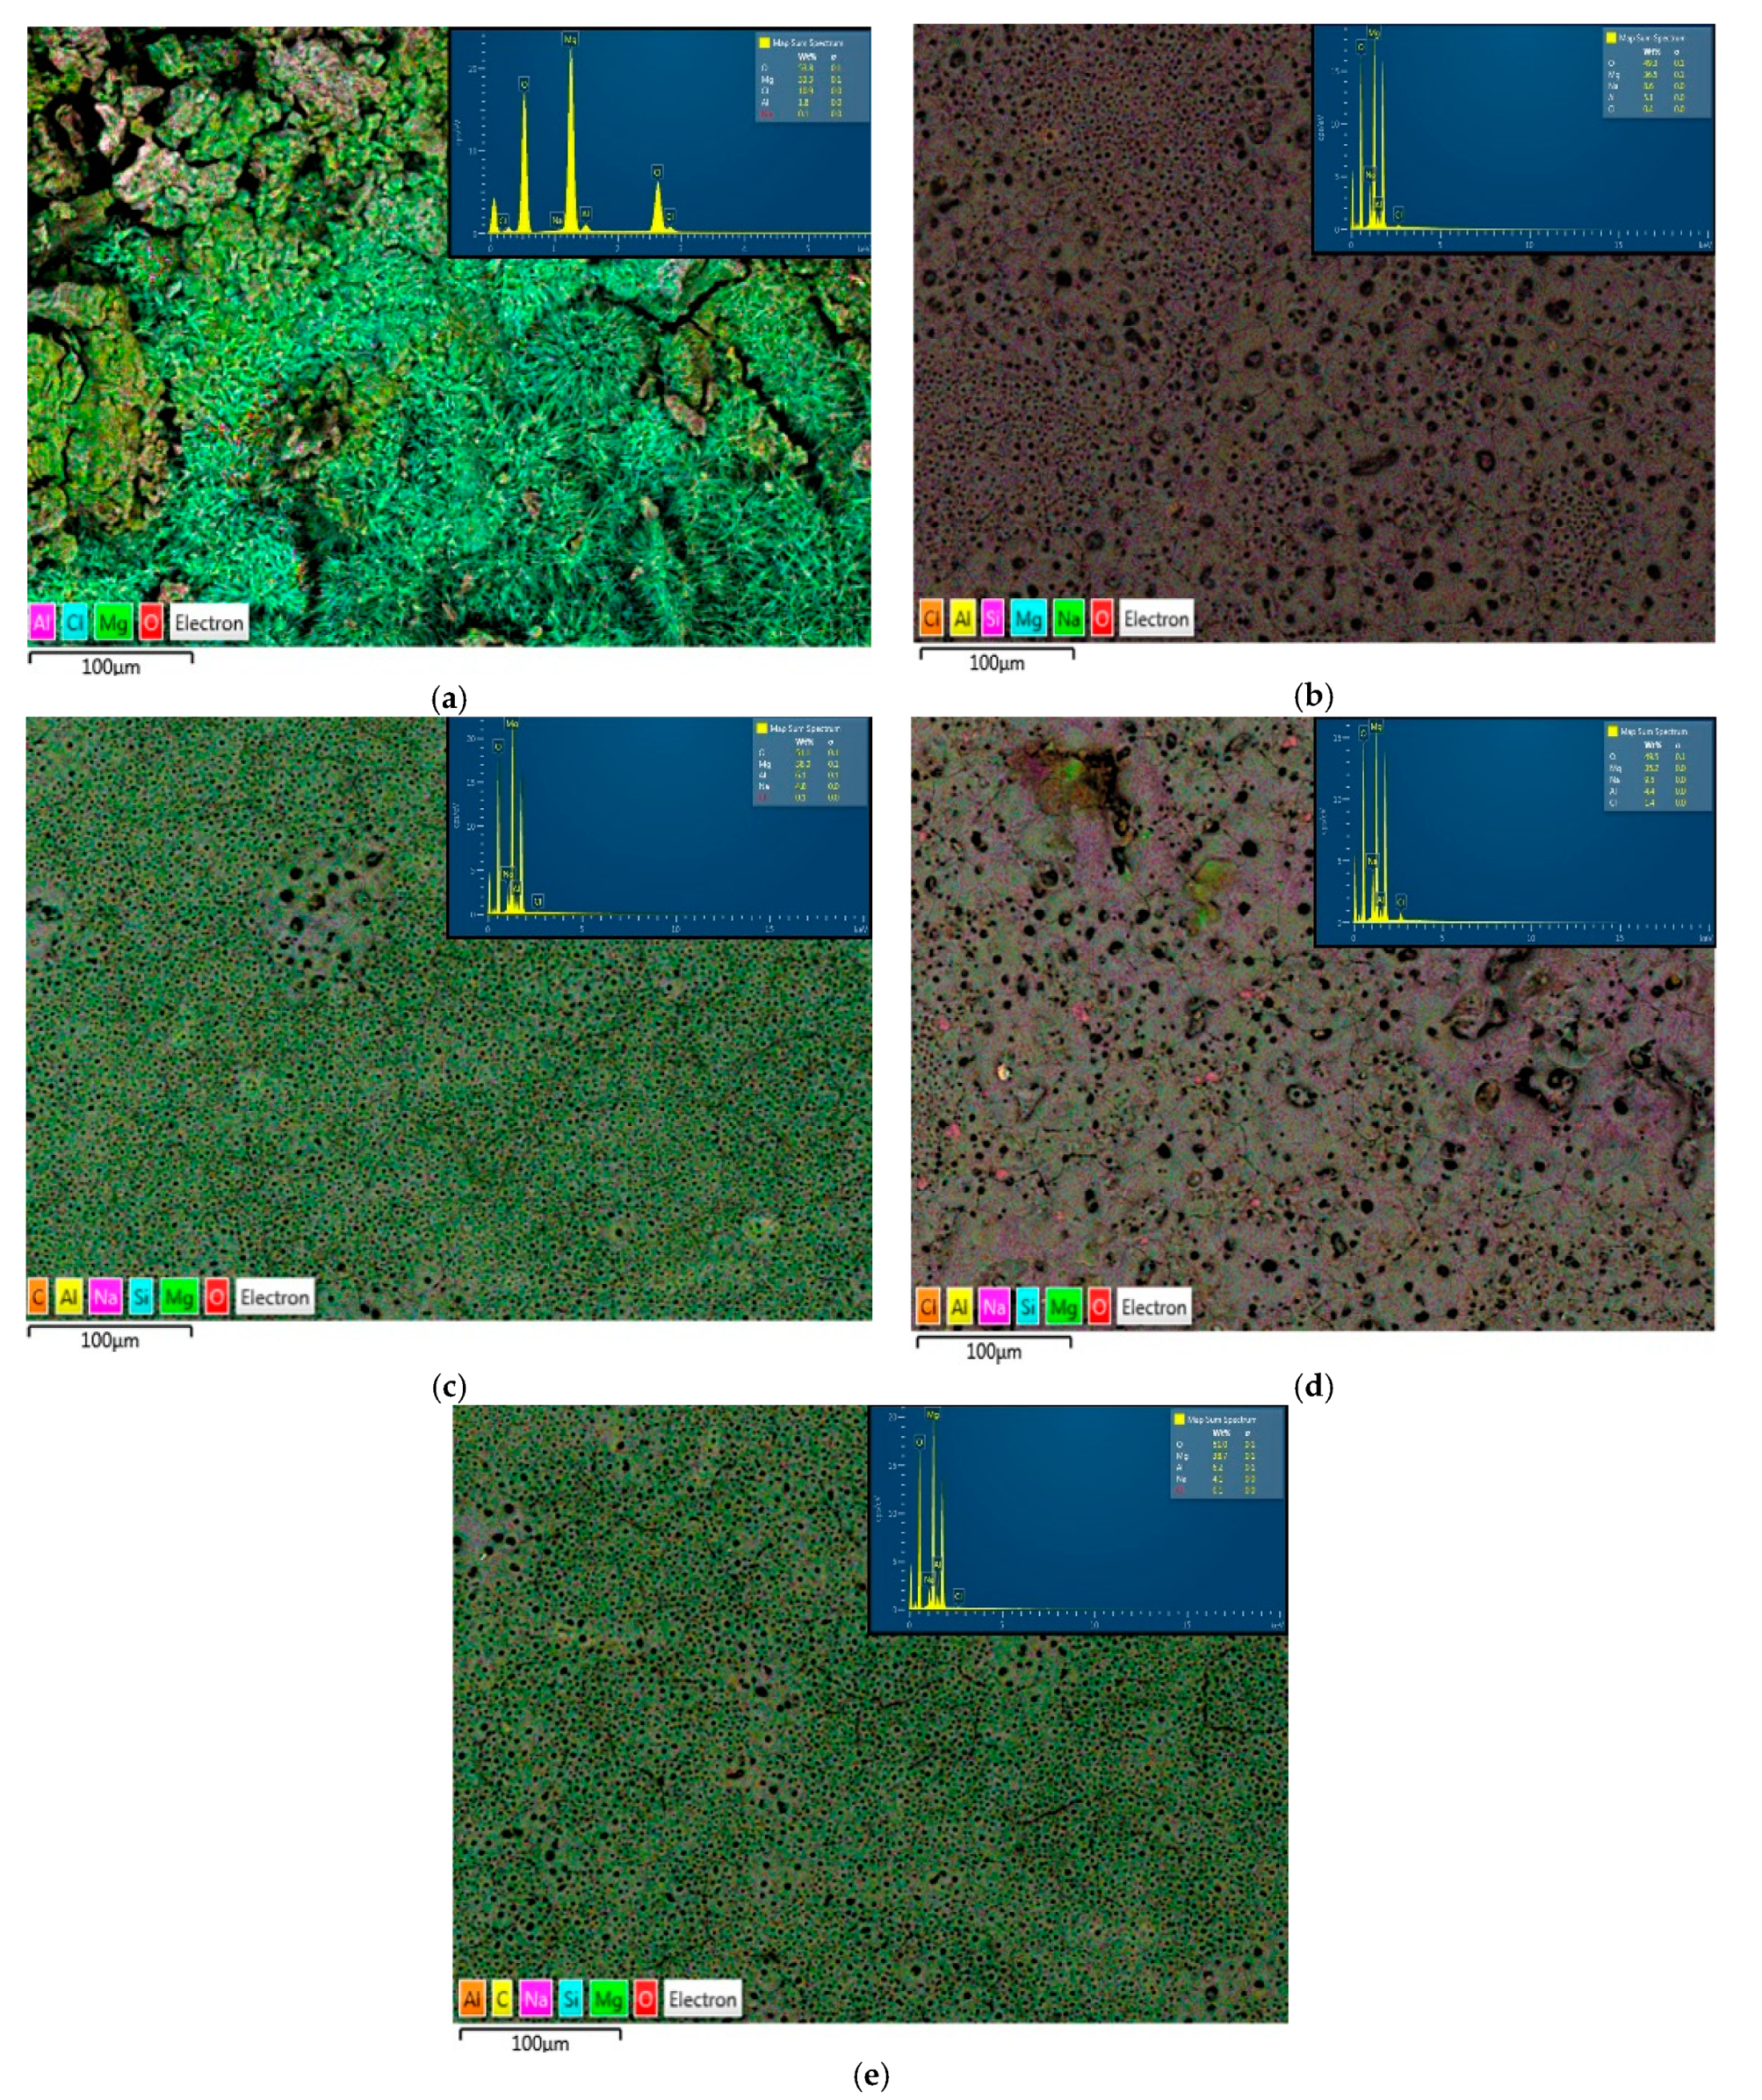
The composition of the coated samples after corrosion is shown in Figure 6; they were mainly composed of Mg and O. The proportion of Al in all coated samples after corrosion was almost the same as shown in Table 2, however Na segregation was revealed. In addition, the structure of the PEO-coated samples after corrosion was detected by XRD. The results obtained for the corroded AM60 samples are illustrated in Figure 7. The α-Mg matrix was detected. However, the Al-Mn was not identified on the corroded surface, which could be due to the dissociation of the precipitates after corrosion. From Figure 7 it can be observed that the AM-BP samples’ peak intensity were strong compared to the UP sample. It is also clear that only Mg, Mg(OH)2 and MgO were not detected due to a reaction between MgO and H2O producing Mg(OH)2. However, Mg2SiO4 was not detected. It is worth mentioning here that a previous study [52] suggested that a decreased Si intensity was due to the majority of the coating being replaced by an oxygen-rich conversion product.

3.2. Electrochemical Measurements

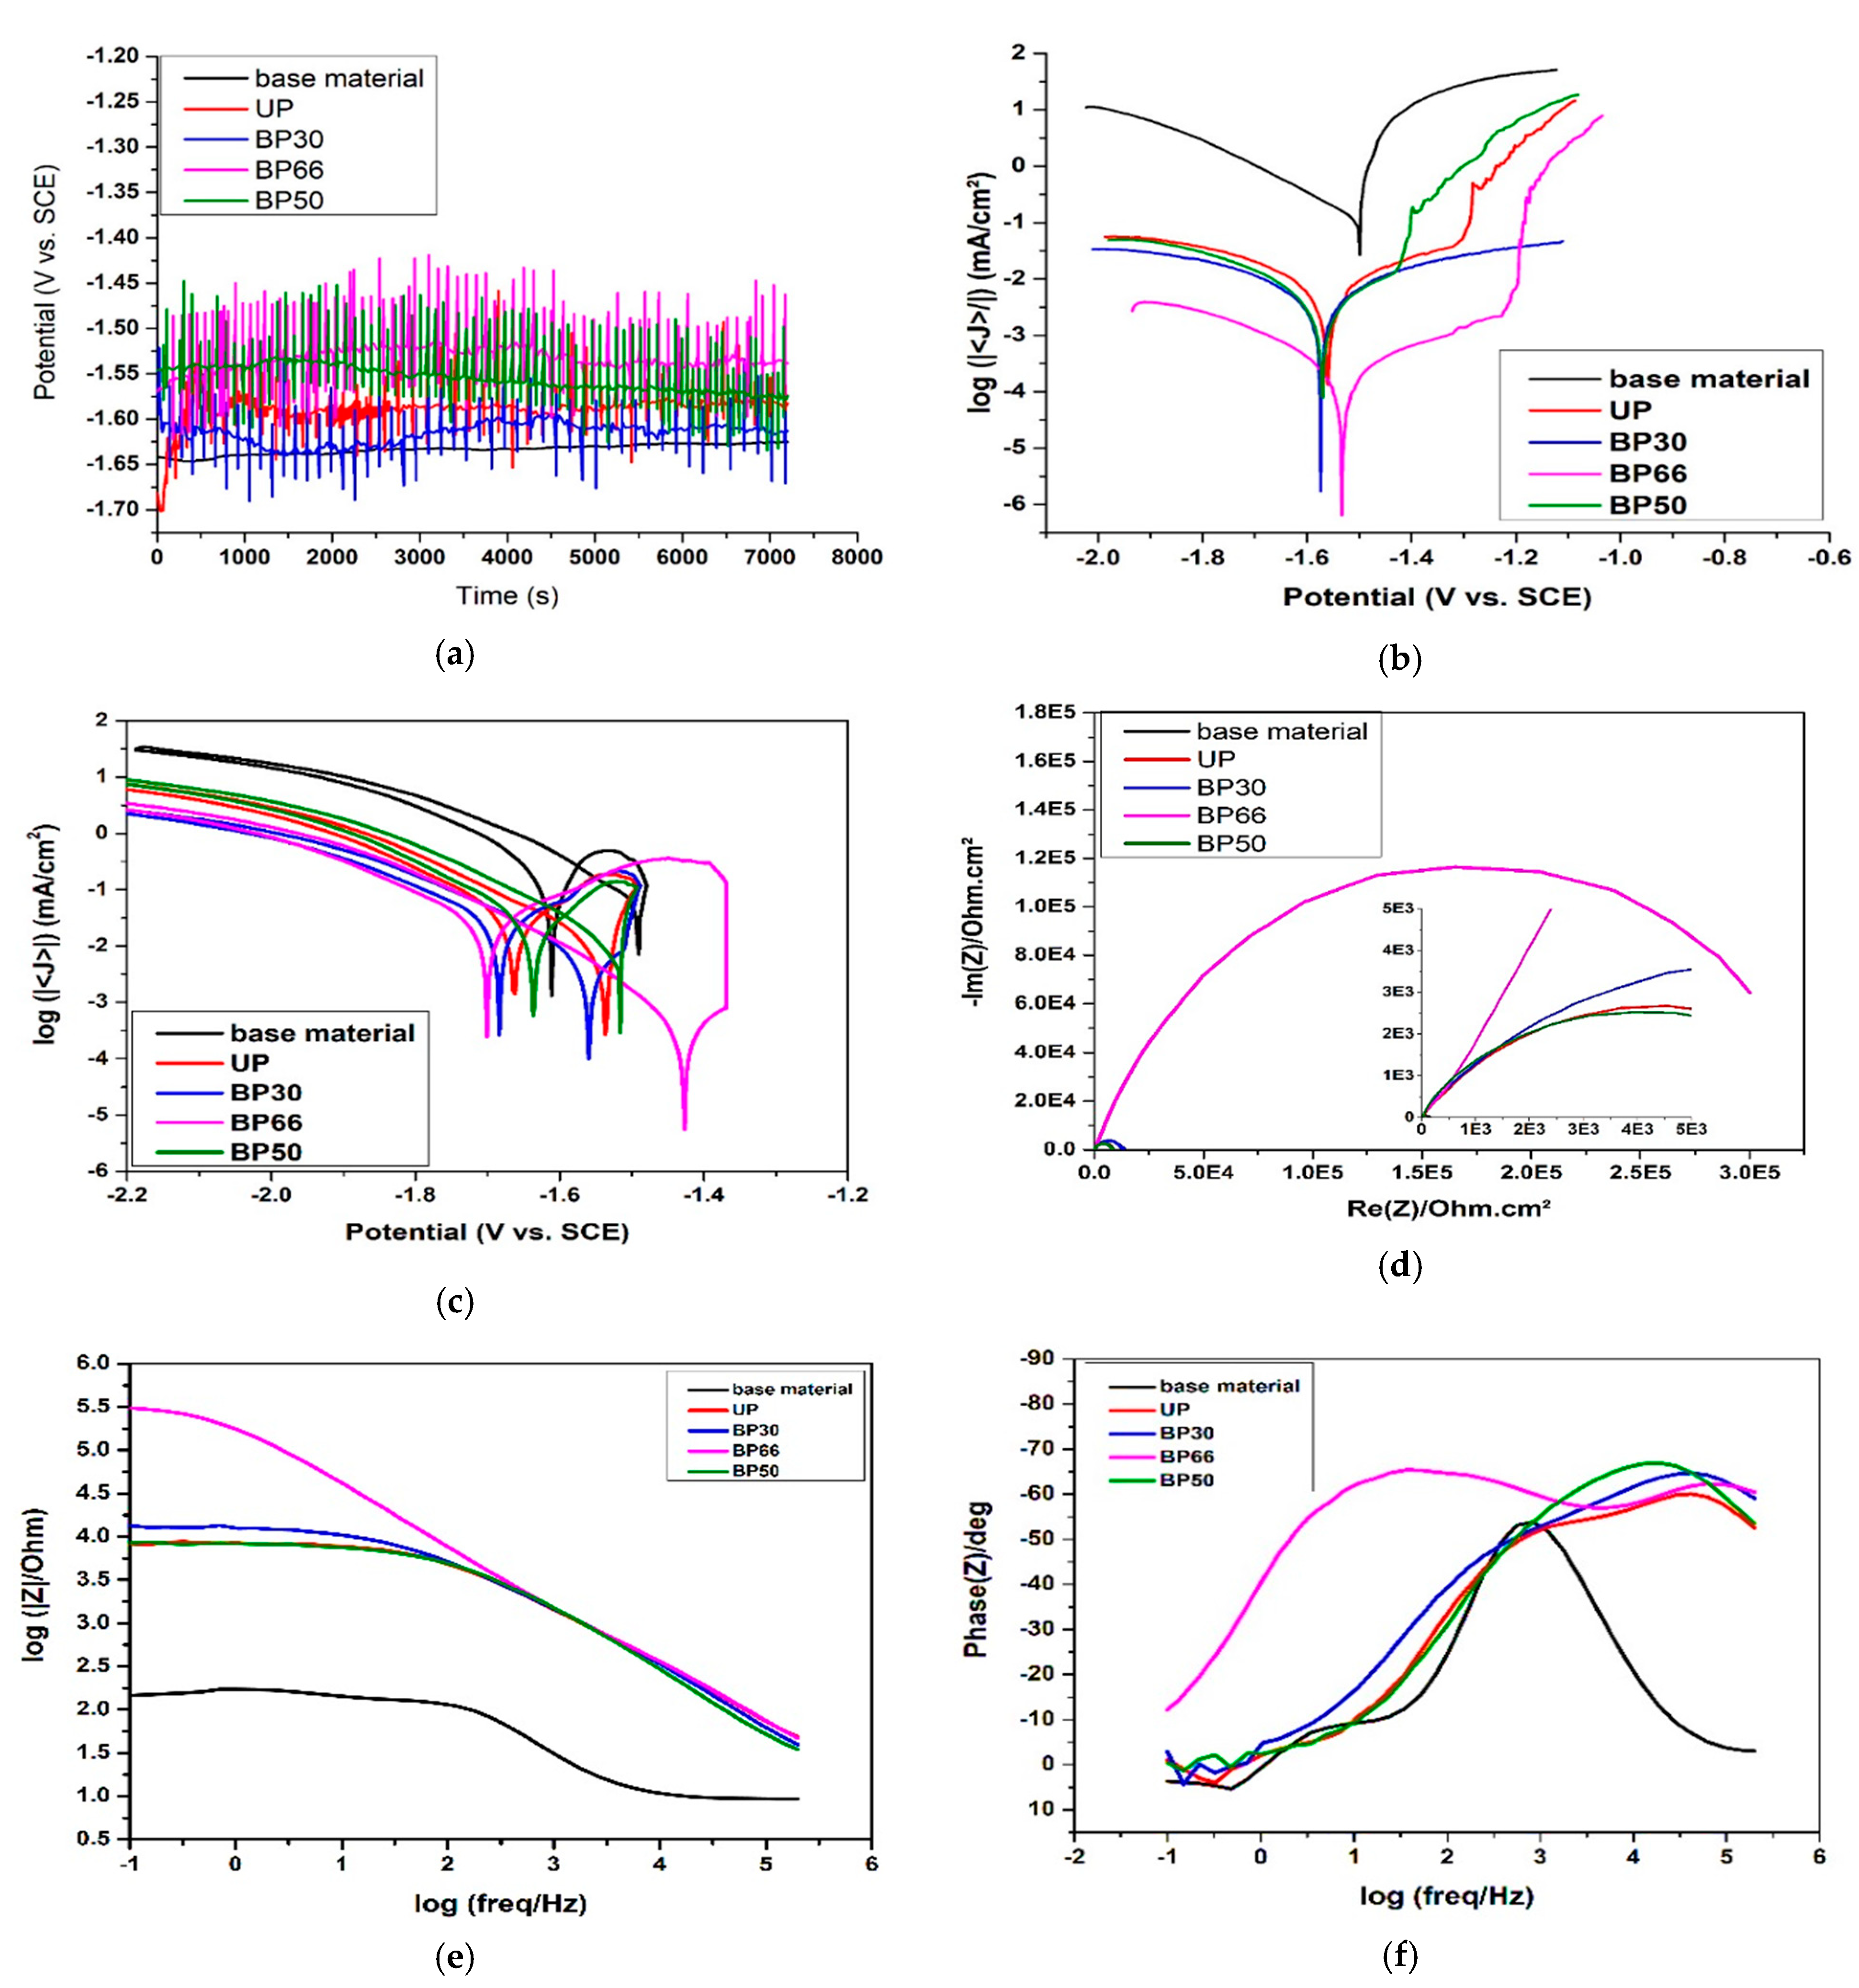
The open circuit potential (OCP) versus immersion time is shown in Figure 8a for AM60 before and after coating. All the AM60 PEO coatings exhibited shifting in potential to the positive direction (i.e., more passive). The AM60-BM did not show any alteration in potential. Additionally, the AM60-BP66 showed the highest fluctuations. Nevertheless, the UP displayed the lowest peaks. The potential fluctuations can be argued as attributable to the porosities of the coating surface.
Potentiodynamic polarization curves are presented in Figure 8b. The figure clearly indicates a significant corrosion-resistance improvement in the of AM60 PEO-coated samples. From Figure 8b, it is clear that the PEO process led to a decrease in the current density (Icorr) for the entire coated sample. It is worth mentioning here that sample BP66 had the lowest Icorr among the coated samples. In addition, the PEO samples at high oxidative potentials displayed a passive range. Table 3 illustrates the extrapolation results of the potentiodynamic curves where bc and ba are the cathodic and anodic Tafel slopes, respectively. The corrosion potentials of all the coated samples were more positive than that of the BM. This indicates that the Icorr of the substrate was reduced significantly for all of the coating conditions. UP, BP30 and PB50 experienced a significant decrease in Icorr by 98%, 99% and 99.3%, respectively, compared to the BM. Furthermore, the PEO-BP66 condition had a lower Icorr value, decreasing from 192 (BM) to 0.11 µAcm−2, which suggests that the coating BP66 had the highest corrosion resistance. The AM60-BP66 sample revealed a wide range of passivation, in agreement with the Bode plot results (Figure 8e). On the other hand, it is clear that the PEO process resulted in a significant decrease in the corrosion rate for all of the coated conditions. The BP66 condition showed the maximum improvement in the corrosion rate, as it decreased by 99.9% compared to the BM.
The cyclic polarization curves inserted in Figure 8c illustrate the ability of the studied alloys to produce a protective oxide layer in 0.5 M NaCl. The results revealed that the current densities of the PEO-coated samples decreased. However, AM60-BM and all of the PEO-coated samples displayed negative re-passivation potential (Erep) and positive hysteresis. That is to say, the electrolyte was diffused into the micropores and prompted localized corrosion due to the duration of immersion.
To analyze the corrosion performance of the PEO coatings in 0.5 M NaCl after reaching the stable free corrosion potential, electrochemical impedance spectroscopy (EIS) was employed on the studied samples. Figure 8d illustrates the Nyquist plots for the AM60 alloy BM and coated samples. The plots in Figure 8d show that it is characteristic of all the AM60 alloys to produce capacitive loop results from both the charge transfer at the metal/electrolyte interface and the capacitance of the surface film, therefore exhibiting the protective nature of the film in agreement with [46]. Furthermore, it is clear that the PEO-coated samples resulted in a significant increase in semicircle diameter, indicating an enhanced corrosion protection of the coated AM60 samples [50]. The inductive loop of the low-frequency sample was not observed, which indicates the PEO process protection from dissolution and the localizing corrosion of the AM60 alloy. The semicircle attitude can be argued as attributable to a charge transfer process, while the inductive loop is attributed to the substrate dissolution at the coating interface. It is worth mentioning here that the BP66 condition displayed a larger semicircle diameter compared to all the coated samples, which indicated the best corrosion resistance, in agreement with the SEM micrographs results after corrosion (Figure 5). Accordingly, these findings are in agreement with the observations reported by [49].
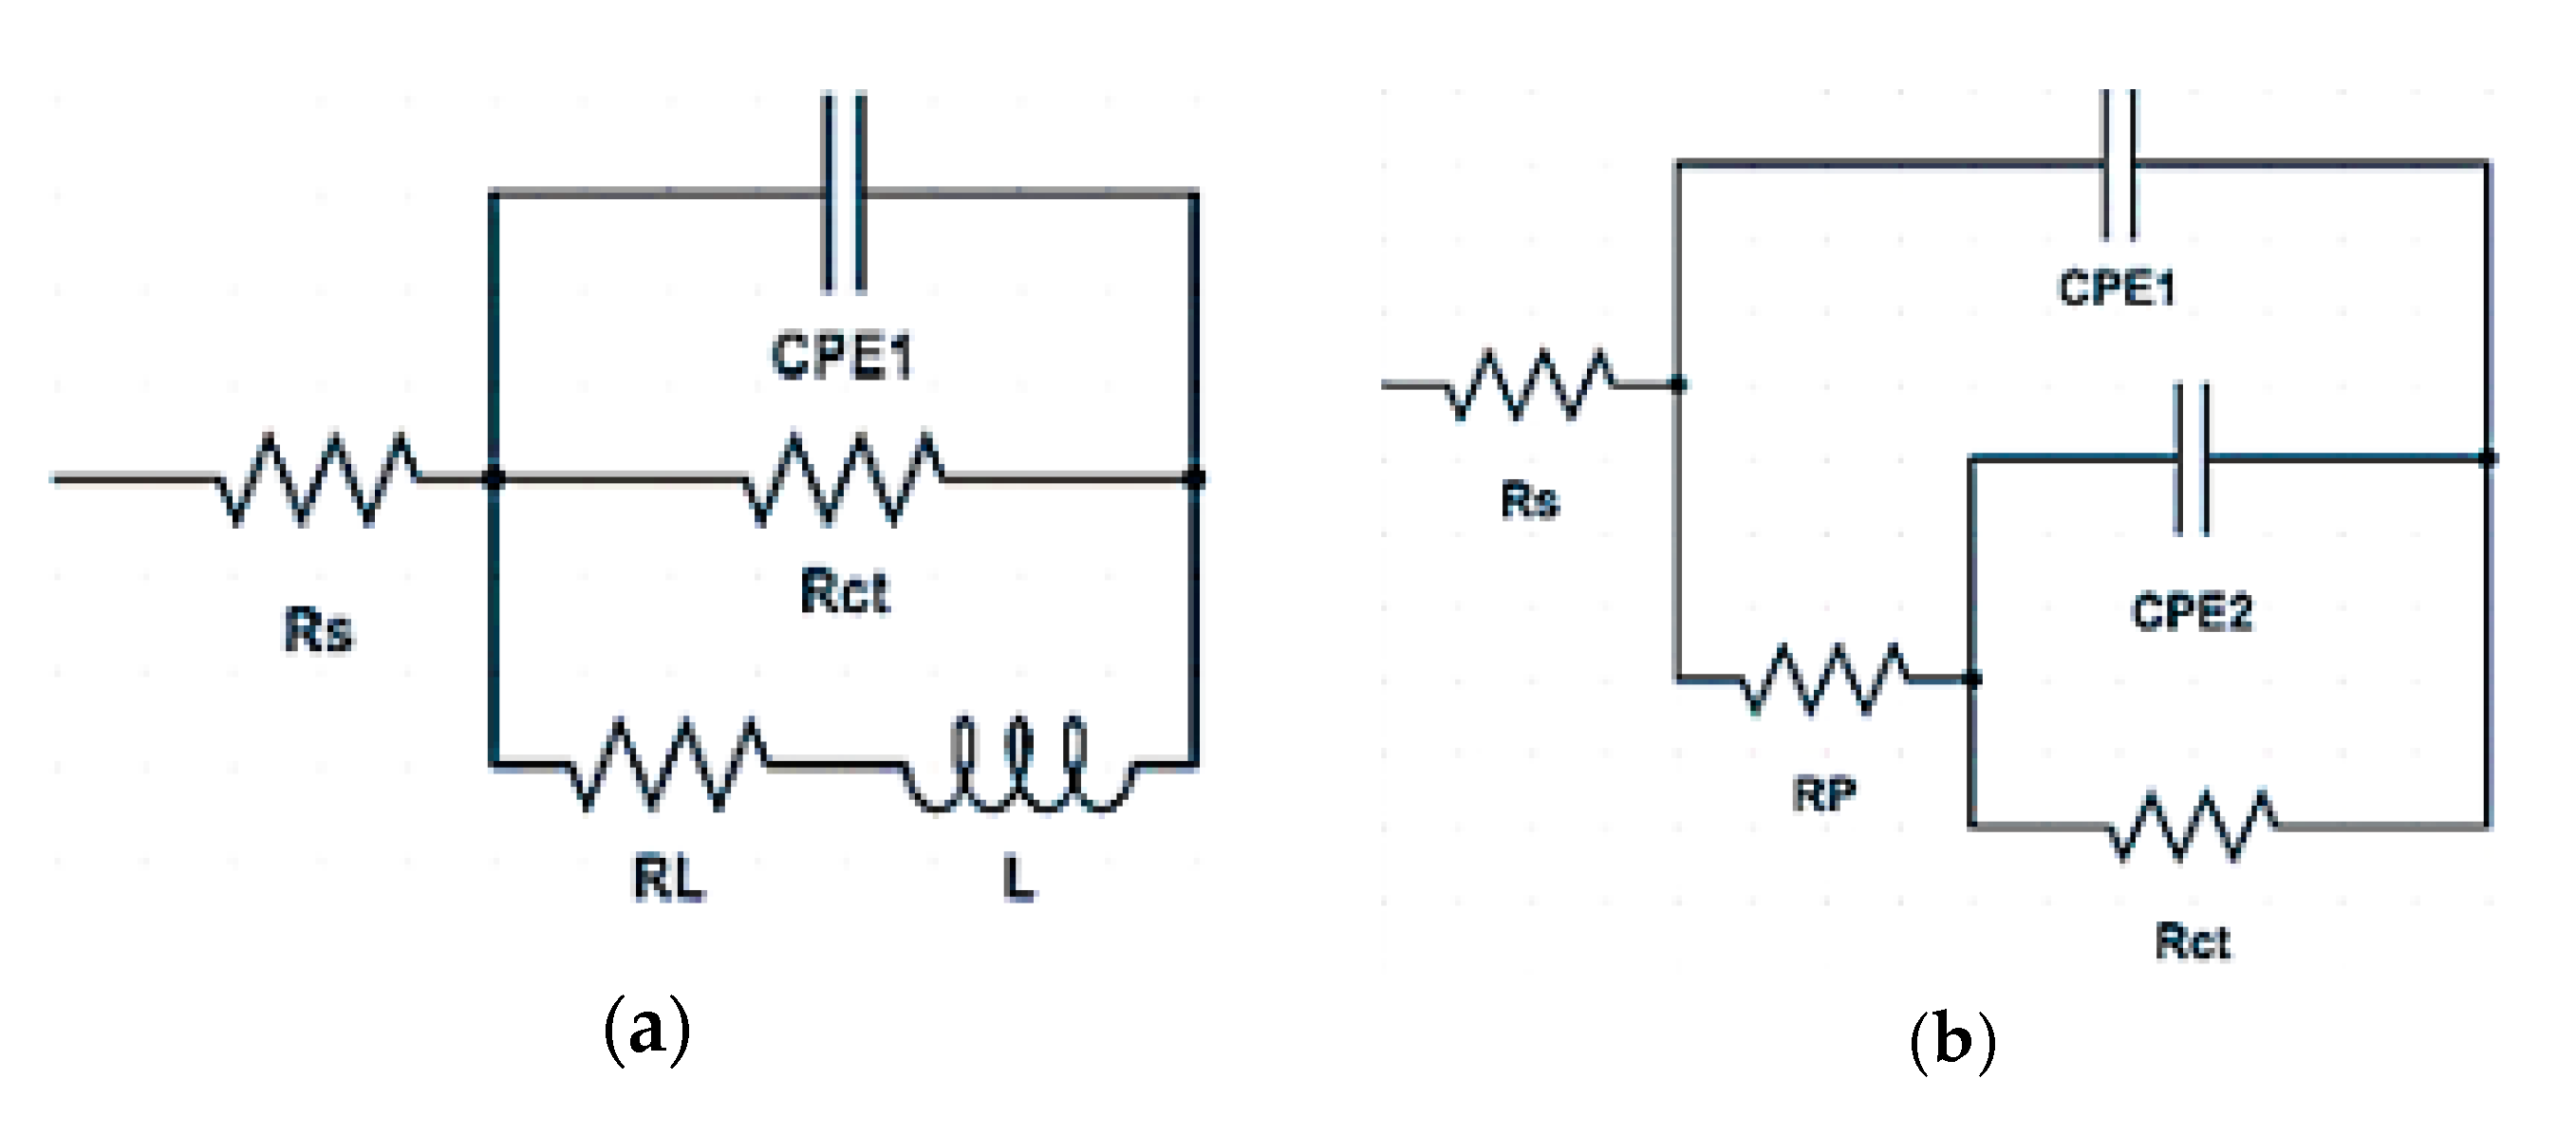
Figure 8e presents the Bode plots of the AM60 samples before and after coating. It is clearly observed that corrosion resistance after PEO treatment was enhanced. At low and medium frequencies, it is clear that the BP66 condition showed the larger impedance magnitude (|Z|) at low and medium frequencies, while BP30 displayed less impedance magnitude than PB30. UP and PB50 conditions experienced the lowest impedance magnitude (Figure 8e). At high frequency, the impedance magnitudes of all the coated samples were too close, despite being almost twice the value of the BM’s impedance, as shown in Figure 8e. Furthermore, Figure 8f displays the phase angle of AM60 after PEO coating. The coated AM60-BP66, the highest frequency, reached approximately −65° indicating better corrosion resistance. Additionally, this sample exhibited higher and wider capacitance, similar to the performance at high and intermediate frequency. It can be argued that the dense coatings, as shown in Figure 2, resulted from applied higher pulsing frequency. Moreover, the corrosion mechanism at the electrode/electrolyte interface of the studied coatings was investigated using the Randomize simplex method and EC labV10.37 software (Version 10.38, Bio-Logic Science Instruments, Seyssinet-Pariset, France). The EIS data for the AM60 base metal and coated samples were fitted using two equivalent circuit models shown in Figure 9 and listed in Table 4.
The equivalent circuit model of the base metal (Figure 9a) contains five elements: constant phase element (CPE1), charge transfer resistance (Rct), solution resistance (Rs), pitting resistance (RL) and inductance (L). The EC model for the PEO-coated AM60 samples (Figure 8b) has two resistances, polarization resistance (Rp) and (Rct), and two constant phase elements (CPE1 and CPE2) and solution resistance (Rs). However, it does not have RL or L. The AM60-BM showed a slight charge resistance and short time constant (approximately 150 s). On the other hand, for the PEO-coated samples at high frequency, the capacitive semicircle was dominated by Rp and CPE1, related to the PEO coating’s outer layer. At low frequency, the Rct and CPE2 represented the inner layer of PEO coatings. Analysis of the equivalent circuits of the coated AM60 sample shown in Table 4 recorded a significantly larger Rct values compared to Rp. Table 4 confirms that the BP66 condition displayed much better corrosion resistance than the BM: Rct had significantly higher values as it improved from 25.3 (BM) to 271,209 Ω. cm2. It is suggested that the corrosion protection was provided mainly by the inner layer. Additionally, the bipolar current mode provided a denser coating and showed a higher polarization resistance, yet had a lower corrosion current density than the unipolar current mode.

3.3. Mechanical Properties

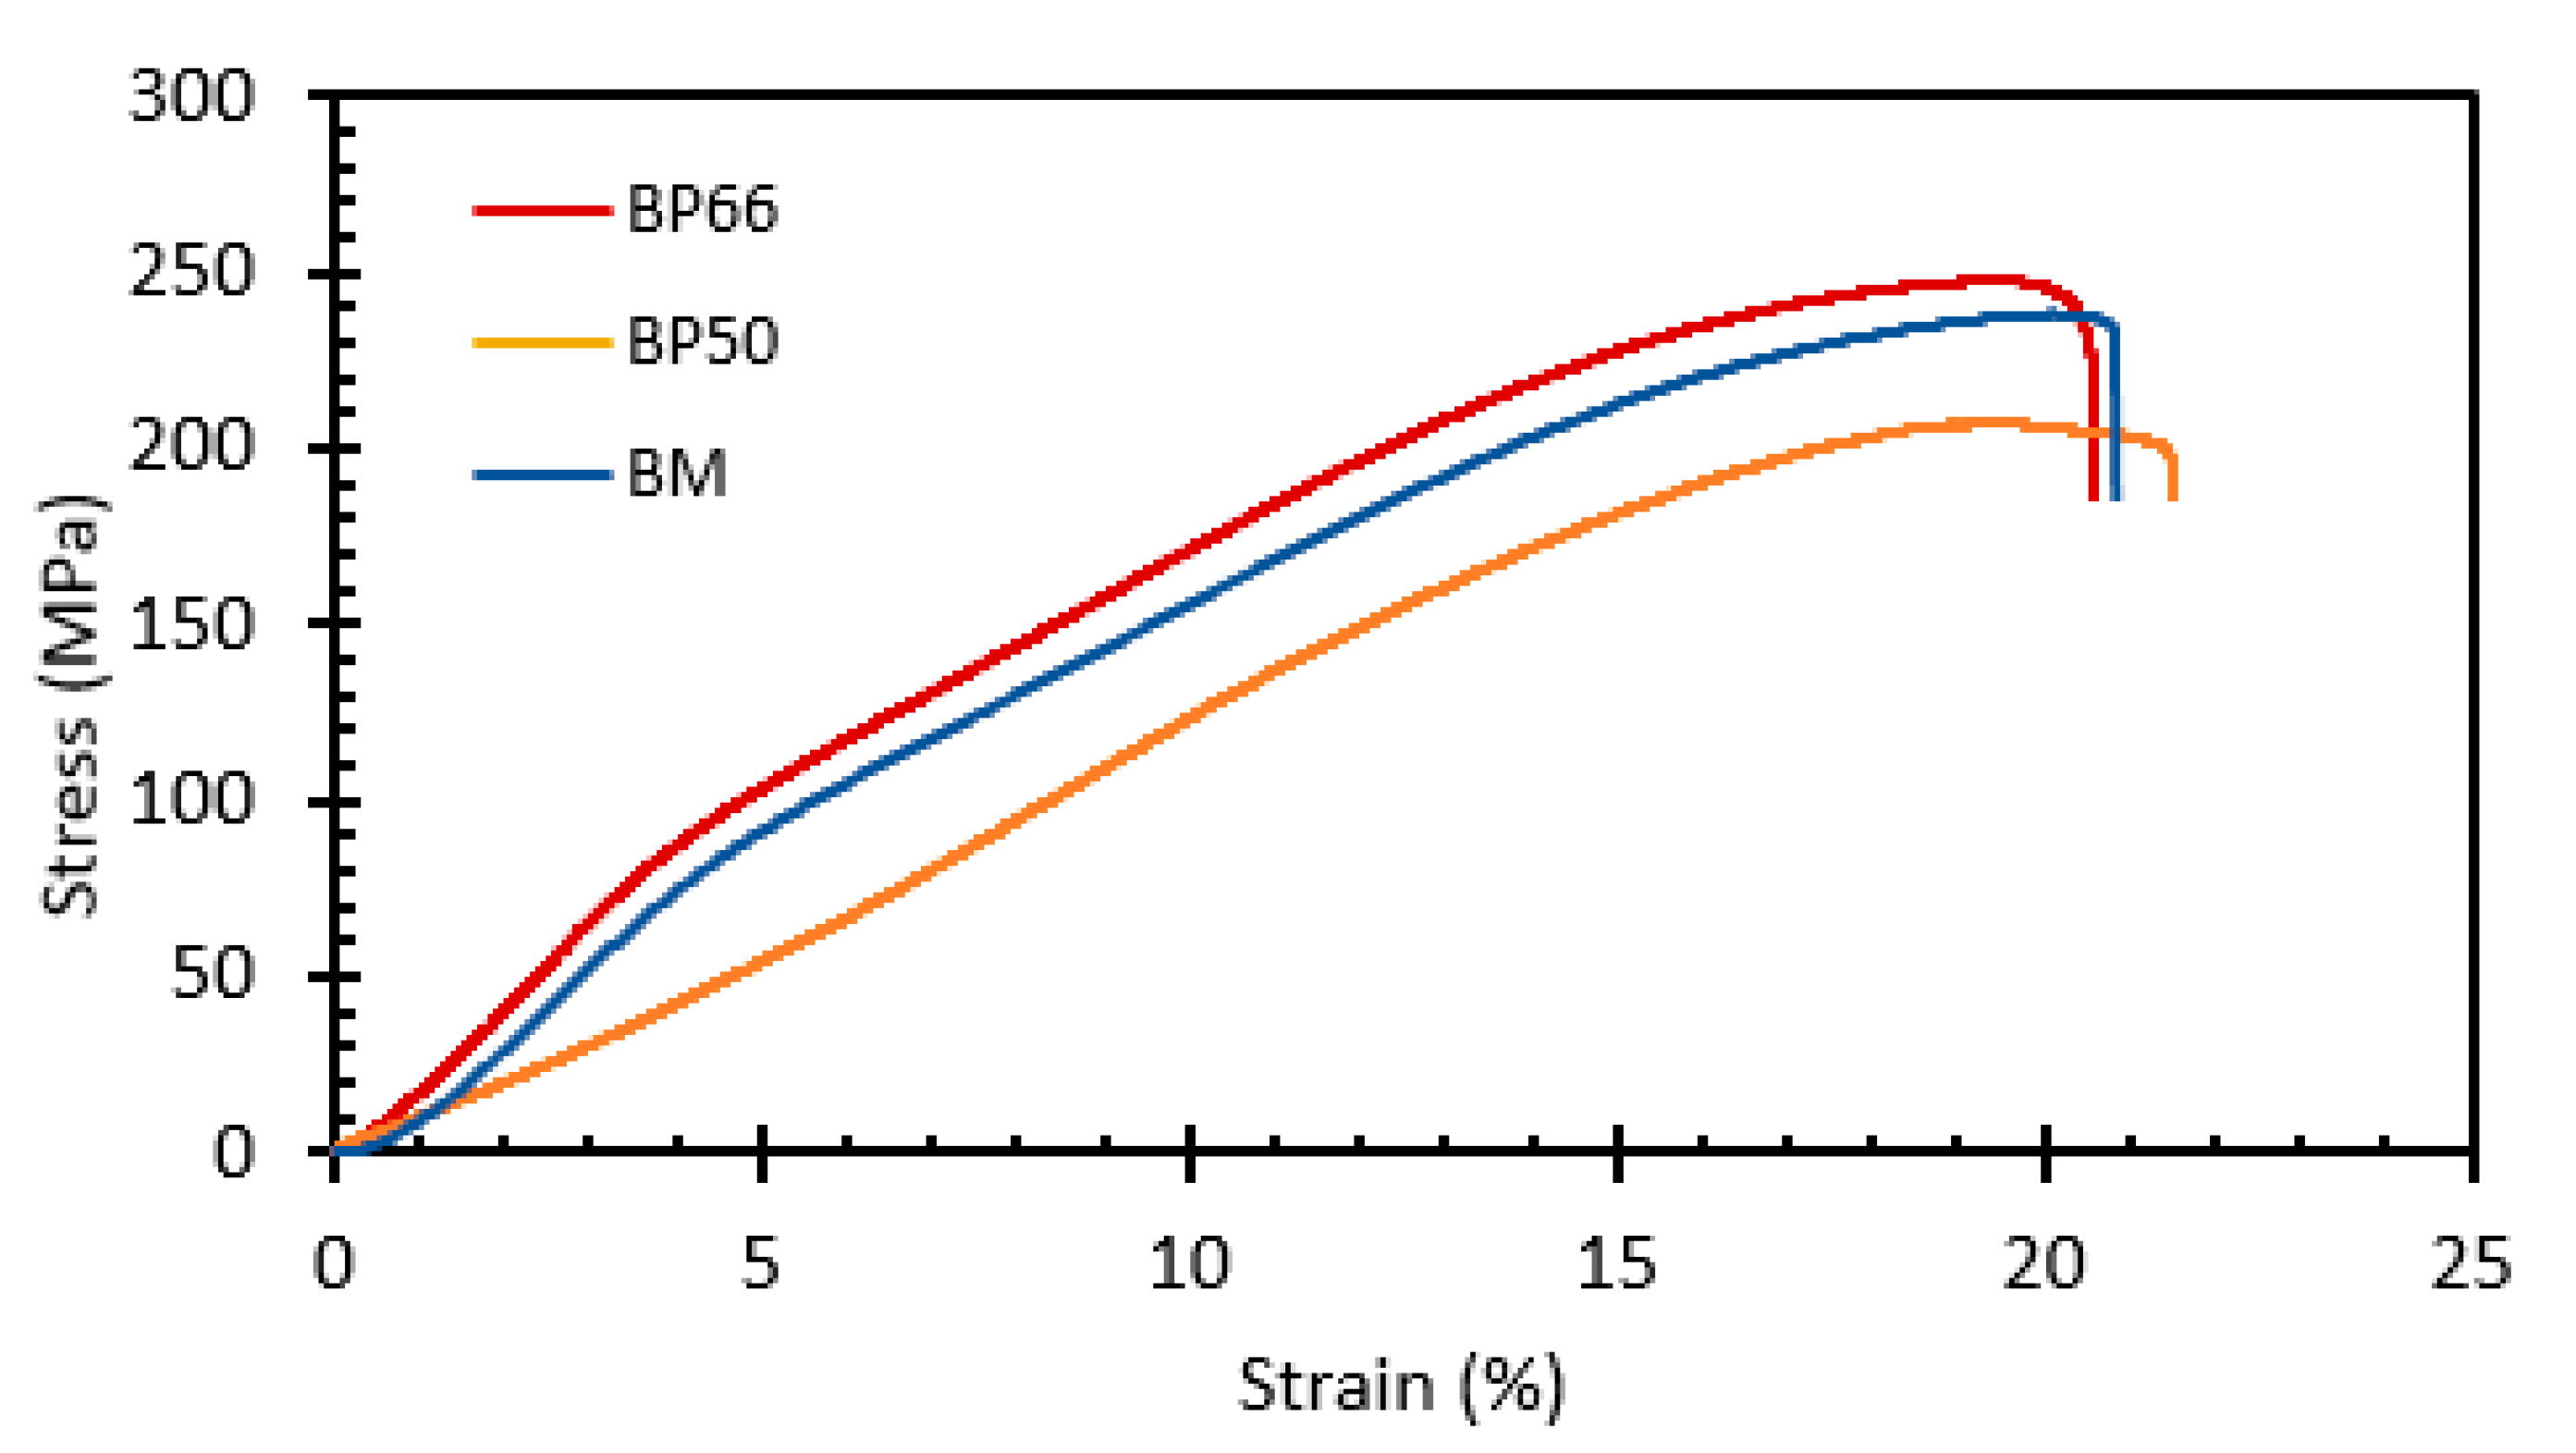
The hardness value of PEO-coated AM60 substrates exhibited higher scattering because of existing micropores on the coating surface. AM60-BP50 and AM60-BP66 coatings revealed the highest hardness. The average Vickers hardness value (HV) of the BM was 28 HV. AM60-BP50 experienced a notable increase in the HV (56 HV). On the other hand, the BP66 condition resulted in increasing the HV by 114% compared to the BM counterpart. This can be attributed to the higher pore density and homogeneously distributed smaller pores. In addition, Figure 10 illustrates the behavior of the BM and coated AM60 samples under compression test. As shown in Figure 10, the coating had an insignificant effect on the compressive strength. This was attributed to small defects of micro/macropores and cracks of the coating. Because of the low density of defects in the coated samples when compared to AM60-BM, slight scatter was introduced, and as a result a minor change in compression strength occurred. Accordingly, the hardness and compression strength findings are in agreement with [53], where it was reported that the adhesion of PEO coatings was affected by the structure, hardness and thickness of the coatings [54]. On the other hand, it was clear that the coating layer was well-adhered to the substrate even after compression fracture and the applied compressive stress did not separate the coating layer from the substrate, as shown in Figure 11.

4. Conclusions

The performance and efficiency of a plasma electrolytic oxidation (PEO)-coated surface are affected by different parameters. In this study, different current modes, frequencies and duty cycles were applied to an AM60 Mg alloy. The microstructural, mechanical and corrosion properties of the PEO-coated substrates using different current modes and frequencies were investigated. The use of a bipolar current mode reduced the pore size and density compared to a unipolar mode, consequently enhancing the corrosion resistance. However, coating using a higher frequency and duty cycle resulted in uniformly distributed smaller pores and a much higher pore density. Therefore, the hardness of the PEO-coated substrates exhibited higher values. The EIS tests in 3.5% wt. % NaCl revealed an improvement in the compactness of the coatings and exhibited better corrosion resistance, as the corrosion rate of AM60 after coating was significantly decreased by 99.9% compared to the BM counterpart. Furthermore, the EIS analysis showed a 1071870% increase in the PB66 charge transfer function compared to the BM counterpart. On the other hand, the average microhardness of the coated AM60 substrate was 114% times higher than the AM60-BM substrate. In addition, the applied current parameters were more than sufficient for the achievement of superior adhesion that was not affected by the applied compressive stress.

Author Contributions

Conceptualization, T.A.A. and A.I.A.; methodology, T.A.A., M.O.A., A.I.A., S.E. and W.H.E.-G.; validation, T.A.A., M.O.A., A.I.A. and W.H.E.-G.; formal analysis, T.A.A., M.O.A., A.I.A., S.E. and W.H.E.-G.; investigation, T.A.A., M.O.A., A.I.A. and W.H.E.-G.; data curation, T.A.A., M.O.A., A.I.A., S.E. and W.H.E.-G.; writing—original draft preparation, S.E. and W.H.E.-G.; writing—review and editing, T.A.A., M.O.A., A.I.A., S.E. and W.H.E.-G.; project administration, T.A.A. and M.O.A. All authors have read and agreed to the published version of the manuscript.

Funding

This research received no external funding.

Institutional Review Board Statement

Not applicable.

Informed Consent Statement

Not applicable.

Data Availability Statement

All the raw data supporting the conclusion of this paper were provided by the authors.

Acknowledgments

Researchers would like to thank the Deanship of Scientific Research, Qassim University, for funding the publication of this project.

Conflicts of Interest

The authors declare no conflict of interest.

References

  1. Witte, F. The History of Biodegradable Magnesium Implants: A Review. Acta Biomater. 2010, 6, 1680–1692. [Google Scholar] [CrossRef]
  2. Amani, S.; Faraji, G. Recrystallization and Mechanical Properties of WE43 Magnesium Alloy Processed via Cyclic Expansion Extrusion. Int. J. Miner. Metall. Mater. 2018, 25, 672–681. [Google Scholar] [CrossRef]
  3. Mostaed, E.; Vedani, M.; Hashempour, M.; Bestetti, M. Influence of ECAP Process on Mechanical and Corrosion Properties of Pure Mg and ZK60 Magnesium Alloy for Biodegradable Stent Applications. Biomatter 2014, 4, 28283. [Google Scholar] [CrossRef] [PubMed] [Green Version]
  4. Mordike, B.L.; Ebert, T. Magnesium: Properties—Applications—Potential. Mater. Sci. Eng. A 2001, 302, 37–45. [Google Scholar] [CrossRef]
  5. Mordike, B.L.; Hehmann, F. Magnesium Alloys and Their Applications. In Proceedings of the International Conference on Magnesium Alloys and Their Applications, Internationale Tagung Magnesium-Magnesiumverbindungen und ihre Anwendungen, Garmisch-Partenkirchen, Germany, 8–10 April 1992; Kainer, K.U., Barry, L.M., Eds.; Wiley-VCH: Weinheim, Germany, 2000. [Google Scholar]
  6. Aune, T.K.; Busk, R.S.; Carnahan, R.D.; Decker, R.F.; Hawke, D.; Hillis, J.E.; King, J.; Lowak, H.; Miller, W.K.; Mordike, B.L.; et al. ASM Specialty Handbook: Magnesium and Magnesium Alloys; ASM International Publishing: Almere, The Netherlands, 1999; pp. 106–118. [Google Scholar]
  7. Gupta, M.; Ling, S.N.M. Magnesium, Magnesium Alloys, and Magnesium Composites; John Wiley & Sons Ltd.: Hoboken, NJ, USA, 2011; pp. 39–85. [Google Scholar]
  8. Kuwahara, H.; Al-Abdullat, Y.; Ohta, M.; Tsutsumi, S.; Ikeuchi, K.; Mazaki, N.; Aizawa, T. Surface Reaction of Magnesium in Hank’s Solutions. Mater. Sci. Forum 2000, 350–351, 349–358. [Google Scholar] [CrossRef]
  9. Kojima, Y. Platform Science and Technology for Advanced Magnesium Alloys. Mater. Sci. Forum 2000, 350–351, 3–18. [Google Scholar] [CrossRef]
  10. Kim, J.J.; Han, D.S. Recent Development and Applications of Magnesium Alloys in the Hyundai and Kia Motors Corporation. Mater. Trans. 2008, 49, 894–897. [Google Scholar] [CrossRef] [Green Version]
  11. Ma, Y.; Zhang, J.; Yang, M. Research on Microstructure and Alloy Phases of AM50 Magnesium Alloy. J. Alloys Compd. 2009, 470, 515–521. [Google Scholar] [CrossRef]
  12. Wang, R.M.; Eliezer, A.; Gutman, E.M. An Investigation on the Microstructure of an AM50 Magnesium Alloy. Mater. Sci. Eng. A 2003, 355, 201–207. [Google Scholar] [CrossRef] [Green Version]
  13. Hu, H.; Zhou, M.; Sun, Z.; Li, N. Tensile Behaviour and Fracture Characteristics of Die Cast Magnesium Alloy AM50. J. Mater. Process. Technol. 2008, 201, 364–368. [Google Scholar] [CrossRef]
  14. Khaleghi, A.A.; Akbaripanah, F.; Sabbaghian, M.; Máthis, K.; Minárik, P.; Veselý, J.; El-Tahawy, M.; Gubicza, J. Influence of High-Pressure Torsion on Microstructure, Hardness and Shear Strength of AM60 Magnesium Alloy. Mater. Sci. Eng. 2021, 799, 140158. [Google Scholar] [CrossRef]
  15. Liu, W.; Cao, F.; Chang, L.; Zhang, Z.; Zhang, J. Effect of Rare Earth Element Ce and La on Corrosion Behavior of AM60 Magnesium Alloy. Corros. Sci. 2009, 51, 1334–1343. [Google Scholar] [CrossRef]
  16. Poinern, G.E.J.; Brundavanam, S.; Fawcett, D. Biomedical Magnesium Alloys: A Review of Material Properties, Surface Modifications and Potential as a Biodegradable Orthopaedic Implant. Am. J. Biomed. Eng. 2012, 2, 218–240. [Google Scholar] [CrossRef] [Green Version]
  17. Bettles, C.; Barnett, M. Advances in Wrought Magnesium Alloys: Fundamentals of Processing, Properties and Applications; ASM International, Woodhead Publishing: Sawston, UK, 2012. [Google Scholar]
  18. Azumi, K.; Elsentriecy, H.H.; Tang, J. Corrosion Prevention of Magnesium Alloys: 12. Plating Techniques to Protect Magnesium (Mg) Alloys from Corrosion; Woodhead Publishing: Sawston, UK, 2013. [Google Scholar]
  19. Sankara Narayanan, T.S.N.; Park, I.S.; Lee, M.H. Strategies to Improve the Corrosion Resistance of Microarc Oxidation (MAO) Coated Magnesium Alloys for Degradable Implants: Prospects and Challenges. Prog. Mater. Sci. 2014, 60, 1–71. [Google Scholar] [CrossRef]
  20. Khaselev, O.; Weiss, D.; Yahalom, J. Structure and Composition of Anodic Films Formed on Binary Mg–Al Alloys in KOH–Aluminate Solutions under Continuous Sparking. Corros. Sci. 2001, 43, 1295–1307. [Google Scholar] [CrossRef]
  21. Birss, V.; Xia, S.; Yue, R.; Richard, G.R., Jr. Characterization of oxide films formed on Mg-based WE43 alloy using AC/DC anodization in silicate solutions. J. Electrochem. Soc. 2003, 151, B1–B10. [Google Scholar] [CrossRef]
  22. Hussein, R.O.; Nie, X.; Northwood, D.O. An Investigation of Ceramic Coating Growth Mechanisms in Plasma Electrolytic Oxidation (PEO) Processing. Electrochim. Acta 2013, 112, 111–119. [Google Scholar] [CrossRef]
  23. Duan, H.; Du, K.; Yan, C.; Wang, F. Electrochemical Corrosion Behavior of Composite Coatings of Sealed MAO Film on Magnesium Alloy AZ91D. Electrochim. Acta 2006, 51, 2898–2908. [Google Scholar] [CrossRef]
  24. Hsiao, H.-Y.; Tsai, W.-T. Effect of Heat Treatment on Anodization and Electrochemical Behavior of AZ91D Magnesium Alloy. J. Mater. Res. 2005, 20, 2763–2771. [Google Scholar] [CrossRef]
  25. Guo, H.-X.; Liu, S.-X. Hydrothermal Synthesis and Crystal Structure of a Novel 1D Molybdenum(V) Phosphate with Mixed-Valence Cobalt Coordination Cations. J. Mol. Struct. 2005, 741, 229–234. [Google Scholar] [CrossRef]
  26. Cai, Q.; Wang, L.; Wei, B.; Liu, Q. Electrochemical Performance of Microarc Oxidation Films Formed on AZ91D Magnesium Alloy in Silicate and Phosphate Electrolytes. Surf. Coat. Technol. 2006, 200, 3727–3733. [Google Scholar] [CrossRef]
  27. Tjiang, F.; Ye, L.-W.; Huang, Y.-J.; Chou, C.-C.; Tsai, D.-S. Effect of Processing Parameters on Soft Regime Behavior of Plasma Electrolytic Oxidation of Magnesium. Ceram. Int. 2017, 43, S567–S572. [Google Scholar] [CrossRef]
  28. Hussein, R.O.; Northwood, D.O.; Nie, X. The Effect of Processing Parameters and Substrate Composition on the Corrosion Resistance of Plasma Electrolytic Oxidation (PEO) Coated Magnesium Alloys. Surf. Coat. Technol. 2013, 237, 357–368. [Google Scholar] [CrossRef]
  29. Arrabal, R.; Pardo, A.; Merino, M.C.; Mohedano, M.; Casajús, P.; Matykina, E.; Skeldon, P.; Thompson, G.E. Corrosion Behaviour of a Magnesium Matrix Composite with a Silicate Plasma Electrolytic Oxidation Coating. Corros. Sci. 2010, 52, 3738–3749. [Google Scholar] [CrossRef]
  30. Arrabal, R.; Matykina, E.; Viejo, F.; Skeldon, P.; Thompson, G.E. Corrosion Resistance of WE43 and AZ91D Magnesium Alloys with Phosphate PEO Coatings. Corros. Sci. 2008, 50, 1744–1752. [Google Scholar] [CrossRef]
  31. Martin, J.; Nominé, A.V.; Stef, J.; Nominé, A.; Zou, J.X.; Henrion, G.; Grosdidier, T. The Influence of Metallurgical State of Substrate on the Efficiency of Plasma Electrolytic Oxidation (PEO) Process on Magnesium Alloy. Mater. Des. 2019, 178, 107859. [Google Scholar] [CrossRef]
  32. Gunduz, K.O.; Oter, Z.C.; Tarakci, M.; Gencer, Y. Plasma Electrolytic Oxidation of Binary Mg-Al and Mg-Zn Alloys. Surf. Coat. Technol. 2017, 323, 72–81. [Google Scholar] [CrossRef]
  33. Wang, L.; Chen, L.; Yan, Z.; Wang, H.; Peng, J. Effect of Potassium Fluoride on Structure and Corrosion Resistance of Plasma Electrolytic Oxidation Films Formed on AZ31 Magnesium Alloy. J. Alloys Compd. 2009, 480, 469–474. [Google Scholar] [CrossRef]
  34. Bala Srinivasan, P.; Liang, J.; Balajeee, R.G.; Blawert, C.; Störmer, M.; Dietzel, W. Effect of Pulse Frequency on the Microstructure, Phase Composition and Corrosion Performance of a Phosphate-Based Plasma Electrolytic Oxidation Coated AM50 Magnesium Alloy. Appl. Surf. Sci. 2010, 256, 3928–3935. [Google Scholar] [CrossRef] [Green Version]
  35. Dehnavi, V.; Luan, B.L.; Shoesmith, D.W.; Liu, X.Y.; Rohani, S. Effect of Duty Cycle and Applied Current Frequency on Plasma Electrolytic Oxidation (PEO) Coating Growth Behavior. Surf. Coat. Technol. 2013, 226, 100–107. [Google Scholar] [CrossRef]
  36. Martin, J.; Nominé, A.; Brochard, F.; Briançon, J.-L.; Noël, C.; Belmonte, T.; Czerwiec, T.; Henrion, G. Delay in Micro-Discharges Appearance during PEO of Al: Evidence of a Mechanism of Charge Accumulation at the Electrolyte/Oxide Interface. Appl. Surf. Sci. 2017, 410, 29–41. [Google Scholar] [CrossRef] [Green Version]
  37. Muhaffel, F.; Cimenoglu, H. Development of Corrosion and Wear Resistant Micro-Arc Oxidation Coating on a Magnesium Alloy. Surf. Coat. Technol. 2019, 357, 822–832. [Google Scholar] [CrossRef]
  38. Zhuang, J.J.; Song, R.G.; Xiang, N.; Xiong, Y.; Hu, Q. Effect of Current Density on Microstructure and Properties of PEO Ceramic Coatings on Magnesium Alloy. Surf. Eng. 2017, 33, 744–752. [Google Scholar] [CrossRef]
  39. Bala Srinivasan, P.; Liang, J.; Blawert, C.; Störmer, M.; Dietzel, W. Effect of Current Density on the Microstructure and Corrosion Behaviour of Plasma Electrolytic Oxidation Treated AM50 Magnesium Alloy. Appl. Surf. Sci. 2009, 255, 4212–4218. [Google Scholar] [CrossRef] [Green Version]
  40. Curran, J.A.; Clyne, T.W. Thermo-Physical Properties of Plasma Electrolytic Oxide Coatings on Aluminium. Surf. Coat. Technol. 2005, 199, 168–176. [Google Scholar] [CrossRef]
  41. Hussein, R.O.; Zhang, P.; Nie, X.; Xia, Y.; Northwood, D.O. The Effect of Current Mode and Discharge Type on the Corrosion Resistance of Plasma Electrolytic Oxidation (PEO) Coated Magnesium Alloy AJ62. Surf. Coat. Technol. 2011, 206, 1990–1997. [Google Scholar] [CrossRef] [Green Version]
  42. Gnedenkov, S.V.; Khrisanfova, O.A.; Zavidnaya, A.G.; Sinebryukhov, S.L.; Egorkin, V.S.; Nistratova, M.V.; Yerokhin, A.; Matthews, A. PEO Coatings Obtained on an Mg–Mn Type Alloy under Unipolar and Bipolar Modes in Silicate-Containing Electrolytes. Surf. Coat. Technol. 2010, 204, 2316–2322. [Google Scholar] [CrossRef]
  43. Cao, F.; Cao, J.; Zhang, Z.; Zhang, J.; Cao, C. Plasma Electrolytic Oxidation of AZ91D Magnesium Alloy with Different Additives and Its Corrosion Behavior. Mater. Corros. 2007, 58, 696–703. [Google Scholar] [CrossRef]
  44. Mingo, B.; Arrabal, R.; Mohedano, M.; Llamazares, Y.; Matykina, E.; Yerokhin, A.; Pardo, A. Influence of Sealing Post-Treatments on the Corrosion Resistance of PEO Coated AZ91 Magnesium Alloy. Appl. Surf. Sci. 2018, 433, 653–667. [Google Scholar] [CrossRef]
  45. Liu, F.; Shan, D.; Song, Y.; Han, E. Formation Process of Composite Plasma Electrolytic Oxidation Coating Containing Zirconium Oxides on AM50 Magnesium Alloy. Trans. Nonferrous Met. Soc. China 2011, 21, 943–948. [Google Scholar] [CrossRef]
  46. Rapheal, G.; Kumar, S.; Scharnagl, N.; Blawert, C. Effect of Current Density on the Microstructure and Corrosion Properties of Plasma Electrolytic Oxidation (PEO) Coatings on AM50 Mg Alloy Produced in an Electrolyte Containing Clay Additives. Surf. Coat. Technol. 2016, 289, 150–164. [Google Scholar] [CrossRef]
  47. Tang, Y.; Zhao, X.; Jiang, K.; Chen, J.; Zuo, Y. The Influences of Duty Cycle on the Bonding Strength of AZ31B Magnesium Alloy by Microarc Oxidation Treatment. Surf. Coat. Technol. 2010, 205, 1789–1792. [Google Scholar] [CrossRef]
  48. Mingo, B.; Guo, Y.; Němcová, A.; Gholinia, A.; Mohedano, M.; Sun, M.; Matthews, A.; Yerokhin, A. Incorporation of Halloysite Nanotubes into Forsterite Surface Layer during Plasma Electrolytic Oxidation of AM50 Mg Alloy. Electrochim. Acta 2019, 299, 772–788. [Google Scholar] [CrossRef] [Green Version]
  49. Zhou, X.; Thompson, G.E.; Skeldon, P.; Wood, G.C.; Shimizu, K.; Habazaki, H. Film Formation and Detachment during Anodizing of Al–Mg Alloys. Corros. Sci. 1999, 41, 1599–1613. [Google Scholar] [CrossRef]
  50. Sarbishei, S.; Sani, M.A.F.; Mohammadi, M.R. Study plasma electrolytic oxidation process and characterization of coatings formed in an alumina nanoparticle suspension. Vacuum 2014, 108, 12–19. [Google Scholar] [CrossRef]
  51. Ezhilselvi, V.; Nithin, J.; Balaraju, J.N.; Subramanian, S. The influence of current density on the morphology and corrosion properties of MAO coatings on AZ31B magnesium alloy. Surf. Coat. Technol. 2016, 288, 221–229. [Google Scholar] [CrossRef]
  52. Lu, X.; Sah, S.P.; Scharnagl, N.; Störmer, M.; Starykevich, M.; Mohedano, M.; Kainer, K.U. Degradation behavior of PEO coating on AM50 magnesium alloy produced from electrolytes with clay particle addition. Surf. Coat. Technol. 2015, 269, 155–169. [Google Scholar] [CrossRef]
  53. Alateyah, A.; Aljohani, T.A.; Alawad, M.O.; El-Hafez, H.A.; Almutairi, A.N.; Alharbi, E.S.; Alhamada, R.; El-Garaihy, B.W.; El-Garaihy, W.H. Improved Corrosion Behavior of AZ31 Alloy through ECAP Processing. Metals 2021, 11, 363. [Google Scholar] [CrossRef]
  54. Yerokhin, A.L.; Leyland, A.; Matthews, A. Kinetic Aspects of Aluminium Titanate Layer Formation on Titanium Alloys by Plasma Electrolytic Oxidation. Appl. Surf. Sci. 2002, 200, 172–184. [Google Scholar] [CrossRef]
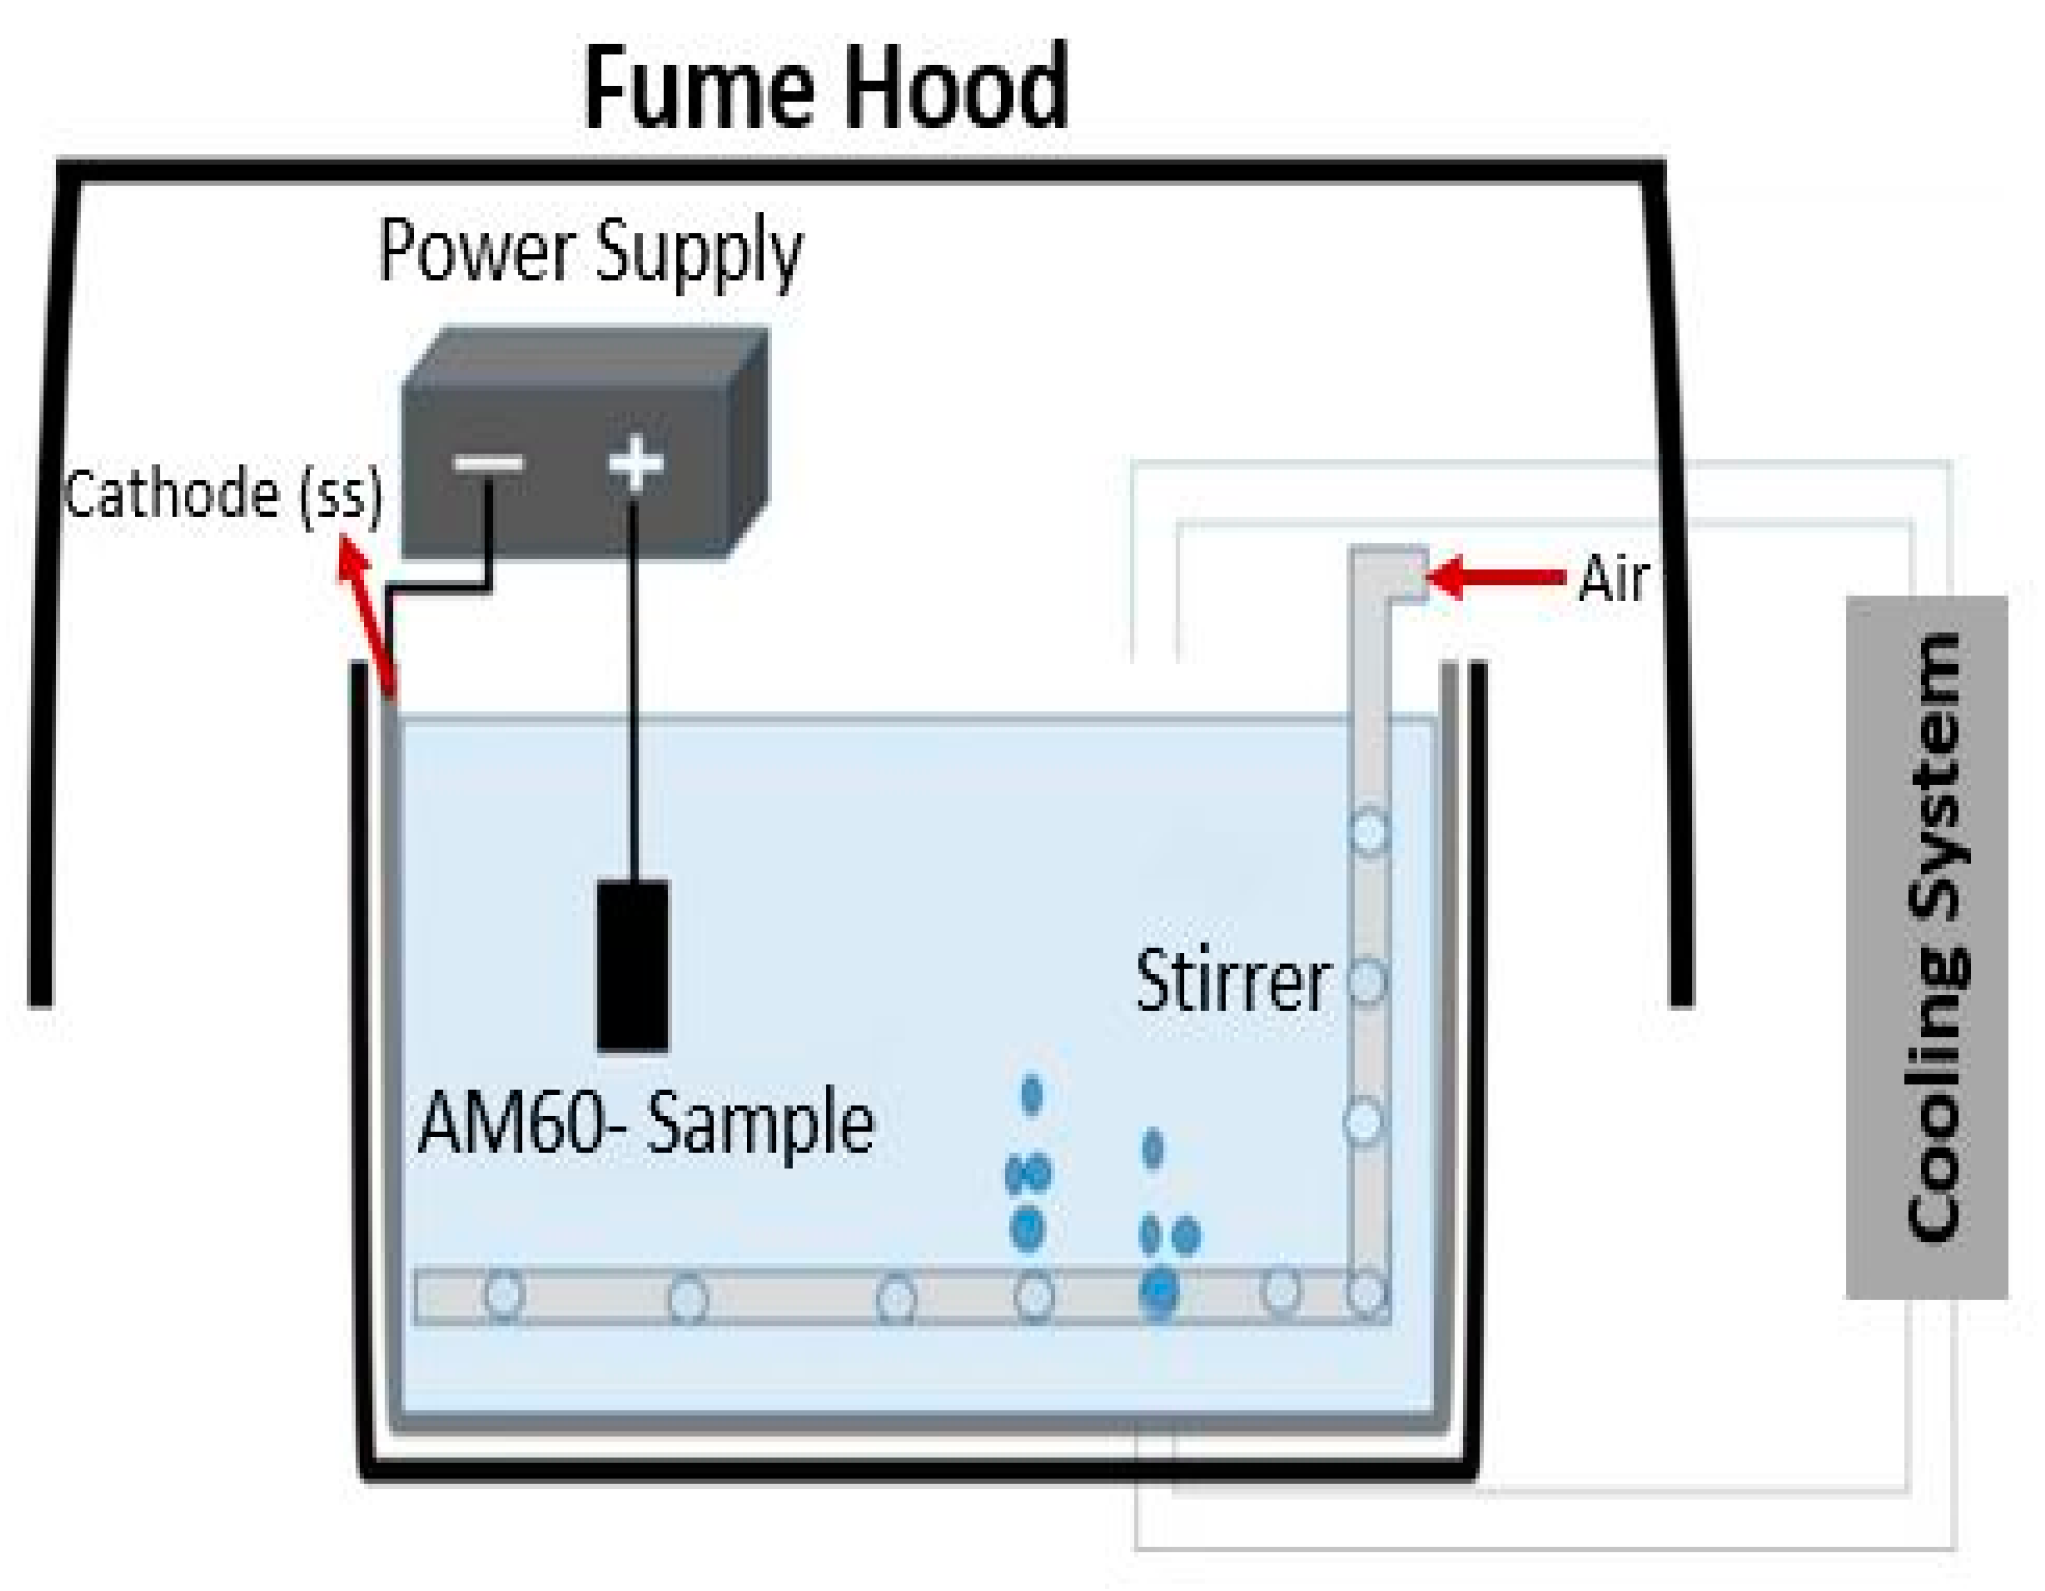
Figure 1. A schematic diagram of the applied PEO process.
Metals 11 00953 g001
Figure 2. SEM micrographs of AM60 alloy subjected to PEO coating at different conditions: (a) BM, (b) UP, (c) BP30, (d) BP50 and (e) BP66.
Metals 11 00953 g002
Figure 3. EDS analysis of the AM60 before and after coating at different conditions: (a) BM, (b) UP, (c) BP30, (d) BP50 and (e) BP66.
Metals 11 00953 g003
Figure 4. XRD patterns of the AM60 substrate before and after coating at different conditions.
Metals 11 00953 g004
Figure 5. SEM micrographs for the AM60 alloy after the corrosion test at low and high magnification: (a) BM, (b) UP, (c) BP30, (d) BP50 and (e) BP66.
Metals 11 00953 g005
Figure 6. SEM images and EDS analysis after corrosion test: (a) BM, (b) UP, (c) BP30, (d) BP50 and (e) BP66.
Metals 11 00953 g006
Figure 7. XRD patterns of the PEO-coated AM60 substrate after the corrosion test.
Metals 11 00953 g007
Figure 8. Corrosion measurement curves of AM60 alloy processed through ECAP: (a) open circuit potential, (b) potentiodynamic polarization curves, (c) cyclic potentiodynamic polarization, (d) Nyquist plot, (e) electrochemical impedance diagrams (Bode plot), and (f) phase angle.
Metals 11 00953 g008
Figure 9. The equivalent circuit models for (a) AM60-BM and (b) PEO-coated samples.
Metals 11 00953 g009
Figure 10. Compression stress–strain curves of AM60 alloy subjected to PEO coating at different conditions.
Metals 11 00953 g010
Figure 11. AM60 fractured sample after the compression test for: (a) BM, (b) BP50.
Metals 11 00953 g011
Table 1. The different applied parameters; frequencies and currents.
Sample DesignationPolarityFrequency (Hz)Off/On (ms)Duty Cycle (%)Anode (mA/cm2)Cathode (mA/cm2)
AM60-UPUnipolar1000 0.7/0.330300
AM60-BP30Bipolar1000 0.7/0.3303010
AM60-BP50Bipolar1000 0.5/0.5503010
AM60-BP66Bipolar1666 0.2/0.466.63010
Table 2. Chemical composition of AM60 at different conditions determined by EDS analysis before and after corrosion (wt.%).
Sample ConditionBefore/After Corrosion
MgSiONaAlMnCaBrCCl
AM60-BM82.5/33.30/01.1/53.50/0.10/1.80.1/00/08.37.9/00/10.9
AM60-UP24.2/36.522.6/043.7/49.37.7/8.61.4/5.10.1/00.1/00/00/00/0.4
AM60-BP3023.8/38.018.5/044.0/51.15.0/4.81.7/6.10.1/00.1/00/06.9/00/0.1
AM60-BP5023.1/35.222.7/043.749.59.0/9.51.2/4.40.1/00.1/00/00/00/1.4
AM60-BP6629.8/38.720.8/043.9/51.03.6/4.11.8/6.20.1/00.1/00/00/00/0.1
Table 3. Electrochemical parameters: corrosion potential (Ecorr), corrosion current density (Icorr), and anodic (ba) and cathodic (bc) slopes obtained from the Tafel extrapolation method.
Conditionβa
(mV·dec−1)
−βc
(mV·dec−1)
Ecorr
(V/SCE)
Icorr
(µAcm−2)
Corrosion Rate mpy
BM51.5198.5−1.527192.085.315
UP79.276.2−1.5622.2270.061
BP 3095.492.7−1.5741.7890.049
BP 5097.283.2−1.5721.3050.036
BP 66107.894.3−1.5320.1110.003
Table 4. EIS fitting results of the studied conditions in 0.5 M NaCl solution.
ConditionRs
(Ω. cm2)
CPE1
(Ω-1. sn. cm−2)
n1Rp
(Ω. cm2)
CPE2
(Ω-1. sn. cm−2)
n2Rct
(Ω. cm2)
BM7.281.7 × 10−50.9100.51.3 × 10−6125.3
UP5.406.6 × 10−70.7815702.5 × 10−60.628695
BP 304.599.3 × 10−70.7527252.0 × 10−60.687427
BP 509.81.5 × 10−70.8929222.3 × 10−60.606634
BP 664.996.5 × 10−70.7610796.1 × 10−70.75271,209
Publisher’s Note: MDPI stays neutral with regard to jurisdictional claims in published maps and institutional affiliations.